Embed Size (px)
Citation preview

AUTHORS: Robert Passey (UNSW, IT Power Australia), Muriel Watt (UNSW, IT Power Australia), Ric Brazzale (Green Energy Markets).
A report for the Centre for Policy Development
Impacts of PV, AC, Other Technologies and Tariffs on Consumer Costs
By
The Australian PV Institute
Nov 2013
September 2011

ii
ACKNOWLEDGEMENTS
We would like to thank Endeavour Energy for providing the load and PV output data, without which this report would not have been possible.
About the Australian PV Institute (APVI)
The objective of the APVI is:
To support the increased development and use of PV via research, analysis and information
The APVI includes companies, government agencies, individuals, university and other research groups with an interest in photovoltaic solar electricity research, technology, manufacturing, systems, policies, programs and projects. In addition to Australian activities, we provide the structure through which Australia participates in the International Energy Agency (IEA) Photovoltaic Power Systems (PVPS) and Solar Heating and Cooling (SHC) program.
Our work is independent, apolitical and of use not only to our members, but also to the general community. Although strongly advocating for PV, we are not a traditional lobby group, but instead focus on data analysis, independent and balanced information and collaborative research, both nationally and internationally.
Our reports, media releases and submissions can be found at: www.apvi.org.au
The results presented are for the purposes of informing stakeholders and the interested public. They are general in nature and subject to a number of underlying assumptions. As such, readers should not take these results as representing financial or investment advice.
COPYRIGHT This report is copyright of the Australian PV Institute. The information contained therein may freely be used but all such use should cite the source as “Passey, R., Watt, M. and Brazzale, R., 2013, ‘Impacts of PV, AC, Other Technologies & Tariffs on Consumer Costs’, by the
Australian PV Institute for the Centre for Policy Development”

iii
Executive Summary Over the last 5 years, residential electricity prices across Australia have increased and residential
electricity use has declined. The price increases are primarily driven by network expenditure, which itself is driven by both the need for capital replacement of ageing assets and the need to augment networks to meet increasing peak demand. Although air conditioners (AC) have been recognised as the primary cause of increases to peak demand, little has been done to reduce their impact.
The decline in electricity use is putting increasing pressure on electricity utility business models, and has generated a range of responses that focus on maintaining utility revenue and current industry structures. Photovoltaics (PV) has become a particular focus of utilities and a number of government reports, with claims that owners of PV systems are not paying their fair share of network costs, thus increasing costs for other customers.
The uptake of any new technology can affect the bills of other customers in two different ways. Firstly, if a customer is on a kWh-based tariff and uses less electricity because of the new technology, they will make smaller payments to the electricity networks, and this may increase the bills for other customers, if tariffs are increased to maintain the same network revenue. PV, solar water heaters (SWH) and a range of energy efficiency options are good examples of technologies that cause this effect. On the other hand, if a customer uses more electricity, the opposite may occur. ACs are a good example in this case.
Secondly, if a customer significantly increases their electricity use at a particular time of day, this can increase the demand peak, and so the networks may need to be augmented to meet that demand, and again, this can increase the bills of other customers. In this case, ACs can increase other customers’ electricity bills, whereas PV, SWHs and other EE options can decrease network peaks and so defer the need for augmentation, thus minimising costs for all customers.
These two counteracting effects complicate the assessment of the real impacts of energy using or producing technologies. We have developed a model that can be used to assess the combined impact of these two effects for a range of technologies – both on the customer responsible for installing that technology, and on other customers. This provides a useful way of assessing possible new tariff structures.
Methodology
The methodology described here is used to assess the financial impacts of the following technologies, assuming an additional 20% of households take them up: AC, PV, PV+battery, SWH and general demand reduction. The impacts on the households that install them, on other households, on transmission network service providers (TNSPs), distribution network service providers (DNSPs) and retailers are assessed.
The impacts of 20% of households taking up the following tariffs are also assessed: EnergyAustralia’s regulated ‘Domestic All Time’ tariff, EnergyAustralia’s PowerSmart Home TOU tariff, and a custom designed residential Demand charge tariff. We have divided their impacts into the following three types.
First order impacts: The initial cost impacts of particular tariffs and technologies on the customers that take them up – the ‘Responsible Customers’.
Second order impacts: The subsequent cost impacts in the following year – for both the ‘Responsible Customers’ and for ‘Other Customers’. These capture the effect of network operators’ altering their tariffs due to changes in revenue. They have been incorporated into the model as follows:

iv
Weighted Average Price Cap (WAPC): Where the assessment is based on DNSPs being regulated under a WAPC,1 only TNSPs can alter their tariffs (because TNSPs are regulated under a revenue cap).
Revenue Cap: Where DNSPs are regulated under a revenue cap, both the TNSPs and DNSPs can alter their tariffs.
Third order impacts: The subsequent cost impacts on all the houses in the model suburb due to changes to demand peaks and therefore changes in network costs. These include the First and Second order impacts above – and so represent the total impact of each option.
The methodology is explained in detail in the main report. Note that the impact of special feed-in tariffs, Renewable Energy Certificates or other customer incentives have not been included in this assessment.
Result Highlights
This section presents only a summary of the results. The main report includes considerably more detail, including the impact of possible customer responses to price signals.
Time of Use tariffs
The first order annual bill financial outcomes for ‘Responsible customers’ taking up the TOU tariff are shown in Table 17. Although the ‘Responsible customers’ total bill increases by about 9.5%, payments to DNSPs actually decrease by about 23%. Payments to TNSPs increase by over 100% and to retailers by about 23%. The second order annual bill financial outcomes for the ‘Other customers’ are also shown in Table 17, where the DNSP is under a revenue cap. The combination of decreased TUOS and increased DUOS increases the total bill by 1.1%.
Table 1. Residential Annual Bill for ‘Responsible customers’ (First order impact) and ‘Other customers’ (Second order impact): TOU compared to Standard tariff
‘Responsible customer’
First Order ‘Other customer’
Second Order
($) % change cf
Standard tariff
($) % change cf
Standard tariff
Transmission 247 104.9% 104 -14.0%
Distribution 557 -22.9% 757 4.9%
Retail 1,098 23.1% 892 0.0%
Total 1,902 9.6% 1,753 1.1%
Air conditioners
Figure 19 is used to illustrate the approach used for all technologies in the main report. It shows the first, second and third order impacts on both the ‘Responsible customer’ and the ‘Other customers’, where the ‘Responsible customer’ is on a Standard tariff, and the DNSP is regulated under a WAPC, as is currently the case in most states. It can be seen that adding an average size AC initially increases the ‘Responsible customers’ average annual bill by 9% or about $155. Because AC
1 DNSPs in Queensland are regulated under a Revenue Cap. Revenue cap regulation will most likely apply to NSW in its next network determination, whereas an average revenue cap will apply to the ACT. It is possible that revenue cap regulation will eventually apply to all DNSPs in the NEM.
v
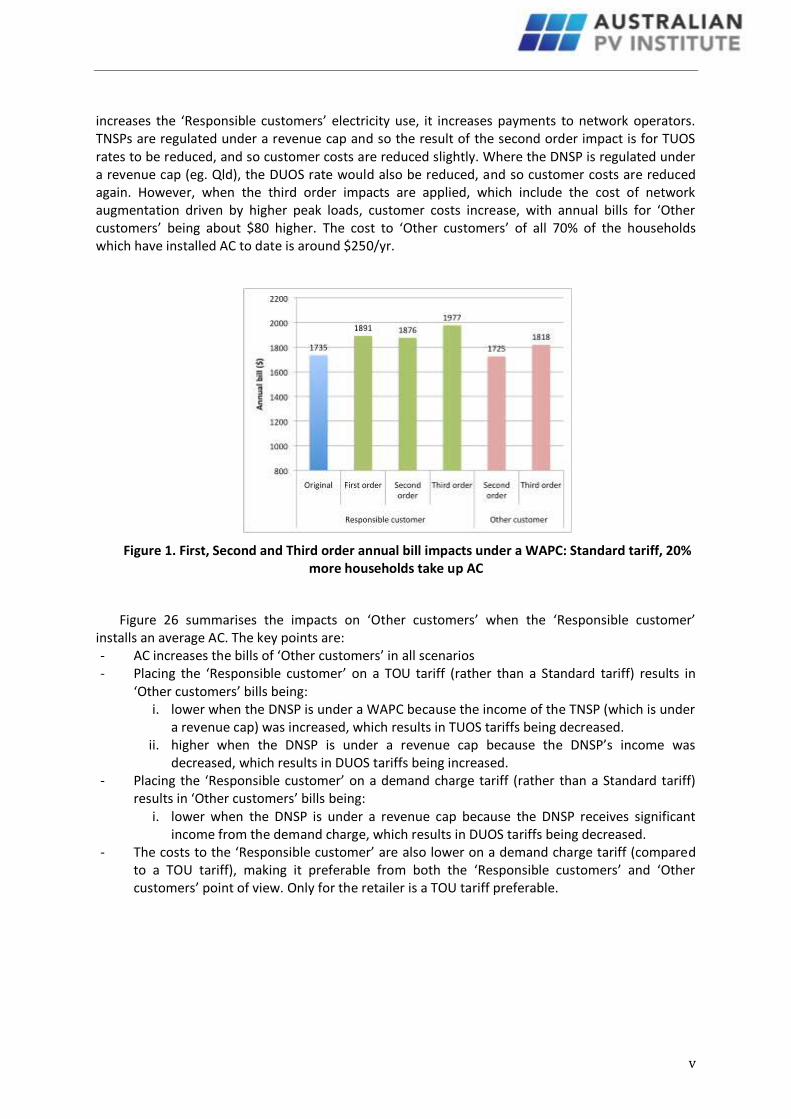
increases the ‘Responsible customers’ electricity use, it increases payments to network operators. TNSPs are regulated under a revenue cap and so the result of the second order impact is for TUOS rates to be reduced, and so customer costs are reduced slightly. Where the DNSP is regulated under a revenue cap (eg. Qld), the DUOS rate would also be reduced, and so customer costs are reduced again. However, when the third order impacts are applied, which include the cost of network augmentation driven by higher peak loads, customer costs increase, with annual bills for ‘Other customers’ being about $80 higher. The cost to ‘Other customers’ of all 70% of the households which have installed AC to date is around $250/yr.
Figure 1. First, Second and Third order annual bill impacts under a WAPC: Standard tariff, 20% more households take up AC
Figure 26 summarises the impacts on ‘Other customers’ when the ‘Responsible customer’ installs an average AC. The key points are: - AC increases the bills of ‘Other customers’ in all scenarios - Placing the ‘Responsible customer’ on a TOU tariff (rather than a Standard tariff) results in
‘Other customers’ bills being: i. lower when the DNSP is under a WAPC because the income of the TNSP (which is under
a revenue cap) was increased, which results in TUOS tariffs being decreased. ii. higher when the DNSP is under a revenue cap because the DNSP’s income was
decreased, which results in DUOS tariffs being increased. - Placing the ‘Responsible customer’ on a demand charge tariff (rather than a Standard tariff)
results in ‘Other customers’ bills being: i. lower when the DNSP is under a revenue cap because the DNSP receives significant
income from the demand charge, which results in DUOS tariffs being decreased. - The costs to the ‘Responsible customer’ are also lower on a demand charge tariff (compared
to a TOU tariff), making it preferable from both the ‘Responsible customers’ and ‘Other customers’ point of view. Only for the retailer is a TOU tariff preferable.

vi
Figure 2. Third order (total) annual bill impacts on ‘Other customers’, by tariff type, where 20% of households install an average AC
AC + Photovoltaics
In order to illustrate the financial impacts of a technology such as PV, which can reduce demand peaks, we have superimposed it on the impact of installing an air conditioning system (which can increase demand peaks). Here we assessed the impact of 20% of households installing both an average sized AC unit and a net-metered 2.5kW PV system.
Figure 27 shows the first, second and third order impacts on both the ‘Responsible customer’ and the ‘Other customers’, where the ‘Responsible customer’ is on a Standard tariff, and the DNSP is regulated under a WAPC, as is currently the case in most states. The main points to note here are that PV reduces the ‘Responsible customers’ bills considerably, and after the third order impacts are taken into account, also reduces the cost impact of AC on ‘Other customers’. This is possible because the bulk of the ‘Responsible customers’ savings are made through reduced payments to the wholesale generator and retailer, whereas savings for the ‘Other customers’ are due to peak demand reduction.
Figure 3. First, Second and Third order annual bill impacts under a WAPC: Standard tariff, 20% households install both AC and 2.5kW PV (semi transparent columns are AC alone)
vii
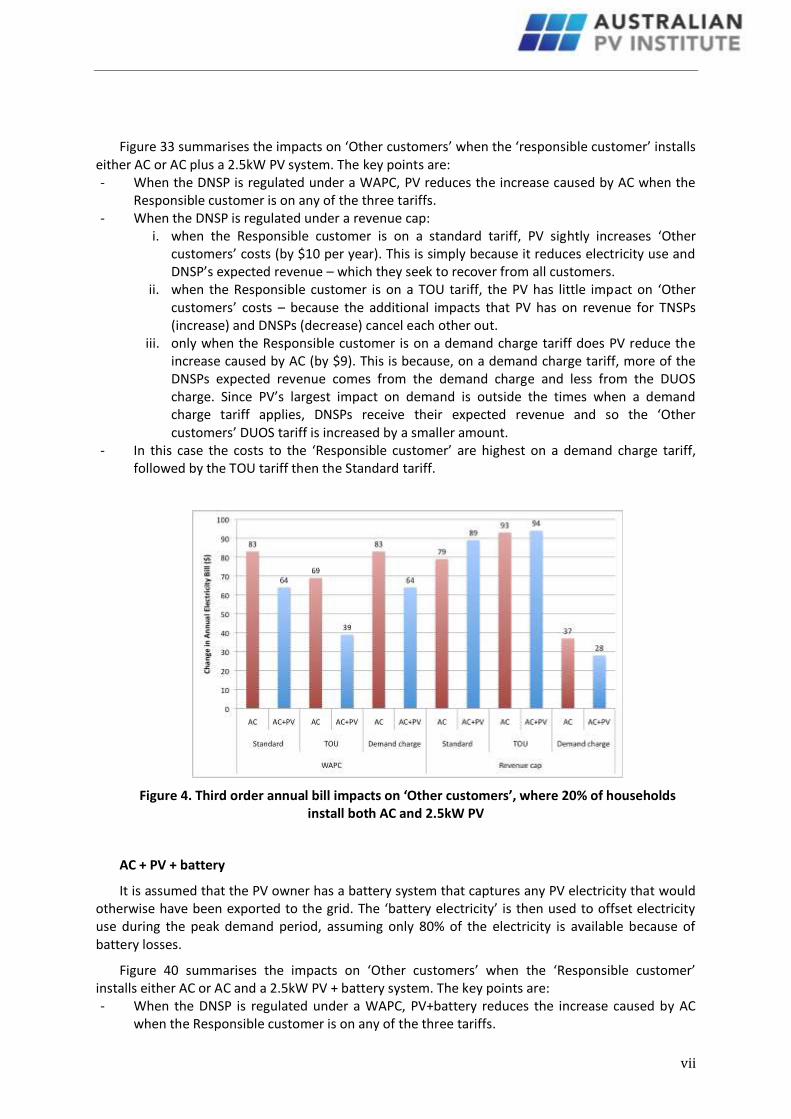
Figure 33 summarises the impacts on ‘Other customers’ when the ‘responsible customer’ installs either AC or AC plus a 2.5kW PV system. The key points are: - When the DNSP is regulated under a WAPC, PV reduces the increase caused by AC when the
Responsible customer is on any of the three tariffs. - When the DNSP is regulated under a revenue cap:
i. when the Responsible customer is on a standard tariff, PV sightly increases ‘Other customers’ costs (by $10 per year). This is simply because it reduces electricity use and DNSP’s expected revenue – which they seek to recover from all customers.
ii. when the Responsible customer is on a TOU tariff, the PV has little impact on ‘Other customers’ costs – because the additional impacts that PV has on revenue for TNSPs (increase) and DNSPs (decrease) cancel each other out.
iii. only when the Responsible customer is on a demand charge tariff does PV reduce the increase caused by AC (by $9). This is because, on a demand charge tariff, more of the DNSPs expected revenue comes from the demand charge and less from the DUOS charge. Since PV’s largest impact on demand is outside the times when a demand charge tariff applies, DNSPs receive their expected revenue and so the ‘Other customers’ DUOS tariff is increased by a smaller amount.
- In this case the costs to the ‘Responsible customer’ are highest on a demand charge tariff, followed by the TOU tariff then the Standard tariff.
Figure 4. Third order annual bill impacts on ‘Other customers’, where 20% of households install both AC and 2.5kW PV
AC + PV + battery
It is assumed that the PV owner has a battery system that captures any PV electricity that would otherwise have been exported to the grid. The ‘battery electricity’ is then used to offset electricity use during the peak demand period, assuming only 80% of the electricity is available because of battery losses.
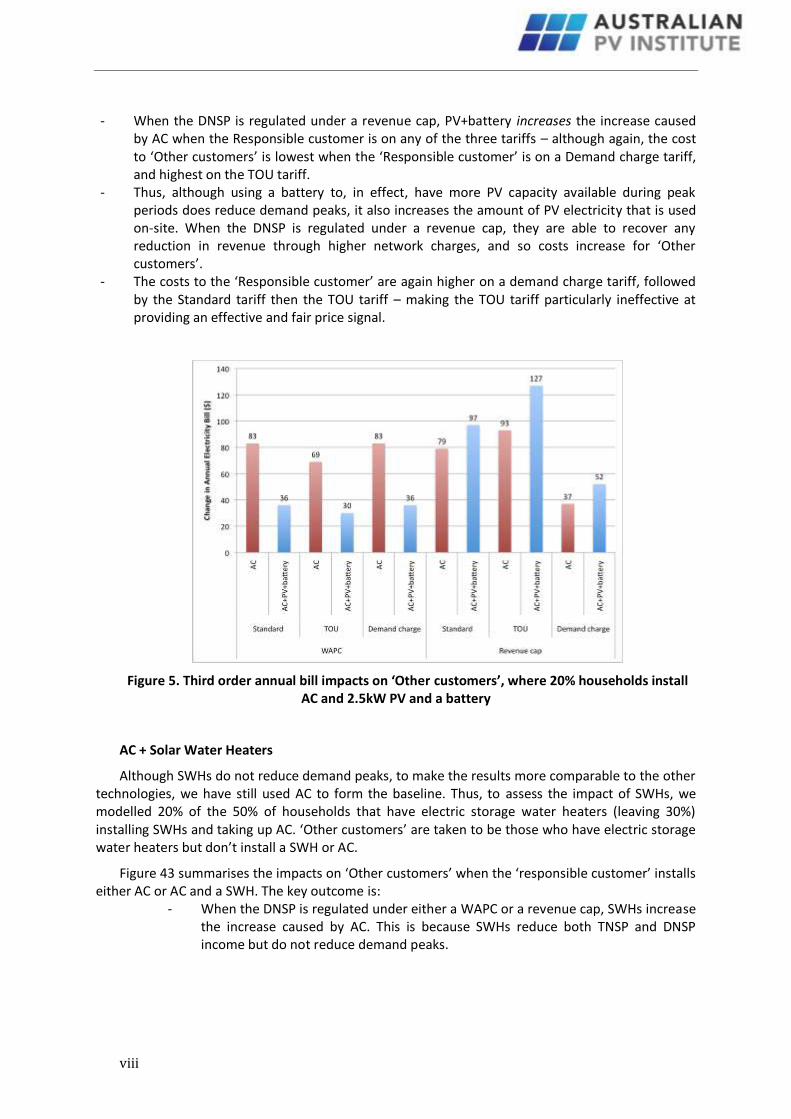
Figure 40 summarises the impacts on ‘Other customers’ when the ‘Responsible customer’ installs either AC or AC and a 2.5kW PV + battery system. The key points are: - When the DNSP is regulated under a WAPC, PV+battery reduces the increase caused by AC
when the Responsible customer is on any of the three tariffs.
viii
- When the DNSP is regulated under a revenue cap, PV+battery increases the increase caused by AC when the Responsible customer is on any of the three tariffs – although again, the cost to ‘Other customers’ is lowest when the ‘Responsible customer’ is on a Demand charge tariff, and highest on the TOU tariff.
- Thus, although using a battery to, in effect, have more PV capacity available during peak periods does reduce demand peaks, it also increases the amount of PV electricity that is used on-site. When the DNSP is regulated under a revenue cap, they are able to recover any reduction in revenue through higher network charges, and so costs increase for ‘Other customers’.
- The costs to the ‘Responsible customer’ are again higher on a demand charge tariff, followed by the Standard tariff then the TOU tariff – making the TOU tariff particularly ineffective at providing an effective and fair price signal.
Figure 5. Third order annual bill impacts on ‘Other customers’, where 20% households install AC and 2.5kW PV and a battery
AC + Solar Water Heaters
Although SWHs do not reduce demand peaks, to make the results more comparable to the other technologies, we have still used AC to form the baseline. Thus, to assess the impact of SWHs, we modelled 20% of the 50% of households that have electric storage water heaters (leaving 30%) installing SWHs and taking up AC. ‘Other customers’ are taken to be those who have electric storage water heaters but don’t install a SWH or AC.
Figure 43 summarises the impacts on ‘Other customers’ when the ‘responsible customer’ installs either AC or AC and a SWH. The key outcome is:
- When the DNSP is regulated under either a WAPC or a revenue cap, SWHs increase the increase caused by AC. This is because SWHs reduce both TNSP and DNSP income but do not reduce demand peaks.

ix
Figure 6. Third order annual bill impacts on ‘Other customers’, where 20% households install both AC and a SWH
AC + 20% Demand Reduction
In this scenario, it is assumed that 20% of customers use a combination of energy efficiency measures to reduce their demand by 20% spread evenly across the day i.e. each half hour period is reduced by 20%. Figure 50 summarises the impacts on ‘Other customers’ when the ‘responsible customer’ installs either AC or combines AC with a 20% demand reduction. The key points are: - When the DNSP is regulated under a WAPC, a 20% demand reduction reduces the increase
caused by AC when the Responsible customer is on any of the three tariffs - When the DNSP is regulated under a revenue cap, a 20% demand reduction increases the
increase caused by AC when the Responsible customer is on any of the three tariffs – although again, the cost to ‘Other customers’ is lowest when the ‘Responsible customer’ is on a Demand charge tariff, and highest on the TOU tariff.
- ‘Other customers’ bills are significantly increased (relative to AC alone) when the Responsible customer is on a Demand tariff because the assumed 20% demand reduction is very effective at reducing their demand charge payment.
- In this case, the costs to the ‘Responsible customer’ are highest on a TOU tariff, followed by the Demand charge tariff then the Standard tariff.
Figure 7. Third order annual bill impacts on ‘Other customers’, where 20% households install AC and undertake a 20% demand reduction

x
Confirmation Using Second Dataset
The following key findings from the analyses above have been confirmed using a different dataset of 270 houses obtained from Ausgrid:
1. That under a TOU tariff, DNSPs receive less income than they would under a Standard tariff 2. That PV reduces the price impact of ACs on ‘Other customers’ under a WAPC 3. That, under revenue cap regulation, placing a ‘Responsible customer’ that has AC on a
Demand charge results in the lowest costs for ‘Other customers’, whereas a TOU tariff results in the highest costs
4. That PV reduces the impact of AC on ‘Other customers’ if the ‘Responsible customer’ is on a Demand charge tariff, under both WAPC and revenue cap regulation.
Discussion
The impact of different technologies installed by ‘Responsible customers’ on the costs faced by ‘Other customers’ is very dependent on whether the DNSP is regulated under a WAPC or a revenue cap. Under a WAPC, where a technology reduces electricity use, the cost is incurred by the DNSP. Under a revenue cap, this cost is passed through to all customers in the form of higher tariffs.
The APVI supports the transition of DNSPs to revenue cap regulation. However, this is only one of the steps needed to enable distributed energy to fully contribute to least-cost energy services. For a fully functional distributed energy market to be established, regulatory changes are required that will result in equal competition between supply and demand side options at all levels: generation, networks and retail. This is likely to require Integrated Resource Planning for network augmentation and replacement, as well as a range of other changes to enable equal competition on a day-to-day basis.
Under both WAPC and revenue cap regulation the installation of ACs increases costs for ‘Other customers’ because of increases to demand peaks and therefore network costs. We estimate AC cross subsidies to be about $250/yr for each customer that does not have AC, excluding possible higher generation costs to meet peaks. Had the merit order effect now evident from PV and wind generation been included in this modelling, the impact of AC on ‘Other customers’ would have been even greater.
Under the TOU tariff used here, the DNSP receives less income than under a Standard tariff, even when AC is installed. Given that ACs are responsible for a significant proportion of distribution network peaks, and TOU tariffs have been proposed to pay for the network costs driven by AC, this is an unexpected outcome.
Under the current WAPC regulation, our research indicates it is likely that PV has been reducing the cost increases for ‘Other customers’ that have been driven by high AC uptake. However, this means that PV has been reducing revenue for DNSPs. Under revenue cap regulation, PV only minimally increases costs for ‘Other customers’ where the ‘Responsible customer’ is on a Standard tariff. Where they are on a TOU tariff, the increase is likely to be insignificant and, when on a demand charge tariff, PV actually reduces costs for ‘Other customers’, without reducing revenue to DNSPs.
PV’s ability to reduce costs is entirely dependent on its ability to reduce demand at the annual peak. In the modelling used here, the peak demand reduction was based on actual customer load data where 20% of the PV’s rated capacity was available during the distribution network peak and 54% was available during the transmission network peak. In some cases PV will be providing less value and in some cases more than the customer base used for this analysis.

xi
The need for PV to provide value to ‘Other customers’ by meeting demand peaks should be minimised as much as possible. This can be readily achieved where the ‘Responsible customer’ is on a Demand charge tariff, simply because in this case PV has little impact on DNSP’s expected income.
When DNSPs are regulated under a revenue cap, the Demand charge tariff results in the lowest costs for ‘Other customers’ for all technologies. Although TOU tariffs result in the lowest costs for ‘Other customers’ for all technologies when DNSPs are regulated under a WAPC, this is only because the DNSPs receive less revenue.
A Demand charge tariff is most effective at reducing the cost impacts of AC and PV because it is capacity based (it provides a price signal to smooth or reduce annual demand peaks), whereas TOU tariffs are volume based (they increase DNSP revenue if demand increases during peak periods, but don’t have a particular emphasis on the annual peak).
Thus, this research recommends a demand charge component be used in electricity bills, rather than the blunt instruments of fixed levies which have been proposed for PV customers. Such fixed charges provide no price signal for people to reduce demand peaks and are discriminatory. Demand charges will provide a more equitable outcome and will also cater for the full range of distributed energy options likely to be available in future, including demand management, energy efficiency, storage and electric vehicles.
The demand charge tariff used here applied the charge across a very broad time period – from 2pm to 8pm, which is the same as the peak period for the TOU tariff. This could result in customers whose peak demand does not coincide with the network peak being penalised. While this would nevertheless serve to minimise customer peak demand generally, targeting a shorter time period could be more efficient. Ideally this time period would be network-specific, although this would also increase administrative costs for network operators. As discussed, the demand charge a DNSP needs to apply to offset the LRMC of meeting the annual peak will be significantly less than the LRMC, and so will be less than the demand charge used in this report.
If demand charges are to be used, it is critical that they are accompanied by an education campaign that lets households know how their bills will be impacted and, most importantly, what options they can use to reduce their demand peaks and therefore their bills.

xii
Contents 1. Introduction .................................................................................................................... 1
1.1. Technologies and Tariffs................................................................................................... 2
2. Methodology .................................................................................................................. 3
2.1. Model development ......................................................................................................... 4
2.1.1. Incorporating the financial flows between stakeholders .......................................... 4
2.1.2. Incorporating the impacts of changed electricity use and demand peaks ................ 7
2.1.3. Incorporating the impacts of the regulatory environment ...................................... 11
2.1.4. Incorporating the cost of changes to peak demand ................................................ 15
3. Modelling Outcomes ..................................................................................................... 17
3.1. Baseline scenario outcomes ........................................................................................... 17
3.1.1. Standard tariff ......................................................................................................... 17
3.1.2. TOU tariff ................................................................................................................. 18
3.1.3. Demand charge ....................................................................................................... 20
3.2. Air conditioners .............................................................................................................. 21
3.2.1. Air conditioners with a Standard tariff .................................................................... 24
3.2.2. Air conditioners with a TOU tariff............................................................................ 27
3.2.3. Air conditioners with a Demand charge tariff ......................................................... 29
3.2.4. AC Summary ............................................................................................................ 31
3.3. AC + Photovoltaics.......................................................................................................... 32
3.3.1. AC + PV with a Standard tariff ................................................................................. 33
3.3.2. AC + PV with a TOU tariff ......................................................................................... 35
3.3.3. AC + PV with a Demand charge tariff ...................................................................... 37
3.3.4. AC + PV Summary .................................................................................................... 39
3.4. AC + PV + battery ........................................................................................................... 40
3.4.1. AC + PV + battery with a Standard tariff .................................................................. 40
3.4.2. AC + PV + battery with a TOU tariff ......................................................................... 42
3.4.3. AC + PV + battery with a Demand charge tariff ....................................................... 44
3.4.4. AC + PV + Battery Summary .................................................................................... 46
3.5. AC + Solar Water Heaters ............................................................................................... 47
3.5.1. AC + SWH Summary ................................................................................................ 51
3.6. AC + 20% demand reduction .......................................................................................... 51
3.6.1. AC + 20% demand reduction with a Standard tariff ................................................ 51
3.6.2. AC + 20% demand reduction with TOU tariff .......................................................... 53

xiii
3.6.3. AC + 20% demand reduction with a Demand charge tariff...................................... 55
3.6.4. AC + 20% Demand reduction Summary ................................................................... 57
3.7. Price responsiveness ...................................................................................................... 58
3.7.1. AC with response to a TOU tariff ............................................................................. 59
3.7.2. AC with response to a demand charge .................................................................... 60
3.8. Comparison of Technology Impacts ............................................................................... 62
3.9. Sensitivity analysis .......................................................................................................... 64
3.9.1. Load data ................................................................................................................. 64
3.9.2. Size of PV system ..................................................................................................... 67
4. Discussion ..................................................................................................................... 69
4.1. The impact of air conditioners ....................................................................................... 69
4.2. Photovoltaics .................................................................................................................. 70
4.3. Other technologies ......................................................................................................... 71
4.4. Demand charges............................................................................................................. 71
5. References .................................................................................................................... 73
6. Appendix A ................................................................................................................... 75
6.1. Air conditioners, Standard tariff ..................................................................................... 75
6.2. Air conditioners, TOU tariff ............................................................................................ 78
6.3. Air conditioners, Demand charge tariff .......................................................................... 80
6.4. AC + PV, Standard tariff .................................................................................................. 83
6.5. AC + PV, TOU tariff ......................................................................................................... 87
6.6. AC + PV, Demand charge tariff ....................................................................................... 90
6.7. AC + PV+battery, Standard tariff .................................................................................... 93
6.8. AC + PV+battery, TOU tariff ............................................................................................ 96
6.9. AC + PV+battery, Demand charge tariff ......................................................................... 99
6.10. AC + Solar Water Heaters ........................................................................................... 102
6.11. AC + Solar Water Heater scenario (but Responsible customer installs AC only) ........ 104
6.12. AC + 20% Demand reduction, Standard tariff............................................................. 107
6.13. AC + 20% Demand reduction, TOU tariff .................................................................... 110
6.14. AC + 20% Demand reduction, Demand charge tariff .................................................. 112
6.15. AC with demand response to a TOU tariff .................................................................. 115
6.16. AC with response to Demand charge tariff ................................................................ 118

1
1. Introduction In Australia, electricity prices have increased nationally by 70% in real terms between 2007 and
2012 (PC, 2013), with residential prices expected to increase further by about 7% per year out to 2014/15 (AEMC, 2013). Network expenditure accounted for 50% of the increase from 2010/11 to 2013/14 (AEMC, 2011), and an expected 81% of the national increase in retail residential electricity prices between 2012/13 and 2014/15 (AEMC, 2013).
These price increases have resulted in a number of government responses, including the Power of Choice Review by the Australian Energy Market Commission (AEMC), and the Senate Select Committee on Electricity Prices. Despite the bulk of the increased network expenditure being attributed to air conditioners (AC), little has been done to reduce their impact, apart from suggestions to move to cost-reflective pricing to reduce demand peaks, with a particular emphasis on time of use (TOU) tariffs (AEMC, 2012; SSCEP, 2012; PC, 2013a).
During the same period, electricity use in Australia has decreased in absolute terms every year since 2008/09, with a total decrease of about 8,300GWh (5.5%) by 2012/13 (AEMO, 2013), with another 1,500 GWh decrease recently estimated for 2013/14 (AEMO, 2013a). Although total electricity use is still assumed to trend upwards in the near future, residential and commercial electricity use per capita is projected to continue to decline – see Figure 8 (AEMO, 2013). This decline is putting increasing pressure on electricity utility business models, and has generated a range of responses that focus on maintaining utility revenue.
Figure 8. Comparison of annual energy forecasts made in 2012 and 2013 for the NEM under three growth scenarios (AEMO, 2013)
Photovoltaics (PV) has become a particular focus of utilities and a number of government reports. The Energy Supply Association of Australia (ESAA) has stated that owners of PV systems are not paying their fair share of network costs because owners use less electricity from the grid (ESAA, 2013). This claim has also been made by the Queensland Competition Authority, which suggested

2
that owners of PV systems should have to pay higher fixed connection charges than other electricity users (QCA, 2013).
Thus, there is a tension between increasing electricity prices, largely driven by increased use of air conditioning (which increases utility revenue), and decreasing electricity use, driven in part by the higher prices as well as PV, solar water heaters (SWH), and energy efficient technologies (which decrease utility revenue).
1.1. Technologies and Tariffs
AC is owned by about 70% of households (Deloitte, 2012), SWHs by about 7.8% (ABS, 2011; CEC, 2013), and PV has become increasingly popular in recent years, with 2.4GW installed in Australia by end 2012, and 2.3GW of that being installed by 10% of households (APVA, 2013; Noone, 2013).
Except for customers who took up special feed in tariffs when they were offered by various State Governments over the past few years, PV electricity that is exported to the grid is paid a tariff much less than retail tariffs. This, in combination with improved battery technology, has resulted in increased interest in hybrid PV/battery systems – where the PV electricity that would otherwise be exported to the grid can be stored for on-site use. Schemes such as the NSW government’s Energy Savings Scheme2 are also helping to drive uptake of other energy efficiency technologies that reduce electricity demand.
The uptake of any new technology can affect the bills of other customers in two different ways. Firstly, if a customer is on a kWh-based tariff and uses less electricity because of the new technology, they will make smaller payments to the electricity networks, and this may increase the bills for other customers if tariffs are increased to maintain network revenue.3 PV, solar water heaters (SWH) and other energy efficiency options are good examples of technologies that cause this effect. On the other hand, if a customer uses more electricity, the opposite may occur. ACs are good examples in this case.
Secondly, if a customer significantly increases their electricity use at a particular time of day, this can increase the demand peak, and so the networks may need to be augmented to meet that demand, and again, this can increase the bills of other customers. In this case, ACs can increase other customers’ electricity bills, whereas PV, SWHs and other EE options can decrease network peaks and so defer the need for augmentation, thus minimising costs for all customers.
These two counteracting effects complicate the assessment of the real impacts of energy using or producing technologies. We have developed a model that can be used to assess the combined impact of these two effects – both on the customer responsible for installing that technology, and on other customers.
This report aims to help identify and quantify the real impacts of AC, PV, SHWs and EE, and also the impacts of the various tariffs that may be used to help households reduce their demand peaks and so reduce costs imposed on other customers. Thus, it provides information that should be useful to consumers, utilities and policy-makers, so that tariffs and regulatory frameworks can be designed to optimise outcomes for consumers, utilities and society generally.
Section 2 describes the methodology and model in detail, and Section 3 presents the results. Section 4 then discusses the implications of the findings.
2 http://www.ess.nsw.gov.au/Home
3 The extent to which this actually occurs depends on whether the networks are regulated under a Weighted Average Price Cap (WAPC) or a Revenue Cap, and this is discussed in Section 2.1.3.

3
2. Methodology The methodology described here is used to assess the financial impacts of the following
technologies on the households that install them as well as on other households.
1. Air conditioning (AC)
2. Photovoltaics (PV)
3. PV + battery
4. Solar Water Heater (SWH)
5. 20% demand reduction
In order to illustrate the financial impacts of a technology such as PV reducing demand peaks, we have superimposed it on the impact of installing an air conditioning system (which increases demand peaks). This is because more than 70% of households now have installed air conditioners, and this has been the main driver of increasing peak demand. This methodology is discussed in more detail in Section 2.1.4.
The impact of customers taking up particular types of tariffs is also assessed, because this can affect the income received by networks and so may affect the bills paid by other customers. The tariffs assessed here are:
- EnergyAustralia’s regulated ‘Domestic All Time’ tariff
- EnergyAustralia’s PowerSmart Home TOU tariff
- A custom designed residential Demand charge tariff
In addition to quantifying these impacts for customers, we separately quantify them for transmission network service providers (TNSPs), distribution network service providers (DNSPs) and retailers. This helps identify how each technology and tariff affects each stakeholder and so provides guidance regarding how utilities are likely to use particular tariffs to influence the uptake of each technology and the impacts it has on their revenue.
In order to help identify and explain these effects, we have divided their impacts into the following three types.
First order impacts: The initial cost impacts of particular tariffs and technologies on the customers that take them up – the ‘Responsible Customers’. This is discussed in Sections 2.1.1 and 0.
Second order impacts: The subsequent cost impacts in the following year – for both the ‘Responsible Customers’ and for ‘Other Customers’. These capture the effect of network operators altering their tariffs due to changes in revenue.4 As discussed in Section 2.1.3, they have been incorporated into the model as follows:
4 For example, when regulated under a revenue cap, a DNSP can increase its tariffs to recoup income lost because of reduces sales, and vice versa. Although tariffs can be altered in any year up to the next Network Determination, here it is assumed that they are altered in the following year. We assume that the impact of the revenue cap on tariffs is restricted to the same customer class that caused it – in this case residential. In other words, the model simply adjusts the network tariffs in order to preserve the level of network revenue.

4
Weighted Average Price Cap (WAPC): Where the assessment is based on DNSPs being regulated under a WAPC, only TNSPs can alter their tariffs (because TNSPs are regulated under a revenue cap).
Revenue Cap: Where DNSPs are regulated under a revenue cap, both the TNSPs and DNSPs can alter their tariffs.
Third order impacts: The subsequent cost impacts on all the houses in the model suburb due to changes to demand peaks and therefore changes in network costs. These include the First and Second order impacts – and so represent the total impact of each option. This is discussed in Section 2.1.4.
Note that the impact of special feed-in tariffs, Renewable Energy Certificates or other customer incentives have not been included in this assessment.
2.1. Model development
The model’s annual load profile and PV generation are based on separate half hourly data from each of 61 houses for the period 1 July 2009 to 30 June 2010, in Blacktown, Sydney, NSW. The TNSP is Transgrid, the DNSP is assumed to be Ausgrid and the retailer is assumed to be EnergyAustralia who has franchise customers in that area.
2.1.1. Incorporating the financial flows between stakeholders
In order to assess the financial flows in terms of First order, Second order and Third order impacts, it is first necessary to understand how the regulated tariff determines the financial flows from the consumers to the wholesale generators, TNSPs, DNSPs and electricity retailers. This highlights how different tariffs and technologies affect these financial flows – and therefore the cost impacts on these stakeholders.
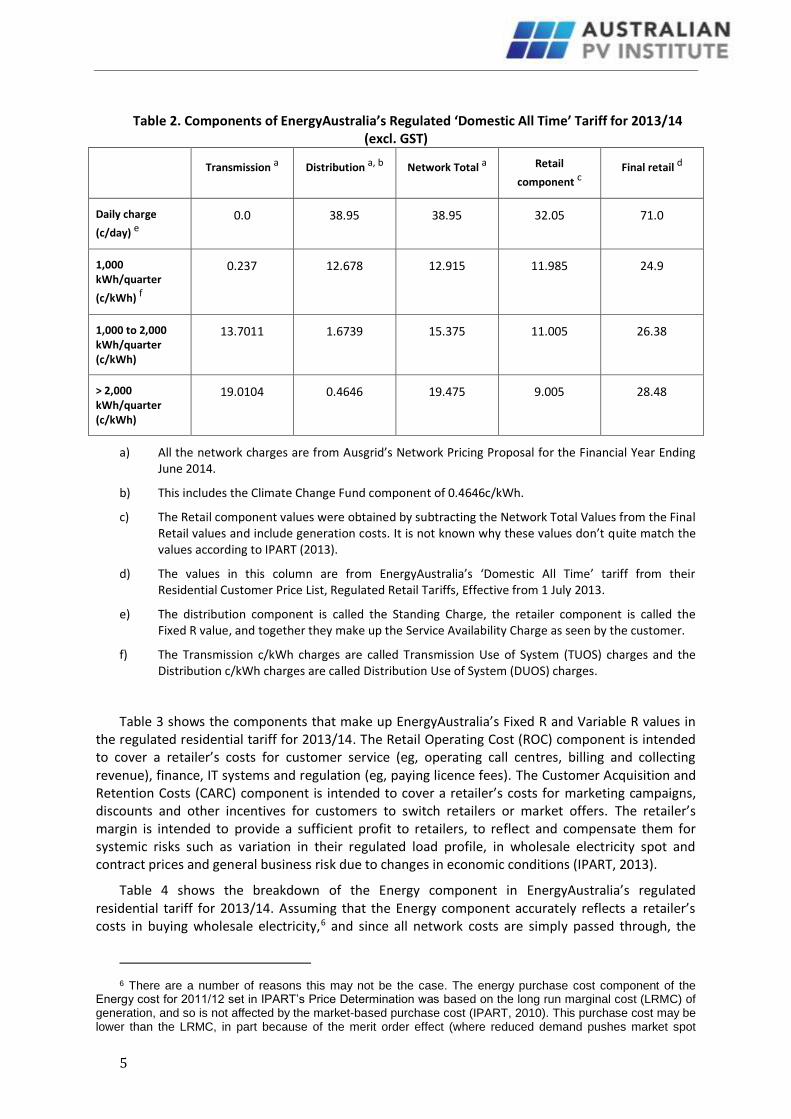
Table 2 presents the components that make up EnergyAustralia’s regulated ‘Domestic All Time’ tariff for 2013/14. All these values exclude GST because the model is run on a GST-exclusive basis (because for the utilities, GST is a cost pass-through), with GST added to the customer outcomes.
The network components are divided into Fixed N and Variable N values, whereas the retail components are divided into Fixed R and Variable R values. The Fixed N and Fixed R values are then combined to make the Service Availability Charge as seen by the customer. The Variable N and Variable R values are combined with the cost pass through allowance5 to make up the Usage Charges (c/kWh) as seen by the customer.
5 The cost pass through mechanism is used to recompense retailers for unanticipated changes in regulation, legislation or taxation.
5
Table 2. Components of EnergyAustralia’s Regulated ‘Domestic All Time’ Tariff for 2013/14 (excl. GST)
Transmission a Distribution a, b Network Total a Retail
component c Final retail d
Daily charge
(c/day) e
0.0 38.95 38.95 32.05 71.0
1,000 kWh/quarter
(c/kWh) f
0.237 12.678 12.915 11.985 24.9
1,000 to 2,000 kWh/quarter (c/kWh)
13.7011 1.6739 15.375 11.005 26.38
> 2,000 kWh/quarter (c/kWh)
19.0104 0.4646 19.475 9.005 28.48
a) All the network charges are from Ausgrid’s Network Pricing Proposal for the Financial Year Ending June 2014.
b) This includes the Climate Change Fund component of 0.4646c/kWh.
c) The Retail component values were obtained by subtracting the Network Total Values from the Final Retail values and include generation costs. It is not known why these values don’t quite match the values according to IPART (2013).
d) The values in this column are from EnergyAustralia’s ‘Domestic All Time’ tariff from their Residential Customer Price List, Regulated Retail Tariffs, Effective from 1 July 2013.
e) The distribution component is called the Standing Charge, the retailer component is called the Fixed R value, and together they make up the Service Availability Charge as seen by the customer.
f) The Transmission c/kWh charges are called Transmission Use of System (TUOS) charges and the Distribution c/kWh charges are called Distribution Use of System (DUOS) charges.
Table 3 shows the components that make up EnergyAustralia’s Fixed R and Variable R values in the regulated residential tariff for 2013/14. The Retail Operating Cost (ROC) component is intended to cover a retailer’s costs for customer service (eg, operating call centres, billing and collecting revenue), finance, IT systems and regulation (eg, paying licence fees). The Customer Acquisition and Retention Costs (CARC) component is intended to cover a retailer’s costs for marketing campaigns, discounts and other incentives for customers to switch retailers or market offers. The retailer’s margin is intended to provide a sufficient profit to retailers, to reflect and compensate them for systemic risks such as variation in their regulated load profile, in wholesale electricity spot and contract prices and general business risk due to changes in economic conditions (IPART, 2013).
Table 4 shows the breakdown of the Energy component in EnergyAustralia’s regulated residential tariff for 2013/14. Assuming that the Energy component accurately reflects a retailer’s costs in buying wholesale electricity,6 and since all network costs are simply passed through, the
6 There are a number of reasons this may not be the case. The energy purchase cost component of the Energy cost for 2011/12 set in IPART’s Price Determination was based on the long run marginal cost (LRMC) of generation, and so is not affected by the market-based purchase cost (IPART, 2010). This purchase cost may be lower than the LRMC, in part because of the merit order effect (where reduced demand pushes market spot

6
revenue recovered per kWh sold is equal to the 25% ROC, their CARC, their margin, and their cost pass through amount. For the 2013/14 regulated tariff, this is equal to the Variable R component (12.52c/kWh from Table 3) minus the Energy component (9.843 c/kWh from Table 4) plus their cost pass through allowance (0.409c/kWh), which leaves 3.086c/kWh (IPART, 2013).
Table 3. Components of EnergyAustralia’s Fixed and Variable R Components for 2013/14 (excl. GST)
Component Explanation
Fixed R 75% of ROC
Variable R (12.52c/kWh)
Energy component
25% of ROC
CARC
Retailer’s margin (5.7% in 2013/14)
Table 4. Components of EnergyAustralia’s Regulated Energy Component for 2013/14 (excl. GST)
Component c/kWh
Energy purchase cost allowance 7.988
LRET 0.508
SRES 0.460
ESS 0.184
NEM fees and ancillary services 0.104
Energy losses 0.598
Total 9.843
prices down the dispatch order (McConnell, 2013)). In addition, the costs allowed for compliance with the Renewable Energy Target may be too high because they assume a certificate price of $40 when the actual price paid is likely to be less than that. Thus, any reduction in such costs below that assumed in the Price Determination is kept as a windfall gain by the retailer. In the most recent Retailer Determination, which covers the period 1 July 2013 to 30 June 2016, IPART calculated the energy purchase costs to be no lower than the weighted average of the LRMC of generation (75%) and the market-based purchase cost (25%) (IPART, 2013). Thus, in this period, 25% of any reduction in costs should in fact be passed on to customers.

7
2.1.2. Incorporating the impacts of changed electricity use and demand peaks
To assess the financial impacts of different technologies and tariffs, their physical impacts have to be separated into changes in electricity use and changes in demand peaks.7 Using the data provided in the tables above, these physical impacts can then be separated into financial impacts for each stakeholder. These in turn can be separated into impacts on the income that is received by stakeholders through tariffs, and impacts on the costs faced by stakeholders in responding to changes in demand peaks.
The (immediate) income impacts to utilities of a reduction in electricity use are presented in Table 5.8 These impacts are referred to as ‘immediate’ because they do not take into account the impact of the utility being regulated under a revenue cap or a weighted average price cap (WAPC), which can affect these impacts in the following year, and are discussed in Section 2.1.3. Wholesale generators are not shown because the focus here is on the impacts on consumers, and all the wholesale impacts are reflected through the impacts on the retailer’s costs. The immediate income impacts of increases in peak demand are presented in Table 6.9
Table 5. Immediate impacts of reduced electricity use on utility income according to a regulated retail tariff
Stakeholder Impact
TNSP Lose their TUOS income according to the rates in Table 2.
DNSP Lose their DUOS income according to the rates in Table 2. Their standing charges are unaffected.
Retailer Lose the 25% ROC, their CARC and their margin and their cost pass through amount
Table 6. Immediate impacts of increased demand peaks on utility income according to a regulated retail tariff
Stakeholder Impact
TNSP No immediate impact due to increases in peak demand alone since TNSPs do not use Time of Use (TOU) tariffs.
DNSP Only immediate impact on DNSP income if the household in question is on a TOU tariff or a demand charge, and the peak occurs during the period covered by these tariffs.
Retailer Only impact on retailer income if the household in question is on a TOU tariff or a demand charge that includes a retailer component,10 and the peak occurs during the period covered by these tariffs.
7 Of course, increased electricity use during a peak period will increase that peak, however here we separate out electricity use from demand peaks in order to separately characterise the different types of impacts they have on stakeholders.
8 Rather than present the impacts of both reduced and increased electricity use, for simplicity’s sake, only the impacts of reduced electricity use are shown.
9 Again, for simplicity’s sake, only the impacts of increases in peak demand are shown.
10 It is possible that a TOU tariff seen by a customer may have only a DNSP TOU component with no additional retailer component added.

8
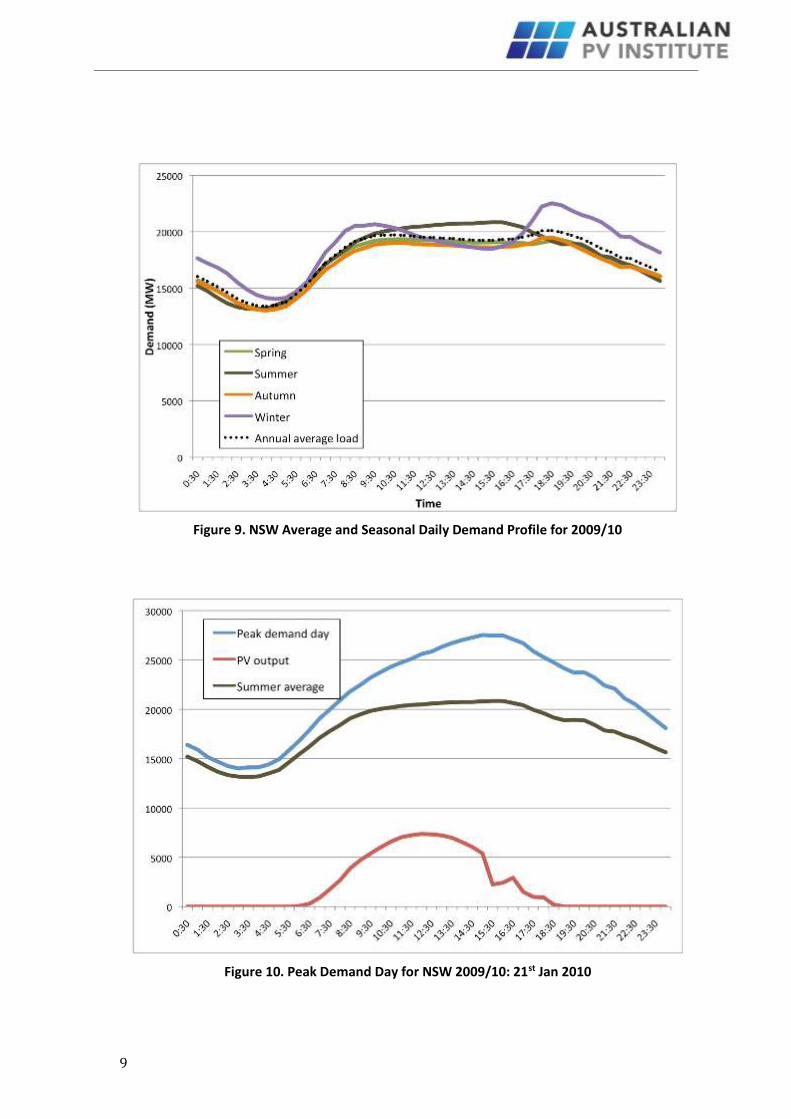
The longer term cost impacts due to increases in demand peaks are presented in Table 7. Of critical importance here is when the demand peak occurs. Networks are built to meet the anticipated annual peak, and so only changes to this peak affect the required size of the network. Transmission networks have a load profile that reflects the aggregated state-wide demand from all users – industrial, commercial and residential. For 2009/10 the NSW average demand profiles for each season and for the year are shown in Figure 9. It is worth noting that although, on average, winter days have a higher peak than summer days, the day with the highest peak demand for 2009/10 was in summer, Fri the 21st Jan 2010 (Figure 10). The PV output has been scaled to make it visible.
Here, to simplify the modelling and assumptions, we have not included the impact of the merit order effect, which is where reduced demand (for example caused by increased uptake of PV) depresses wholesale spot prices and so decreases purchase costs for retailers (McConnell, 2013). Conversely, increased demand (for example, caused by increased uptake of air conditioners) increases spot prices. Up to 2012/13 this effect has not affected the costs seen by customers in NSW because the energy purchase costs set in the Retail Price Determination were based on the higher of the LRMC (of a theoretical system that is built in each year to meet each of the Standard Retailers’ forecast regulated load at minimum cost) and the market-based cost of electricity taking account of both contracting payments and spot price payments. Currently the LRMC is higher, so changes to the market costs affect the retailer’s costs, not the price paid by consumers. However, as of 2013/14, the energy purchase costs are set to be no lower than the weighted average of the LRMC of generation (75%) and the market-based purchase cost (25%) (IPART, 2013). Inclusion of the merit order effect would have resulted in technologies such as air conditioners increasing electricity costs even more, and vice versa for technologies such as PV.
Table 7. Impacts of increased demand peaks on utility costs according to a regulated retail tariff
Stakeholder Impact
TNSP If the increased demand peak occurs during the network-wide peak then the size of the network needs to be increased.
DNSP If the increased demand peak occurs during the local feeder peak then the size of the local network needs to be increased.
Retailer Potentially (depending on hedging arrangements) face increased costs through the merit order effect as demand peaks increase spot prices.
9
Figure 9. NSW Average and Seasonal Daily Demand Profile for 2009/10
Figure 10. Peak Demand Day for NSW 2009/10: 21st Jan 2010

10
The average demand profiles for the hypothetical suburb for each season and for the year are shown in Figure 11. Again, although average winter days have a higher peak than summer days, the day with the highest peak demand was in summer, Tues the 12th Jan 2010 (Figure 12), which indicates the presence of air conditioners in the houses that make up the hypothetical suburb.
Figure 11. Hypothetical Suburb Average and Seasonal Daily Demand Profile for 2009/10
Figure 12. Peak Demand Day for the Hypothetical Suburb 2009/10: Tues 12th Jan 2010

11
2.1.3. Incorporating the impacts of the regulatory environment
The regulatory environment in which TNSPs, DNSPs, and retailers operate adds an additional level of complexity to the process of assessing the impacts of changes to electricity use and demand peaks on their income. This is because the regulatory environment affects whether they or their customers are financially affected by these impacts, as well as when the financial impact occurs.
Currently, all TNSPs in the NEM are regulated by the Australian Energy Regulator (AER) under a Revenue Cap with an ‘overs and unders’ (O&U) process. This basically means that the revenue that a TNSP is allowed to collect in any one year is capped, and the O&U process means that any over (or under) recovery of network costs in a given year must be paid back (or recovered) in the following years (including interest impacts) by adjusting the following year’s revenue cap. The revenue cap may be on a CPI-X basis, meaning, in this case, that the revenue cap must be adjusted each year for inflation (according to the Consumer Price Index) and reduced by any expected efficiency savings (AER, 2013; 2013a). The revenue cap is determined through the AER’s network determination process that also sets the regulated network tariffs.
The DNSPs Energex and Ergon in Queensland are also regulated under a Revenue Cap, whereas DNSPs in NSW are regulated under a WAPC. In March 2013, the AER indicated that Revenue Cap regulation would most likely apply to NSW in its next network determination, whereas an average revenue cap11 would apply to the ACT (although it was likely that the ACT could move to revenue cap regulation in the future) (AER, 2013; 2013a).12 It is possible that Revenue Cap regulation will eventually apply to all DNSPs in the NEM. Thus, we have modeled the impacts of various tariffs and technologies under both a WAPC (to represent the situation up to June 2014) and a revenue cap (to represent the situation from July 2014 onwards for NSW).13
Electricity retailers in NSW are regulated under a Weighted Average Price Cap (WAPC) by the Independent Pricing and Regulatory Tribunal (IPART). This essentially means that as the total amount of electricity sold decreases, total revenue also decreases, and vice versa. The WAPC is set by IPART through a Price Determination process that also determines the regulated retail tariff for three years. The regulated tariffs are fixed for the first year, and those for the second and third years are recommendations only. The latter two are finalised just prior to their introduction in each year after the Regulator reviews the individual cost components of the tariffs to ensure that they recover the efficient cost of supplying small retail customers.
Although the network and retail determinations run for different periods (5 years and 3 years respectively), and may not start at the same time, to simplify the modeling process we assume that they do coincide as per the tables below. These tables illustrate how the various impacts differ from year to year and from determination to determination.
Table 8 summarises the impacts of reduced electricity use on income for utilities and costs for customers assuming the TNSP and the DNSP are under a Revenue Cap. Increased electricity use has the opposite effects.14 The impacts where a DNSP is under a WAPC are the same, except that DNSPs
11 This means that the cap is on the revenue per unit of electricity sold, and so they will be exposed to volume risk, much as they would be under a WAPC.
12 It would apply to all standard control services, which are those distribution services that are central to electricity supply and therefore relied on by most (if not all) customers. Most distribution services are classified as standard control, reflecting the integrated nature of an electricity distribution system. Standard control services include network services, most network augmentations and, in limited circumstances, network extensions. These services encompass construction, maintenance and repair of the network for existing and new customers (AER, 2013).
13 We assume that all the adjustment for going over or under the revenue cap occurs in the following year.
14 Note that increased electricity use could also increase demand peaks, but this effect is captured in Table 9 and Table 10.

12
don’t increase their tariffs to make up for reduced revenue, and vice versa. Where electricity use is reduced, sales are reduced in Year 1 (which is a financial year), and are assumed to stay reduced in subsequent years. Although both TNSPs and DNSPs lose revenue, because they are both on a Revenue Cap with O&Us, they can alter their tariffs to compensate for these losses in both Year 2 and Year 3. Because the retailer is regulated under a WAPC, it loses revenue in all three years. The ‘Responsible Customers’ (the customers who take up the technology) have reduced costs because of lower electricity use, however these are offset to some extent by higher network tariffs in Years 2 and 3. Other customers see no impacts in Year 1 but in later years have increased costs due to higher network tariffs. 15
Table 9 summarises the impacts of increased peaks on income for utilities and costs for customers, again assuming the TNSP and the DNSP are under a Revenue Cap. Decreased peaks have the opposite effects. Where peaks are increased, they are assumed to remain high in Years 2 and 3. The TNSP will not receive any additional income until the next network determination, and this is received on the basis that the required network augmentation increases the TNSP’s regulated asset base, which forms the basis of its revenue cap. The DNSP will also have a higher revenue cap in the next network determination, however it may also receive increased income from Year 1 onwards if the Responsible Customers are on a TOU network tariff. The degree to which it can retain this income will be determined by its revenue cap, and here we assume that it is revenue neutral and so is paid back in Year 2 (to some extent the high TOU rate could also be offset by the low TOU rate in off-peak periods). As for the TNSP, the DNSPs revenue cap will be increased in the next determination because of the network augmentation (all other things being equal).
There is no impact on retailers in Year 1, however, they will receive more income in the next retail determination if the Energy cost component is increased to compensate for higher spot prices assuming market based energy purchase costs are included (note that these peaks may not in fact coincide with periods of peak network use). It is possible this could occur in Year 2 prior to the determination, if IPART considers it reasonable. Note that this increased income will be offset by the increase in wholesale spot prices. The ‘Responsible customers’ face increased costs in Year 1 but only if on a TOU tariff or demand charge. Their costs in Year 2 are again higher, with those in the next determination being even higher because of higher TUOS and DUOS tariffs and a higher energy cost component. ‘Other customers’ are relatively unaffected until the next determinations, at which time they increase because of higher TUOS and DUOS tariffs and a higher energy cost component.
Table 10 summarises the impacts of increased peaks on costs for each utility. Decreased peaks have the opposite effects. The costs and savings for customers have already been captured in Table 8 and Table 9. A necessary assumption here is that an increased demand peak in Year 1 results in a network augmentation cost in Year 2. In reality, network augmentations are much ‘lumpier’ than this, with peak demand gradually increasing each year, then the network being augmented, and then peak demand increasing for a number of years until the next augmentation is required. However, network augmentation costs are commonly presented as a cost per year, meaning that the ‘lumpy’ network augmentation cycle has been smoothed into an annual cost (Deloitte, 2012; PC, 2013a).
15 Note that we assume that the changes to electricity use and peaks were not anticipated in the network and retailer determinations, and so, for example, electricity use that is lower than expected will result in network revenue being lower than expected and so tariffs will be increased to compensate. If this change had been anticipated in the determination then the tariffs would already be higher.

13
Table 8. How utility income and customer costs are affected by the regulatory environment, TNSP and DNSP under revenue caps – reduced electricity use
Year 1 (when electricity use
decreases)
Year 2 Year 3 (and next Determination)
TNSP Decreased TUOS revenue
Increase usage tariff to compensate for lost revenue
As for Year 2
DNSP Decreased DUOS revenue
Increase usage tariff to compensate for lost revenue
As for Year 2
Retailer Reduced sales, assume losses limited to retailer margin, ROC/CARC allowances and cost pass through
As for Year 1 Reduced sales, assume losses limited to new retailer margin, ROC/CARC allowances and cost pass through
Responsible customers
Savings based on reduced costs due to lower use
Savings based on reduced costs due to lower use, but offset by higher network tariffs
As for Year 2
Other customers No impact Increased costs because of higher network tariffs
As for Year 2
Table 9. How utility income and customer costs are affected by the regulatory environment, TNSP and DNSP under revenue caps – increased demand peaks
Year 1 (when demand peaks increase)
Year 2 Year 3 (and next Determination)
TNSP No impact because no TUOS TOU pricing
As for Year 1 Increased revenue cap on the basis that network was augmented to meet higher peaks
DNSP Flat tariff - No impact
TOU or demand charge – Increased income
Flat tariff - As for Year 1,
TOU or demand charge - any excess income returned to customers through lower tariffs because of revenue
As for Year 2, and increased revenue cap on the basis that network was augmented to meet higher peaks

14
cap
Retailer No impact because retailer margin, ROC/CARC allowances and cost pass through are not affected by demand peaks
As for Year 1, unless the energy purchase cost component is increased to compensate for higher spot prices
Increased income assuming the energy purchase cost component is increased to compensate for higher spot prices
Responsible customers
Flat tariff – No impact
TOU or demand charge - Increased costs
As for Year 1, and increased costs if the Energy cost component is increased, but savings from lower DNSP tariffs to return income from any DNSP TOU tariffs
Costs increased further because of higher TUOS and DUOS tariffs, as well as higher Energy cost component
Other customers No impact Slightly higher costs if the Energy cost component is increased, but possible savings from lower DNSP tariffs to return income from any DNSP TOU tariffs
Higher costs because of higher TUOS and DUOS tariffs, as well as higher Energy cost component
Table 10. How utility costs are affected by the regulatory environment – increased demand peaks
Year 1 (when demand peaks increase)
Year 2 a Year 3 (and next Determination)
TNSP No impact Incurs cost of augmentation
No additional costs
DNSP No impact Incurs cost of augmentation
No additional costs
Retailer Potentially higher costs as demand peaks
increase spot prices b
Continuing higher costs
Continuing higher costs
b) Note that transmissions and distribution peaks may not occur at the same time.
c) From 2013/14 onwards, a proportion of this increase (or saving where peaks are reduced) is passed onto consumers because in the Retailer Price Determination the energy purchase costs are set to be no lower than the weighted average of the LRMC of generation (75%) and the market-based purchase cost (25%).

15
2.1.4. Incorporating the cost of changes to peak demand
All the technologies assessed here can increase (AC) or decrease (PV, PV+battery, 20% demand reduction) demand peaks, and so alter the size of the network required to meet demand. In the modelling approach used here, it is assumed that such impacts occur in the next Determination where changes to the costs faced by network operators can most easily be incorporated into their tariffs. Although in reality, in the next Determination all tariffs could change to reflect the changing costs faced by utilities, here, in order to highlight the effect of changes to the size of the network, only changes to the tariffs due to the second order impacts are also assumed to have occurred.
As discussed in Section 2.1.3, although network augmentations are ‘lumpy’, their costs are commonly presented as an average cost per year, meaning that the ‘lumpy’ network augmentation cycle has been smoothed into an annual cost, and we use this approach here.
Where a particular technology such as PV reduces demand peaks, in order to illustrate this effect, we superimpose it on the impact of installing an air conditioning system. Thus, PV reduces the increase due to AC. For demand reductions to reduce the size of the networks that are required to meet peaks in demand, these reductions have to be ‘firm’, meaning that they have to be as reliable as the network. Similarly, increases in demand peaks have to be considered ‘firm’ to justify the need for augmentation of the network. In reality, all demand peaks seen by networks are an aggregate of factors that reduce or increase demand. Therefore, here we assume that both reductions and increases are ‘firm’, and so we value the benefits of reduced peaks and the costs of increased peaks equally. The value of the demand reduction or increase is based on the impact that each technology has on the annual peaks for 2009/10. The transmission peak day (for NSW) was 22 Jan 2010 and the distribution peak day (for the hypothetical suburb) was 12 Jan 2010. The consequences of PV output being reduced are discussed in Section 3.9.1, where the results presented here are compared to another dataset with lower PV output at the annual peaks.
Table 11 shows the changes to the annual peak demand for each technology option used in the model. The PV value is taken from the half hourly Blacktown data, and it can be seen that the average PV system was at 54% capacity during the transmission network peak, and at 20% capacity during the distribution network peak. A 2.5kW system has been modelled here because this is considered a suitable average, with systems historically being smaller but projected to be larger despite low payments for exports (GEM, 2013). The PV+battery option includes the electricity from the battery that is available to reduce the peak demand at that time. The 20% demand reduction value is simply 20% of the peak demand. The AC value is the difference between the peak demand for houses with and without AC. The SWH is assumed not to affect the annual demand peak because it alters electricity consumption that would otherwise have occurred overnight.
The Energy Supply Association of Australia (ESAA) has reviewed the DNSP’s estimates of their long run marginal cost (LRMC) of meeting peaks in demand and arrived at the average value of $175/kVA/year (Deloitte, 2012).16 Given the range of ESAA’s values (138kVA to 331kVA), it is acceptable to assume the kVA value is equivalent to the kW value, and we have done so here. This is also within the range considered reasonable by the Productivity Commission - $150/kW/yr to $220/kW/yr (PC, 2013a). The Productivity Commission also estimated the value of meeting peaks in demand for transmission networks, and arrived at the value of $90/kW/yr (PC, 2013a).
16 The ESAA report settled on a value of $144/kVA/yr because they excluded the Endeavour Energy value as it was considered an outlier. However, our data is from Endeavour Energy’s network area and so we have included their value when calculating the average.

16
Table 11. Assumed Impacts in the Annual Demand Peaks for Different Technology Options
Transmission (kW)
Distribution (kW)
2.5kW PV -1.34925 -0.50541
2.5kW PV + battery -1.84925 -1.00541
20% demand reduction -0.18754 -0.482567
AC +1.464 +1.929

17
3. Modelling Outcomes Section 3.1 firstly establishes the financial outcomes from the customer’s perspective for the
‘base case’ scenario, where all customers are initially assumed to be on EnergyAustralia’s regulated ‘Domestic All Time’ tariff (Table 2). The impacts of a given percentage of customers taking up either EnergyAustralia’s PowerSmart Home TOU tariff or a Demand charge tariff (explained in Section 3.1.3) are then examined. No customers have AC.
In Sections 3.2 to 3.6 the first order impacts of a given percentage of customers taking up particular technology options are assessed, under each of the three tariff options.17 The ‘second order’ assessments are also undertaken, and where there are likely to be any significant impacts on peak demand, a ‘third order’ assessment is undertaken to quantify the impacts of changing the size of the network. These assessments do not include any demand response by customers in response to these tariffs. This is covered in Section 3.7.
3.1. Baseline scenario outcomes
3.1.1. Standard tariff
The first order annual bill financial outcomes for the average customer that does not have AC are shown in Table 12. 18,19 It can be seen that retail costs make up about half the bill, transmission about 7% and distribution makes up the remainder. If controlled load electricity (off-peak for water heating) is taken out, the transmission cost component reduces to 5%. Note that the wholesale electricity costs are incorporated into the retail costs.
Table 12. Residential Annual Bill: Baseline Outcomes, Standard tariff (incl. GST)
Variable ($) Fixed ($) Total ($) Percentage of total bill
Transmission 121 121 7%
Distribution 557 165 722 41.5%
Retail 763 128 892 51.5%
Total 1,441 293 1,735
17 The technology options are assumed to be spread evenly across all households. Thus, for example, where 50% of houses have electric storage water heaters and 70% have air conditioners, 70% of those with electric storage water heaters would also have air conditioners.
18 The Blacktown load data has been scaled to be 19kWh/day including off-peak use, which is an average of the values provided by IPART (2013) 17.8kWh/day, and Ausgrid (2012) 20.14 kWh/day. However, even the average between suburbs can vary greatly, for example from 16.2 to 28.6kWh/day (Endeavour, 2010).
19 All the annual bill outcomes have been presented to the nearest dollar. Although this is probably overly precise given all the assumptions involved in the modelling, it was necessary because many of the changes are relatively small.

18
3.1.2. TOU tariff
The components that make up EnergyAustralia’s ‘PowerSmart Home’ TOU tariff are shown in Table 13. We model the impact of 20% of customers taking up the TOU tariff, assuming they make no change to their energy usage patterns. The first order annual bill financial outcomes for these ‘Responsible customers’ are shown in Table 14. Although the ‘Responsible customers’ total bill increases by about 9.5%, payments to DNSPs actually decrease by about 23%. Payments to TNSPs increase by over 100% and to retailers by about 23%.
The second order annual bill financial outcomes for the ‘Responsible customer’, assuming DNSPs are regulated under a WAPC, are shown in Table 15. As expected, the impacts on transmission costs for the customer are reversed slightly (the cost increase is reduced because the increased TUOS income means that TUOS tariffs can be reduced).
The second order annual bill financial outcomes for the ‘Responsible customer’, assuming DNSPs are regulated under a revenue cap, are shown in Table 16. Again, the transmission cost impacts are reversed slightly, and in addition, so are the distribution cost impacts (the distribution cost decrease is reduced because the decreased DUOS income means that DUOS tariffs can be increased). The net impact is that the customer’s network costs decrease slightly compared to the first order impacts.
The second order annual bill financial outcomes for the ‘Other customers’ are shown in Table 17 (WAPC) and Table 18 (revenue cap). Under the WAPC, the reduced TUOS reduces the total bill by 1.0%, whereas under a revenue cap, the combination of decreased TUOS and increased DUOS increases the total bill by 1.1%.
Table 13. Components of EnergyAustralia’s ‘PowerSmart Home’ TOU Tariff for 2013/14 (excl. GST)
Transmission Distribution a Network
Total b
Retail
component c Final retail d
Daily charge (c/day) 0 51.25 51.25 28 79.25
Low, 10pm to 7am (c/kWh) 0.1815 2.4425 2.624 9.346 11.97
Shoulder, 7am to 2pm and 8pm to 10pm, working weekdays, 7am to 10pm at other times (c/kWh)
0.5846 4.5608 5.1454 14.7146 19.86
Peak, 2pm to 8pm, working weekdays (c/kWh)
11.1295 15.008 26.1375 21.6325 47.77
a) This includes the Climate Change Fund component.
b) All the network charges are from Ausgrid’s Network Pricing Proposal for the Financial Year Ending June 2014.
c) The values in this column were obtained by subtracting the network values from the final retail values
d) The values in this column are from EnergyAustralia’s ‘PowerSmart Home’ tariff from their Residential Customer Price List, Regulated Retail Tariffs, Effective from 1 July 2013.

19
Table 14. Residential Annual Bill for ‘Responsible customers’: Baseline Outcomes, TOU compared to Standard tariff (incl. GST) – First order impact
Variable Fixed Total
($) % change cf Standard
tariff
($) ($) % change cf Standard
tariff
Transmission 247 104.9% 247 104.9%
Distribution 343 -38.5% 214 557 -22.9%
Retail 985 29.1% 112 1,098 23.1%
Total 1,576 9.3% 326 1,902 9.6%
Table 15. Residential Annual Bill for ‘Responsible customers’: WAPC Baseline Outcomes, TOU compared to Standard tariff (incl. GST) – Second order impact
Variable Fixed Total
($) % change cf Standard
tariff
($) ($) % change cf Standard
tariff
Transmission 213 76.3% 213 76.3%
Distribution 343 -38.5% 214 557 -22.9%
Retail 985 29.1% 112 1,098 23.1%
Total 1,541 6.9% 326 1,867 7.7%
Table 16. Residential Annual Bill for ‘Responsible customers’: Revenue Cap Baseline Outcomes, TOU compared to Standard tariff (incl. GST) – Second order impact
Variable Fixed Total
($) % change cf Standard
tariff
($) ($) % change cf Standard
tariff
Transmission 213 76.3% 213 76.3%
Distribution 364 -34.6% 214 579 -19.9%
Retail 985 29.1% 112 1,098 23.1%
Total 1,563 8.4% 326 1,889 8.9%

20
Table 17. Residential Annual Bill for ‘Other customers’: WAPC Baseline Outcomes, TOU compared to Standard tariff (incl. GST) – Second order impact
Variable Fixed Total
($) % change cf Standard
tariff
($) ($) % change cf Standard
tariff
Transmission 104 -14.0% 104 -14.0%
Distribution 557 0.0% 165 722 0.0%
Retail 763 0.0% 128 892 0.0%
Total 1,424 -1.2% 293 1,718 -1.0%
Table 18. Residential Annual Bill for ‘Other customers’: Revenue Cap Baseline Outcomes, TOU compared to Standard tariff (incl. GST) – Second order impact
Variable Fixed Total
($) % change cf Standard
tariff
($) ($) % change cf Standard
tariff
Transmission 104 -14.0% 104 -14.0%
Distribution 592 6.3% 165 757 4.9%
Retail 763 0.0% 128 892 0.0%
Total 1,459 1.3% 293 1,753 1.1%
3.1.3. Demand charge
Here we have used a demand charge of $14.50/kW/month, levied on the annual peak, which is based on the estimated LRMC of meeting peaks in demand on the distribution network ($175/kW/year), as discussed in Section 2.1.2. In other words, the demand charge is 100% cost-reflective of the average cost in meeting demand peaks.20 We then adjusted the DUOS tariff for
20 This approach (making the demand charge the same as the LRMC of meeting peaks in demand) is appropriate here because all the data from the 61 houses are aggregated into a single load profile. However, where the data apply to individual households, each household’s annual peak most likely won’t correspond to the network peak (and will be higher than that peak). This means that the sum of all the demand charges applied to their individual peaks will generate significantly more revenue for the DNSP than the same demand charge applied to the aggregate peak. Thus, the actual demand charge a DNSP needs to apply to offset the LRMC of meeting the annual peak will be significantly less than the LRMC.
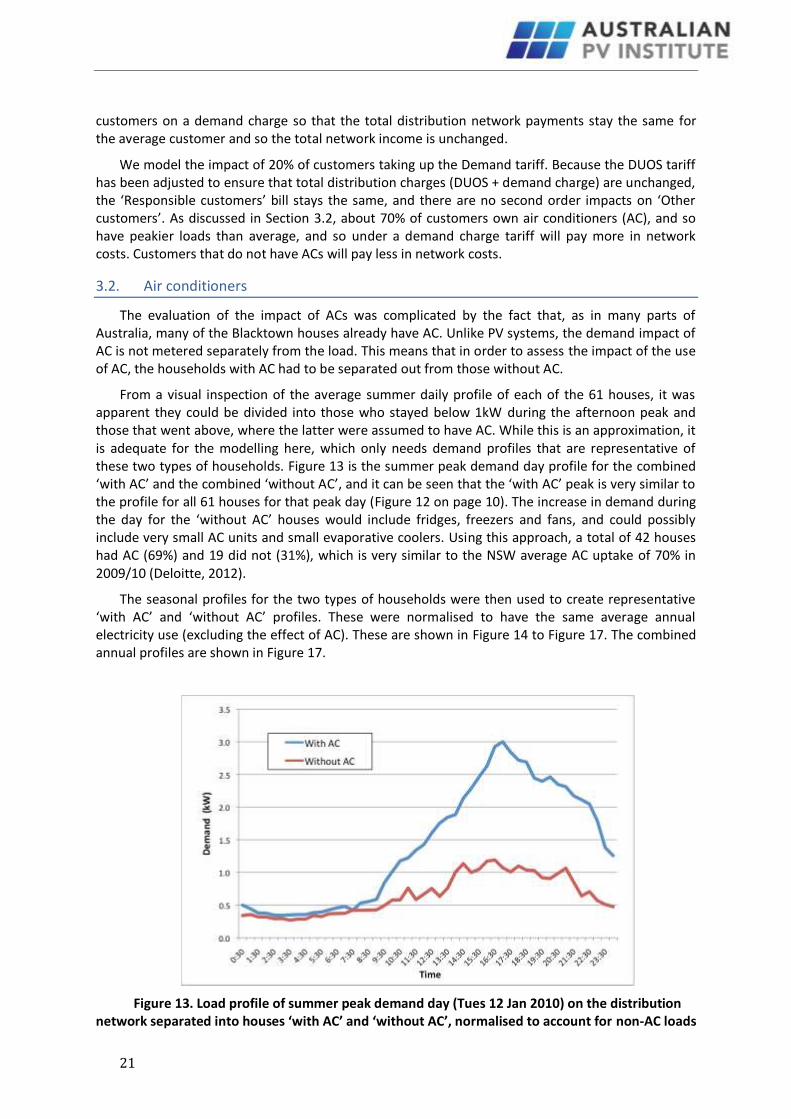
21
customers on a demand charge so that the total distribution network payments stay the same for the average customer and so the total network income is unchanged.
We model the impact of 20% of customers taking up the Demand tariff. Because the DUOS tariff has been adjusted to ensure that total distribution charges (DUOS + demand charge) are unchanged, the ‘Responsible customers’ bill stays the same, and there are no second order impacts on ‘Other customers’. As discussed in Section 3.2, about 70% of customers own air conditioners (AC), and so have peakier loads than average, and so under a demand charge tariff will pay more in network costs. Customers that do not have ACs will pay less in network costs.
3.2. Air conditioners
The evaluation of the impact of ACs was complicated by the fact that, as in many parts of Australia, many of the Blacktown houses already have AC. Unlike PV systems, the demand impact of AC is not metered separately from the load. This means that in order to assess the impact of the use of AC, the households with AC had to be separated out from those without AC.
From a visual inspection of the average summer daily profile of each of the 61 houses, it was apparent they could be divided into those who stayed below 1kW during the afternoon peak and those that went above, where the latter were assumed to have AC. While this is an approximation, it is adequate for the modelling here, which only needs demand profiles that are representative of these two types of households. Figure 13 is the summer peak demand day profile for the combined ‘with AC’ and the combined ‘without AC’, and it can be seen that the ‘with AC’ peak is very similar to the profile for all 61 houses for that peak day (Figure 12 on page 10). The increase in demand during the day for the ‘without AC’ houses would include fridges, freezers and fans, and could possibly include very small AC units and small evaporative coolers. Using this approach, a total of 42 houses had AC (69%) and 19 did not (31%), which is very similar to the NSW average AC uptake of 70% in 2009/10 (Deloitte, 2012).
The seasonal profiles for the two types of households were then used to create representative ‘with AC’ and ‘without AC’ profiles. These were normalised to have the same average annual electricity use (excluding the effect of AC). These are shown in Figure 14 to Figure 17. The combined annual profiles are shown in Figure 17.
Figure 13. Load profile of summer peak demand day (Tues 12 Jan 2010) on the distribution network separated into houses ‘with AC’ and ‘without AC’, normalised to account for non-AC loads

22
Figure 14. Spring representative daily load profile for Blacktown households - ‘with AC’ and ‘without AC’, normalised to account for non-AC loads
Figure 15. Summer representative daily load profile for Blacktown households - ‘with AC’ and ‘without AC’, normalised to account for non-AC loads

23
Figure 16. Autumn representative daily load profile for Blacktown households - ‘with AC’ and ‘without AC’, normalised to account for non-AC loads
Figure 17. Winter representative daily load profile for Blacktown households - ‘with AC’ and ‘without AC’, normalised to account for non-AC loads

24
Figure 18. Annual representative daily load profile for Blacktown households - ‘with AC’ and ‘without AC’, normalised to account for non-AC loads
3.2.1. Air conditioners with a Standard tariff
The first, second and third order impacts on both the ‘Responsible customer’ and the ‘Other customers’, where the ‘Responsible customer’ is on a Standard tariff, are summarised in Figure 19 and Figure 20, where the DNSPs are regulated under a WAPC and a revenue cap respectively. Details of the changes to the transmission, distribution and retail components for the ‘Responsible customer’ first order impacts are shown in Table 21. These details of the second and third order impacts for both the ‘Responsible customer’ and the ‘Other customers’ are shown in Section 6.1 of Appendix A.
First order impacts
Table 19 and Table 20 show the annual bills for the households that do not, and do, have AC respectively. It can be seen that adding an AC (of the same size as the average in the data used here), increases the average annual bill by 9% or about $155. The transmission component increases more than the distribution component because of the TUOS inclining block tariff (meaning the TUOS tariff increases with higher annual electricity use).
Second order impacts
Because AC increases the ‘Responsible customers’ electricity use, it increases payments to network operators and so reduces the related TUOS and DUOS tariff rates. Thus, under the WAPC scenario (where only TNSP revenue is compensated), the ‘Other customers’ bills decrease by slightly less than under the revenue cap scenario (where both TNSP and DNSP revenue is compensated).
Third order impacts
AC units commonly coincide with network demand peaks and this is reflected in the 4.8% and 4.6% increase in the ‘Other customers’ bills under the WAPC and revenue cap scenarios respectively,

25
or $83/year and $79/year.21 Of course, the cost to ‘Other customers’ of all 70% of the households which have installed AC to date is higher, at around $260/yr in the WAPC scenario and $245/year in the revenue cap scenario.
Assuming that during the two peak demand periods, the AC units were operating at 90% of their combined rated capacity,22 we estimate that the average AC size in the Blacktown houses was about 2kW. This would result in the installed AC units increasing the costs faced by households that do not have AC by about $130/kW/yr in the WAPC scenario and about $120/kW/yr in the revenue cap scenario.
Figure 19. First, Second and Third order annual bill impacts under a WAPC: Standard tariff, 20% more households take up AC
21 Throughout this report we often present the modelling results to the nearest dollar. This is not meant to imply that the model is accurate to that level, but is necessary because the changes are sometimes quite small.
22 This is less than 100% because either not all the AC units were switched on and/or those that were switched on were not operating at full capacity.

26
Figure 20. First, Second and Third order annual bill impacts under a Revenue cap: Standard tariff, 20% more households take up AC
Table 19. Residential Annual Bill for ‘Other customers’ (do not have AC): Standard tariff
Variable Fixed Total
($) ($) ($)
Transmission 121 121
Distribution 557 165 722
Retail 763 128 892
Total 1,441 293 1,735
Table 20. Residential Annual Bill for ‘Responsible customers’ (get AC): Standard tariff
Variable Fixed Total
($) ($) ($)
Transmission 191 191
Distribution 577 165 742
Retail 830 128 959
Total 1,598 293 1,891

27
Table 21. Residential Annual Bill for ‘Responsible customers’ (get AC): Standard tariff, 20% Install AC - First order impact
Variable Fixed Total
($) % change ($) ($) % change
Transmission 191 58.3% 191 58.3%
Distribution 577 3.5% 165 742 2.7%
Retail 830 8.8% 128 959 7.5%
Total 1,598 10.9% 293 1,891 9.0%
3.2.2. Air conditioners with a TOU tariff
The first, second and third order impacts on both the ‘Responsible customer’ and the ‘Other customers’, where the ‘Responsible customer’ is on a TOU tariff, are summarised in Figure 21 and Figure 22, where the DNSPs are regulated under a WAPC and a revenue cap respectively. Details of the changes to the transmission, distribution and retail components for the ‘Responsible customer’ first order impacts are shown in Table 22. These details of the second and third order impacts for both the ‘Responsible customer’ and the ‘Other customers’ are shown in Section 6.2 of Appendix A.
First order impacts
As expected, if the ‘Responsible customer’ is placed on a TOU tariff, their costs increase, being 19% higher (compared to 9% higher on a Standard tariff). Interestingly, their TUOS costs increase by significantly more than they do under a Standard tariff, whereas their DUOS costs actually decrease. This occurs because, under the Standard tariff, all the first 1,000kWh electricity use each quarter is on a 12.678c/kWh DUOS rate, whereas on the TOU tariff, such a high level of DUOS (15.008c/kWh) only occurs during peak periods, with the remainder at either 4.5608c/kWh (shoulder) or 2.4425c/kWh (low).
In terms of income for network operators this is an odd outcome, given that the timing of the annual transmission network peak (2.30pm to 3pm, 21 Jan 2010) doesn’t coincide with the timing of the annual distribution network peak driven by AC (4.30pm to 5pm, 12 Jan 2010). If a residential TOU tariff is to be used to pay for the network costs driven by AC, the income for DNSPs should increase, not decrease. The customers’ retail costs are significantly more, presumably to pay for higher wholesale electricity costs.
Second order impacts
The second order impacts under a WAPC are similar to when the ‘Responsible customer’ is on a Standard tariff, with the “other customers’ bill decreasing slightly more because of the higher TUOS income for TNSPs. However, under a revenue cap, the lower DUOS income for DNSPs counteracts this effect and so the ‘Other customers’ bill is actually slightly higher – even before the peak demand impacts have been included.

28
Third order impacts
Thus, after the third order impacts are taken into account, compared to when the ‘Responsible customer’ is on the Standard tariff, the ‘Other customers’ bill increases by slightly less under a WAPC ($69/yr) and by slightly more under a revenue cap ($93/yr).
Figure 21. First, Second and Third order annual bill impacts under a WAPC: TOU tariff, 20% more households take up AC
Figure 22. First, Second and Third order annual bill impacts under a Revenue cap: TOU tariff, 20% more households take up AC

29
Table 22. Residential Annual Bill for ‘Responsible customers’ (have AC): TOU tariff, 20% Install AC - First order impact
Variable Fixed Total
($) % change ($) ($) % change
Transmission 283 134.5% 283 134.5%
Distribution 401 -28.0% 214 615 -14.8%
Retail 1,103 44.5% 112 1,215 36.2%
Total 1,787 24.0% 326 2,113 21.8%
3.2.3. Air conditioners with a Demand charge tariff
The first, second and third order impacts on both the ‘Responsible customer’ and the ‘Other customers’, where the ‘Responsible customer’ is on a demand charge tariff, are summarised in Figure 23 and Figure 24, where the DNSPs are regulated under a WAPC and a revenue cap respectively. Details of the changes to the transmission, distribution and retail components for the ‘Responsible customer’ first order impacts are shown in Table 23. These details of the second and third order impacts for both the ‘Responsible customer’ and the ‘Other customers’ are shown in Section 6.3 of Appendix A.
First order impacts
The ‘Responsible customers’ bill has increased by 18.4%, compared to 9% on a Standard tariff, and 21.8% on a TOU tariff. The smaller increase compared to a TOU tariff reflects the fact that the Demand charge tariff is designed to increase only the DNSP income and leaves the TNSP and retailer income unchanged.
Figure 25 shows the daily cost for different seasons for ‘Responsible customers’ on Standard, TOU and Demand charge tariffs assuming 20% more install AC, based on the first order impact. It can be seen that the higher bills for summer and winter days reflect increased use of AC. The TOU tariff has the greatest difference between seasons because although the Demand charge tariff penalises the high summer AC use, the demand penalty is applied equally to all seasons (because it is based on the annual peak).
Second order impacts
The second order impacts under a WAPC are the same as for the Standard tariff because the TUOS charges are the same. However, where the DNSP is under a revenue cap, the higher network costs paid by the ‘Responsible customer’ result in lower bills for ‘Other customers’, decreasing by $52/yr, compared to $10/yr under the Standard tariff, and an increase of $1/yr under a TOU tariff.
Third order impacts
Thus, after the third order impacts are taken into account, the ‘Other customers’ bill is $83/yr higher under a WAPC (the same as for the Standard tariff, and $69/yr under a TOU tariff), and but only $37 higher under a revenue cap (compared to $79/yr for the Standard tariff, and $93/yr under a TOU tariff).
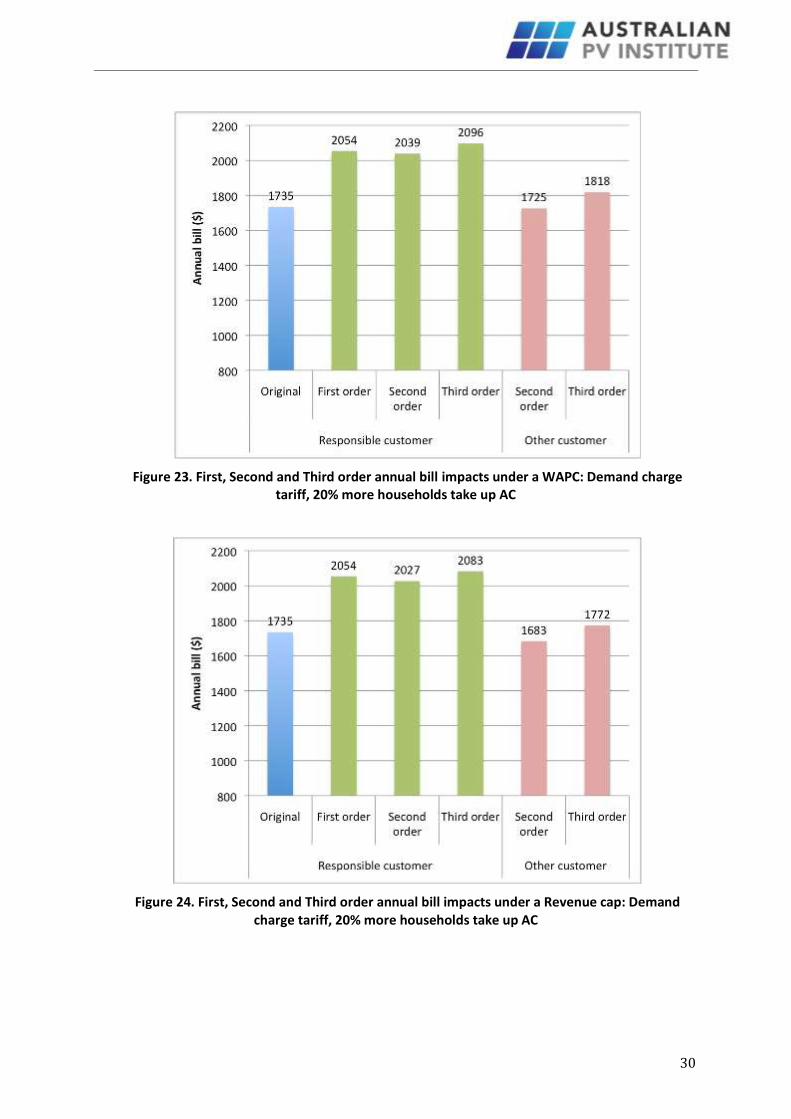
30
Figure 23. First, Second and Third order annual bill impacts under a WAPC: Demand charge tariff, 20% more households take up AC
Figure 24. First, Second and Third order annual bill impacts under a Revenue cap: Demand charge tariff, 20% more households take up AC

31
Table 23. Residential Annual Bill for ‘Responsible customers’ (have AC): Demand charge tariff, 20% Install AC - First order impact
Variable Fixed Total
($) % change ($) ($) % change
Transmission 191 58.3% 191 58.3%
Distribution 740 32.8% 165 905 25.3%
Retail 830 8.8% 128 959 7.5%
Total 1,761 22.2% 293 2,054 18.4%
Figure 25. Daily Bill for ‘Responsible customers’ on Standard, TOU and Demand charge tariffs, 20% Install AC - First order impact
3.2.4. AC Summary
Figure 26 summarises the impacts on ‘Other customers’ when the ‘Responsible customer’ installs an average AC. The key points are:
- AC increases the bills of ‘Other customers’ in all scenarios
- Placing the ‘Responsible customer’ on a TOU tariff (rather than a Standard tariff) results in ‘Other customers’ bills being:
i. lower when the DNSP is under a WAPC because the income of the TNSP (which is under a revenue cap) was increased, which results in TUOS tariffs being decreased.

32
ii. higher when the DNSP is under a revenue cap because the DNSP’s income was decreased, which results in DUOS tariffs being increased.
- Placing the ‘Responsible customer’ on a demand charge tariff (rather than a Standard tariff) results in ‘Other customers’ bills being:
i. lower when the DNSP is under a revenue cap because the DNSP receives significant income from the demand charge, which results in DUOS tariffs being decreased.
- The costs to the ‘Responsible customer’ are also lower on a demand charge tariff (compared to a TOU tariff), making it preferable from both the ‘Responsible customers’ and ‘Other customers’ point of view. Only for the retailer is a TOU tariff preferable.
Figure 26. Third order (total) annual bill impacts on ‘Other customers’, by tariff type, where 20% of households install an average AC
3.3. AC + Photovoltaics
As discussed in Section 2.1.4, where a technology such as PV can reduce demand peaks, in order to illustrate this effect, we superimpose it on the impact of installing an air conditioning system. Thus, to assess the impact of PV, we modelled 20% of households installing both an average sized AC unit and a net-metered 2.5kW PV system (the only electricity that is exported to the grid is that in excess of in-house requirements at any particular time). The following sections separately assess the impacts for a Standard tariff, a TOU tariff and a Demand charge tariff. No special feed-in tariffs or other incentives are included in the assessment. Section 3.3.4 then summarises these outcomes.

33
3.3.1. AC + PV with a Standard tariff
The first, second and third order impacts on both the ‘Responsible customer’ and the ‘Other customers’, all on a Standard tariff, are summarised in Figure 27 and Figure 28, where the DNSPs are regulated under a WAPC and a revenue cap respectively. In all such charts, the semi transparent columns correspond to the impact of AC alone. Details of the changes to the transmission, distribution and retail components for the ‘Responsible customer’ first order impacts are shown in Table 24. These details of the second and third order impacts for both the ‘Responsible customer’ and the ‘Other customers’ are shown in Section 6.4 of Appendix A. The ‘Responsible customers’ income from exported PV electricity is kept separate to the ‘Retail’ income because, although the retailer does pay for this electricity, they also avoid buying the same amount on the wholesale market. Keeping it separate also helps to show how PV payments contribute to the owner’s income.
First order impacts
The on-site use of PV electricity significantly reduces all aspects of the ‘Responsible customers’ bill. Transmission is reduced the most because of its increasing block tariff (the tariff increases as electricity use increases), and electricity demand is reduced to a lower tariff level. Distribution is less affected because it has a decreasing block tariff, and electricity demand is reduced to a higher tariff.
Second order impacts
Under a WAPC, there is little second order impact on the ‘Responsible customer’s bill because their TUOS charges are already very low. Conversely, because the ‘Other customers’ TUOS charges are higher, the second order impacts are slightly higher. Still, although the ‘Other customers’ network costs have increased to compensate network operators for decreased revenue, their retail costs are unchanged, and so their total bill has increased only slightly. Under a revenue cap, the second order impacts are greater, simply because DUOS charges are now also increased to compensate DNSPs, resulting in an increase of $30/yr for ‘Other customers’.
The reason that the PV customer’s bill can decrease by so much and the ‘Other customers’ bill increase by such a small amount is that savings are made through reduced payments to the retailer and the wholesale generator. Under IPART’s regulated standard tariff, on-site use of PV electricity means that the retailer misses out on 12.52c/kWh (the variable R component, see Table 3) but avoids paying 9.843c/kWh (the energy component, see Table 4) and their cost pass through allowance (0.409c/kWh), and so loses only 3.086c/kWh. Thus, it is the wholesale generator that bears most of the losses. However, if the retailer’s actual wholesale purchase cost is lower than assumed by IPART (for example because of the merit order effect), they would normally receive windfall profits through the regulated tariff. In this case, reduced sales because of on-site use of PV electricity would reduce retailers’ windfall profits.
Third order impacts
The third order annual bill financial outcomes were based on PV’s contribution to reducing peak demand during the peaks for transmission (between 2:30pm and 3:00pm on 22 Jan 2010) and distribution (between 4:30pm and 5:00pm on 12 Jan 2010). According to the Blacktown data, the 2.5kW PV reduced the transmission peak by 1.35kW and the distribution peak by 0.505kW. Again we have used the LRMC of meeting peaks in demand for the distribution network ($175/kW/year), as well as for the transmission network ($90/kW/yr), as discussed in Section 2.1.2.
It can be seen from Figure 10 (transmission network peak) and Figure 12 (distribution network peak) in Section 2.1.2, that PV has a relatively low output during the annual peaks – being at 54% capacity during the transmission network peak, and at 20% capacity during the distribution network

34
peak.23 However, the ‘Other customers’ bill is still $19/yr lower under a WAPC than if PV hadn’t been installed. DNSPs in NSW are currently regulated under a WAPC, and so this result represents the outcomes for PV to date. However, as of July 2014, DNSPs will be regulated under a revenue cap and the modelling indicates a small rise of $10/yr in this case.
Figure 27. First, Second and Third order annual bill impacts under a WAPC: Standard tariff, 20% of households install both AC and 2.5kW PV (semi transparent columns are AC alone)
Figure 28. First, Second and Third order annual bill impacts under a Revenue cap: Standard tariff, 20% of households install both AC and 2.5kW PV (semi transparent columns are AC alone)
23 The sudden drop in PV output during the transmission network peak was due to about two thirds of the houses going close to zero output for the half hour period and so may have been due to a power interruption during the peak rather than cloud cover.

35
Table 24. Residential Annual Bill for ‘Responsible customers’: 20% of households install both AC and 2.5kW PV, Standard tariff – First order impact
Variable Fixed Total
($) % change ($) ($) % change
Transmission 80 -34.1% 80 -34.1%
Distribution 442 -20.7% 165 607 -16.0%
Retail 628 -17.8% 128 756 -15.2%
Total 1,149 -20.3% 293 1,442 -16.8%
Exported PV a 123
Total minus PV 1,320 -23.9%
a: Assumed to be valued at 8c/kWh, with no FiTs or renewable energy certificates included.
3.3.2. AC + PV with a TOU tariff
The first, second and third order impacts on both the ‘Responsible customer’ and the ‘Other customers’, where the ‘Responsible customer’ is on a TOU tariff, are summarised in Figure 29 and Figure 30, where the DNSPs are regulated under a WAPC and a revenue cap respectively.24 Details of the changes to the transmission, distribution and retail components for the ‘Responsible customer’ first order impacts are shown in Table 25. These details of the second and third order impacts for both the ‘Responsible customer’ and the ‘Other customers’ are shown in Section 6.5 of Appendix A.
First order impacts
The ‘Responsible customers’ bill is higher than when on a Standard tariff, simply reflecting the higher costs of being on a TOU tariff (with no change in usage patterns), as was apparent when they were on a TOU tariff without AC or PV.
Second order impacts
The increased TUOS payments mean that under a WAPC, the ‘Other customers’ bill has decreased by more than they would under a Standard tariff, however not by as much as it would with AC only. The decreased DUOS payments mean that under a revenue cap, the ‘Other customers’ bill has increased more than it would under a Standard tariff and more that it would with AC only.
Third order impacts
After the third order impacts are taken into account, the ‘Other customers’ bill is now $30/yr lower (WAPC) and $1/yr higher (revenue cap) than they would have been if PV wasn’t installed, and $25/yr lower (WAPC) and $5/yr higher (revenue cap) than when the ‘Responsible customer’ was on
24 For the reasons stated above, where the ‘Responsible customer’ is on a TOU tariff, we have not assessed the outcome under a WAPC.
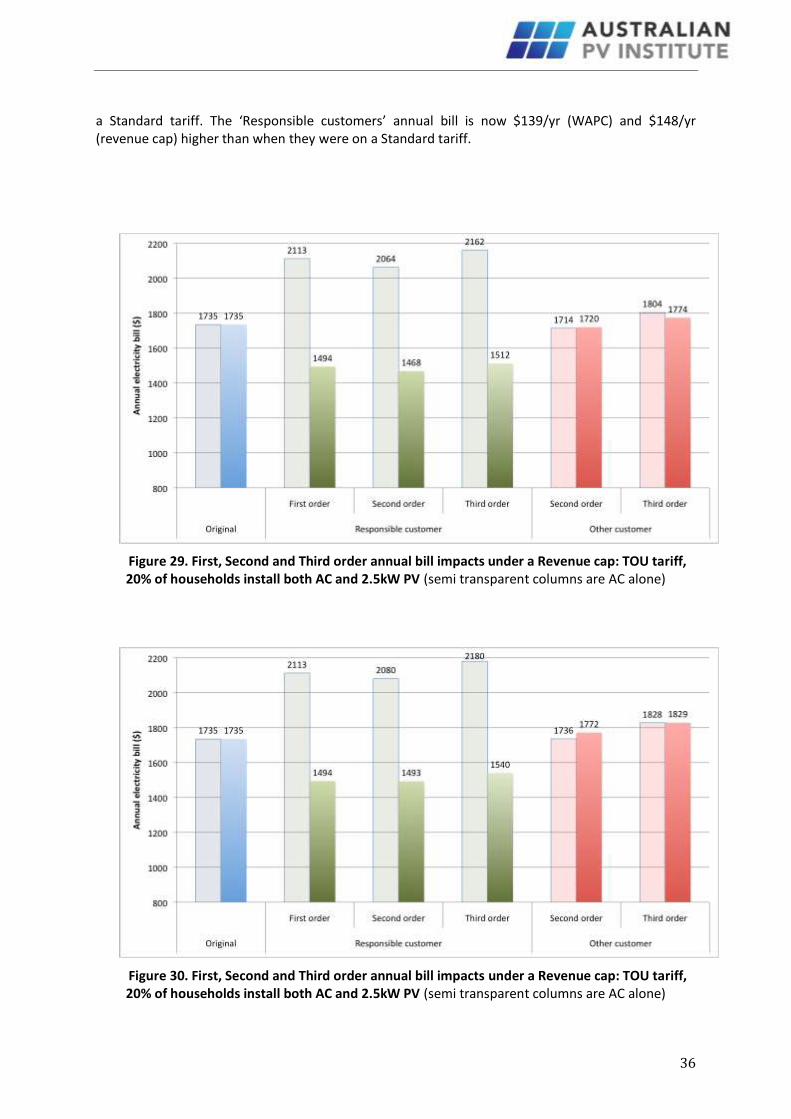
36
a Standard tariff. The ‘Responsible customers’ annual bill is now $139/yr (WAPC) and $148/yr (revenue cap) higher than when they were on a Standard tariff.
Figure 29. First, Second and Third order annual bill impacts under a Revenue cap: TOU tariff, 20% of households install both AC and 2.5kW PV (semi transparent columns are AC alone)
Figure 30. First, Second and Third order annual bill impacts under a Revenue cap: TOU tariff, 20% of households install both AC and 2.5kW PV (semi transparent columns are AC alone)

37
Table 25. Residential Annual Bill for ‘Responsible customers’ on a TOU tariff: 20% of households install both AC and 2.5kW PV – First order impact
Variable Fixed Total
($) % change ($) ($) % change
Transmission 224 85.8% 224 85.8%
Distribution 273 -50.9% 214 488 -32.5%
Retail 793 3.8% 112 905 1.4%
Total 1,290 -10.5% 326 1,617 -6.8%
Exported PV 123
Total minus PV - 1,494 -13.9%
3.3.3. AC + PV with a Demand charge tariff
The first, second and third order impacts on both the ‘Responsible customer’ and the ‘Other customers’, all on a Demand charge tariff, are summarised in Figure 31 and Figure 32, where the DNSPs are regulated under a WAPC and a revenue cap respectively. Details of the changes to the transmission, distribution and retail components for the ‘Responsible customer’ first order impacts are shown in Table 26. These details of the second and third order impacts for both the ‘Responsible customer’ and the ‘Other customers’ are shown in Section 6.6 of Appendix A.
First order impacts
The ‘Responsible customers’ total bill is much higher than under the Standard tariff because the DUOS charges offset by the PV system are now lower (to compensate for the demand charge). Transmission and retail cost components stay the same as under the Standard tariff.
Second order impacts
The second order impacts under a WAPC are the same as for the Standard tariff because the TUOS charges are the same. However, under a revenue cap, the ‘Other customers’ bill is $58/yr lower than for the Standard tariff. This is because the DNSP loses less income due to PV (because the DUOS charge reduced by PV makes up a smaller component of the total DNSP income, with the remainder through the demand charge), and so the DUOS tariff paid by ‘Other customers’ is increased by a smaller amount.
Third order impacts
After the third order impacts are taken into account, the ‘Other customers’ bill is now $19/yr (WAPC) and $9/yr (revenue cap) lower than they would have been if PV wasn’t installed, and the same as (WAPC), and $61/yr lower than (revenue cap), when the ‘Responsible customer’ was on a Standard tariff. The ‘Responsible customers’ annual bill is now $242/yr (WAPC) and $215/yr (revenue cap) higher than when they were on a Standard tariff.

38
Figure 31. First, Second and Third order annual bill impacts under a WAPC: Demand charge tariff, 20% of households install both AC and 2.5kW PV (semi transparent columns are AC alone)
Figure 32. First, Second and Third order annual bill impacts under a Revenue cap: Demand charge tariff, 20% of households install both AC and 2.5kW PV (semi transparent columns are AC
alone)

39
Table 26. Residential Annual Bill for ‘Responsible customers’ on a Demand charge tariff: 20% of households install both AC and 2.5kW PV – First order impact
Variable Fixed Total
($) % change ($) ($) % change
Transmission 80 -34.1% 80
-
34.1%
Distribution 703 26.2% 165 868 20.2%
Retail 628 -17.8% 128 756
-15.2%
Total 1,410 -2.1% 293 1,704 -1.8%
Exported PV 123
Total minus PV - 1,581 -8.9%
3.3.4. AC + PV Summary
Figure 33 summarises the impacts on ‘Other customers’ when the ‘responsible customer’ installs either AC or AC and a 2.5kW PV system. The key points are:
- When the DNSP is regulated under a WAPC, PV reduces the increase caused by AC when the Responsible customer is on any of the three tariffs.
- When the DNSP is regulated under a revenue cap:
i. when the Responsible customer is on a standard tariff, PV sightly increases ‘Other customers’ costs (by $10 per year). This is simply because it reduces electricity use and DNSP’s expected revenue – which they seek to recover from all customers.
ii. when the Responsible customer is on a TOU tariff, the PV has little impact on ‘Other customers’ costs – because the additional impacts that PV has on revenue for TNSPs (increase) and DNSPs (decrease) cancel each other out.
iii. only when the Responsible customer is on a demand charge tariff does PV reduce the increase caused by AC (by $9). This is because on a demand charge tariff, more of the DNSPs expected revenue comes from the demand charge and less from the DUOS charge. Since PV’s largest impact on demand is outside the times when a demand charge tariff applies, DNSPs receive their expected revenue and so the ‘Other customers’ DUOS tariff is increased by a smaller amount.
- In this case the costs to the ‘Responsible customer’ are highest on a demand charge tariff, followed by the TOU tariff then the Standard tariff.

40
Figure 33. Third order annual bill impacts on ‘Other customers’, where 20% of households install both AC and 2.5kW PV
3.4. AC + PV + battery
Again, as discussed in Section 3, where a technology such as PV+battery reduces demand peaks, in order to illustrate this effect, we superimpose it on the impact of installing an air conditioning system. The following sections separately assess the impacts for a Standard tariff, a TOU tariff and a Demand charge tariff. Section 3.4.4 then summarises these outcomes.
Here, the PV owner has a battery system that captures any PV electricity that would otherwise have been exported to the grid. The ‘battery electricity’ is then used to offset electricity use during the peak demand period, assuming only 80% of the electricity is available because of battery losses.25
3.4.1. AC + PV + battery with a Standard tariff
The first, second and third order impacts on both the ‘Responsible customer’ and the ‘Other customers’, all on a Standard tariff, are summarised in Figure 34 and Figure 35, where the DNSPs are regulated under a WAPC and a revenue cap respectively. Details of the changes to the transmission, distribution and retail components for the ‘Responsible customer’ first order impacts are shown in Table 27. These details of the second and third order impacts for both the ‘Responsible customer’ and the ‘Other customers’ are shown in Section 6.7 of Appendix A.
25 This assumes a lead acid battery. If a lithium ion battery was used, the round trip efficiency could be about 85%, and so the impact of the battery would be greater. Note also that we assume the battery is sized so as to be able to store all excess PV generation. The cost effectiveness of such systems is not assessed.

41
First order impacts
As expected, this provides better returns to the PV system owner because the PV electricity that would otherwise be exported and earn only 8c/kWh is being used to offset demand at the relevant full retail tariff.
Second order impacts
The second order impacts under a WAPC are very similar to where the customer has a PV system without a battery because the TUOS charges make up a small proportion of the ‘Responsible customers’ bill. However, under a revenue cap, the ‘Other customers’ bill is higher (it increases by $66/yr instead of $30/yr). This is because the DNSP loses more income because the electricity that would otherwise have been exported is now used to reduce on-site use.
Third order impacts
Having a battery attached to the PV system increases the system owner’s ability to reduce demand peaks caused by the AC. Thus, after the third order impacts are taken into account, under a WAPC the ‘Other customers’ bill is now $47/yr lower than they would have been if PV+battery wasn’t installed. However, because of the higher DUOS charges, under a revenue cap the ‘Other customers’ bill is now $18/yr higher than they would have been if PV+battery wasn’t installed.
Figure 34. First, Second and Third order annual bill impacts under a WAPC: Standard tariff, 20% of households install both AC and 2.5kW PV + battery (semi transparent columns are AC alone)

42
Figure 35. First, Second and Third order annual bill impacts under a Revenue cap: Standard tariff, 20% of households install both AC and 2.5kW PV + battery (semi transparent columns are AC
alone)
Table 27. Residential Annual Bill for ‘Responsible customers’ on a Standard tariff: 20% of households install both AC and 2.5kW PV + battery – First order impact
Variable Fixed Total
($) % change ($) ($) % change
Transmission 77 -36.5% 77
-36.5%
Distribution 286 -48.6% 165 451
-
37.5%
Retail 480 -37.1% 128 609
-
31.7%
Total 843 -41.5% 293 1,137
-
34.5%
3.4.2. AC + PV + battery with a TOU tariff
The first, second and third order impacts on both the ‘Responsible customer’ and the ‘Other customers’, where the ‘Responsible customer’ is on a TOU tariff, are summarised in Figure 36, where the DNSPs are regulated under a revenue cap.26 Details of the changes to the transmission, distribution and retail components for the ‘Responsible customer’ first order impacts are shown in Table 28. These details of the second and third order impacts for both the ‘Responsible customer’ and the ‘Other customers’ are shown in Section 6.8 of Appendix A.
26 For the reasons stated above, where the ‘Responsible customer’ is on a TOU tariff, we have not assessed the outcome under a WAPC.

43
First order impacts
This results in even greater financial benefits for the ‘Responsible customer’ than when they are on a Standard tariff because the PV electricity can be used to offset the peak TOU component.
Second order impacts
Payments to the TNSP are greater than under a Standard tariff and so under a WAPC, ‘Other customers’ bills are $5/yr lower. However, payments to DNSPs are significantly lower and so under a revenue cap, ‘Other customers’ bills are $29/yr higher.
Third order impacts
After the third order impacts are taken into account, the ‘Other customers’ bill is now $39/yr lower (WAPC) and $34/yr higher (revenue cap) than they would have been if PV+battery wasn’t installed, and $6/yr lower (WAPC) and $30/yr higher (revenue cap), than when the ‘Responsible customer’ was on a Standard tariff. The ‘Responsible customers’ annual bill is now $109/yr (WAPC) and $121/yr (revenue cap) lower than when they were on a Standard tariff.
Figure 36. First, Second and Third order annual bill impacts under a WAPC: TOU tariff, 20% of households install both AC and 2.5kW PV + battery (semi transparent columns are AC alone)

44
Figure 37. First, Second and Third order annual bill impacts under a Revenue cap: TOU tariff, 20% of households install both AC and 2.5kW PV + battery (semi transparent columns are AC alone)
Table 28. Residential Annual Bill for ‘Responsible customers’ on a TOU tariff: 20% of households install both AC and 2.5kW PV + battery – First order impact
Variable Fixed Total
($) % change ($) ($) % change
Transmission 107 -11.3% 107
-
11.3%
Distribution 109 -80.5% 214 323
-
55.3%
Retail 488 -36.1% 112 600
-
32.7%
Total 704 -51.2% 326 1,030
-
40.6%
3.4.3. AC + PV + battery with a Demand charge tariff
The first, second and third order impacts on both the ‘Responsible customer’ and the ‘Other customers’, all on a Standard tariff, are summarised in Figure 38 and Figure 39, where the DNSPs are regulated under a WAPC and a revenue cap respectively. Details of the changes to the transmission, distribution and retail components for the ‘Responsible customer’ first order impacts are shown in Table 29. These details of the second and third order impacts for both the ‘Responsible customer’ and the ‘Other customers’ are shown in Section 6.9 of Appendix A.
First order impacts
Although the PV electricity that would otherwise be exported can now be used to offset the demand charge, the PV+battery customer is worse off than if they were on a Standard tariff or a TOU tariff. This is in part because the on-site PV electricity is now offsetting DUOS charges that are

45
much lower, and in part because the PV electricity stored in the battery is insufficient to offset the effect of the demand charge.
Second order impacts
The second order impacts under a WAPC are the same as for the Standard tariff because the TUOS charges are the same. However, under a revenue cap, the higher payments to DNSPs result in ‘Other customers’ bills being $43/yr less than under a Standard tariff, and $72/yr less than under a TOU tariff.
Third order impacts
After the third order impacts are taken into account, the ‘Other customers’ bill is now $47/yr lower (WAPC) and $15/yr higher (revenue cap) than they would have been if PV+battery wasn’t installed, and the same as (WAPC), and $45/yr lower (revenue cap), than when the ‘Responsible customer’ was on a Standard tariff. The ‘Responsible customers’ annual bill is now $198/yr (WAPC) and $169/yr (revenue cap) higher than when they were on a Standard tariff.
Figure 38. First, Second and Third order annual bill impacts under a WAPC: Demand charge tariff, 20% of households install both AC and 2.5kW PV + battery (semi transparent columns are AC
alone)

46
Figure 39. First, Second and Third order annual bill impacts under a Revenue cap: Demand charge tariff, 20% of households install both AC and 2.5kW PV + battery (semi transparent columns
are AC alone)
Table 29. Residential Annual Bill for ‘Responsible customers’ on a Demand charge tariff: 20% of households install both AC and 2.5kW PV + battery – First order impact
Variable Fixed Total
($) % change ($) ($) % change
Transmission 77 -36.5% 77
-
36.5%
Distribution 490 -12.0% 165 655 -9.3%
Retail 480 -37.1% 128 609
-
31.7%
Total 1,047 -27.3% 293 1,341
-
22.7%
3.4.4. AC + PV + Battery Summary
Figure 40 summarises the impacts on ‘Other customers’ when the ‘Responsible customer’ installs either AC or AC and a 2.5kW PV + battery system. The key points are:
- When the DNSP is regulated under a WAPC, PV+battery reduces the increase caused by AC when the Responsible customer is on any of the three tariffs.
- When the DNSP is regulated under a revenue cap, PV+battery increases the increase caused by AC when the Responsible customer is on any of the three tariffs – although again, the cost to ‘Other customers’ is lowest when the ‘Responsible customer’ is on a Demand charge tariff, and highest on the TOU tariff.

47
- Thus, although using a battery to, in effect, have more PV capacity available during peak periods does reduce demand peaks, it also increases the amount of PV electricity that is used on-site. When the DNSP is regulated under a revenue cap, they are able to recover any reduction in revenue through higher network charges, and so costs increase for ‘Other customers’.
- The costs to the ‘Responsible customer’ are again higher on a demand charge tariff, followed by the Standard tariff then the TOU tariff – making the TOU tariff particularly ineffective at providing an effective and fair price signal.
Figure 40. Third order annual bill impacts on ‘Other customers’, where 20% of households install AC and 2.5kW PV and a battery
3.5. AC + Solar Water Heaters
As at Dec 2010 there were 2.5 million households in NSW (ABS, 2011), and there were 196,000 SWHs in NSW (CEC, 2013), meaning that around 7.8% of households had a SWH. About 49% of households had an electric storage water heater, about 3% had heat pumps, 3% had instant electric water heaters and, apart from the SWHs, the remainder used gas (AECOM, 2012). Here we assume that the storage water heaters, SWHs and heat pumps are run on off-peak electricity, making a total of 60%. We assume half the households are on controlled load 1 (CL1) and half are on both CL1 and CL2. The average electric storage water heater uses about 12.4 kWh/day, and the average electric boosted SWH uses about 4.7 kWh/day, or 62% less than the electric storage alone (Rheem, 2013). EnergyAustralia’s off-peak tariffs are shown in Table 30.

48
Table 30. Components of EnergyAustralia’s Off-peak Retail Tariffs for 2013/14 (excl. GST)
TNSP a DNSP a Retail component b
Final retail c
Daily charge (c/day) 0 3.73935 0 0 d
Controlled load 1 (c/kWh) 1.8841 0.2665 8.0994 10.25
Controlled load 2 (c/kWh) 5.0461 0.282 8.1519 13.48
a) All the network charges are from Ausgrid’s Network Pricing Proposal for the Financial Year Ending June 2014.
b) The values in this column were obtained by subtracting the network values from the final retail values
c) The values in this column are from EnergyAustralia’s ‘PowerSmart Home’ tariff from their Residential Customer Price List, Regulated Retail Tariffs, Effective from 1 July 2013.
d) It appears that EnergyAustralia loses 3.73935c/day because they do not have a Service Availability Charge for Controlled Load tariffs.
As discussed in Section 3, where a technology such as PV+battery reduces demand peaks, in order to illustrate this effect, we superimpose it on the impact of installing an air conditioning system. Here, although SWHs do not reduce demand peaks,27 to make the results more comparable to the other technologies, we have still used AC to form the baseline. Thus, to assess the impact of SWHs, we modelled 20% of the 50% of households that have electric storage water heaters (leaving 30%) installing SWHs and taking up AC. ‘Other customers’ are taken to be those who have electric storage water heaters but don’t install a SWH or AC.
The first and second order impacts on both the ‘Responsible customer’ and the ‘Other customers’, where the ‘Responsible customer’ is on a Standard tariff, are summarised in Figure 41 and Figure 42, where the DNSPs are regulated under a WAPC and revenue cap respectively.28 Details of the changes to the transmission, distribution and retail components for the ‘Responsible customer’ first order impacts are shown in Table 32. These details of the second and third order impacts for both the ‘Responsible customer’ and the ‘Other customers’ are shown in Section 6.10 of Appendix A.
Whereas the other technology assessments in this report are applied to an average customer without AC, in this case the SWH assessment is applied to a customer that is both without AC and has an electric storage water heater. Thus, in order to help illustrate the impacts of the SWH, Table 31 shows the annual bill of such a customer, and Table 33 shows the first order changes to the transmission, distribution and retail components for the ‘Responsible customer’ after only AC has been installed.
First order impacts
Installing a SWH significantly reduces the ‘Responsible customers’ bill, although by less than a 2.5kW PV system does. It can be seen from Table 33 that if the customer installs only an AC then the
27 Where a SWH replaces an instant electric water heater it would reduce peak demand however this would apply to only a very small proportion of households.
28 In this case the ‘with AC only’ baseline values had to be recalculated for a customer with a storage water heater, and the second and third order impacts for this type of ‘Responsible customer’ are shown in Section 6.11 of Appendix A.

49
TUOS charges increase significantly and the retail charges also increase. Addition of the SWH significantly reduces both these because they make up most of the controlled load tariffs.
Second order impacts
As occurred for PV, there is only a very small increase in costs, with ‘Other customers’ bills increasing by $18/yr (WAPC) and $20/yr (revenue cap). Because the SWHs modelled here reduce off-peak electricity use, they do not have any impact on demand peaks and so (i) placing the ‘Responsible customers’ who install SWHs on either TOU tariffs or Demand charges makes no difference to the outcome, and (ii) and there are no third order impacts directly attributable to the SWH. The third order impacts in the figures below are due to the AC systems.
Figure 41. First and Second order annual bill impacts under a WAPC: Standard tariff, 20% more households install both AC and SWH (semi transparent columns are AC alone)
Figure 42. First and Second order annual bill impacts under a Revenue cap: Standard tariff, 20% more households install both AC and SWH (semi transparent columns are AC alone)
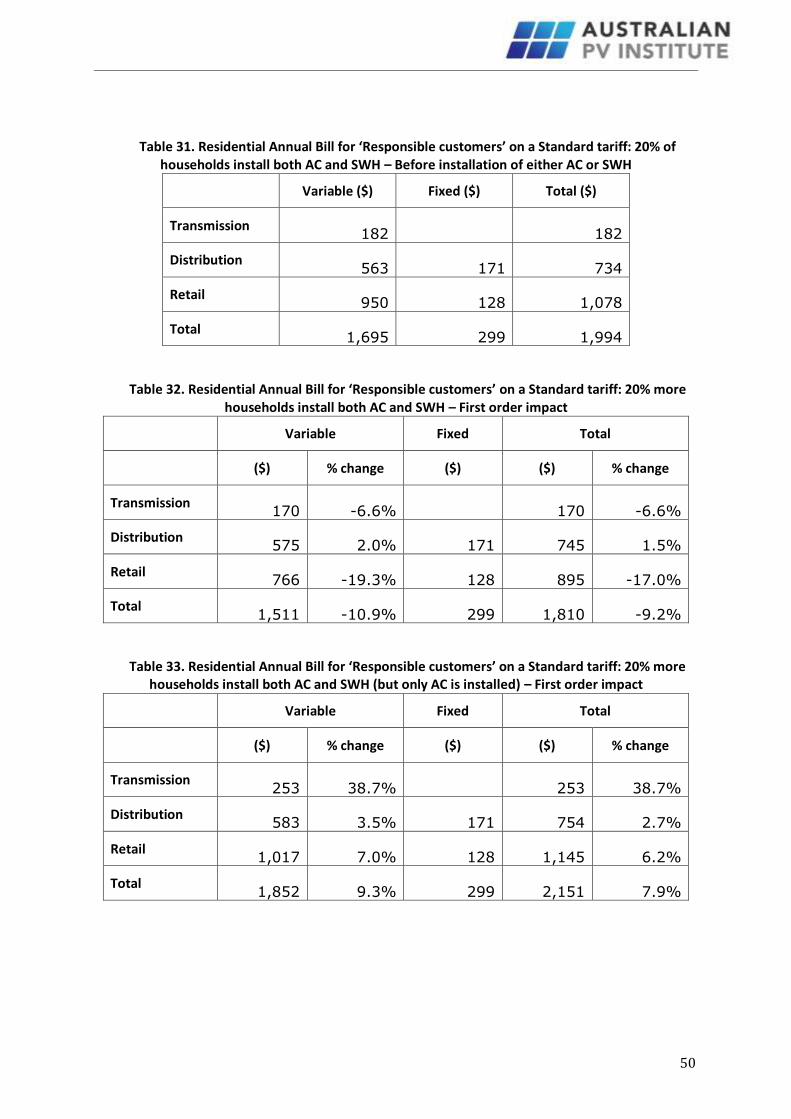
50
Table 31. Residential Annual Bill for ‘Responsible customers’ on a Standard tariff: 20% of households install both AC and SWH – Before installation of either AC or SWH
Variable ($) Fixed ($) Total ($)
Transmission 182 182
Distribution 563 171 734
Retail 950 128 1,078
Total 1,695 299 1,994
Table 32. Residential Annual Bill for ‘Responsible customers’ on a Standard tariff: 20% more households install both AC and SWH – First order impact
Variable Fixed Total
($) % change ($) ($) % change
Transmission 170 -6.6% 170 -6.6%
Distribution 575 2.0% 171 745 1.5%
Retail 766 -19.3% 128 895 -17.0%
Total 1,511 -10.9% 299 1,810 -9.2%
Table 33. Residential Annual Bill for ‘Responsible customers’ on a Standard tariff: 20% more households install both AC and SWH (but only AC is installed) – First order impact
Variable Fixed Total
($) % change ($) ($) % change
Transmission 253 38.7% 253 38.7%
Distribution 583 3.5% 171 754 2.7%
Retail 1,017 7.0% 128 1,145 6.2%
Total 1,852 9.3% 299 2,151 7.9%

51
3.5.1. AC + SWH Summary
Figure 43 summarises the impacts on ‘Other customers’ when the ‘responsible customer’ installs either AC or AC and a SWH. The key outcome is:
- When the DNSP is regulated under either a WAPC or a revenue cap, SWHs increase the increase caused by AC. This is because SWHs reduce both TNSP and DNSP income but do not reduce demand peaks.
Figure 43. Third order annual bill impacts on ‘Other customers’, where 20% of households install both AC and a SWH
3.6. AC + 20% demand reduction
Here, 20% of customers use a combination of energy efficiency measures to reduce their demand by 20% spread evenly across the day ie. each half hour period is reduced by 20%. Again, as discussed in Section 3, in order to illustrate reductions in peak demand driven by such measures, we superimpose them on the impact of installing an air conditioning system. The following sections separately assess the impacts for a Standard tariff, a TOU tariff and a Demand charge tariff. Section 3.6.4 then summarises these outcomes.
3.6.1. AC + 20% demand reduction with a Standard tariff
The first, second and third order impacts on both the ‘Responsible customer’ and the ‘Other customers’, all on a Standard tariff, are summarised in Figure 44 and Figure 45, where the DNSPs are regulated under a WAPC and a revenue cap respectively. Details of the changes to the transmission, distribution and retail components for the ‘Responsible customer’ first order impacts are shown in Table 34. These details of the second and third order impacts for both the ‘Responsible customer’ and the ‘Other customers’ are shown in Section 6.12 of Appendix A.

52
First order impacts
The 20% demand reduction helps the ‘Responsible customers’ to significantly reduce their bill. Transmission charges are affected the most because they have an increasing block tariff.
Second order impacts
Compared to having AC alone, ‘Other customers’ bills increase by $2/yr (WAPC) and $25/yr (revenue cap) because of the need to increase network tariffs to offset the impact of reduced sales.
Third order impacts
After the third order impacts are taken into account, the ‘Other customers’ bill is now $2/yr lower (WAPC) and $11/yr higher (revenue cap) than they would have been if demand hadn’t been reduced.
Figure 44. First, Second and Third order annual bill impacts under a WAPC: Standard tariff, 20% more households install AC and undertake a 20% demand reduction (semi transparent columns are
AC alone)

53
Figure 45. First, Second and Third order annual bill impacts under a Revenue cap: Standard tariff, 20% more households install AC and undertake a 20% demand reduction (semi transparent
columns are AC alone)
Table 34. Residential Annual Bill for ‘Responsible customers’ on a Standard tariff: 20% more households install AC and undertake a 20% demand reduction, (incl. GST) – First order impact
Variable Fixed Total
($) % change cf normal demand
($) ($) % change cf normal demand
Transmission 108 -10.6% 108 -10.6%
Distribution 511 -8.2% 165 676 -6.4%
Retail 712 -6.8% 128 840 -5.8%
Total 1,331 -7.6% 293 1,624 -6.3%
3.6.2. AC + 20% demand reduction with TOU tariff
The first, second and third order impacts on both the ‘Responsible customer’ and the ‘Other customers’, where the ‘Responsible customer’ is on a TOU tariff, are summarised in Figure 46, where the DNSPs are regulated under a revenue cap.29 Details of the changes to the transmission, distribution and retail components for the ‘Responsible customer’ first order impacts are shown in Table 35. These details of the second and third order impacts for both the ‘Responsible customer’ and the ‘Other customers’ are shown in Section 6.13 of Appendix A.
29 For the reasons stated above, where the ‘Responsible customer’ is on a TOU tariff, we have not assessed the outcome under a WAPC.

54
First order impacts
If the ‘Responsible customer’ is placed on a TOU tariff, their costs increase compared to being on a Standard tariff because the 20% demand reduction isn’t enough to overcome the impact of the AC during the peak demand periods.
Second order impacts
Compared to having AC alone, ‘Other customers’ bills increase by $4/yr (WAPC) and $22/yr (revenue cap) because of the need to increase network tariffs to offset the impact of reduced sales. These are similar increases to under a Standard tariff because most of the increase under a TOU is due to the AC unit.
Third order impacts
After the third order impacts are taken into account, the ‘Other customers’ bill is now $12/yr lower (WAPC) and $7/yr higher (revenue cap) than they would have been if demand hadn’t been reduced, and $24/yr lower (WAPC), and $10/yr higher (revenue cap), than when the ‘Responsible customer’ was on a Standard tariff. The ‘Responsible customers’ annual bill is now $152/yr (WAPC) and $168/yr (revenue cap) higher than when they were on a Standard tariff
Figure 46. First, Second and Third order annual bill impacts under a WAPC: TOU tariff, 20% more households install AC and undertake a 20% demand reduction (semi transparent columns are
AC alone)

55
Figure 47. First, Second and Third order annual bill impacts under a Revenue cap: TOU tariff, 20% more households install AC and undertake a 20% demand reduction (semi transparent
columns are AC alone)
Table 35. Residential Annual Bill for ‘Responsible customers’ on a TOU tariff: 20% more households install AC and undertake a 20% demand reduction – First order impact
Variable Fixed Total
($) % change cf normal demand
($) ($) % change cf normal demand
Transmission 241 99.4% 241 99.4%
Distribution 322 -42.2% 214 536 -25.7%
Retail 926 21.2% 112 1,038 16.4%
Total 1,489 3.3% 326 1,815 4.6%
3.6.3. AC + 20% demand reduction with a Demand charge tariff
The first, second and third order impacts on both the ‘Responsible customer’ and the ‘Other customers’, where the ‘Responsible customer’ is on a demand charge tariff, are summarised in Figure 48 and Figure 49, where the DNSPs are regulated under a WAPC and a revenue cap respectively. Details of the changes to the transmission, distribution and retail components for the ‘Responsible customer’ first order impacts are shown in Table 36. These details of the second and third order impacts for both the ‘Responsible customer’ and the ‘Other customers’ are shown in Section 6.14 of Appendix A.

56
First order impacts
If the ‘Responsible customer’ is placed on a Demand tariff, their costs are almost unchanged, indicating that the 20% demand reduction has cancelled out the impact of the AC. However, note that this is the result of higher DUOS charges and lower TUOS and retail charges.
Second order impacts
The second order impacts under a WAPC are the same as for the Standard tariff because the TUOS charges are the same. However, under a revenue cap, the higher payments to DNSPs result in ‘Other customers’ bills being $33/yr less than under a Standard tariff, and $21/yr less than under a TOU tariff.
Third order impacts
After the third order impacts are taken into account, the ‘Other customers’ bill is now $2/yr lower (WAPC) and $32/yr higher (revenue cap) than they would have been if demand hadn’t been reduced, and the same as (WAPC), and $21/yr lower than (revenue cap), when the ‘Responsible customer’ was on a Standard tariff. The ‘Responsible customers’ annual bill is now $65/yr (WAPC) and $52/yr (revenue cap) higher than when they were on a Standard tariff.
Figure 48. First, Second and Third order annual bill impacts under a WAPC: Demand charge tariff, 20% more households install AC and undertake a 20% demand reduction (semi transparent
columns are AC alone)
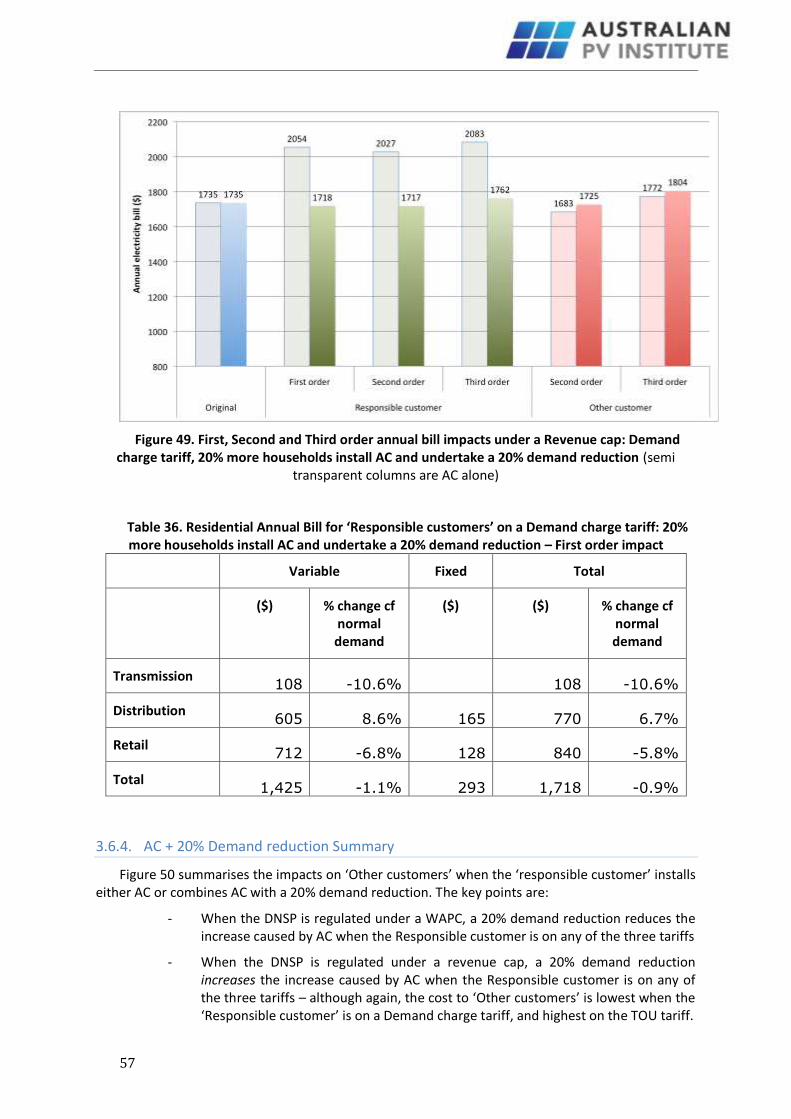
57
Figure 49. First, Second and Third order annual bill impacts under a Revenue cap: Demand charge tariff, 20% more households install AC and undertake a 20% demand reduction (semi
transparent columns are AC alone)
Table 36. Residential Annual Bill for ‘Responsible customers’ on a Demand charge tariff: 20% more households install AC and undertake a 20% demand reduction – First order impact
Variable Fixed Total
($) % change cf normal demand
($) ($) % change cf normal demand
Transmission 108 -10.6% 108 -10.6%
Distribution 605 8.6% 165 770 6.7%
Retail 712 -6.8% 128 840 -5.8%
Total 1,425 -1.1% 293 1,718 -0.9%
3.6.4. AC + 20% Demand reduction Summary
Figure 50 summarises the impacts on ‘Other customers’ when the ‘responsible customer’ installs either AC or combines AC with a 20% demand reduction. The key points are:
- When the DNSP is regulated under a WAPC, a 20% demand reduction reduces the increase caused by AC when the Responsible customer is on any of the three tariffs
- When the DNSP is regulated under a revenue cap, a 20% demand reduction increases the increase caused by AC when the Responsible customer is on any of the three tariffs – although again, the cost to ‘Other customers’ is lowest when the ‘Responsible customer’ is on a Demand charge tariff, and highest on the TOU tariff.

58
- ‘Other customers’ bills are significantly increased (relative to AC alone) when the Responsible customer is on a Demand tariff because the assumed 20% demand reduction is very effective at reducing their demand charge payment.
- In this case, the costs to the ‘Responsible customer’ are highest on a TOU tariff, followed by the Demand charge tariff then the Standard tariff.
Figure 50. Third order annual bill impacts on ‘Other customers’, where 20% of households install AC and undertake a 20% demand reduction
3.7. Price responsiveness
All the assessments above assume that consumers do not respond do price signals, and so do not take account of the fact that households may reduce their electricity use in response to different tariffs. The most important example in this case is the response by a household with AC to a TOU or demand charge tariff.
Both Frontier Economics (2012) and Deloitte (2012) have summarised the impacts of various tariffs on customer demand, both in Australia and internationally. There is a very marked range of responsiveness, in part because of the different tariff designs and in part because of the different customers’ circumstances.
Based on Frontier Economics (2012) and Deloitte (2012) we have assumed a 5% reduction in demand because of TOU and a 20% reduction because of a demand charge. This covers what is considered to be a realistic range of responses. The decrease in demand occurs at the same time as currently covered by the peak TOU rate and the demand charge.

59
3.7.1. AC with response to a TOU tariff
The first, second and third order impacts on both the ‘Responsible customer’ and the ‘Other customers’, where the ‘Responsible customer’ is on a TOU tariff and as a result reduces their demand during peak periods by 5%, are summarised in Figure 51 and Figure 52, where the DNSPs are regulated under a WAPC and a revenue cap respectively. Details of the changes to the transmission, distribution and retail components for the ‘Responsible customer’ first order impacts are shown in Table 37. These details of the second and third order impacts for both the ‘Responsible customer’ and the ‘Other customers’ are shown in Section 6.15 of Appendix A.
The ‘Responsible customers’ bill has decreased by only 2.1% compared to when there was no demand response. This has resulted in an insignificant change in the outcomes for ‘Other customers’; even after both second and third order impacts have been taken into account.
Figure 51. First, Second and Third order annual bill impacts under a Revenue cap: TOU tariff, 20% more households take up AC [with 5% demand response] (semi transparent columns are AC
alone)

60
Figure 52. First, Second and Third order annual bill impacts under a Revenue cap: TOU tariff, 20% more households take up AC [with 5% demand response] (semi transparent columns are AC
alone)
Table 37. Residential Annual Bill for ‘Responsible customers’ (have AC): TOU tariff, 20% Install AC - First order impact [with 5% demand response]
Variable Fixed Total
($) % change compared to ($) ($) % change compared to
Standard tariff no AC or DR
TOU no demand response
Standard tariff no AC or DR
TOU no demand response
Transmission 273 126.3% -3.5% 273 126.3% -3.5%
Distribution 388 -30.4% -3.2% 214 602 -16.6% -2.1%
Retail 1,081 41.6% -2.0% 112 1,193 33.8% -1.8%
Total 1,742 20.9% -2.5% 326 2,068 19.2% -2.1%
3.7.2. AC with response to a demand charge
The first, second and third order impacts on both the ‘Responsible customer’ and the ‘Other customers’, where the ‘Responsible customer’ is on a demand charge tariff, are summarised in Figure 53 and Figure 54, where the DNSPs are regulated under a WAPC and a revenue cap respectively. Details of the changes to the transmission, distribution and retail components for the ‘Responsible customer’ first order impacts are shown in Table 38. These details of the second and third order impacts for both the ‘Responsible customer’ and the ‘Other customers’ are shown in Section 6.16 of Appendix A.
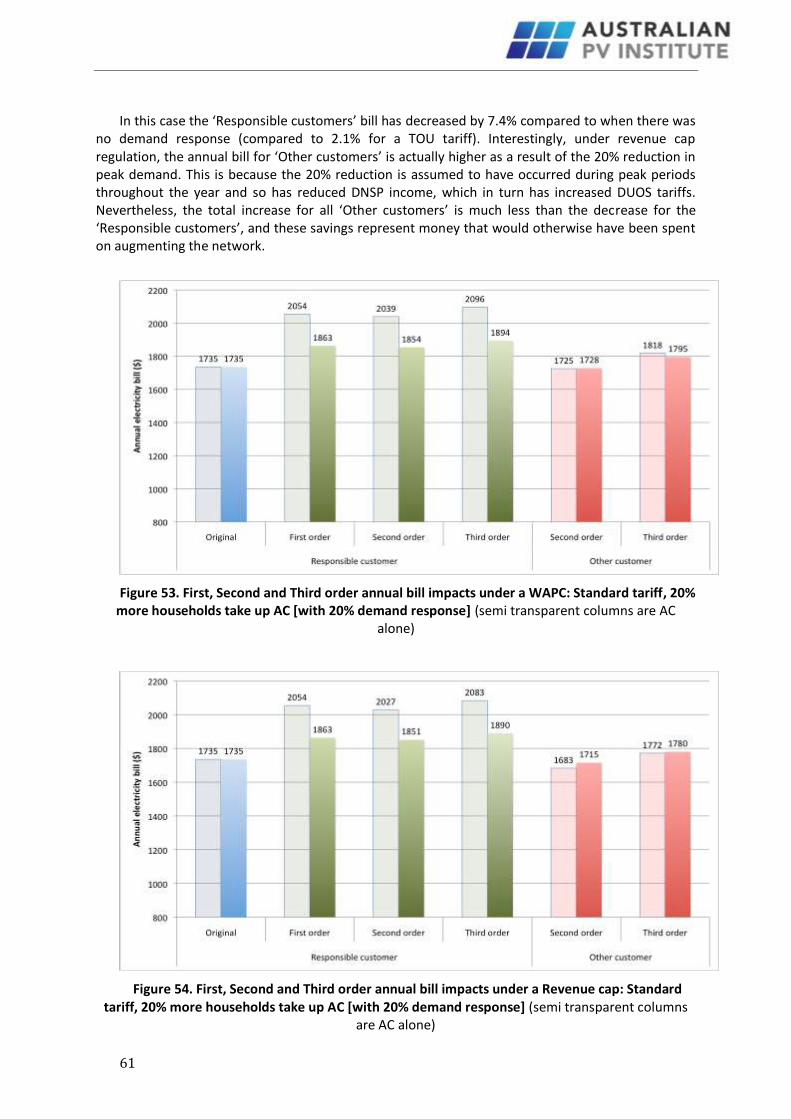
61
In this case the ‘Responsible customers’ bill has decreased by 7.4% compared to when there was no demand response (compared to 2.1% for a TOU tariff). Interestingly, under revenue cap regulation, the annual bill for ‘Other customers’ is actually higher as a result of the 20% reduction in peak demand. This is because the 20% reduction is assumed to have occurred during peak periods throughout the year and so has reduced DNSP income, which in turn has increased DUOS tariffs. Nevertheless, the total increase for all ‘Other customers’ is much less than the decrease for the ‘Responsible customers’, and these savings represent money that would otherwise have been spent on augmenting the network.
Figure 53. First, Second and Third order annual bill impacts under a WAPC: Standard tariff, 20% more households take up AC [with 20% demand response] (semi transparent columns are AC
alone)
Figure 54. First, Second and Third order annual bill impacts under a Revenue cap: Standard tariff, 20% more households take up AC [with 20% demand response] (semi transparent columns
are AC alone)
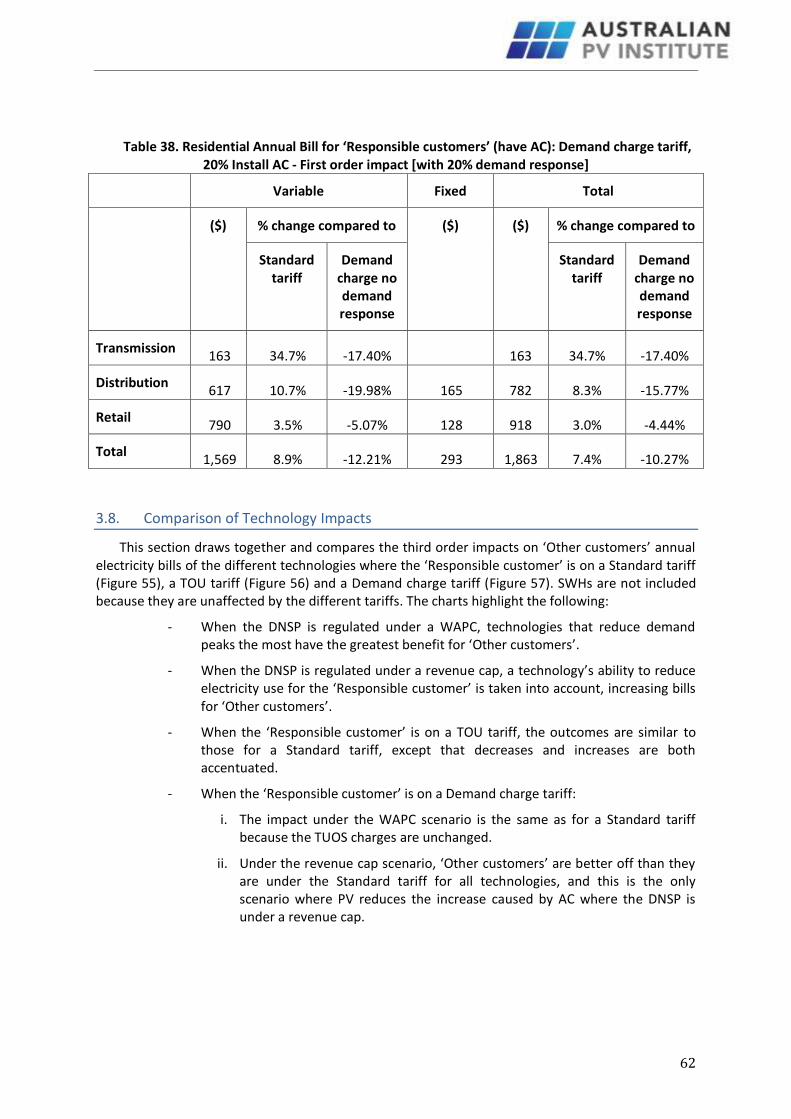
62
Table 38. Residential Annual Bill for ‘Responsible customers’ (have AC): Demand charge tariff, 20% Install AC - First order impact [with 20% demand response]
Variable Fixed Total
($) % change compared to ($) ($) % change compared to
Standard tariff
Demand charge no demand response
Standard tariff
Demand charge no demand response
Transmission 163 34.7% -17.40% 163 34.7% -17.40%
Distribution 617 10.7% -19.98% 165 782 8.3% -15.77%
Retail 790 3.5% -5.07% 128 918 3.0% -4.44%
Total 1,569 8.9% -12.21% 293 1,863 7.4% -10.27%
3.8. Comparison of Technology Impacts
This section draws together and compares the third order impacts on ‘Other customers’ annual electricity bills of the different technologies where the ‘Responsible customer’ is on a Standard tariff (Figure 55), a TOU tariff (Figure 56) and a Demand charge tariff (Figure 57). SWHs are not included because they are unaffected by the different tariffs. The charts highlight the following:
- When the DNSP is regulated under a WAPC, technologies that reduce demand peaks the most have the greatest benefit for ‘Other customers’.
- When the DNSP is regulated under a revenue cap, a technology’s ability to reduce electricity use for the ‘Responsible customer’ is taken into account, increasing bills for ‘Other customers’.
- When the ‘Responsible customer’ is on a TOU tariff, the outcomes are similar to those for a Standard tariff, except that decreases and increases are both accentuated.
- When the ‘Responsible customer’ is on a Demand charge tariff:
i. The impact under the WAPC scenario is the same as for a Standard tariff because the TUOS charges are unchanged.
ii. Under the revenue cap scenario, ‘Other customers’ are better off than they are under the Standard tariff for all technologies, and this is the only scenario where PV reduces the increase caused by AC where the DNSP is under a revenue cap.

63
Figure 55. Change to ‘Other Customers’ Annual Electricity Bill due to Third Order Impacts of Different Technologies, ‘Responsible Customer’ on a Standard tariff
Figure 56. Change to ‘Other Customers’ Annual Electricity Bill due to Third Order Impacts of Different Technologies, ‘Responsible Customer’ on a TOU tariff

64
Figure 57. Change to ‘Other Customers’ Annual Electricity Bill due to Third Order Impacts of Different Technologies, ‘Responsible Customer’ on a Demand charge tariff
3.9. Sensitivity analysis
The most significant limitation of this modelling is the use of a single load and PV output dataset. This is because the 61 houses used here are unlikely to be perfectly representative of the average NSW house, and the data spans only a single year.
The following assesses the impacts of:
i) using a different load and PV dataset, and
ii) changing the size of the PV system.
3.9.1. Load data
We have run the model using a different dataset of 270 houses obtained from Ausgrid.30 The following compares the outcomes for the Blacktown and ‘Ausgrid 270’ datasets for the four key findings of this report, and all are found to hold true for both datasets:
1. That under a TOU tariff, DNSPs receive less income than they would under a Standard tariff
2. That PV reduces the price impact of ACs on ‘Other customers’ under a WAPC
30 These data were obtained from 270 houses considered to have reliable load data from the 300 houses available at Ausgrid’s Solar Home Electricity Data website - http://www.ausgrid.com.au/Common/About-us/Sharing-information/Data-to-share/Solar-household-data.aspx#.Un4NeeBibdl

65
3. That under revenue cap regulation, placing a ‘Responsible customer’ that has AC on a Demand charge results in the lowest costs for ‘Other customers’, whereas a TOU tariff results in the highest costs
4. That PV reduces the impact of AC on ‘Other customers’ if the ‘Responsible customer’ is on a Demand charge tariff, under both WAPC and revenue cap regulation
1. DNSPs receive less income under a TOU tariff
Table 39 compares the changes to TNSP, DNSP and retailer income as a result of a customer31 moving from a Standard tariff to a TOU tariff. In both cases, although the income of both TNSPs and retailers increases significantly, DNSP income decreases. As discussed above, this is an unexpected outcome if TOU tariffs are intended to generate income for distribution networks. Note, however, that standards tariffs and TOU tariff structures vary across the country and the result below may not apply in all circumstances.
Table 39. Residential Annual Bill for ‘Responsible customers’: Baseline Outcomes, TOU compared to Standard tariff (incl. GST) – First order impact
Percentage change in income
Blacktown data
Ausgrid 270 data
Transmission 104.9% 169.0%
Distribution -22.9% -23.7%
Retail 23.1% 20.7%
Total 9.6% 9.6%
2. PV reduces the price impact of ACs
Figure 58 compares the third order impacts on ‘Other customers’ when the ‘Responsible customer’ installs either AC or AC+PV when the DNSP is regulated under a WAPC. This represents the current regulatory environment and so illustrates the impacts that AC and PV have been having to date. It can be seen that AC significantly increases costs for ‘Other customers’ and that PV reduces this impact. The smaller reduction seen for the Ausgrid 270 data is because only 11% and 43% of the PV rated capacity was available during the distribution and transmission network peaks respectively (compared to 20% and 54% for the Blacktown data).
31 The customer is without AC in this case, however this effect occurs with all customer types assessed.
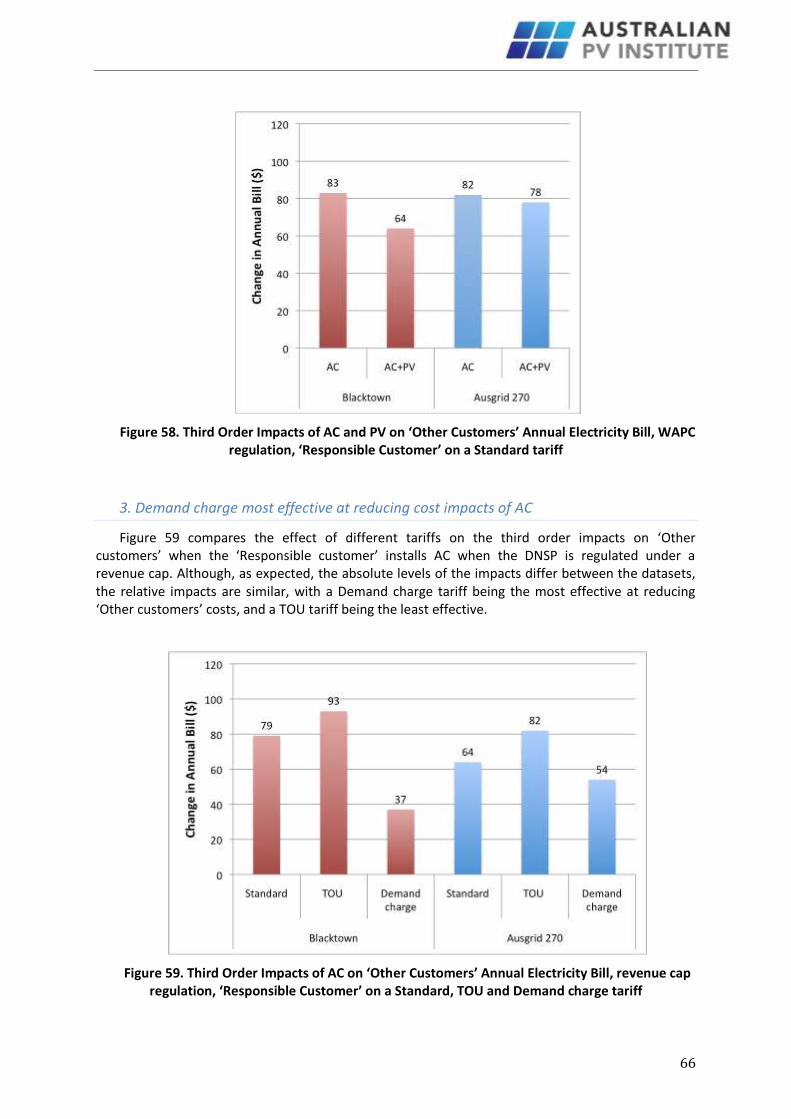
66
Figure 58. Third Order Impacts of AC and PV on ‘Other Customers’ Annual Electricity Bill, WAPC regulation, ‘Responsible Customer’ on a Standard tariff
3. Demand charge most effective at reducing cost impacts of AC
Figure 59 compares the effect of different tariffs on the third order impacts on ‘Other customers’ when the ‘Responsible customer’ installs AC when the DNSP is regulated under a revenue cap. Although, as expected, the absolute levels of the impacts differ between the datasets, the relative impacts are similar, with a Demand charge tariff being the most effective at reducing ‘Other customers’ costs, and a TOU tariff being the least effective.
Figure 59. Third Order Impacts of AC on ‘Other Customers’ Annual Electricity Bill, revenue cap regulation, ‘Responsible Customer’ on a Standard, TOU and Demand charge tariff
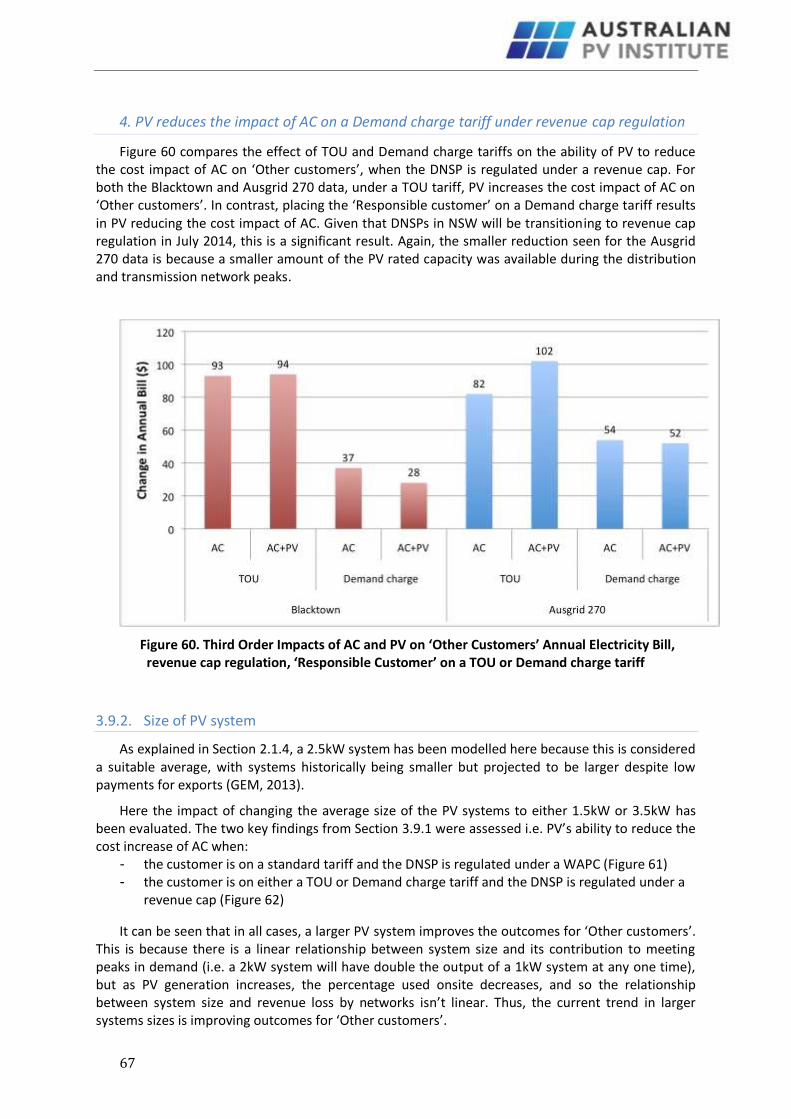
67
4. PV reduces the impact of AC on a Demand charge tariff under revenue cap regulation
Figure 60 compares the effect of TOU and Demand charge tariffs on the ability of PV to reduce the cost impact of AC on ‘Other customers’, when the DNSP is regulated under a revenue cap. For both the Blacktown and Ausgrid 270 data, under a TOU tariff, PV increases the cost impact of AC on ‘Other customers’. In contrast, placing the ‘Responsible customer’ on a Demand charge tariff results in PV reducing the cost impact of AC. Given that DNSPs in NSW will be transitioning to revenue cap regulation in July 2014, this is a significant result. Again, the smaller reduction seen for the Ausgrid 270 data is because a smaller amount of the PV rated capacity was available during the distribution and transmission network peaks.
Figure 60. Third Order Impacts of AC and PV on ‘Other Customers’ Annual Electricity Bill, revenue cap regulation, ‘Responsible Customer’ on a TOU or Demand charge tariff
3.9.2. Size of PV system
As explained in Section 2.1.4, a 2.5kW system has been modelled here because this is considered a suitable average, with systems historically being smaller but projected to be larger despite low payments for exports (GEM, 2013).
Here the impact of changing the average size of the PV systems to either 1.5kW or 3.5kW has been evaluated. The two key findings from Section 3.9.1 were assessed i.e. PV’s ability to reduce the cost increase of AC when:
- the customer is on a standard tariff and the DNSP is regulated under a WAPC (Figure 61) - the customer is on either a TOU or Demand charge tariff and the DNSP is regulated under a
revenue cap (Figure 62)
It can be seen that in all cases, a larger PV system improves the outcomes for ‘Other customers’. This is because there is a linear relationship between system size and its contribution to meeting peaks in demand (i.e. a 2kW system will have double the output of a 1kW system at any one time), but as PV generation increases, the percentage used onsite decreases, and so the relationship between system size and revenue loss by networks isn’t linear. Thus, the current trend in larger systems sizes is improving outcomes for ‘Other customers’.

68
Figure 61. Third Order Impacts of AC and PV on ‘Other Customers’ Annual Electricity Bill, WAPC regulation, ‘Responsible Customer’ on a Standard tariff, comparing different sized PV systems
Figure 62. Third Order Impacts of AC and PV on ‘Other Customers’ Annual Electricity Bill, revenue cap regulation, ‘Responsible Customer’ on a Standard, TOU or Demand charge tariff,
comparing different sized PV systems

69
4. Discussion The impact of different technologies installed by ‘Responsible customers’ on the costs faced by
‘Other customers’ is very dependent on whether the DNSP is regulated under a WAPC or a revenue cap. Under a WAPC, where a technology reduces electricity use (and therefore makes lower network payments), the cost is incurred by the DNSP. Under a revenue cap, this cost is passed through to all customers in the form of higher tariffs. DNSPs in Queensland are currently regulated under a revenue cap, and NSW is most likely changing to revenue cap regulation as of 1 July 2014. It is likely that other states will change to revenue cap regulation in their next Regulatory Determination periods.32
Claims that technologies such as PV have been increasing costs for ‘Other customers’ have been shown in this analysis to be incorrect in most States. Rather, they have resulted in decreasing revenues for DNSPs. The change to revenue cap regulation is considered necessary to protect DNSP revenues because they are responsible for maintaining an essential service. The ownership of most networks by state governments would presumably facilitate this decision. The APVI supports the transition of DNSPs to revenue cap regulation. However, this is only one of the steps needed to enable distributed energy to fully contribute to least-cost energy services. For a fully functional distributed energy market to be established, regulatory changes are required that will result in equal competition between supply and demand side options at all levels: generation, networks and retail. This is likely to require Integrated Resource Planning for network augmentation and replacement, as well as a range of other changes to enable equal competition on a day-to-day basis. A more detailed discussion of this issue can be found in Passey et al. (2013).
Once revenue cap regulation of DNSPs is in place, technologies such as PV may in fact very slightly increase costs for ‘Other customers’, however, as discussed below, this is entirely dependent on the type of tariff the ‘Responsible customer’ is on.
4.1. The impact of air conditioners
Under both WAPC and revenue cap regulation the installation of ACs increases costs for ‘Other customers’ because of increases to demand peaks and therefore network costs. The Productivity Commission’s estimate of the impact of ACs on system wide costs “represents an implicit subsidy of $350 per year to customers who own and use air conditioners at peak times, paid for through higher bills for all other customers” (PC, 2013a, p351).
In this analysis we estimate AC cross subsidies to be $260/yr for each customer that does not have AC in the WAPC scenario and $245/year in the revenue cap scenario. These are lower than the Productivity Commission’s value because, although we have used their values for the components of the cost impacts of increases to peak demand, these were only for transmission and distribution network costs, whereas the Productivity Commission’s $350/yr estimate included the costs of generation. In addition, the transmission and distribution network peaks occur at different times of the day (and commonly on different days), and so loads such as AC would make different degrees of contribution to these peaks. Nonetheless, it is clear there is a significant cross-subsidy to owners of AC systems. Had the merit order effect for generation been included in this modelling, the impact of AC on ‘Other customers’ would have been even greater.
32 SA’s next regulatory period starts on the 1 July 2015, Victoria’s on 1 Jan 2016 and Tasmania’s on 1 July 2017. Note that the revenue caps are reset each Regulatory Period. For this reason, competition is needed to ensure lowest cost options are implemented.
70
It is interesting to note that for the TOU tariff used here, the DNSP receives less income under a TOU tariff than under a Standard tariff, even when AC is installed. Given that ACs are responsible for a significant proportion of distribution network peaks, and TOU tariffs have been proposed to pay for the network costs driven by AC, this is an unexpected outcome. Although this type of TOU tariff may be better suited to commercial AC, where the peak coincides with the transmission network peak, it still would not help to increase income for DNSPs, and in fact may have a worse impact because more of the AC peak on a commercial building would occur during the shoulder period. As for residential loads, a demand charge approach, as already occurs for commercial users through their monthly kVA charge, provides the best price signal.
4.2. Photovoltaics
Under the current WAPC regulation, our research indicates it is likely that PV has been reducing the cost increases for ‘Other customers’ that have been driven by high AC uptake. However, this means that PV has been reducing revenue for DNSPs, which is likely to be unsustainable for them over the longer term under the current regulatory arrangements. This revenue reduction only occurs until the next Network Determination, when DNSPs could increase their tariffs and so earn more revenue – at which time the losses caused by reduced revenue due to PV systems would be passed onto ‘Other customers’ and so increase their costs. However, more than 95% of PV installations in Australia have occurred from 2010 onwards, which is within the current Network Determinations of all jurisdictions in the National Electricity Market except for Tasmania (which had very low levels of PV uptake in 2010). This means that, apart from Qld, the cost of reduced revenue has been borne to date by the DNSPs, not consumers.
Under revenue cap regulation, PV only minimally increases costs for ‘Other customers’ where the ‘Responsible customer’ is on a Standard tariff. Where they are on a TOU tariff, the increase is likely to be insignificant and, when on a demand charge tariff, PV again reduces costs for ‘Other customers’, without reducing revenue to DNSPs.
PV’s ability to reduce costs is entirely dependent on its ability to reduce demand at the annual peak. In the modelling used here, the peak demand reduction was based on actual data where 20% of the PV’s rated capacity was available during the distribution network peak.33 Using data provided by Ausgrid, the amount of PV capacity available on different distribution network peaks has been shown to vary from 11.8% to 48.5% (Ausgrid, 2011; Edis, 2013). This means that in some cases PV will be providing less value and in some cases more than the customer base used for this analysis.
PV’s correlation with residential demand peaks can be improved by being faced west, and it is also worth noting that PV has been shown to have value in helping networks meet demand peaks by pre-cooling transformers, making the correlation between demand and PV output less important (Jimenez et al, 2006).
Still, the need for PV to provide value to ‘Other customers’ by meeting demand peaks should be minimised as much as possible. This can be readily achieved where the ‘Responsible customer’ is on a Demand charge tariff, simply because in this case PV has little impact on DNSP’s expected income. This applies whether the ‘Responsible customer’ has an AC system or not.
PV’s ability to reduce demand peaks was modelled here by superimposing it on demand peaks caused by AC. This is justified to date because as PV installations have increased, so has AC. In fact, AC uptake is significantly higher than PV uptake to date. In the future, if total demand increases, PV
33 It was also based on 54% of the PV’s rated capacity being available during the transmission network peak. The level of capacity available at the transmission peak is greater because PV output has a much better match to this peak which occurs closer to the middle of the day. Variations in the capacity available during this peak have a smaller impact on bills because transmission costs make up a much smaller proportion of the bill than distribution costs (here found to be 7% and 41.5% respectively).

71
can be used to help reduce peaks and should be rewarded accordingly. If total demand does not increase, this would in part be due to PV, in which case utilities should be allowed and enabled to alter their business models to participate in the DE market. This issue is discussed in detail in Passey et al. (2013).
4.3. Other technologies
Under WAPC regulation, both PV+batteries and the 20% demand reduction scenario resulted in reduced costs for ‘Other customers’ under all tariff options. SHWs resulted in increases under all tariffs, simply because they reduce revenue to the DNSPs but don’t reduce demand peaks, and don’t alter demand during the periods when either TOU or demand charge tariffs have high components.
Under revenue cap regulation, all three technologies increased costs for ‘Other customers’. However, for the PV+battery scenario, the cost increase was greatest when the ‘Responsible customer’ was on a TOU tariff and lowest when they were on a Demand charge tariff – when the impact was only $15/yr for ‘Other customers’.
The cost impact on ‘Other customers’ of the 20% demand reduction scenario, as could occur because of any of the various State government energy efficiency schemes, was greater than for PV under both the WAPC and revenue cap scenarios for all three tariffs. Interestingly, its cost impact was greatest under the Demand charge tariff because it was assumed to decrease the annual demand charge by 20%. This indicates that a demand charge is likely to be most useful (in reducing costs for ‘Other customers’) for technologies that affect demand the most during peak demand periods, rather than throughout the load profile.
4.4. Demand charges
According to the analysis presented here, although TOU tariffs result in the lowest costs for ‘Other customers’ for all technologies when DNSPs are regulated under a WAPC, this is only because the DNSPs receive lower revenue than expected. Once DNSPs are regulated under a revenue cap, the Demand charge tariff results in the lowest costs for ‘Other customers’ for all technologies. A Demand charge tariff also has the benefit of PV reducing the costs faced by ‘Other customers’ where revenue cap regulation is in place.
A Demand charge tariff is most effective at reducing the cost impacts of AC and PV because it is capacity based (it provides a price signal to smooth or reduce annual demand peaks), whereas TOU tariffs are volume based (they increase DNSP revenue if demand increases during peak periods, but don’t have a particular emphasis on the annual peak). Demand charges are therefore most likely to encourage all consumers to smooth peak demand and thus reduce or defer investment in distribution networks.
As discussed above, targeted price signals such as demand charges have been found to result in greater demand reductions than TOU tariffs (Frontier Economics, 2012; Deloitte, 2012). This results in greater savings to customers, and these savings represent money that would otherwise have been spent on augmenting the network.
Thus, this research recommends a demand charge component be used in electricity bills, rather than the blunt instruments of fixed levies which have been proposed for PV customers. Such fixed charges provide no price signal for people to reduce demand peaks and are discriminatory. Demand charges will provide a more equitable outcome and will also cater for the full range of distributed energy options likely to be available in future, including demand management, energy efficiency, storage and electric vehicles. As discussed in Section 3.1.3, the demand charge a DNSP needs to apply to offset the LRMC of meeting the annual peak will be significantly less than the LRMC, and so will be less than the demand charge used in this report.

72
The demand charge tariff used here applied the charge across a very broad time period – from 2pm to 8pm, which is the same as the peak period for the TOU tariff. This could result in customers whose peak demand does not coincide with the network peak being penalised. While this would nevertheless serve to minimise customer peak demand generally, targeting a shorter time period would be more efficient. Ideally this time period could be network-specific, although this would also increase administrative costs for network operators.
If demand charges are to be used, it is critical that they are accompanied by an education campaign that lets households know how their bills will be impacted, and most importantly, what options they can use to reduce their demand peaks and therefore their bills.

73
5. References ABS, 2011, ‘1338.1 - NSW State and Regional Indicators, Dec 2010’, Australian Bureau of
Statistics, Jan 2011.
AECOM, 2012, ‘Renewable Energy Bonus Scheme - Solar Hot Water Program Evaluation’, for the Department of Climate Change and Energy Efficiency, 16 November 2012.
AEMC, 2011, ‘Possible Future Retail Electricity Price Movements: 1 July 2011 to 30 June 2014’, Final Report, Australian Energy Market Commission.
AEMC, 2012, ‘Final Report: Power of choice – giving consumers options in the way they use electricity’, Australian Energy Market Commission, 30 Nov 2012.
AEMC, 2013, ‘Electricity Price Trends Final Report: Possible future retail electricity price movements, 1 July 2012 to 30 June 2015’, Final Report, Australian Energy Market Commission.
AEMO, 2013, ‘National Electricity Forecasting Report: For the National Electricity Market, 2013’, by the Australian Energy Market Operator, June 2013.
AEMO, 2013a, ‘National Electricity Forecasting Report Update: For the National Electricity Market, 2013’, by the Australian Energy Market Operator, Nov 2013.
AER, 2013, ‘Stage 1 Framework and approach paper: Ausgrid, Endeavour Energy and Essential Energy’, the Australian Energy Regulator, March 2013.
AER, 2013a, ‘Stage 1 Framework and approach paper: ActewAGL’, the Australian Energy Regulator, March 2013.
APVA, 2013, ‘PV in Australia’, Australian PV Association, May 2013.
Ausgrid, 2011, ‘Effect of small solar Photovoltaic (PV) systems on network peak demand’, Research Paper, Ausgrid, Oct 2011.
Ausgrid, 2012, ‘Residential electricity prices and energy bills 2011/12 – Sydney vs Melbourne’, prepared by System Planning and Regulation, Demand Management and Sustainability, Ausgrid, April 2012.
CEC, 2013, ‘Clean Energy Australia Report 2012’, Clean Energy Council.
Deloitte, 2012, ‘Analysis of initiatives to lower peak demand, Final Report’, part of the Energy Supply Association of Australia’s submission to the Productivity Commission’s Electricity Network Regulation Issues paper, April 2012.
DRET, 2012, ‘Energy White Paper: Australia’s Energy Transformation’, Department of Resources, Energy and Tourism, Australian Government, Nov, 2012.
Edis, T., 2013, ‘Solar’s contribution to peak demand’, Climate Spectator, 24 Oct 2013.
Endeavour, 2010, Spreadsheet ‘110725-Website-Data-EnergyusebyLGA.xls’, from http://www.endeavourenergy.com.au/wps/wcm/connect/62ec978047f6b2babbbcbfe465570512/110725-Website-Data-EnergyusebyLGA.xls?MOD=AJPERES, accessed Nov 2013.
ESAA, 2013, ‘Who Pays for Solar Energy?’, Electricity Supply Association of Australia - http://www.esaa.com.au/Library/PageContentFiles/0ed86edb-b445-43f7-b1da-04dba6c4b4bf/Who_pays_for_solar_energy_17_May_2013.pdf

74
GEM, 2013, ‘Household Solar in Australia: State of the Small-scale Renewable Energy Scheme’, a report by Green Energy Markets for the REC Agents Association, Nov 2013.
IPART, 2010, ‘Review of regulated retail tariffs and charges for electricity 2010-2013, Electricity — Final Report’, Independent Pricing and Regulatory Tribunal, NSW Government, March 2010.
IPART, 2012, ‘Changes in regulated electricity retail prices from 1 July 2012, Electricity — Draft Report’, Independent Pricing and Regulatory Tribunal, NSW Government, April 2012.
IPART, 2013, ‘Review of regulated retail prices and charges for electricity, From 1 July 2013 to 30 June 2016, Electricity — Final Report’, Independent Pricing and Regulatory Tribunal, NSW Government, June 2013.
Jimenez, H., Calleja, H., Gonzalez, R., Huacuz, J. and Lagunas, J., 2006, The impact of photovoltaic systems on distribution transformer: A case study’, Energy Conversion & Management, 47, p311-321.
McConnell, D., Hearps, P., Eales, D., Sandiford, M., Dunn, R., Wright, M. and Bateman, L., 2013, ‘Retrospective modeling of the merit-order effect on wholesale electricity prices from distributed photovoltaic generation in the Australian National Electricity Market’, Energy Policy, in press.
Noone, B., 2013, ‘PV Integration on Australian Distribution Networks; A literature review’, Australian PV Association, Sept 2013.
Passey, R., Watt, M. and Morris, N. (2013), ‘A Distributed Energy Market: Consumer & Utility Interest, and the Regulatory Requirements’, a report by the Australian PV Association for the Australian Renewable Energy Agency.
PC, 2013, ‘Electricity Network Regulatory Frameworks’, Vol 1, Productivity Commission Inquiry Report, No. 62, 9 April 2013.
PC, 2013a, ‘Electricity Network Regulatory Frameworks’, Vol 2, Productivity Commission Inquiry Report, No. 62, 9 April 2013.
QCA, 2013, ‘Final Report: Estimating a Fair and Reasonable Solar Feed-in Tariff for Queensland’, the Queensland Competition Authority, March 2013.
Rheem, 2013, Running Cost Calculator, from http://www.rheem.com.au/runningcostcalculator accessed Sept 2013.
SSCEP, 2012, ‘Reducing energy bills and improving efficiency’ by the Senate Select Committee on Electricity Prices, Commonwealth of Australia, Nov 2012

75
6. Appendix A
6.1. Air conditioners, Standard tariff
DNSP WAPC
Table 40. Residential Annual Bill for ‘Responsible customers’ (have AC): Standard tariff, 20% Install AC - Second order impact
Variable Fixed Total
($) % change ($) ($) % change
Transmission 175 45.2% 175 45.2%
Distribution 577 3.5% 165 742 2.7%
Retail 830 8.8% 128 959 7.5%
Total 1,582 9.8% 293 1,876 8.1%
Table 41. Residential Annual Bill for ‘Responsible customers’ (have AC): Standard tariff, 20% Install AC - Third order impact
Variable Fixed Total
($) % change ($) ($) % change
Transmission 217 79.6% 217 79.6%
Distribution 637 14.3% 165 802 11.0%
Retail 830 8.8% 128 959 7.5%
Total 1,684 16.8% 293 1,977 14.0%

76
Table 42. Residential Annual Bill for ‘Other customers’ (do not have AC): Standard tariff, 20% Install AC - Second order impact
Variable Fixed Total
($) % change ($) ($) % change
Transmission 111 -8.3% 111 -8.3%
Distribution 557 0.0% 165 722 0.0%
Retail 763 0.0% 128 892 0.0%
Total 1,431 -0.7% 293 1,725 -0.6%
Table 43. Residential Annual Bill for ‘Other customers’ (do not have AC): Standard tariff, 20% Install AC - Third order impact
Variable Fixed Total
($) % change ($) ($) % change
Transmission 150 24.4% 150 24.4%
Distribution 611 9.7% 165 776 7.5%
Retail 763 0.0% 128 892 0.0%
Total 1,525 5.8% 293 1,818 4.8%
DNSP Revenue cap
Table 44. Residential Annual Bill for ‘Responsible customers’ (have AC): Standard tariff, 20% Install AC - Second order impact
Variable Fixed Total
($) % change ($) ($) % change
Transmission 175 45.2% 175 45.2%
Distribution 573 2.8% 165 738 2.2%
Retail 830 8.8% 128 959 7.5%
Total 1,578 9.5% 293 1,872 7.9%
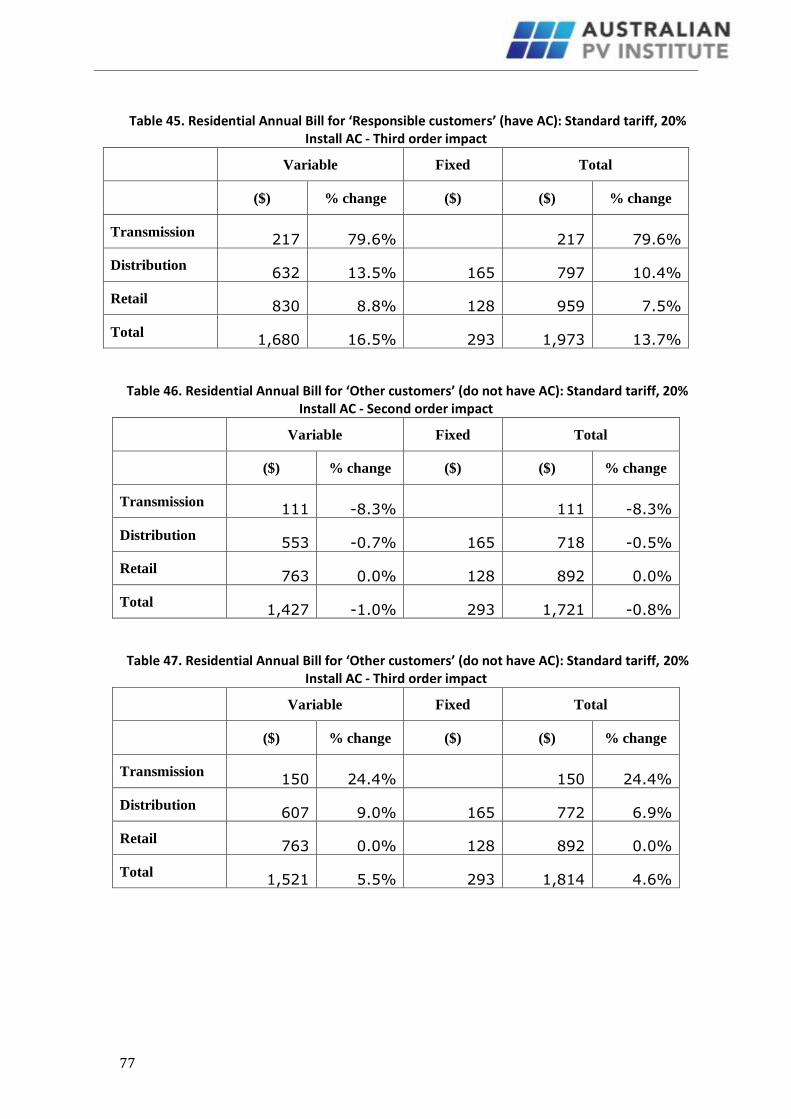
77
Table 45. Residential Annual Bill for ‘Responsible customers’ (have AC): Standard tariff, 20% Install AC - Third order impact
Variable Fixed Total
($) % change ($) ($) % change
Transmission 217 79.6% 217 79.6%
Distribution 632 13.5% 165 797 10.4%
Retail 830 8.8% 128 959 7.5%
Total 1,680 16.5% 293 1,973 13.7%
Table 46. Residential Annual Bill for ‘Other customers’ (do not have AC): Standard tariff, 20% Install AC - Second order impact
Variable Fixed Total
($) % change ($) ($) % change
Transmission 111 -8.3% 111 -8.3%
Distribution 553 -0.7% 165 718 -0.5%
Retail 763 0.0% 128 892 0.0%
Total 1,427 -1.0% 293 1,721 -0.8%
Table 47. Residential Annual Bill for ‘Other customers’ (do not have AC): Standard tariff, 20% Install AC - Third order impact
Variable Fixed Total
($) % change ($) ($) % change
Transmission 150 24.4% 150 24.4%
Distribution 607 9.0% 165 772 6.9%
Retail 763 0.0% 128 892 0.0%
Total 1,521 5.5% 293 1,814 4.6%

78
6.2. Air conditioners, TOU tariff
DNSP WAPC
Table 48. Residential Annual Bill for ‘Responsible customers’ (have AC): Standard tariff, 20% Install AC - Second order impact
Variable Fixed Total
($) % change ($) ($) % change
Transmission 234 94.1% 234 94.1%
Distribution 401 -28.0% 214 615 -14.8%
Retail 1,103 44.5% 112 1,215 36.2%
Total 1,738 20.6% 326 2,064 19.0%
Table 49. Residential Annual Bill for ‘Responsible customers’ (have AC): Standard tariff, 20% Install AC - Third order impact
Variable Fixed Total
($) % change ($) ($) % change
Transmission 272 125.1% 272 125.1%
Distribution 461 -17.2% 214 675 -6.5%
Retail 1,103 44.5% 112 1,215 36.2%
Total 1,836 27.4% 326 2,162 24.6%
Table 50. Residential Annual Bill for ‘Other customers’ (do not have AC): Standard tariff, 20% Install AC - Second order impact
Variable Fixed Total
($) % change ($) ($) % change
Transmission
100
-
17.2% 100
-
17.2%
Distribution 557 0.0% 165 722 0.0%
Retail 763 0.0% 128 892 0.0%
Total 1,420 -1.4% 293 1,714 -1.2%

79
Table 51. Residential Annual Bill for ‘Other customers’ (do not have AC): Standard tariff, 20% Install AC - Third order impact
Variable Fixed Total
($) % change ($) ($) % change
Transmission 136 12.3% 136 12.3%
Distribution 611 9.7% 165 776 7.5%
Retail 763 0.0% 128 892 0.0%
Total 1,510 4.8% 293 1,804 4.0%
DNSP Revenue cap
Table 52. Residential Annual Bill for ‘Responsible customers’ (have AC): TOU tariff, 20% Install AC - Second order impact
Variable Fixed Total
($) % change ($) ($) % change
Transmission 234 94.1% 234 94.1%
Distribution 417 -25.1% 214 631 -12.6%
Retail 1,103 44.5% 112 1,215 36.2%
Total 1,754 21.7% 326 2,080 19.9%
Table 53. Residential Annual Bill for ‘Responsible customers’ (have AC): TOU tariff, 20% Install AC - Third order impact
Variable Fixed Total
($) % change ($) ($) % change
Transmission 272 125.1% 272 125.1%
Distribution 479 -13.9% 214 694 -3.9%
Retail 1,103 44.5% 112 1,215 36.2%
Total 1,854 28.6% 326 2,180 25.7%

80
Table 54. Residential Annual Bill for ‘Other customers’ (do not have AC): TOU tariff, 20% Install AC - Second order impact
Variable Fixed Total
($) % change ($) ($) % change
Transmission 100 -17.2% 100 -17.2%
Distribution 579 4.0% 165 744 3.1%
Retail 763 0.0% 128 892 0.0%
Total 1,443 0.1% 293 1,736 0.1%
Table 55. Residential Annual Bill for ‘Other customers’ (do not have AC): TOU tariff, 20% Install AC - Third order impact
Variable Fixed Total
($) % change ($) ($) % change
Transmission 136 12.3% 136 12.3%
Distribution 636 14.1% 165 801 10.9%
Retail 763 0.0% 128 892 0.0%
Total 1,535 6.5% 293 1,828 5.4%
6.3. Air conditioners, Demand charge tariff
DNSP WAPC
Table 56. Residential Annual Bill for ‘Responsible customers’ (have AC): Demand charge tariff, 20% Install AC - Second order impact
Variable Fixed Total
($) % change ($) ($) % change
Transmission 175 45.2% 175 45.2%
Distribution 740 32.8% 165 905 25.3%
Retail 830 8.8% 128 959 7.5%
Total 1,745 21.1% 293 2,039 17.5%

81
Table 57. Residential Annual Bill for ‘Responsible customers’ (have AC): Demand charge tariff, 20% Install AC - Third order impact
Variable Fixed Total
($) % change ($) ($) % change
Transmission 217 79.6% 217 79.6%
Distribution 756 35.7% 165 921 27.5%
Retail 830 8.8% 128 959 7.5%
Total 1,803 25.1% 293 2,096 20.9%
Table 58. Residential Annual Bill for ‘Other customers’ (do not have AC): Demand charge tariff, 20% Install AC - Second order impact
Variable Fixed Total
($) % change ($) ($) % change
Transmission 111 -8.3% 111 -8.3%
Distribution 557 0.0% 165 722 0.0%
Retail 763 0.0% 128 892 0.0%
Total 1,431 -0.7% 293 1,725 -0.6%
Table 59. Residential Annual Bill for ‘Other customers’ (do not have AC): Demand charge tariff, 20% Install AC - Third order impact
Variable Fixed Total
($) % change ($) ($) % change
Transmission 150 24.4% 150 24.4%
Distribution 611 9.7% 165 776 7.5%
Retail 763 0.0% 128 892 0.0%
Total 1,525 5.8% 293 1,818 4.8%

82
DNSP Revenue cap
Table 60. Residential Annual Bill for ‘Responsible customers’ (have AC): Demand charge tariff, 20% Install AC - Second order impact
Variable Fixed Total
($) % change ($) ($) % change
Transmission 175 45.2% 175 45.2%
Distribution 728 30.7% 165 893 23.7%
Retail 830 8.8% 128 959 7.5%
Total 1,734 20.3% 293 2,027 16.9%
Table 61. Residential Annual Bill for ‘Responsible customers’ (have AC): Demand charge tariff, 20% Install AC - Third order impact
Variable Fixed Total
($) % change ($) ($) % change
Transmission 217 79.6% 217 79.6%
Distribution 743 33.4% 165 908 25.7%
Retail 830 8.8% 128 959 7.5%
Total 1,790 24.2% 293 2,083 20.1%
Table 62. Residential Annual Bill for ‘Other customers’ (do not have AC): Demand charge tariff, 20% Install AC - Second order impact
Variable Fixed Total
($) % change ($) ($) % change
Transmission 111 -8.3% 111 -8.3%
Distribution 515 -7.5% 165 680 -5.8%
Retail 763 0.0% 128 892 0.0%
Total 1,389 -3.6% 293 1,683 -3.0%

83
Table 63. Residential Annual Bill for ‘Other customers’ (do not have AC): Demand charge tariff, 20% Install AC - Third order impact
Variable Fixed Total
($) % change ($) ($) % change
Transmission 150 24.4% 150 24.4%
Distribution 565 1.5% 165 730 1.2%
Retail 763 0.0% 128 892 0.0%
Total 1,479 2.6% 293 1,772 2.2%
6.4. AC + PV, Standard tariff
DNSP WAPC
Table 64. Residential Annual Bill for ‘Responsible customers’: 20% of households install both AC and 2.5kW PV, Standard tariff – Second order impact
Variable Fixed Total
($) % change cf
Standard
tariff
($) ($) % change cf
Standard
tariff
Transmission 84 -30.4% 84 -30.4%
Distribution 442 -20.7% 165 607 -16.0%
Retail 628 -17.8% 128 756 -15.2%
Total 1,154 -20.0% 293 1,447 -16.6%
Exported PV 123
Total minus PV - 1,324 -23.7%

84
Table 65. Residential Annual Bill for ‘Responsible customers’: 20% of households install both AC and 2.5kW PV, Standard tariff – Third order impact
Variable Fixed Total
($) % change cf
Standard
tariff
($) ($) % change cf
Standard
tariff
Transmission 106 -12.0% 106 -12.0%
Distribution 468 -15.9% 165 633 -12.3%
Retail 628 -17.8% 128 756 -15.2%
Total 1,202 -16.6% 293 1,495 -13.8%
Exported PV 123
Total minus PV - 1,373 -20.9%
Table 66. Residential Annual Bill for ‘Other customers’: 20% of households install both AC and 2.5kW PV, Standard tariff – Second order impact
Variable Fixed Total
($) % change cf
Standard
tariff
($) ($) % change cf
Standard
tariff
Transmission 127 5.6% 127 5.6%
Distribution 557 0.0% 165 722 0.0%
Retail 763 0.0% 128 892 0.0%
Total 1,448 0.5% 293 1,741 0.4%

85
Table 67. Residential Annual Bill for ‘Other customers’: 20% of households install both AC and 2.5kW PV, Standard tariff – Third order impact
Variable Fixed Total
($) % change cf
Standard
tariff
($) ($) % change cf
Standard
tariff
Transmission 150 24.2% 150 24.2%
Distribution 592 6.3% 165 757 4.9%
Retail 763 0.0% 128 892 0.0%
Total 1,506 4.5% 293 1,799 3.7%
DNSP Revenue cap
Table 68. Residential Annual Bill for ‘Responsible customers’: 20% of households install both AC and 2.5kW PV – Second order impact
Variable Fixed Total
($) % change ($) ($) % change
Transmission 84 -30.4% 84
-
30.4%
Distribution 461 -17.3% 165 625
-
13.4%
Retail 628 -17.8% 128 756
-
15.2%
Total 1,172 -18.7% 293 1,466
-
15.5%
Exported PV 123
Total minus PV - 1,343
-
22.6%
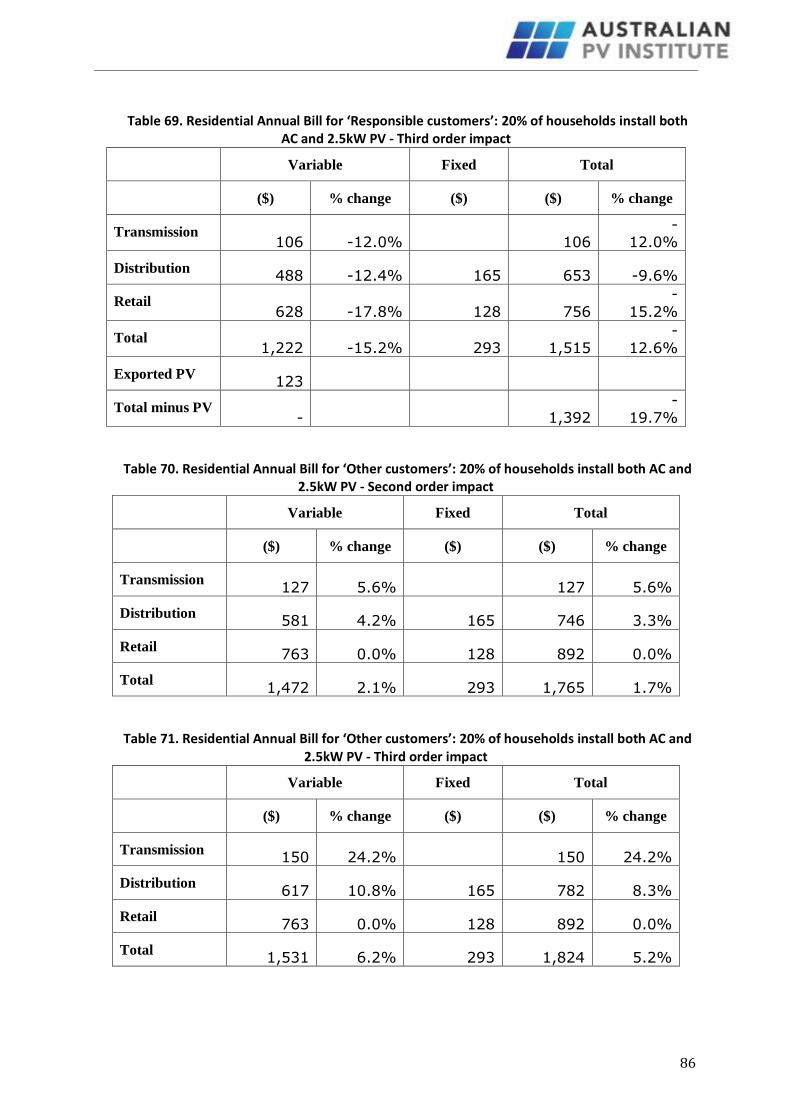
86
Table 69. Residential Annual Bill for ‘Responsible customers’: 20% of households install both AC and 2.5kW PV - Third order impact
Variable Fixed Total
($) % change ($) ($) % change
Transmission 106 -12.0% 106
-12.0%
Distribution 488 -12.4% 165 653 -9.6%
Retail 628 -17.8% 128 756
-
15.2%
Total 1,222 -15.2% 293 1,515
-12.6%
Exported PV 123
Total minus PV - 1,392
-19.7%
Table 70. Residential Annual Bill for ‘Other customers’: 20% of households install both AC and 2.5kW PV - Second order impact
Variable Fixed Total
($) % change ($) ($) % change
Transmission 127 5.6% 127 5.6%
Distribution 581 4.2% 165 746 3.3%
Retail 763 0.0% 128 892 0.0%
Total 1,472 2.1% 293 1,765 1.7%
Table 71. Residential Annual Bill for ‘Other customers’: 20% of households install both AC and 2.5kW PV - Third order impact
Variable Fixed Total
($) % change ($) ($) % change
Transmission 150 24.2% 150 24.2%
Distribution 617 10.8% 165 782 8.3%
Retail 763 0.0% 128 892 0.0%
Total 1,531 6.2% 293 1,824 5.2%

87
6.5. AC + PV, TOU tariff
DNSP WAPC
Table 72. Residential Annual Bill for ‘Responsible customers’ on a TOU tariff: 20% of households install both AC and 2.5kW PV – Second order impact
Variable Fixed Total
($) % change cf
Standard
tariff
($) ($) % change cf
Standard
tariff
Transmission 198 64.0% 198 64.0%
Distribution 273 -50.9% 214 488 -32.5%
Retail 793 3.8% 112 905 1.4%
Total 1,264 -12.3% 326 1,590 -8.3%
Exported PV 123
Total minus PV - 1,468 -15.4%
Table 73. Residential Annual Bill for ‘Responsible customers’ on a TOU tariff: 20% of households install both AC and 2.5kW PV – Third order impact
Variable Fixed Total
($) % change cf
Standard
tariff
($) ($) % change cf
Standard
tariff
Transmission 217 79.4% 217 79.4%
Distribution 300 -46.2% 214 514 -28.8%
Retail 793 3.8% 112 905 1.4%
Total 1,309 -9.2% 326 1,635 -5.7%
Exported PV 123
Total minus PV - 1,512 -12.8%
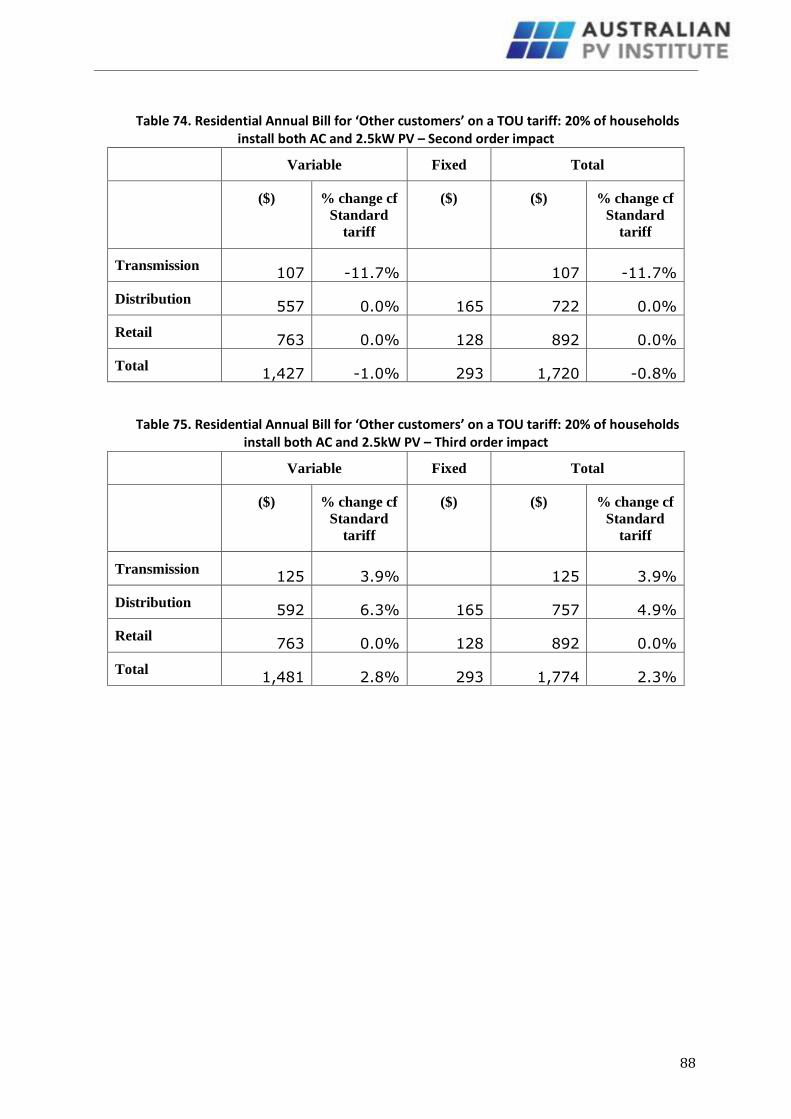
88
Table 74. Residential Annual Bill for ‘Other customers’ on a TOU tariff: 20% of households install both AC and 2.5kW PV – Second order impact
Variable Fixed Total
($) % change cf
Standard
tariff
($) ($) % change cf
Standard
tariff
Transmission 107 -11.7% 107 -11.7%
Distribution 557 0.0% 165 722 0.0%
Retail 763 0.0% 128 892 0.0%
Total 1,427 -1.0% 293 1,720 -0.8%
Table 75. Residential Annual Bill for ‘Other customers’ on a TOU tariff: 20% of households install both AC and 2.5kW PV – Third order impact
Variable Fixed Total
($) % change cf
Standard
tariff
($) ($) % change cf
Standard
tariff
Transmission 125 3.9% 125 3.9%
Distribution 592 6.3% 165 757 4.9%
Retail 763 0.0% 128 892 0.0%
Total 1,481 2.8% 293 1,774 2.3%

89
DNSP Revenue cap
Table 76. Residential Annual Bill for ‘Responsible customers’ on a TOU tariff: 20% of households install both AC and 2.5kW PV – Second order impact
Variable Fixed Total
($) % change ($) ($) % change
Transmission 198 64.0% 198 64.0%
Distribution 299 -46.4% 214 513 -29.0%
Retail 793 3.8% 112 905 1.4%
Total 1,289 -10.6% 326 1,615 -6.9%
Exported PV 123
Total minus PV - 1,493 -13.9%
Table 77. Residential Annual Bill for ‘Responsible customers’: 20% of households install both AC and 2.5kW PV - Third order impact
Variable Fixed Total
($) % change ($) ($) % change
Transmission 217 79.4% 217 79.4%
Distribution 327 -41.2% 214 542 -25.0%
Retail 793 3.8% 112 905 1.4%
Total 1,337 -7.3% 326 1,663 -4.1%
Exported PV 123
Total minus PV - 1,540 -11.2%
Table 78. Residential Annual Bill for ‘Other customers’: 20% of households install both AC and 2.5kW PV - Second order impact
Variable Fixed Total
($) % change ($) ($) % change
Transmission 107
-
11.7% 107
-
11.7%
Distribution 608 9.2% 165 773 7.1%
Retail 763 0.0% 128 892 0.0%
Total 1,478 2.6% 293 1,772 2.1%
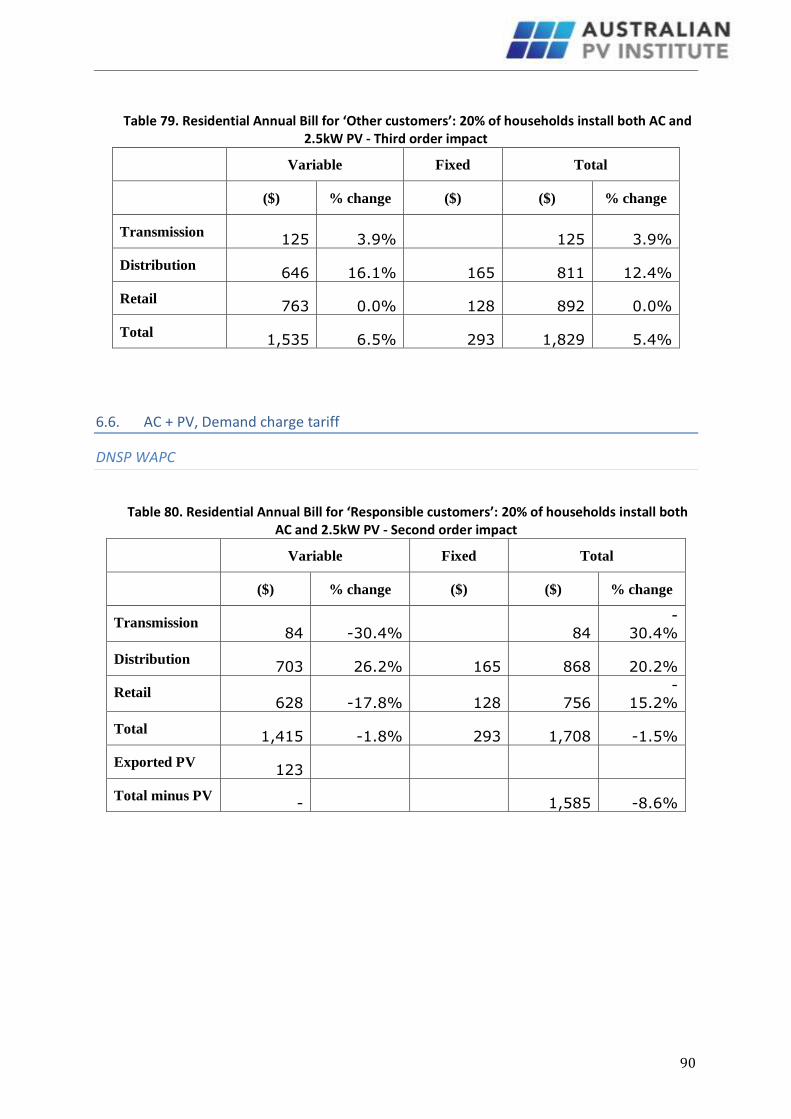
90
Table 79. Residential Annual Bill for ‘Other customers’: 20% of households install both AC and 2.5kW PV - Third order impact
Variable Fixed Total
($) % change ($) ($) % change
Transmission 125 3.9% 125 3.9%
Distribution 646 16.1% 165 811 12.4%
Retail 763 0.0% 128 892 0.0%
Total 1,535 6.5% 293 1,829 5.4%
6.6. AC + PV, Demand charge tariff
DNSP WAPC
Table 80. Residential Annual Bill for ‘Responsible customers’: 20% of households install both AC and 2.5kW PV - Second order impact
Variable Fixed Total
($) % change ($) ($) % change
Transmission 84 -30.4% 84
-
30.4%
Distribution 703 26.2% 165 868 20.2%
Retail 628 -17.8% 128 756
-
15.2%
Total 1,415 -1.8% 293 1,708 -1.5%
Exported PV 123
Total minus PV - 1,585 -8.6%

91
Table 81. Residential Annual Bill for ‘Responsible customers’: 20% of households install both AC and 2.5kW PV - Third order impact
Variable Fixed Total
($) % change ($) ($) % change
Transmission 106 -12.0% 106
-
12.0%
Distribution 710 27.5% 165 875 21.2%
Retail 628 -17.8% 128 756
-
15.2%
Total 1,444 0.2% 293 1,737 0.2%
Exported PV 123
Total minus PV - 1,615 -6.9%
Table 82. Residential Annual Bill for ‘Other customers’: 20% of households install both AC and 2.5kW PV - Second order impact
Variable Fixed Total
($) % change ($) ($) % change
Transmission 127 5.6% 127 5.6%
Distribution 557 0.0% 165 722 0.0%
Retail 763 0.0% 128 892 0.0%
Total 1,448 0.5% 293 1,741 0.4%
Table 83. Residential Annual Bill for ‘Other customers’: 20% of households install both AC and 2.5kW PV - Third order impact
Variable Fixed Total
($) % change ($) ($) % change
Transmission 150 24.2% 150 24.2%
Distribution 592 6.3% 165 757 4.9%
Retail 763 0.0% 128 892 0.0%
Total 1,506 4.5% 293 1,799 3.7%

92
DNSP Revenue cap
Table 84. Residential Annual Bill for ‘Responsible customers’: 20% of households install both AC and 2.5kW PV - Second order impact
Variable Fixed Total
($) % change ($) ($) % change
Transmission 84 -30.4% 84
-30.4%
Distribution 696 24.9% 165 861 19.2%
Retail 628 -17.8% 128 756
-
15.2%
Total 1,408 -2.3% 293 1,701 -1.9%
Exported PV 123
Total minus PV - 1,578 -9.0%
Table 85. Residential Annual Bill for ‘Responsible customers’: 20% of households install both AC and 2.5kW PV - Third order impact
Variable Fixed Total
($) % change ($) ($) % change
Transmission 106 -12.0% 106
-
12.0%
Distribution 703 26.1% 165 868 20.2%
Retail 628 -17.8% 128 756
-
15.2%
Total 1,437 -0.3% 293 1,730 -0.3%
Exported PV 123
Total minus PV - 1,607 -7.4%
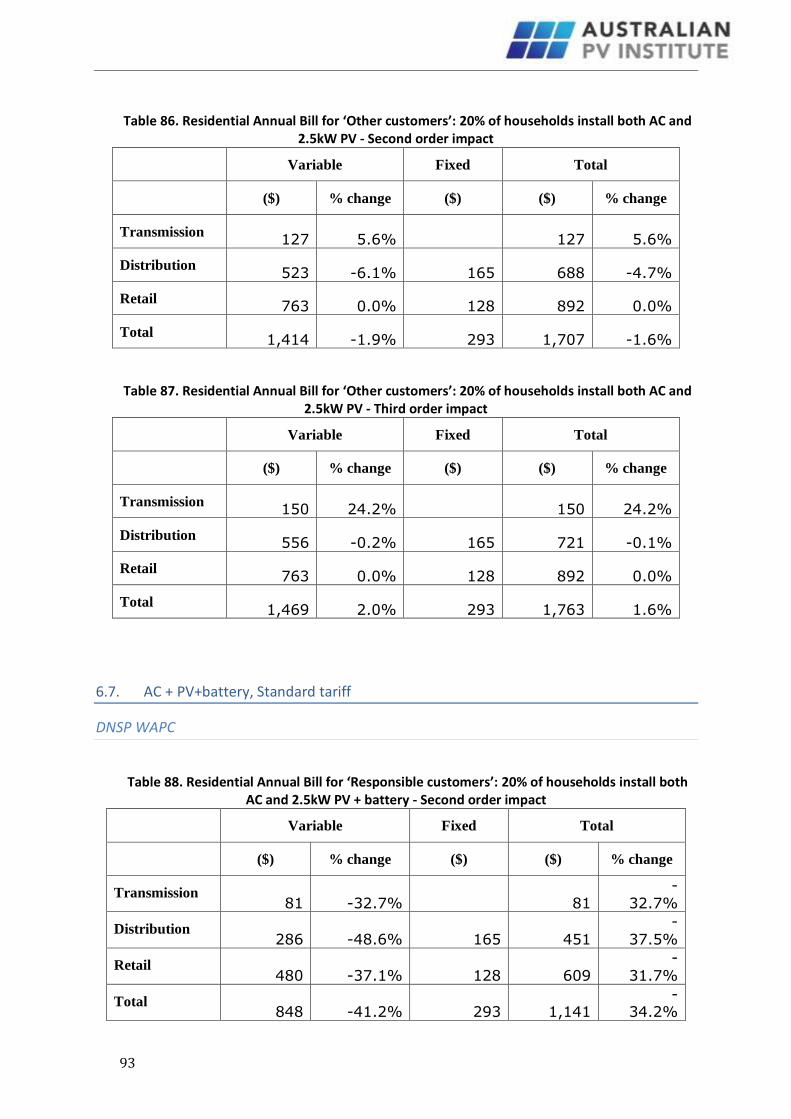
93
Table 86. Residential Annual Bill for ‘Other customers’: 20% of households install both AC and 2.5kW PV - Second order impact
Variable Fixed Total
($) % change ($) ($) % change
Transmission 127 5.6% 127 5.6%
Distribution 523 -6.1% 165 688 -4.7%
Retail 763 0.0% 128 892 0.0%
Total 1,414 -1.9% 293 1,707 -1.6%
Table 87. Residential Annual Bill for ‘Other customers’: 20% of households install both AC and 2.5kW PV - Third order impact
Variable Fixed Total
($) % change ($) ($) % change
Transmission 150 24.2% 150 24.2%
Distribution 556 -0.2% 165 721 -0.1%
Retail 763 0.0% 128 892 0.0%
Total 1,469 2.0% 293 1,763 1.6%
6.7. AC + PV+battery, Standard tariff
DNSP WAPC
Table 88. Residential Annual Bill for ‘Responsible customers’: 20% of households install both AC and 2.5kW PV + battery - Second order impact
Variable Fixed Total
($) % change ($) ($) % change
Transmission 81 -32.7% 81
-
32.7%
Distribution 286 -48.6% 165 451
-
37.5%
Retail 480 -37.1% 128 609
-
31.7%
Total 848 -41.2% 293 1,141
-34.2%

94
Table 89. Residential Annual Bill for ‘Responsible customers’: 20% of households install both AC and 2.5kW PV + battery - Third order impact
Variable Fixed Total
($) % change ($) ($) % change
Transmission 93 -23.0% 93
-
23.0%
Distribution 294 -47.2% 165 459
-
36.4%
Retail 480 -37.1% 128 609
-
31.7%
Total 868 -39.8% 293 1,161
-
33.1%
Table 90. Residential Annual Bill for ‘Other customers’: 20% of households install both AC and 2.5kW PV + battery - Second order impact
Variable Fixed Total
($) % change ($) ($) % change
Transmission 128 6.0% 128 6.0%
Distribution 557 0.0% 165 722 0.0%
Retail 763 0.0% 128 892 0.0%
Total 1,448 0.5% 293 1,742 0.4%
Table 91. Residential Annual Bill for ‘Other customers’: 20% of households install both AC and 2.5kW PV + battery - Third order impact
Variable Fixed Total
($) % change ($) ($) % change
Transmission 137 13.4% 137 13.4%
Distribution 577 3.6% 165 742 2.8%
Retail 763 0.0% 128 892 0.0%
Total 1,478 2.5% 293 1,771 2.1%
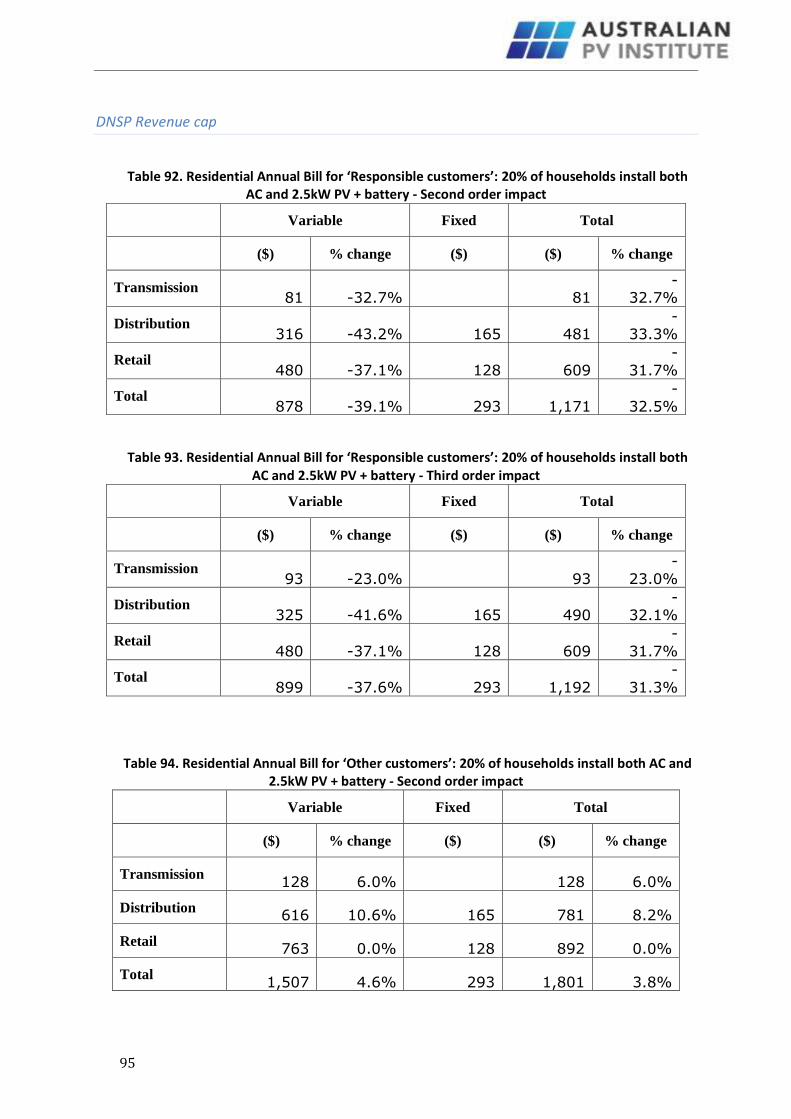
95
DNSP Revenue cap
Table 92. Residential Annual Bill for ‘Responsible customers’: 20% of households install both AC and 2.5kW PV + battery - Second order impact
Variable Fixed Total
($) % change ($) ($) % change
Transmission 81 -32.7% 81
-32.7%
Distribution 316 -43.2% 165 481
-
33.3%
Retail 480 -37.1% 128 609
-
31.7%
Total 878 -39.1% 293 1,171
-
32.5%
Table 93. Residential Annual Bill for ‘Responsible customers’: 20% of households install both AC and 2.5kW PV + battery - Third order impact
Variable Fixed Total
($) % change ($) ($) % change
Transmission 93 -23.0% 93
-
23.0%
Distribution 325 -41.6% 165 490
-
32.1%
Retail 480 -37.1% 128 609
-
31.7%
Total 899 -37.6% 293 1,192
-
31.3%
Table 94. Residential Annual Bill for ‘Other customers’: 20% of households install both AC and 2.5kW PV + battery - Second order impact
Variable Fixed Total
($) % change ($) ($) % change
Transmission 128 6.0% 128 6.0%
Distribution 616 10.6% 165 781 8.2%
Retail 763 0.0% 128 892 0.0%
Total 1,507 4.6% 293 1,801 3.8%

96
Table 95. Residential Annual Bill for ‘Other customers’: 20% of households install both AC and 2.5kW PV + battery - Third order impact
Variable Fixed Total
($) % change ($) ($) % change
Transmission 137 13.4% 137 13.4%
Distribution 638 14.6% 165 803 11.2%
Retail 763 0.0% 128 892 0.0%
Total 1,539 6.7% 293 1,832 5.6%
6.8. AC + PV+battery, TOU tariff
DNSP WAPC
Table 96. Residential Annual Bill for ‘Responsible customers’: 20% of households install both AC and 2.5kW PV + battery - Second order impact
Variable Fixed Total
($) % change ($) ($) % change
Transmission 109 -9.7% 109 -9.7%
Distribution 109 -80.5% 214 323
-
55.3%
Retail 488 -36.1% 112 600
-
32.7%
Total 706 -51.0% 326 1,032
-40.5%
Table 97. Residential Annual Bill for ‘Responsible customers’: 20% of households install both AC and 2.5kW PV + battery - Third order impact
Variable Fixed Total
($) % change ($) ($) % change
Transmission 120 -0.4% 120 -0.4%
Distribution 117 -79.0% 214 331
-
54.1%
Retail 488 -36.1% 112 600
-
32.7%
Total 725 -49.7% 326 1,052
-
39.4%

97
Table 98. Residential Annual Bill for ‘Other customers’: 20% of households install both AC and 2.5kW PV + battery - Second order impact
Variable Fixed Total
($) % change ($) ($) % change
Transmission 123 1.8% 123 1.8%
Distribution 557 0.0% 165 722 0.0%
Retail 763 0.0% 128 892 0.0%
Total 1,443 0.1% 293 1,737 0.1%
Table 99. Residential Annual Bill for ‘Other customers’: 20% of households install both AC and 2.5kW PV + battery - Third order impact
Variable Fixed Total
($) % change ($) ($) % change
Transmission 132 8.9% 132 8.9%
Distribution 577 3.6% 165 742 2.8%
Retail 763 0.0% 128 892 0.0%
Total 1,472 2.1% 293 1,765 1.8%
DNSP Revenue cap
Table 100. Residential Annual Bill for ‘Responsible customers’: 20% of households install both AC and 2.5kW PV + battery - Second order impact
Variable Fixed Total
($) % change ($) ($) % change
Transmission 109 -9.7% 109 -9.7%
Distribution 127 -77.2% 214 341
-
52.8%
Retail 488 -36.1% 112 600
-
32.7%
Total 724 -49.8% 326 1,050
-
39.4%
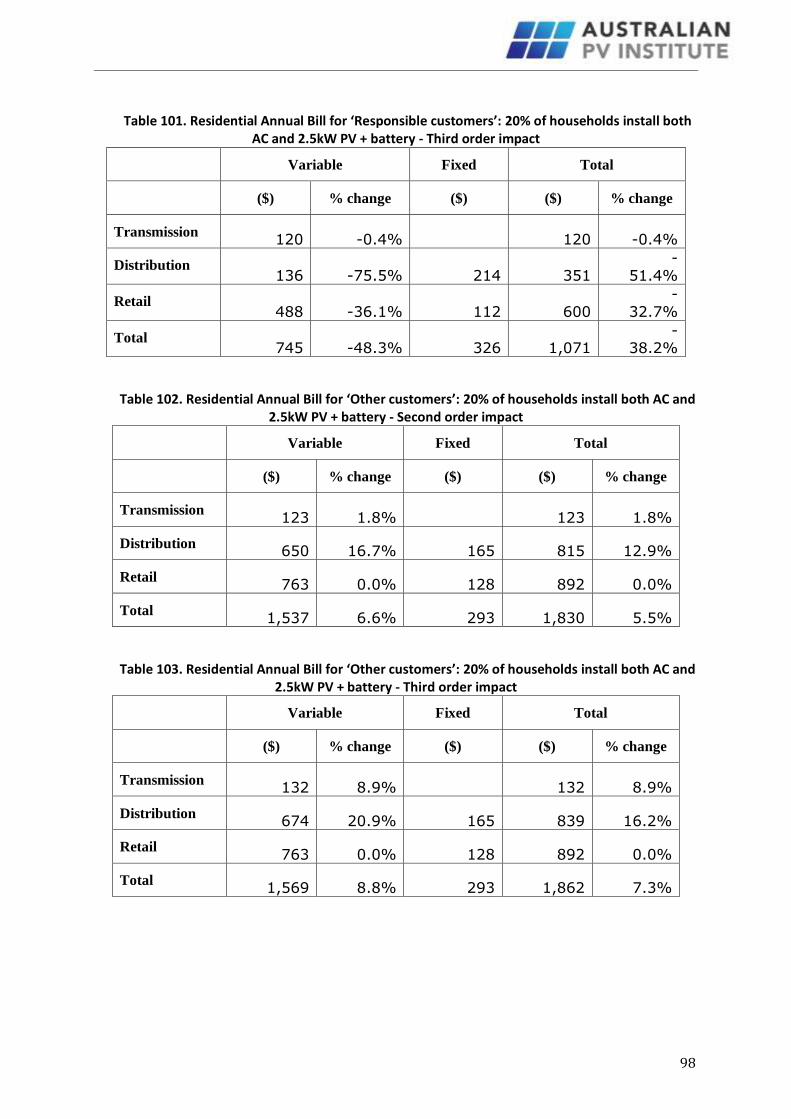
98
Table 101. Residential Annual Bill for ‘Responsible customers’: 20% of households install both AC and 2.5kW PV + battery - Third order impact
Variable Fixed Total
($) % change ($) ($) % change
Transmission 120 -0.4% 120 -0.4%
Distribution 136 -75.5% 214 351
-
51.4%
Retail 488 -36.1% 112 600
-
32.7%
Total 745 -48.3% 326 1,071
-38.2%
Table 102. Residential Annual Bill for ‘Other customers’: 20% of households install both AC and 2.5kW PV + battery - Second order impact
Variable Fixed Total
($) % change ($) ($) % change
Transmission 123 1.8% 123 1.8%
Distribution 650 16.7% 165 815 12.9%
Retail 763 0.0% 128 892 0.0%
Total 1,537 6.6% 293 1,830 5.5%
Table 103. Residential Annual Bill for ‘Other customers’: 20% of households install both AC and 2.5kW PV + battery - Third order impact
Variable Fixed Total
($) % change ($) ($) % change
Transmission 132 8.9% 132 8.9%
Distribution 674 20.9% 165 839 16.2%
Retail 763 0.0% 128 892 0.0%
Total 1,569 8.8% 293 1,862 7.3%

99
6.9. AC + PV+battery, Demand charge tariff
DNSP WAPC
Table 104. Residential Annual Bill for ‘Responsible customers’: 20% of households install both AC and 2.5kW PV + battery - Second order impact
Variable Fixed Total
($) % change ($) ($) % change
Transmission 81 -32.7% 81
-
32.7%
Distribution 490 -12.0% 165 655 -9.3%
Retail 480 -37.1% 128 609
-
31.7%
Total 1,052 -27.0% 293 1,345
-
22.4%
Table 105. Residential Annual Bill for ‘Responsible customers’: 20% of households install both AC and 2.5kW PV + battery - Third order impact
Variable Fixed Total
($) % change ($) ($) % change
Transmission 93 -23.0% 93
-23.0%
Distribution 492 -11.6% 165 657 -9.0%
Retail 480 -37.1% 128 609
-
31.7%
Total 1,066 -26.0% 293 1,359
-
21.6%
Table 106. Residential Annual Bill for ‘Other customers’: 20% of households install both AC and 2.5kW PV + battery - Second order impact
Variable Fixed Total
($) % change ($) ($) % change
Transmission 128 6.0% 128 6.0%
Distribution 557 0.0% 165 722 0.0%
Retail 763 0.0% 128 892 0.0%
Total 1,448 0.5% 293 1,742 0.4%

100
Table 107. Residential Annual Bill for ‘Other customers’: 20% of households install both AC and 2.5kW PV + battery - Third order impact
Variable Fixed Total
($) % change ($) ($) % change
Transmission 137 13.4% 137 13.4%
Distribution 577 3.6% 165 742 2.8%
Retail 763 0.0% 128 892 0.0%
Total 1,478 2.5% 293 1,771 2.1%
DNSP Revenue cap
Table 108. Residential Annual Bill for ‘Responsible customers’: 20% of households install both AC and 2.5kW PV + battery - Second order impact
Variable Fixed Total
($) % change ($) ($) % change
Transmission 81 -32.7% 81
-
32.7%
Distribution 492 -11.6% 165 657 -9.0%
Retail 480 -37.1% 128 609
-
31.7%
Total 1,054 -26.9% 293 1,347
-22.3%
Table 109. Residential Annual Bill for ‘Responsible customers’: 20% of households install both AC and 2.5kW PV + battery - Third order impact
Variable Fixed Total
($) % change ($) ($) % change
Transmission 93 -23.0% 93
-
23.0%
Distribution 495 -11.2% 165 660 -8.6%
Retail 480 -37.1% 128 609
-
31.7%
Total 1,068 -25.9% 293 1,361
-
21.5%

101
Table 110. Residential Annual Bill for ‘Other customers’: 20% of households install both AC and 2.5kW PV + battery - Second order impact
Variable Fixed Total
($) % change ($) ($) % change
Transmission 128 6.0% 128 6.0%
Distribution 573 2.8% 165 738 2.2%
Retail 763 0.0% 128 892 0.0%
Total 1,464 1.6% 293 1,758 1.3%
Table 111. Residential Annual Bill for ‘Other customers’: 20% of households install both AC and 2.5kW PV + battery - Third order impact
Variable Fixed Total
($) % change ($) ($) % change
Transmission 137 13.4% 137 13.4%
Distribution 594 6.5% 165 758 5.1%
Retail 763 0.0% 128 892 0.0%
Total 1,494 3.7% 293 1,787 3.0%

102
6.10. AC + Solar Water Heaters
DNSP WAPC
Table 112. Residential Annual Bill for ‘Responsible customers’ with electric storage water heater: 20% more households with both AC and SWH - Second order impact
Variable Fixed Total
($) % change ($) ($) % change
Transmission 173 -5.1% 173 -5.1%
Distribution 575 2.0% 171 745 1.5%
Retail 766
-
19.3% 128 895
-
17.0%
Total 1,514
-
10.7% 299 1,813 -9.1%
Table 113. Residential Annual Bill for ‘Responsible customers’ with electric storage water heater: 20% more households with both AC and SWH - Third order impact
Variable Fixed Total
($) % change ($) ($) % change
Transmission 214 17.7% 214 17.7%
Distribution 637 13.0% 171 808 10.0%
Retail 766 -19.3% 128 895 -17.0%
Total 1,618 -4.6% 299 1,917 -3.9%
Table 114. Residential Annual Bill for ‘Other customers’ with electric storage water heater: 20% more households with both AC and SWH - Second order impact
Variable Fixed Total
($) % change ($) ($) % change
Transmission 185 1.6% 185 1.6%
Distribution 563 0.0% 171 734 0.0%
Retail 950 0.0% 128 1,078 0.0%
Total 1,698 0.2% 299 1,997 0.1%

103
Table 115. Residential Annual Bill for ‘Other customers’ with electric storage water heater: 20% more households with both AC and SWH - Third order impact
Variable Fixed Total
($) % change ($) ($) % change
Transmission 257 41.1% 257 41.1%
Distribution 632 12.1% 171 803 9.3%
Retail 950 0.0% 128 1,078 0.0%
Total 1,838 8.5% 299 2,138 7.2%
DNSP Revenue cap
Table 116. Residential Annual Bill for ‘Responsible customers’ with electric storage water heater: 20% more households with both AC and SWH - Second order impact
Variable Fixed Total
($) % change ($) ($) % change
Transmission 173 -5.1% 173 -5.1%
Distribution 572 1.6% 171 743 1.2%
Retail 766
-
19.3% 128 895
-
17.0%
Total 1,512
-
10.8% 299 1,811 -9.2%
Table 117. Residential Annual Bill for ‘Responsible customers’ with electric storage water heater: 20% more households with both AC and SWH - Third order impact
Variable Fixed Total
($) % change ($) ($) % change
Transmission 214 17.7% 214 17.7%
Distribution 634 12.6% 171 805 9.7%
Retail 766 -19.3% 128 895 -17.0%
Total 1,615 -4.7% 299 1,914 -4.0%

104
Table 118. Residential Annual Bill for ‘Other customers’ with electric storage water heater: 20% more households with both AC and SWH - Second order impact
Variable Fixed Total
($) % change ($) ($) % change
Transmission 185 1.6% 185 1.6%
Distribution 561 -0.4% 171 732 -0.3%
Retail 950 0.0% 128 1,078 0.0%
Total 1,696 0.0% 299 1,995 0.0%
Table 119. Residential Annual Bill for ‘Other customers’ with electric storage water heater: 20% more households with both AC and SWH - Third order impact
Variable Fixed Total
($) % change ($) ($) % change
Transmission 257 41.1% 257 41.1%
Distribution 629 11.7% 171 800 9.0%
Retail 950 0.0% 128 1,078 0.0%
Total 1,836 8.3% 299 2,135 7.1%
6.11. AC + Solar Water Heater scenario (but Responsible customer installs AC only)
DNSP WAPC
Table 120. Residential Annual Bill for ‘Responsible customers’ with electric storage water heater: 20% more households with both AC and SWH (but get only AC) - Second order impact
Variable Fixed Total
($) % change ($) ($) % change
Transmission 232 27.2% 232 27.2%
Distribution 583 3.5% 171 754 2.7%
Retail 1,017 7.0% 128 1,145 6.2%
Total 1,831 8.0% 299 2,130 6.8%

105
Table 121. Residential Annual Bill for ‘Responsible customers’ with electric storage water heater: 20% more households with both AC and SWH (but get only AC) - Third order impact
Variable Fixed Total
($) % change ($) ($) % change
Transmission 294 61.1% 294 61.1%
Distribution 652 15.7% 171 823 12.0%
Retail 1,017 7.0% 128 1,145 6.2%
Total 1,962 15.7% 299 2,261 13.4%
Table 122. Residential Annual Bill for ‘Other customers’ with electric storage water heater: 20% more households with both AC and SWH (but get only AC) - Second order impact
Variable Fixed Total
($) % change ($) ($) % change
Transmission 167 -8.3% 167 -8.3%
Distribution 563 0.0% 171 734 0.0%
Retail 950 0.0% 128 1,078 0.0%
Total 1,680 -0.9% 299 1,979 -0.8%
Table 123. Residential Annual Bill for ‘Other customers’ with electric storage water heater: 20% more households with both AC and SWH (but get only AC) - Third order impact
Variable Fixed Total
($) % change ($) ($) % change
Transmission 227 24.5% 227 24.5%
Distribution 626 11.2% 171 797 8.6%
Retail 950 0.0% 128 1,078 0.0%
Total 1,803 6.4% 299 2,102 5.4%

106
DNSP Revenue cap
Table 124. Residential Annual Bill for ‘Responsible customers’ with electric storage water heater: 20% more households with both AC and SWH (but get only AC) - Second order impact
Variable Fixed Total
($) % change ($) ($) % change
Transmission 232 27.2% 232 27.2%
Distribution 579 2.8% 171 750 2.1%
Retail 1,017 7.0% 128 1,145 6.2%
Total 1,827 7.8% 299 2,126 6.6%
Table 125. Residential Annual Bill for ‘Responsible customers’ with electric storage water heater: 20% more households with both AC and SWH (but get only AC) - Third order impact
Variable Fixed Total
($) % change ($) ($) % change
Transmission 294 61.1% 294 61.1%
Distribution 647 14.9% 171 818 11.4%
Retail 1,017 7.0% 128 1,145 6.2%
Total 1,957 15.5% 299 2,256 13.1%
Table 126. Residential Annual Bill for ‘Other customers’ with electric storage water heater: 20% more households with both AC and SWH (but get only AC) - Second order impact
Variable Fixed Total
($) % change ($) ($) % change
Transmission 167 -8.3% 167 -8.3%
Distribution 559 -0.7% 171 730 -0.5%
Retail 950 0.0% 128 1,078 0.0%
Total 1,676 -1.1% 299 1,975 -1.0%

107
Table 127. Residential Annual Bill for ‘Other customers’ with electric storage water heater: 20% more households with both AC and SWH (but get only AC) - Third order impact
Variable Fixed Total
($) % change ($) ($) % change
Transmission 227 24.5% 227 24.5%
Distribution 622 10.4% 171 793 8.0%
Retail 950 0.0% 128 1,078 0.0%
Total 1,798 6.1% 299 2,098 5.2%
6.12. AC + 20% Demand reduction, Standard tariff
DNSP WAPC
Table 128. Residential Annual Bill for ‘Responsible customers’ on a Standard tariff: 20% demand reduction (incl. GST) – Second order impact
Variable Fixed Total
($) % change cf
Standard
tariff
($) ($) % change cf
Standard
tariff
Transmission 110 -9.1% 110 -9.1%
Distribution 511 -8.2% 165 676 -6.4%
Retail 712 -6.8% 128 840 -5.8%
Total 1,333 -7.5% 293 1,626 -6.2%
Table 129. Residential Annual Bill for ‘Responsible customers’ on a Standard tariff: 20% demand reduction - Third order impact
Variable Fixed Total
($) % change ($) ($) % change
Transmission 144 19.4% 144 19.4%
Distribution 551 -1.1% 165 716 -0.8%
Retail 712 -6.8% 128 840 -5.8%
Total 1,407 -2.4% 293 1,700 -2.0%

108
Table 130. Residential Annual Bill for ‘Other customers’: 20% of households install AC and have a 20% demand reduction, Standard tariff (incl. GST) – Second order impact
Variable Fixed Total
($) % change cf
Standard
tariff
($) ($) % change cf
Standard
tariff
Transmission 123 1.7% 123 1.7%
Distribution 557 0.0% 165 722 0.0%
Retail 763 0.0% 128 892 0.0%
Total 1,443 0.1% 293 1,737 0.1%
Table 131. Residential Annual Bill for ‘Other customers’: 20% of households install AC and have a 20% demand reduction - Third order impact
Variable Fixed Total
($) % change ($) ($) % change
Transmission 159 31.4% 159 31.4%
Distribution 600 7.7% 165 765 6.0%
Retail 763 0.0% 128 892 0.0%
Total 1,522 5.6% 293 1,816 4.7%
DNSP Revenue cap
Table 132. Residential Annual Bill for ‘Responsible customers’: 20% of households install AC and have a 20% demand reduction, Standard tariff (incl. GST) – Second order impact
Variable Fixed Total
($) % change cf
Standard
tariff
($) ($) % change cf
Standard
tariff
Transmission 110 -9.1% 110 -9.1%
Distribution 520 -6.7% 165 685 -5.2%
Retail 712 -6.8% 128 840 -5.8%
Total 1,341 -6.9% 293 1,635 -5.8%

109
Table 133. Residential Annual Bill for ‘Responsible customers’: 20% of households install AC and have a 20% demand reduction - Third order impact
Variable Fixed Total
($) % change ($) ($) % change
Transmission 144 19.4% 144 19.4%
Distribution 560 0.5% 165 725 0.4%
Retail 712 -6.8% 128 840 -5.8%
Total 1,416 -1.7% 293 1,710 -1.4%
Table 134. Residential Annual Bill for ‘Other customers’: 20% of households install AC and have a 20% demand reduction, Standard tariff (incl. GST) – Second order impact
Variable Fixed Total
($) % change cf
Standard
tariff
($) ($) % change cf
Standard
tariff
Transmission 123 1.7% 123 1.7%
Distribution 566 1.6% 165 731 1.3%
Retail 763 0.0% 128 892 0.0%
Total 1,452 0.8% 293 1,746 0.6%
Table 135. Residential Annual Bill for ‘Other customers’: 20% of households install AC and have a 20% demand reduction - Third order impact
Variable Fixed Total
($) % change ($) ($) % change
Transmission 159 31.4% 159 31.4%
Distribution 610 9.5% 165 775 7.3%
Retail 763 0.0% 128 892 0.0%
Total 1,532 6.3% 293 1,825 5.2%

110
6.13. AC + 20% Demand reduction, TOU tariff
DNSP WAPC
Table 136. Residential Annual Bill for ‘Responsible customers’: 20% of households install AC and have a 20% demand reduction, TOU tariff – Second order impact
Variable Fixed Total
($) % change cf
Standard
tariff
($) ($) % change cf
Standard
tariff
Transmission 209 72.8% 209 72.8%
Distribution 322 -42.2% 214 536 -25.7%
Retail 926 21.2% 112 1,038 16.4%
Total 1,457 1.1% 326 1,783 2.8%
Table 137. Residential Annual Bill for ‘Responsible customers’: 20% of households install AC and have a 20% demand reduction, TOU tariff - Third order impact
Variable Fixed Total
($) % change ($) ($) % change
Transmission 238 97.1% 238 97.1%
Distribution 362 -35.0% 214 576 -20.2%
Retail 926 21.2% 112 1,038 16.4%
Total 1,526 5.9% 326 1,852 6.8%
Table 138. Residential Annual Bill for ‘Other customers’: 20% of households install AC and have a 20% demand reduction, TOU tariff – Second order impact
Variable Fixed Total
($) % change cf
Standard
tariff
($) ($) % change cf
Standard
tariff
Transmission 105 -13.3% 105 -13.3%
Distribution 557 0.0% 165 722 0.0%
Retail 763 0.0% 128 892 0.0%
Total 1,425 -1.1% 293 1,718 -0.9%
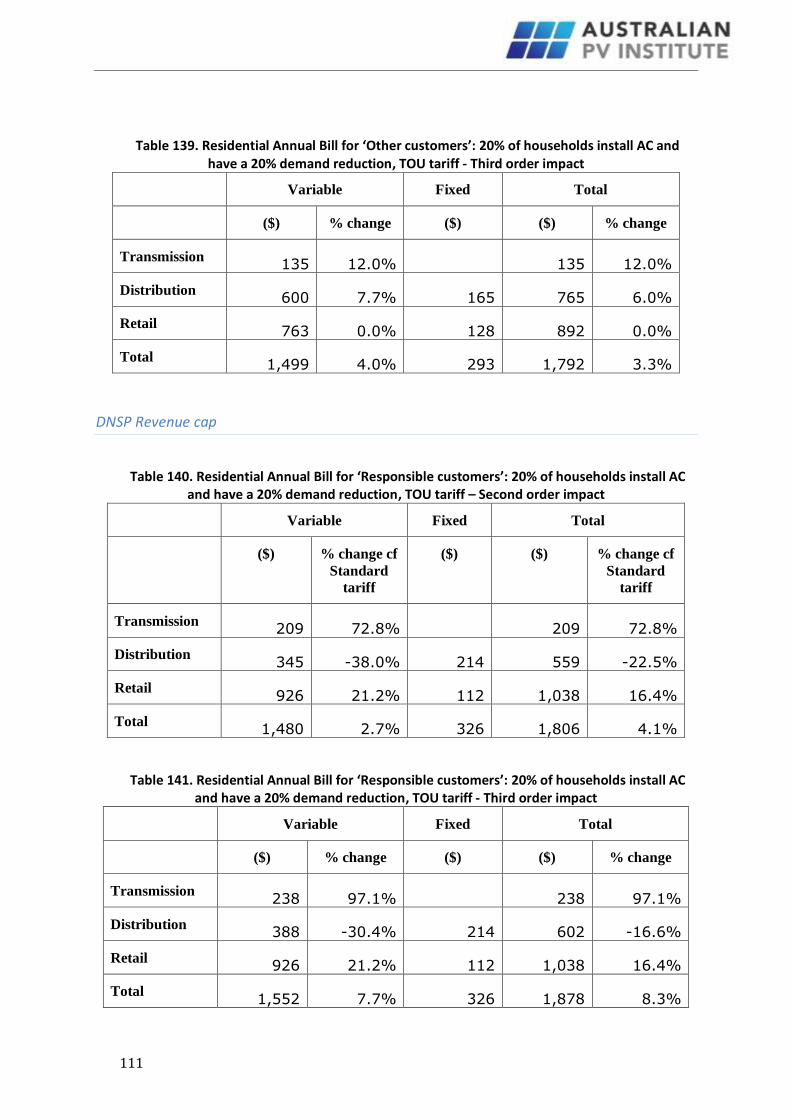
111
Table 139. Residential Annual Bill for ‘Other customers’: 20% of households install AC and have a 20% demand reduction, TOU tariff - Third order impact
Variable Fixed Total
($) % change ($) ($) % change
Transmission 135 12.0% 135 12.0%
Distribution 600 7.7% 165 765 6.0%
Retail 763 0.0% 128 892 0.0%
Total 1,499 4.0% 293 1,792 3.3%
DNSP Revenue cap
Table 140. Residential Annual Bill for ‘Responsible customers’: 20% of households install AC and have a 20% demand reduction, TOU tariff – Second order impact
Variable Fixed Total
($) % change cf
Standard
tariff
($) ($) % change cf
Standard
tariff
Transmission 209 72.8% 209 72.8%
Distribution 345 -38.0% 214 559 -22.5%
Retail 926 21.2% 112 1,038 16.4%
Total 1,480 2.7% 326 1,806 4.1%
Table 141. Residential Annual Bill for ‘Responsible customers’: 20% of households install AC and have a 20% demand reduction, TOU tariff - Third order impact
Variable Fixed Total
($) % change ($) ($) % change
Transmission 238 97.1% 238 97.1%
Distribution 388 -30.4% 214 602 -16.6%
Retail 926 21.2% 112 1,038 16.4%
Total 1,552 7.7% 326 1,878 8.3%

112
Table 142. Residential Annual Bill for ‘Other customers’: 20% of households install AC and have a 20% demand reduction, TOU tariff – Second order impact
Variable Fixed Total
($) % change cf
Standard
tariff
($) ($) % change cf
Standard
tariff
Transmission 105 -13.3% 105 -13.3%
Distribution 597 7.1% 165 762 5.5%
Retail 763 0.0% 128 892 0.0%
Total 1,465 1.6% 293 1,758 1.4%
Table 143. Residential Annual Bill for ‘Other customers’: 20% of households install AC and have a 20% demand reduction, TOU tariff - Third order impact
Variable Fixed Total
($) % change ($) ($) % change
Transmission 135 12.0% 135 12.0%
Distribution 643 15.4% 165 808 11.9%
Retail 763 0.0% 128 892 0.0%
Total 1,542 7.0% 293 1,835 5.8%
6.14. AC + 20% Demand reduction, Demand charge tariff
DNSP WAPC
Table 144. Residential Annual Bill for ‘Responsible customers’: 20% of households install AC and have a 20% demand reduction, Demand charge tariff – Second order impact
Variable Fixed Total
($) % change cf
Standard
tariff
($) ($) % change cf
Standard
tariff
Transmission 110 -9.1% 110 -9.1%
Distribution 605 8.6% 165 770 6.7%
Retail 712 -6.8% 128 840 -5.8%
Total 1,427 -1.0% 293 1,720 -0.8%

113
Table 145. Residential Annual Bill for ‘Responsible customers’: 20% of households install AC and have a 20% demand reduction, Demand charge tariff - Third order impact
Variable Fixed Total
($) % change ($) ($) % change
Transmission 144 19.4% 144 19.4%
Distribution 616 10.6% 165 781 8.1%
Retail 712 -6.8% 128 840 -5.8%
Total 1,472 2.1% 293 1,765 1.8%
Table 146. Residential Annual Bill for ‘Other customers’: 20% of households install AC and have a 20% demand reduction, Demand charge tariff – Second order impact
Variable Fixed Total
($) % change cf
Standard
tariff
($) ($) % change cf
Standard
tariff
Transmission 123 1.7% 123 1.7%
Distribution 557 0.0% 165 722 0.0%
Retail 763 0.0% 128 892 0.0%
Total 1,443 0.1% 293 1,737 0.1%
Table 147. Residential Annual Bill for ‘Other customers’: 20% of households install AC and have a 20% demand reduction, Demand charge tariff - Third order impact
Variable Fixed Total
($) % change ($) ($) % change
Transmission 159 31.4% 159 31.4%
Distribution 600 7.7% 165 765 6.0%
Retail 763 0.0% 128 892 0.0%
Total 1,522 5.6% 293 1,816 4.7%

114
DNSP Revenue cap
Table 148. Residential Annual Bill for ‘Responsible customers’: 20% of households install AC and have a 20% demand reduction, Demand charge tariff – Second order impact
Variable Fixed Total
($) % change cf
Standard
tariff
($) ($) % change cf
Standard
tariff
Transmission 110 -9.1% 110 -9.1%
Distribution 602 8.1% 165 767 6.3%
Retail 712 -6.8% 128 840 -5.8%
Total 1,424 -1.2% 293 1,717 -1.0%
Table 149. Residential Annual Bill for ‘Responsible customers’: 20% of households install AC and have a 20% demand reduction, Demand charge tariff - Third order impact
Variable Fixed Total
($) % change ($) ($) % change
Transmission 144 19.4% 144 19.4%
Distribution 613 10.0% 165 778 7.7%
Retail 712 -6.8% 128 840 -5.8%
Total 1,469 1.9% 293 1,762 1.6%
Table 150. Residential Annual Bill for ‘Other customers’: 20% of households install AC and have a 20% demand reduction, Demand charge tariff – Second order impact
Variable Fixed Total
($) % change cf
Standard
tariff
($) ($) % change cf
Standard
tariff
Transmission 123 1.7% 123 1.7%
Distribution 546 -2.0% 165 711 -1.5%
Retail 763 0.0% 128 892 0.0%
Total 1,432 -0.6% 293 1,725 -0.5%

115
Table 151. Residential Annual Bill for ‘Other customers’: 20% of households install AC and have a 20% demand reduction, Demand charge tariff - Third order impact
Variable Fixed Total
($) % change ($) ($) % change
Transmission 159 31.4% 159 31.4%
Distribution 588 5.6% 165 753 4.3%
Retail 763 0.0% 128 892 0.0%
Total 1,510 4.8% 293 1,804 4.0%
6.15. AC with demand response to a TOU tariff
DNSP WAPC
Table 152. Residential Annual Bill for ‘Responsible customers’ (have AC): TOU tariff, 20% Install AC - Second order impact [with 5% demand response]
Variable Fixed Total
($) % change ($) ($) % change
Transmission 229 89.3% 229 89.3%
Distribution 388 -30.4% 214 602 -16.6%
Retail 1,081 41.6% 112 1,193 33.8%
Total 1,697 17.8% 326 2,023 16.7%
Table 153. Residential Annual Bill for ‘Responsible customers’ (have AC): TOU tariff, 20% Install AC - Third order impact [with 5% demand response]
Variable Fixed Total
($) % change ($) ($) % change
Transmission 263 118.1% 263 118.1%
Distribution 442 -20.6% 214 657 -9.0%
Retail 1,081 41.6% 112 1,193 33.8%
Total 1,787 24.0% 326 2,113 21.8%

116
Table 154. Residential Annual Bill for ‘Other customers’ (do not have AC): TOU tariff, 20% Install AC - Second order impact [with 5% demand response]
Variable Fixed Total
($) % change ($) ($) % change
Transmission
101
-
16.4% 101
-
16.4%
Distribution 557 0.0% 165 722 0.0%
Retail 763 0.0% 128 892 0.0%
Total 1,422 -1.4% 293 1,715 -1.1%
Table 155. Residential Annual Bill for ‘Other customers’ (do not have AC): TOU tariff, 20% Install AC - Third order impact [with 5% demand response]
Variable Fixed Total
($) % change ($) ($) % change
Transmission 134 11.2% 134 11.2%
Distribution 607 9.0% 165 772 7.0%
Retail 763 0.0% 128 892 0.0%
Total 1,505 4.4% 293 1,798 3.7%
DNSP Revenue cap
Table 156. Residential Annual Bill for ‘Responsible customers’ (have AC): TOU tariff, 20% Install AC - Second order impact [with 5% demand response]
Variable Fixed Total
($) % change ($) ($) % change
Transmission 229 89.3% 229 89.3%
Distribution 405 -27.3% 214 619 -14.2%
Retail 1,081 41.6% 112 1,193 33.8%
Total 1,715 19.0% 326 2,041 17.7%

117
Table 157. Residential Annual Bill for ‘Responsible customers’ (have AC): TOU tariff, 20% Install AC - Third order impact [with 5% demand response]
Variable Fixed Total
($) % change ($) ($) % change
Transmission 263 118.1% 263 118.1%
Distribution 462 -17.0% 214 677 -6.3%
Retail 1,081 41.6% 112 1,193 33.8%
Total 1,807 25.4% 326 2,133 23.0%
Table 158. Residential Annual Bill for ‘Other customers’ (do not have AC): TOU tariff, 20% Install AC - Second order impact [with 5% demand response]
Variable Fixed Total
($) % change ($) ($) % change
Transmission
101
-
16.4% 101
-
16.4%
Distribution 582 4.5% 165 747 3.5%
Retail 763 0.0% 128 892 0.0%
Total 1,447 0.4% 293 1,740 0.3%
Table 159. Residential Annual Bill for ‘Other customers’ (do not have AC): TOU tariff, 20% Install AC - Third order impact [with 5% demand response]
Variable Fixed Total
($) % change ($) ($) % change
Transmission 134 11.2% 134 11.2%
Distribution 635 13.9% 165 800 10.7%
Retail 763 0.0% 128 892 0.0%
Total 1,532 6.3% 293 1,826 5.3%

118
6.16. AC with response to Demand charge tariff
DNSP WAPC
Table 160. Residential Annual Bill for ‘Responsible customers’ (have AC): Demand charge tariff, 20% Install AC - Second order impact [with 20% demand response]
Variable Fixed Total
($) % change ($) ($) % change
Transmission 154 27.9% 154 27.9%
Distribution 617 10.7% 165 782 8.3%
Retail 790 3.5% 128 918 3.0%
Total 1,561 8.3% 293 1,854 6.9%
Table 161. Residential Annual Bill for ‘Responsible customers’ (have AC): Demand charge tariff, 20% Install AC - Third order impact [with 20% demand response]
Variable Fixed Total
($) % change ($) ($) % change
Transmission 184 52.1% 184 52.1%
Distribution 627 12.6% 165 792 9.8%
Retail 790 3.5% 128 918 3.0%
Total 1,601 11.1% 293 1,894 9.2%
Table 162. Residential Annual Bill for ‘Other customers’ (do not have AC): Demand charge tariff, 20% Install AC - Second order impact [with 20% demand response]
Variable Fixed Total
($) % change ($) ($) % change
Transmission 115 -5.1% 115 -5.1%
Distribution 557 0.0% 165 722 0.0%
Retail 763 0.0% 128 892 0.0%
Total 1,435 -0.4% 293 1,728 -0.4%

119
Table 163. Residential Annual Bill for ‘Other customers’ (do not have AC): Demand charge tariff, 20% Install AC - Third order impact [with 20% demand response]
Variable Fixed Total
($) % change ($) ($) % change
Transmission 143 18.6% 143 18.6%
Distribution 595 6.8% 165 760 5.2%
Retail 763 0.0% 128 892 0.0%
Total 1,502 4.2% 293 1,795 3.5%
DNSP Revenue cap
Table 164. Residential Annual Bill for ‘Responsible customers’ (have AC): Demand charge tariff, 20% Install AC - Second order impact [with 20% demand response]
Variable Fixed Total
($) % change ($) ($) % change
Transmission 154 27.9% 154 27.9%
Distribution 613 10.1% 165 778 7.8%
Retail 790 3.5% 128 918 3.0%
Total 1,557 8.1% 293 1,851 6.7%
Table 165. Residential Annual Bill for ‘Responsible customers’ (have AC): Demand charge tariff, 20% Install AC - Third order impact [with 20% demand response]
Variable Fixed Total
($) % change ($) ($) % change
Transmission 184 52.1% 184 52.1%
Distribution 624 11.9% 165 788 9.2%
Retail 790 3.5% 128 918 3.0%
Total 1,597 10.8% 293 1,890 9.0%

120
Table 166. Residential Annual Bill for ‘Other customers’ (do not have AC): Demand charge tariff, 20% Install AC - Second order impact [with 20% demand response]
Variable Fixed Total
($) % change ($) ($) % change
Transmission 115 -5.1% 115 -5.1%
Distribution 543 -2.5% 165 708 -1.9%
Retail 763 0.0% 128 892 0.0%
Total 1,421 -1.4% 293 1,715 -1.1%
Table 167. Residential Annual Bill for ‘Other customers’ (do not have AC): Demand charge tariff, 20% Install AC - Third order impact [with 20% demand response]
Variable Fixed Total
($) % change ($) ($) % change
Transmission 143 18.6% 143 18.6%
Distribution 580 4.2% 165 745 3.2%
Retail 763 0.0% 128 892 0.0%
Total 1,487 3.2% 293 1,780 2.6%