Embed Size (px)
Citation preview
Aquaculture Diet Development Subprogram: Nutrient Requirements of Aquaculture Species
David M. Smith1, Geoff L. Allan2 and Mark A. Booth2
1CSIRO Marine Research P.O. Box 120, Cleveland QLD 4163
Australia
2NSW Fisheries Port Stephens Fisheries Centre
Private Bag 1, Nelson Bay NSW 2315 Australia
FRDC Project No. 1996/392
December 2003
NSW Fisheries Final Report Series No. 59
ISSN 1440-3544
Aquaculture Diet Development Subprogram: Nutrient Requirements of Aquaculture Species
December 2003
Authors: David M. Smith, Geoff L. Allan, Mark A. Booth
Published By: NSW Fisheries
Postal Address: PO Box 21, Cronulla NSW 2230
Internet: www.fisheries.nsw.gov.au
NSW Fisheries, FRDC
This work is copyright. Except as permitted under the Copyright Act, no part of this reproduction may be reproduced by any process, electronic or otherwise, without the specific written permission of the copyright owners. Neither may information be stored electronically in any form whatsoever without such permission.
DISCLAIMER
The publishers do not warrant that the information in this report is free from errors or omissions. The publishers do not accept any form of liability, be it contractual, tortuous or otherwise, for the contents of this report for any consequences arising from its use or any reliance placed on it. The information, opinions and advice contained in this report may not relate to, or be relevant to, a reader’s particular circumstance.
ISSN 1440-3544
Table of Contents i
TABLE OF CONTENTS
TABLE OF CONTENTS.................................................................................................................................I
ACKNOWLEDGMENTS.............................................................................................................................. II
NON-TECHNICAL SUMMARY ................................................................................................................III 1. BACKGROUND ............................................................................................................................. 1 2. NEED ........................................................................................................................................... 2 3. OBJECTIVES ................................................................................................................................. 2 4. RESULTS & DISCUSSION ............................................................................................................. 3
4.1. Amino acid supplementation of prawn diets................................................................................ 3 4.2. Cost effectiveness of feed attractants and/or stimulants in diets for Penaeus monodon ........... 13 4.3. Protein to energy relationships for the black tiger prawn Penaeus monodon........................... 20 4.4. Cholesterol requirement of sub-adult black tiger prawn Penaeus monodon (Fabricius) ......... 28 4.5. Essential fatty acid requirement for silver perch (Bidyanus bidyanus)..................................... 38 4.6. Utilisation of digestible nitrogen and energy from four agricultural ingredients by juvenile
silver perch Bidyanus bidyanus................................................................................................ 68 4.7. The effects of dietary digestible protein and digestible energy content on protein retention
efficiency of juvenile silver perch Bidyanus bidyanus .............................................................. 84 4.8. Dietary protein to energy relationships in barramundi........................................................... 101
5. BENEFITS ................................................................................................................................ 118 6. FURTHER DEVELOPMENT ........................................................................................................ 119 7. CONCLUSION........................................................................................................................... 120 8. STAFF...................................................................................................................................... 123 9. PUBLICATIONS ........................................................................................................................ 124 10. APPENDICES............................................................................................................................ 130
10.1. Microencapsulation of prawn feed using chitin by Roderick Bain 10.2. Maintenance requirements of juvenile silver perch (abstract only) 10.3. Asian seabass Lates calcarifer (Bloch) perform well when fed pelleted diets high in protein and
lipid
Smith et al. FRDC Project No. 96/392

ii Acknowledgments
ACKNOWLEDGMENTS
The Principal Investigator and Co-Investigators would like to acknowledge the financial support from the Fisheries Research and Development Corporation, CSIRO Marine Research, New South Wales Fisheries, Queensland Department of Primary Industries, the Grains Research and Development Corporation, the Meat Research Corporation, the Grains Research Council, the Australian Wheat Board, Ridley AgriProducts and Goodman Fielder, without which this study would not have been possible. The Principal Investigator would also like to thank and acknowledge the dedicated efforts of the research teams at Port Stephens, Cleveland and Walkamin that have contributed so much to the success of this project.
FRDC Project No. 96/392 Smith et al.
Non-technical Summary iii
NON-TECHNICAL SUMMARY
96/392 Aquaculture Diet Development Sub-Program: Nutrient Requirements of
Aquaculture Species PRINCIPAL INVESTIGATOR: Mr David Smith ADDRESS: CSIRO Marine Research P.O. Box 120 Cleveland QLD 4163 Telephone: 07 3826 7239 Fax: 07 3826 7222 Email: [email protected] OBJECTIVES: 1. Assess the effectiveness of three forms of amino acid supplementation to improve the amino
acid balance of diets containing terrestrial proteins. 2. To define the daily requirements for essential amino acids and energy of the black tiger prawn
during grow-out at specific temperatures. 3. To define the requirements in silver perch for the essential fatty acids and amino acids. 4. Determine the protein and energy requirements of several size classes of several size classes
barramundi. 5. To determine the cost benefit of using commercially available attractants and palatability
enhancers in prawn feeds where high levels of grains and legumes are used. 6. Communicate the research findings to the feed manufacturing industry and the scientific
community. OUTCOMES ACHIEVED • Demonstration of the limited value of various microencapsulation techniques used to reduce
the leaching loss of supplementary crystalline amino acids. • Reduction in the ingredient cost of feeds for the black tiger prawn (Penaeus monodon)
through a reduction in the amount of supplementary cholesterol being added to the feeds. • Formulation of more cost-effective feeds for prawns through the avoidance of specific
attractants as supplements and recognition of the superior attractant properties of regularly used ingredients of marine origin, such as fishmeal, squid meal and crustacean meal.
• Formulation of more efficient feeds for silver perch (Bidyanus bidyanus) through a better understanding of their requirements for linoleic and linolenic acids and evidence of a requirement for longer chain, highly unsaturated fatty acids.
• Understanding of the utilization by silver perch of protein and energy in peanut meal, meat meal, canola meal and field peas at a range of inclusion levels in the feed, and limitations to the use of these ingredients.
• Enhanced productivity and lower cost of production of barramundi as a result of improved feed formulations.
The overall aim of this project was to determine the requirements of essential nutrients for prawns, silver perch and barramundi that would enable the efficient formulation of feeds to suit the economic constraints of farming those species. The issues that confront the feed formulator are the cost of the feed, how this can be balanced against the need to maintain a high growth rate in the
Smith et al. FRDC Project No. 96/392
iv Non-technical Summary
target species and maintaining a favourable feed conversion efficiency. In addition, there is an increasing need to minimise the nutrient waste entering waterways from aquaculture operations. The feed is the greatest source of waste nutrients in an aquaculture operation, either directly or as a result of metabolic or digestive excretion by the cultured species. Meeting the cultured species nutritional requirements with a nutritionally balanced feed is an important step in minimising metabolic waste from the animals. The research plan of the project was to investigate methods of supplementing prawn feeds with amino acids to improve the efficiency with which the dietary protein was used by prawns. Crystalline amino acids added as supplements in prawn diets have been found to leach rapidly into the surrounding water, with about 60% lost in one hour. A variety of techniques to minimise this loss have been investigated. None of the techniques studied produced an effective method for controlling the loss rate of the amino acids. However, the covalent bonding of lysine to a purified protein (gluten) provides a promising research tool to investigate essential amino acid requirements. Though effective, this technique is relatively expensive and would not be cost-effective in commercial feeds. The use of 15-N labelled amino acids also proved a useful technique to measure the actual ingestion of the supplementary amino acids and may be an excellent tool to be used in the future to investigate the assimilation efficiency and effectiveness of supplementation of feeds with amino acids. The response of the black tiger prawn, Penaeus monodon, to different levels of dietary digestible protein and energy has been studied. The results of the study indicated that with a low energy diet (13.5 MJ.kg-1) the optimum P:E ratio is about 22.2 mg.kJ-1 which corresponds to a dietary digestible protein content of 300 g.kg-1. However, with the higher energy diets (15.0 and 16.5 MJ.kg-1), energy did not appear to become limiting even with diets containing in excess of 45 g .kg-
1 digestible protein. As a result, the optimum P:E ratio could not be established. With the high energy diets the growth rate of the prawns increased with increasing digestible protein content. This suggests that the prawns were using protein more efficiently as an energy source than the carbohydrate in the diets. Because of the cost of protein and amount of nitrogenous waste that is generated when it is used for energy, the challenge for nutritionists is to find a way of increasing the utilisable energy in prawn diets from non-protein energy sources. Cholesterol is an essential nutrient for prawns and must be provided in the feed. However, it is one of the most expensive ingredients added to a prawn feed. For example, the typical addition of 2 kg of cholesterol to1 tonne of the feed adds about 10% to the total ingredient cost of the feed. In this study, we found that the generally recommended level of cholesterol in prawn feeds (2.5 to 4 g kg-1
of feed) is higher than the defined requirement (1.7 g kg-1), allowing for a significant reduction in the amount of supplementary cholesterol used. We also found that that ingredients such as fishmeal, squid meal and various types of crustacean meal, that are typically used in prawn feeds, can provide all the necessary cholesterol without the need for any supplementation. A study has been carried out to define the dietary requirements of silver perch for two essential fatty acids, linoleic (LA) and linolenic (LNA) acid, when the diets contain negligible quantities of the long chain highly unsaturated fatty acids (HUFAs) that are found in marine oils. The results of this study show that silver perch require both n-6 and n-3 fatty acids in their diets. Acceptable weight gain can be achieved with feeding a 9% lipid diet with 2.5% LA and 2.3% LNA. Diets with these specifications could be formulated without fishmeal, using plant protein sources as the main ingredients. However, the best weight gain would be achieved when the diet contains a mixture of LA, LNA and HUFAs, which implies the inclusion some marine product such as fishmeal or fish oil in the diet. A study was conducted to evaluate the nutritional value of peanut meal, canola meal, meat meal and dehulled field peas in the diet of juvenile silver perch using the summit dilution method. In this
FRDC Project No. 96/392 Smith et al.
Non-technical Summary v
method, a summit (or basal) diet is mixed with the test ingredient at various inclusion levels to provide a range of diets. The performance of fish on these diets was compared with that of fish fed diets where the test ingredient was replaced with an inert filler (diatomaceous earth), at the same inclusion levels. Weight gain of silver perch decreased steadily with increasing content of diatomaceous earth. Silver perch fed diets containing a mixture of the basal diet and either peanut meal, meat meal, canola meal or up to 60% field peas gained more weight than fish fed diets containing similar contents of the inert filler, indicating silver perch were able to utilise these ingredients to support growth. Analysis of the data suggests that silver perch could utilize with reasonable efficiency, the digestible protein in all these ingredients so long as diets did not contain more than 45% or 75% by weight of peanut meal or field peas respectively. They could also utilize the digestible energy in with good efficiency provided that the diet did not contain more than 75% by weight of either field peas or canola meal. Further studies with these ingredients using different feeding regimens, are warranted to gain a better appreciation of their nutritional value for silver perch. The combined effects of dietary digestible protein and energy on protein retention efficiency of juvenile silver perch has been studied with three series of diets with different digestible energy levels (13, 15 and 17 MJ/kg DE), each with five digestible protein levels (ranging from 10 to 40 g/100 g digestible protein). Fish were fed restrictively at the same rate across treatments, at a percentage of the biomass in the tank and feed intake in each tank determined. The change in carcass composition (weight, % protein, % fat, % moisture) was related to the dietary treatment. Carcass fat increased with increasing digestible protein and increasing digestible protein:DE ratio. The optimum protein retention efficiency was obtained with 24.7% digestible protein (low DE diets), 26.1% digestible protein (mid DE diets) and 30.1% digestible protein (high DE diets). When feed intake is unrestricted, intake is determined by energy requirements and protein retention efficiency will decrease with increasing dietary protein content. In this study, however, the protein retention efficiencies of fish fed the lowest digestible protein content diets were the lowest recorded. Because the fish in this experiment were fed restrictively, the intake of energy or some indispensable amino acids (or both) may have limited protein utilisation. With restricted feeding, the relative proportion of dietary energy and amino acids consumed that we used for maintenance is higher than when diets with similar nutrient specifications are fed to satiation. On the basis of results from the current experiment, and the one run by Allan et al. (2001), silver perch farmers wishing to maximise body weight gain are advised to feed to satiation if using low protein diets. If satiation feeding is not possible, or if feeding must be restricted (e.g. to prevent water quality deterioration), then a higher protein diet is advised. The studies of the protein/energy relationship in barramundi have demonstrated the efficiency of growth and development was highly dependent on both the protein and the lipid/energy concentration of the diet fed. Growth rate and FCR improvements were essentially linear for dietary protein over the range of 38 to at least 55% and incremental for dietary lipid/energy over the range of 7 to 18%. With diets containing up to 18% lipid, growth rate of fingerling fish was best at a dietary protein content of 60% while a specification of 66% was needed to obtain the most efficient food conversion. For the higher lipid (21%) diet, growth rate of barramundi increased linearly up to the maximum dietary protein concentration examined which was 60%. However, high fat diets resulted in an increase in deposited fat in the fish. Discount cash-flow modelling of the performance of barramundi fed either a standard (45% protein; 10% lipid) or a nutrient dense (55% protein; 20% lipid) diet during grow-out showed the internal rate of return on investment to increase from 8 to 23% respectively. The economic modelling provides a clear incentive for barramundi farmers to feed barramundi on diets with protein and lipid specifications of at least 50-55% and 18-20%, respectively. .
Smith et al. FRDC Project No. 96/392

NSW Fisheries 1
1. BACKGROUND
The research reported in this document is the outcome of an application to the FRDC for support to identify the key limiting nutrients in aquaculture diets, particularly where fishmeal has been replaced with significant proportions of plant or animal proteins, and to determine ways that these nutrients can be provided in a cost-effective manner. Its aim was to capture the benefit of the previously successful FRDC research in the Fishmeal Replacement Subprogram. In the research, we proposed to apply the same nutrition research principles across three farmed species: a. a crustacean (black tiger prawn Penaeus monodon) b. a carnivorous fish (barramundi Lates calcarifer) c. an omnivorous fish (silver perch Bidyanus bidyanus) The major focus of this proposal was to find ways of improving the utilisation of dietary protein. Protein is the major nutrient in all aquaculture feeds and also the most expensive to provide. The amino acid balance of the diet and the relationship between energy and the most limiting amino acid are critical for the efficient utilisation of the protein. If the amino acid balance is not correct or if there is insufficient energy in the diet, valuable amino acids will be used as an expensive source of energy. However if too much energy is provided, relative to the most limiting amino acid, the animals will not grow at their maximum potential. In the intensive culture of pigs and poultry the use of crystalline amino acids has provided the greatest opportunity to optimise the amino acid profiles of the diets and has permitted great advances in nutritional efficiency. The optimum ratio between the essential amino acids (or ‘ideal’ protein) and energy for these species is well understood and underpins their efficiency of production. We investigated the use of various forms of amino acids to determine their effectiveness in aquaculture diets and used them to help provide the required amino acid profiles. Amino acids have a secondary role as feed attractants especially for prawns. Our investigations with prawns included determining the cost effectiveness of commercial attractants, particularly those containing amino acids, which might contribute to the amino acid content of the diets. We have established with silver perch, the general requirements for the highly unsaturated fatty acids (HUFA) that are present in fishmeal but lacking in plant and animal proteins. These HUFA are essential nutrients in prawns and many fish. With the replacement of fishmeal in aquaculture diets it is likely that the diets will be deficient in HUFA and these will need to be supplemented by the inclusion of a small amount of a marine oil. The exact requirement for HUFA still needs to be determined. The proposed research will raise the understanding of the nutritional requirements of these aquaculture species so that feeds can be formulated to be as nutritionally efficient as possible. This will improve the cost effectiveness of the diets and reduce the amount of nitrogenous waste entering the environment.
Smith et al. FRDC Project No. 96/392
2 NSW Fisheries
2. NEED
A clear understanding of the nutrient requirements of any intensively farmed animal is a prerequisite for efficient formulation of diets. Without this information, the feed formulator must guess as to how much of each nutrient should be included in the diet. The knowledge of the nutrient requirements of most aquaculture species can only be described as sketchy, particularly in contrast to the knowledge of the requirements in pig and poultry nutrition. Though a great deal of research has been carried out around the world on prawn nutrition, much of it has been very poorly directed. The nutritional requirement specifications that pig nutritionists use routinely have not been addressed for prawns. The understanding of the nutrient requirements for silver perch and barramundi are even less well understood than for prawns. The application of these methods to the selected species will provide a methodological framework for assessing the nutrient requirements of other species which in the future show potential for aquaculture development.
3. OBJECTIVES
1. Assess the effectiveness of three forms of amino acid supplementation to improve the amino acid balance of diets containing terrestrial proteins.
2. To define the daily requirements for essential amino acids and energy of the black tiger prawn during grow-out at specific temperatures.
3. To define the requirements in silver perch for the essential fatty acids and amino acids. 4. Determine the protein and energy requirements of several size classes of barramundi. 5. To determine the cost benefit of using commercially available attractants and palatability
enhancers in prawn feeds where high levels of grains and legumes are used. 6. Communicate the research findings to the feed manufacturing industry and the scientific
community.
FRDC Project No. 96/392 Smith et al.
NSW Fisheries 3
4. RESULTS & DISCUSSION
4.1. Amino acid supplementation of prawn diets
David M. Smith, Simon J. Tabrett, Leigh E. Whitlock & Margaret C. Barclay
CSIRO Marine Laboratories, P.O. Box 120, Cleveland Qld 4163
Summary
Crystalline amino acids added as supplements in prawn diets have been found to leach rapidly into the surrounding water, with about 60% lost in one hour. A variety of microencapsulation techniques have been investigated to determine their suitability as a means of minimising the leaching loss of amino acid supplements in prawn feeds. We have not been able to produce viable microcapsules with any of the techniques studied. The amino acids that had been encapsulated in a variety of microcapsules then incorporated into pelleted diets, using relatively mild processing conditions, leached from the diets at rates very similar to that of free, crystalline amino acids. The leaching rate and subsequential low level of ingestion of these amino acids, strongly suggest that these microcapsules or crystalline amino acids are unlikely to be effective in prawn diet, unless used in great excess to accommodate leaching losses. Commercial steam pelleting of diets is also unlikely to result in a marked improvement in the leaching characteristics of the feed, as the leaching loss of nitrogenous compounds from a widely-used, commercial prawn feed was found to be equivalent to 15% of the total nitrogen in the feed after 2 hours of immersion (Smith et al., 2002). However, the covalent binding of an amino acid such as lysine to a purified protein such as gluten provides a promising research tool to investigate essential amino acid requirements. Though effective, this technique is relatively expensive. The use of 15-N labelled amino acids has proved a useful technique to measure the actual ingestion of the supplementary amino acids and maybe an excellent tool to investigate the assimilation efficiency and effectiveness of supplementation of feeds with amino acids.
Introduction
In the intensive culture of pigs and poultry the use of crystalline amino acids has provided the greatest opportunity to optimise the amino acid profiles of the diets and has permitted great advances in the efficient nutrition of these species. The optimum ratio of the 'ideal' protein to metabolisable energy for these species is well understood and underpins their efficiency of production. However, for crustaceans, the supplementation of diets with crystalline amino acids is not as effective as these animals are slow feeders and the highly soluble amino acids leach rapidly from the diets (Deshimaru & Kuroki, 1974; Deshimaru, 1981; Chen et al., 1992; Divakaran, 1994). Crystalline amino acids have been used with some success in the diets of larval and post larval prawns (Teshima et al., 1986; Millamena et al., 1996). Their use has been enabled through various microencapsulation strategies combined with the use of binders not normally associated with the commercial pelleting of prawn feeds. However, these studies have failed to quantify the leaching loss of the crystalline amino acids prior to the diets being eaten or the actual intake of the crystalline amino acids. Novel approaches to supplementation have been the use of amino acids
Smith et al. FRDC Project No. 96/392
4 NSW Fisheries
that are covalently bound to a protein such as gluten (Fox et al., 1995) and the use of an amino acid/protein plastein incorporating the amino acid of interest (Teshima et al., 1992). In the FRDC fishmeal Replacement Sub-program, a study was carried out to review the products and technologies available for supplementation of aquaculture feeds with amino acids (Grieve, 1994). His review found that crystalline amino acids would be the major form used for the supplementation of aquaculture feeds in the short term. Recent inquiries to firms specialising in microencapsulation and/or the production of amino acids have not revealed any new amino acid products that could be used as replace crystalline amino acids as the main form for amino acid supplementation in aquaculture feeds (D.M. Smith, personal communication). In the ‘Amino Acid Supplementation’ section of this paper, we report studies to evaluate the loss of amino acids that have been encapsulated using several microencapsulation methods. The leaching of the essential amino acid lysine from a pelleted feed has been used as the primary evaluation criteria. In the ‘Effectiveness of Lysine Supplementation’ section, we report work carried out to determine the growth response of prawns to varying levels of dietary lysine provided in the free, crystalline form, in a microencapsulated form and as an intact protein. In addition, we report on studies that were carried out with juvenile P. monodon to quantify the proportion of dietary 15-N labelled lysine that was ingested when the lysine was added to the diet in the free crystalline form, microencapsulated and covalently bound.
AMINO ACID SUPPLEMENTATION
Materials and Methods
Preparation of microencapsulated lysine and lysine-enriched gluten
L-lysine (crystalline, 99%, Rhone-Poulenc) was microencapsulated using three different methods: (a) cellulose acetate hydrogen phthalate (CAP) (Deasy 1984, Chen et al. 1992); (b) hydrogenated vegetable oil (PAX) (Litster and Smith 1988); (c) glycerol monostearate (Deasy 1984, Chen et al., 1992). Lysine-enriched gluten was also prepared using the technique of Fox et al., (1995). The L-lysine was covalently bound to wheat gluten (Janbak, Brisbane) to increase its lysine content from 16 mg.g-1 to 100 mg.g-1. The technique, as published, required considerable working-up to produce a satisfactory result. Once the technique was working satisfactorily, 15-N-lysine-enriched gluten was prepared for the ingestion study, and unlabelled lysine-enriched gluten was prepared for the leaching study. Chitin-bound microcapsules
Chitin microcapsules were prepared using two of the techniques described by Mi et al., (1997a, 1977b). In both procedures chitin (Sigma Chemicals) was first dissolved in a solution of N, N-dimethylacetamide (Sigma Chemicals) containing 5% lithium chloride (Sigma Chemicals). The core material, a mixture of lysine hydrochloride and blue dextran, were then dispersed in it. The resulting mixture was either extruded as droplets into a setting solution or emulsified in an oil prior to the addition of a setting agent. In the first technique, the chitin solutions containing a range of concentrations of a lysine+blue dextran mixture (ratio of chitin:(lysine+blue dextran) ranged from 1:1 to 4:1) were placed in a hypodermic syringe and droplets were extruded 14-gauge needle into a setting solution of acetone. Attempts were made to extrude smaller droplets through narrow bore needles (21 and 18 gauge) were unsuccessful as the needles rapidly became blocked.
FRDC Project No. 96/392 Smith et al.
NSW Fisheries 5
In the second technique the chitin solution was stirred vigorously in vegetable oil at various speeds and for various periods to produce an emulsion (phase coacervation technique). Acetone was slowly added to the emulsion until the acetone volume exceeded the original volume of vegetable oil. During this entire process the mixture was stirred; the rate of stirring was altered on each successive attempt to make the microcapsules. Further work using this technique was carried out at the University of Queensland, Department of Chemical Engineering in the form of a final year undergraduate project (Appendix 10.1). Low-lysine diet development
In order to test the efficacy of lysine supplementation of prawn diets, a diet that was highly deficient in lysine, yet reasonably well accepted by P. monodon, needed to be developed. Diet 1 (Table 1) was used initially in a growth response experiment and as a result of this experience, further development work was carried out. A number of formulations of low-lysine diets were tested to determine their acceptance by prawns and to obtain indicative growth rates. Acceptance was assessed on feed intake and growth prawns over 2 weeks. Generally 12 prawns of similar size were held in each tank with 2 tanks per treatment. The diet formulations are show in Table 1. Three variables have been studied in separate experiments: (a) amount of attractant (minced squid or shrimp head meal) in the diets using Diet 1 as a base; (b) the form of gluten – wheat gluten, de-vitalised gluten, maize gluten, Diets 1 and 2; (c) the method of processing – steamed; moist alginate-bound; dried alginate-bound; Diets 1, 2 and 3. The performance of these diets was compared against that of a semi-purified diet used in the CRC for Aquaculture research (Glencross et al., 1998) that had resulted in good growth rates. Preparation of lysine supplemented diets
The gluten-based, low lysine diet (Diet 3, Table 1) was supplemented with crystalline lysine, lysine enriched gluten, and the three types of lysine microcapsules (cellulose acetate hydrogen phthalate microcapsules, CAP; hydrogenated vegetable oil microcapsules, PAX; and glycerol monostearate microcapsules, GM). The diets were pelleted using a small-scale commercial steam pellet press (Ridley AgriProducts, Narangba), which could produce a minimum of 1 kg of feed. The diets pelleted at Ridley AgriProducts were found to have very low water stability and so a portion of each of them was steamed for 5 min at the CSIRO laboratory. The cost of the lysine-enriched gluten was so high, it was not practicable to prepare sufficient to use in the Ridley pellet press, so only laboratory-made pellets were produced for this treatment. To maintain uniformity in processing, all the diets were made again at the CSIRO laboratory using a Hobart mincer with a 3 mm aperture die, and then steamed for 5 min. Pellet stability tests
The stability of each of the feeds was tested by placing 6 x 0.3 g samples of feed in a series of containers that had a base of 1 mm nylon mesh. The containers were placed in 70 mL seawater and shaken at 40 rpm for 6 h. A sample of each feed was removed at 0.5h, 1h, 2h, 3h, 4h and 6h, and the mass of feed that was retained by the screen and the mass that had passed through the screen were determined gravimetrically. Leaching loss of lysine from microcapsules and diets
Duplicate weighed samples of crystalline lysine and the three types of microcapsules were placed in beakers containing 100 mL of deionised water at 28ºC and at 85ºC. They were stirred for 5 min after which a 2 mL sample was taken from each beaker. To determine the total amount of lysine in the beaker, 50 mL hexane was added to each beaker, and the microcapsules were macerated with a Bamix to release all of the lysine. A 2.0 mL sample was then taken for analysis.
Smith et al. FRDC Project No. 96/392
6 NSW Fisheries
Leaching of the free and microencapsulated lysine was determined from the laboratory-made feed pellets. Triplicate weighed samples of the pellets (approx. 1.25 g) were placed in 100 mL distilled water and shaken at 40 rpm for up to 6 h. 1ml samples of water were taken at appropriate intervals. At the end of the leaching experiment, 50 mL of hexane was added to dissolve the lipid microcapsules, and the pellets and water were macerated with a Bamix to release all of the free lysine. Another 1 mL sample was taken after the particulate matter had settled. The samples from leaching experiments were passed through a Sep Pak cartridge (Waters) to remove lipids and proteins, and then the dissolved lysine was measured by high pressure liquid chromatography (HPLC) on an amino acid column with post-column derivatisation and fluorescence detection (Dall and Smith, 1987). Table 1. Formulations used to develop a low-lysine diet for use in amino acid requirement
and assimilation studies with prawns. (Quantities are g.kg-1 Dry Matter).
Ingredients Diet 1 Diet 2 Diet 3 Ref. Diet
Gluten (wheat) 80 80 80 60 Gluten (devitalised) 318 - - - Gluten (maize) - 200 200 - Shrimp head meal 60 - - - Squid mantle (fresh) - 40 40 50 Gelatine - 30 30 - Casein (vitamin free) - - - 350 Albumin (egg) - - - 50 Starch (pre-gelatinised) 429 531 439 250 Flour (wheat) 30 30 30 - Squid oil 54 53 53 - Cod liver oil - - - 60 Lecithin 12 12 12 10 Cholesterol 2 2 2 2 Carophyll pink 0.9 0.9 0.9 1.5 Vitamin C (Takeda) 0.5 0.5 0.5 1.0 Vitamin premix 2.0 2.0 2.0 1.5 Binder/filler/others 11.6 18.6 110.6 147.5
Results and Discussion
Pellet stability
The stability of the laboratory-made feeds was good, with 87% to 96% of the dry matter of the pellets retained by the 1.0 mm screen after six hours in water. However, the stability of the feeds made with the laboratory-scale commercial pellet press at Ridley AgriProducts was unacceptable, with only 6% to 21% retained by the screen after six hours in water. Steaming improved them only marginally (28-42% retained by the screen). The low stability of the pellets made with the pellet press was primarily due to the lack of control on the amount of stream added to the mash in the press. Because of these results, only the laboratory-made feeds were used in subsequent tests.
FRDC Project No. 96/392 Smith et al.
NSW Fisheries 7
Leaching loss of lysine from microcapsules and diets
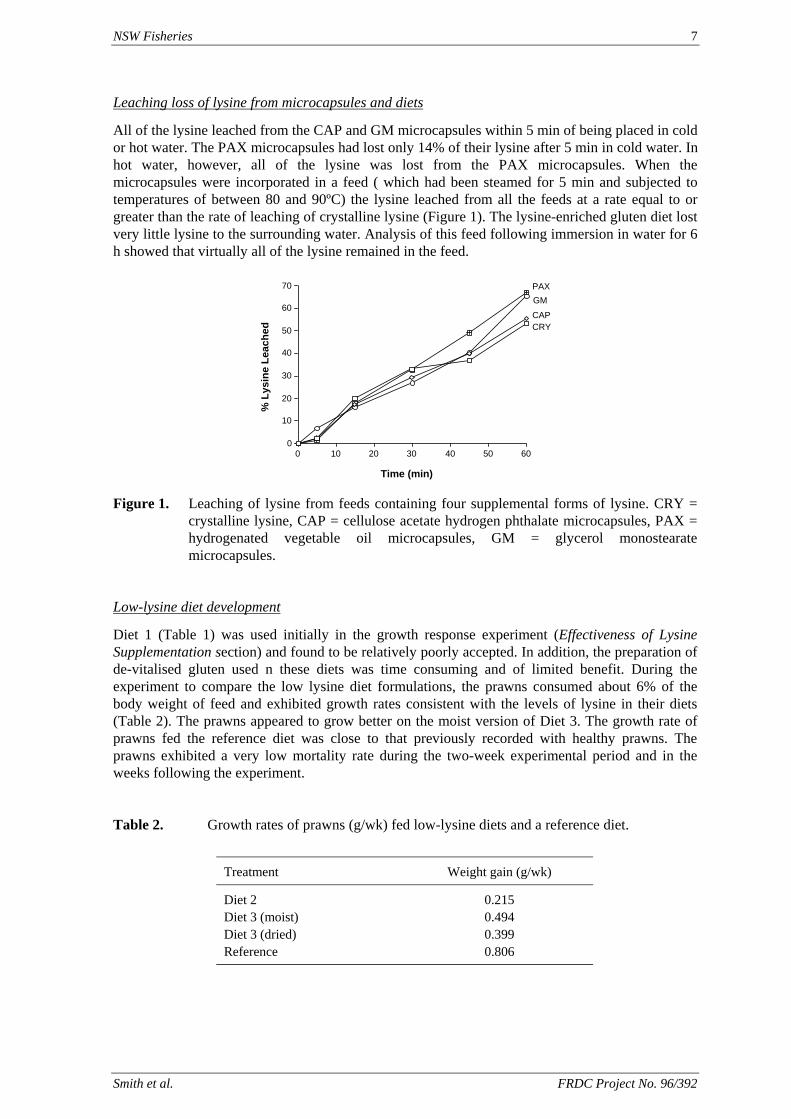
All of the lysine leached from the CAP and GM microcapsules within 5 min of being placed in cold or hot water. The PAX microcapsules had lost only 14% of their lysine after 5 min in cold water. In hot water, however, all of the lysine was lost from the PAX microcapsules. When the microcapsules were incorporated in a feed ( which had been steamed for 5 min and subjected to temperatures of between 80 and 90ºC) the lysine leached from all the feeds at a rate equal to or greater than the rate of leaching of crystalline lysine (Figure 1). The lysine-enriched gluten diet lost very little lysine to the surrounding water. Analysis of this feed following immersion in water for 6 h showed that virtually all of the lysine remained in the feed.
0
10
20
30
40
50
60
70
% L
ysin
e Le
ache
d
0 10 20 30 40 50 60
Time (min)
PAXGM
CAPCRY
Figure 1. Leaching of lysine from feeds containing four supplemental forms of lysine. CRY =
crystalline lysine, CAP = cellulose acetate hydrogen phthalate microcapsules, PAX = hydrogenated vegetable oil microcapsules, GM = glycerol monostearate microcapsules.
Low-lysine diet development
Diet 1 (Table 1) was used initially in the growth response experiment (Effectiveness of Lysine Supplementation section) and found to be relatively poorly accepted. In addition, the preparation of de-vitalised gluten used n these diets was time consuming and of limited benefit. During the experiment to compare the low lysine diet formulations, the prawns consumed about 6% of the body weight of feed and exhibited growth rates consistent with the levels of lysine in their diets (Table 2). The prawns appeared to grow better on the moist version of Diet 3. The growth rate of prawns fed the reference diet was close to that previously recorded with healthy prawns. The prawns exhibited a very low mortality rate during the two-week experimental period and in the weeks following the experiment. Table 2. Growth rates of prawns (g/wk) fed low-lysine diets and a reference diet.
Treatment Weight gain (g/wk)
Diet 2 0.215 Diet 3 (moist) 0.494 Diet 3 (dried) 0.399 Reference 0.806
Smith et al. FRDC Project No. 96/392
8 NSW Fisheries
EFFECTIVENESS OF LYSINE SUPPLEMENTATION
Materials and Methods
Growth response experiment
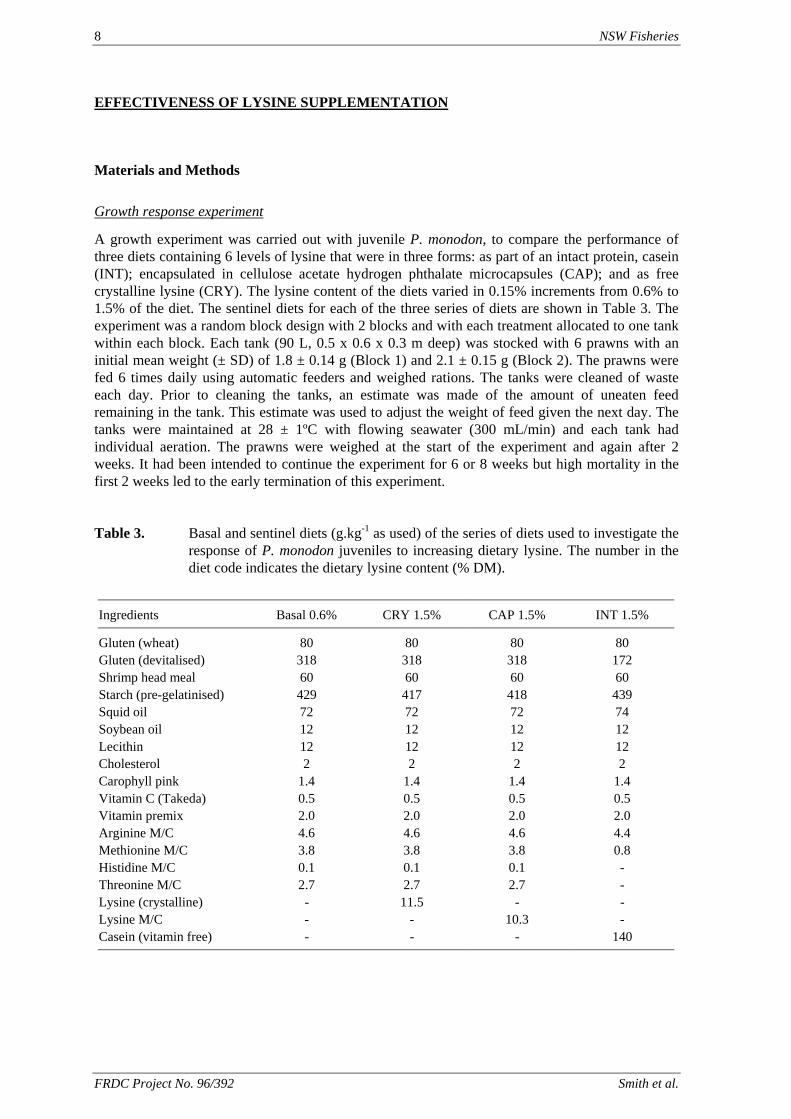
A growth experiment was carried out with juvenile P. monodon, to compare the performance of three diets containing 6 levels of lysine that were in three forms: as part of an intact protein, casein (INT); encapsulated in cellulose acetate hydrogen phthalate microcapsules (CAP); and as free crystalline lysine (CRY). The lysine content of the diets varied in 0.15% increments from 0.6% to 1.5% of the diet. The sentinel diets for each of the three series of diets are shown in Table 3. The experiment was a random block design with 2 blocks and with each treatment allocated to one tank within each block. Each tank (90 L, 0.5 x 0.6 x 0.3 m deep) was stocked with 6 prawns with an initial mean weight (± SD) of 1.8 ± 0.14 g (Block 1) and 2.1 ± 0.15 g (Block 2). The prawns were fed 6 times daily using automatic feeders and weighed rations. The tanks were cleaned of waste each day. Prior to cleaning the tanks, an estimate was made of the amount of uneaten feed remaining in the tank. This estimate was used to adjust the weight of feed given the next day. The tanks were maintained at 28 ± 1ºC with flowing seawater (300 mL/min) and each tank had individual aeration. The prawns were weighed at the start of the experiment and again after 2 weeks. It had been intended to continue the experiment for 6 or 8 weeks but high mortality in the first 2 weeks led to the early termination of this experiment. Table 3. Basal and sentinel diets (g.kg-1 as used) of the series of diets used to investigate the
response of P. monodon juveniles to increasing dietary lysine. The number in the diet code indicates the dietary lysine content (% DM).
Ingredients Basal 0.6% CRY 1.5% CAP 1.5% INT 1.5%
Gluten (wheat) 80 80 80 80 Gluten (devitalised) 318 318 318 172 Shrimp head meal 60 60 60 60 Starch (pre-gelatinised) 429 417 418 439 Squid oil 72 72 72 74 Soybean oil 12 12 12 12 Lecithin 12 12 12 12 Cholesterol 2 2 2 2 Carophyll pink 1.4 1.4 1.4 1.4 Vitamin C (Takeda) 0.5 0.5 0.5 0.5 Vitamin premix 2.0 2.0 2.0 2.0 Arginine M/C 4.6 4.6 4.6 4.4 Methionine M/C 3.8 3.8 3.8 0.8 Histidine M/C 0.1 0.1 0.1 - Threonine M/C 2.7 2.7 2.7 - Lysine (crystalline) - 11.5 - - Lysine M/C - - 10.3 - Casein (vitamin free) - - - 140
FRDC Project No. 96/392 Smith et al.
NSW Fisheries 9
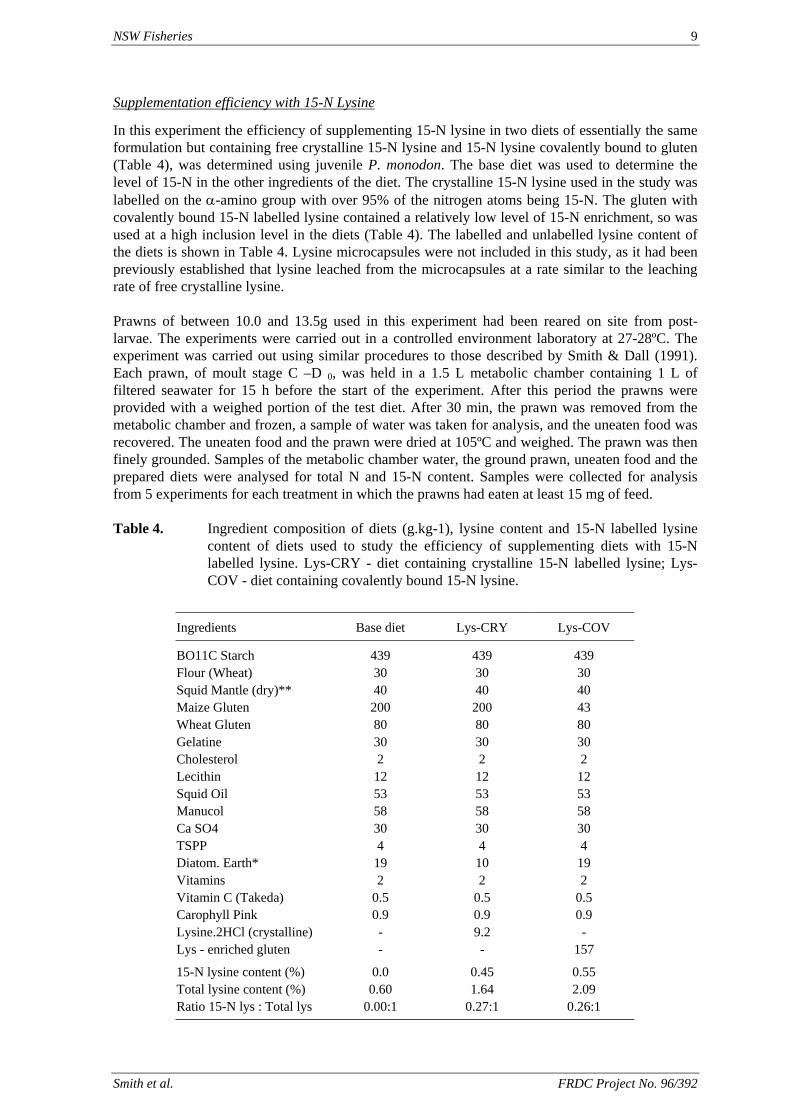
Supplementation efficiency with 15-N Lysine
In this experiment the efficiency of supplementing 15-N lysine in two diets of essentially the same formulation but containing free crystalline 15-N lysine and 15-N lysine covalently bound to gluten (Table 4), was determined using juvenile P. monodon. The base diet was used to determine the level of 15-N in the other ingredients of the diet. The crystalline 15-N lysine used in the study was labelled on the α-amino group with over 95% of the nitrogen atoms being 15-N. The gluten with covalently bound 15-N labelled lysine contained a relatively low level of 15-N enrichment, so was used at a high inclusion level in the diets (Table 4). The labelled and unlabelled lysine content of the diets is shown in Table 4. Lysine microcapsules were not included in this study, as it had been previously established that lysine leached from the microcapsules at a rate similar to the leaching rate of free crystalline lysine. Prawns of between 10.0 and 13.5g used in this experiment had been reared on site from post-larvae. The experiments were carried out in a controlled environment laboratory at 27-28ºC. The experiment was carried out using similar procedures to those described by Smith & Dall (1991). Each prawn, of moult stage C –D 0, was held in a 1.5 L metabolic chamber containing 1 L of filtered seawater for 15 h before the start of the experiment. After this period the prawns were provided with a weighed portion of the test diet. After 30 min, the prawn was removed from the metabolic chamber and frozen, a sample of water was taken for analysis, and the uneaten food was recovered. The uneaten food and the prawn were dried at 105ºC and weighed. The prawn was then finely grounded. Samples of the metabolic chamber water, the ground prawn, uneaten food and the prepared diets were analysed for total N and 15-N content. Samples were collected for analysis from 5 experiments for each treatment in which the prawns had eaten at least 15 mg of feed. Table 4. Ingredient composition of diets (g.kg-1), lysine content and 15-N labelled lysine
content of diets used to study the efficiency of supplementing diets with 15-N labelled lysine. Lys-CRY - diet containing crystalline 15-N labelled lysine; Lys-COV - diet containing covalently bound 15-N lysine.
Ingredients Base diet Lys-CRY Lys-COV
BO11C Starch 439 439 439 Flour (Wheat) 30 30 30 Squid Mantle (dry)** 40 40 40 Maize Gluten 200 200 43 Wheat Gluten 80 80 80 Gelatine 30 30 30 Cholesterol 2 2 2 Lecithin 12 12 12 Squid Oil 53 53 53 Manucol 58 58 58 Ca SO4 30 30 30 TSPP 4 4 4 Diatom. Earth* 19 10 19 Vitamins 2 2 2 Vitamin C (Takeda) 0.5 0.5 0.5 Carophyll Pink 0.9 0.9 0.9 Lysine.2HCl (crystalline) - 9.2 - Lys - enriched gluten - - 157
15-N lysine content (%) 0.0 0.45 0.55 Total lysine content (%) 0.60 1.64 2.09 Ratio 15-N lys : Total lys 0.00:1 0.27:1 0.26:1
Smith et al. FRDC Project No. 96/392
10 NSW Fisheries
Results and Discussion
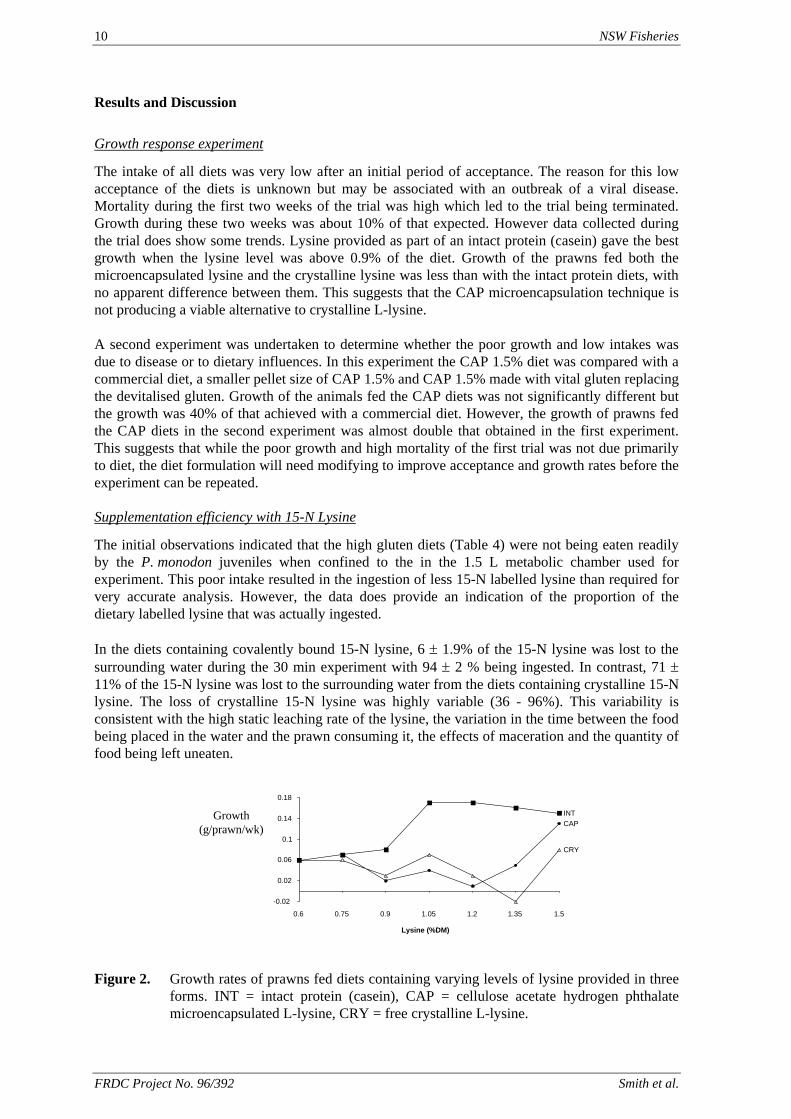
Growth response experiment
The intake of all diets was very low after an initial period of acceptance. The reason for this low acceptance of the diets is unknown but may be associated with an outbreak of a viral disease. Mortality during the first two weeks of the trial was high which led to the trial being terminated. Growth during these two weeks was about 10% of that expected. However data collected during the trial does show some trends. Lysine provided as part of an intact protein (casein) gave the best growth when the lysine level was above 0.9% of the diet. Growth of the prawns fed both the microencapsulated lysine and the crystalline lysine was less than with the intact protein diets, with no apparent difference between them. This suggests that the CAP microencapsulation technique is not producing a viable alternative to crystalline L-lysine. A second experiment was undertaken to determine whether the poor growth and low intakes was due to disease or to dietary influences. In this experiment the CAP 1.5% diet was compared with a commercial diet, a smaller pellet size of CAP 1.5% and CAP 1.5% made with vital gluten replacing the devitalised gluten. Growth of the animals fed the CAP diets was not significantly different but the growth was 40% of that achieved with a commercial diet. However, the growth of prawns fed the CAP diets in the second experiment was almost double that obtained in the first experiment. This suggests that while the poor growth and high mortality of the first trial was not due primarily to diet, the diet formulation will need modifying to improve acceptance and growth rates before the experiment can be repeated. Supplementation efficiency with 15-N Lysine
The initial observations indicated that the high gluten diets (Table 4) were not being eaten readily by the P. monodon juveniles when confined to the in the 1.5 L metabolic chamber used for experiment. This poor intake resulted in the ingestion of less 15-N labelled lysine than required for very accurate analysis. However, the data does provide an indication of the proportion of the dietary labelled lysine that was actually ingested. In the diets containing covalently bound 15-N lysine, 6 ± 1.9% of the 15-N lysine was lost to the surrounding water during the 30 min experiment with 94 ± 2 % being ingested. In contrast, 71 ± 11% of the 15-N lysine was lost to the surrounding water from the diets containing crystalline 15-N lysine. The loss of crystalline 15-N lysine was highly variable (36 - 96%). This variability is consistent with the high static leaching rate of the lysine, the variation in the time between the food being placed in the water and the prawn consuming it, the effects of maceration and the quantity of food being left uneaten.
Lysine (%DM)
-0.02
0.02
0.06
0.1
0.14
0.18
0.6 0.75 0.9 1.05 1.2 1.35 1.5
CRY
CAPINTGrowth
(g/prawn/wk)
Figure 2. Growth rates of prawns fed diets containing varying levels of lysine provided in three
forms. INT = intact protein (casein), CAP = cellulose acetate hydrogen phthalate microencapsulated L-lysine, CRY = free crystalline L-lysine.
FRDC Project No. 96/392 Smith et al.
NSW Fisheries 11
Discussion
We have established that the leaching loss of microencapsulated crystalline amino acids from pelleted diets was at a similar rate to that of free crystalline amino acids. The overall loss rate of these amino acids with gluten bound, steam pelleted diets was about 60% after 1 hour of static immersion in seawater. The loss rate was much higher (71 ± 11%) with partially eaten, alginate bound diets that had been in seawater for 30 min. Attempts to encapsulate lysine in chitin microcapsules at this laboratory were unsuccessful. Further work was carried out by a final year student in the Department of Engineering at the University of Queensland. He was unable to produce the type of free-flowing microcapsules that are need for effective use in prawn diets (Appendix 10.1). Commercial steam pelleting of diets does not appear to result in a marked improvement in the leaching characteristics, as a recent study has shown that the leaching loss of nitrogenous compounds from a widely used commercial prawn feed, was equivalent to 15% of the total nitrogen in the feed after 2 hour immersion (Smith et al., 2002). Hydrogenated vegetable oil microcapsules may be used in studies of essential amino acid requirements in cold-set, alginate-bound diets. A disadvantage of these microcapsules is that when used to provide supplementation of an amino acid at 1% of the diet, they also introduce 4% of saturated fatty acid. Though this extra addition can be made constant across all diets, it introduces a possibly detrimental artifact to the diets. The use of crystalline lysine in diets will result in erratic results due to the high leaching rate of the supplementary amino acids. Prawns that feed shortly after the diets are placed in the water will ingest far more of the supplementary amino acids that prawns that feed 30 minutes or more later. We recommend that in future research on essential amino acid requirements, covalently bound amino acids be used. This is despite the cost of preparing sufficient quantities of this material. This approach would provide the clearest possible data on essential amino acid requirements. The two studies into the efficiency of supplementation of amino acids were disrupted due to an outbreak of viral disease in the experimental prawns at Cleveland and to the poor acceptance of the low-lysine, high-gluten diets that were used in these studies. However, even with the limited data available, it is clear that a very high proportion of covalently bound 15-N lysine in the diet was being ingested, whereas most of the crystalline 15-N lysine leached into the surrounding water during the feeding process. It is unlikely that commercial feed manufacturers would consider it cost effective to supplement prawn feeds with crystalline amino acids. It is more likely that they would continue to use feeds containing about 400 g.kg-1 of crude protein as this produces good growth rates in P. monodon and has become the industry standard. As more pressure comes to bear on the feed manufacturers and prawn producers to reduce nitrogen loads in effluent waters, the need to reduce protein levels in the feed and balance the amino acids to meet requirements will become more pressing. It is to meet this future need that further research is required to develop a viable method for supplementing prawn feeds with essential amino acids.
Conclusions
In this study we have been unable to produced microencapsulated amino acids that are suitable of use in commercial or laboratory prepared feeds. The covalent binding of lysine to gluten provides a very useful tool to use in the study of essential amino acid requirements of crustaceans and probably other aquatic animals. 15-N labelled amino acids are useful in quantifying the intake and retention supplementary amino acids and provide a powerful tool in determining the effectiveness of different physical or chemical configurations of supplementary amino acids.
Smith et al. FRDC Project No. 96/392
12 NSW Fisheries
References
Chen H.Y., Len Y.T. & Roelants I. (1992) Effective supplementation of arginine in the diets of juvenile marine shrimp, Penaeus monodon. Aquaculture, 108: 87-95.
Dall W. & Smith D.M. (1987) Changes in protein-bound and free amino acids in the muscle of the tiger prawn Penaeus esculentus during starvation. Marine Biol., 95: 509-520.
Deasy P.B. (1984) Coacervation - Phase separation procedures using non-aqueous vehicles. In: Marcel Dekker (ed). Microencapsulation and related drug processes. New York, pp 97-117.
Deshimaru O. (1981) Studies on the nutrition and diet for prawn Penaeus japonicus. Mem. Kagosjima Prefect. Fish. Expt. Stn., 12: 1-118.
Deshimaru, O. & Kuroki K. (1974) Studies on a purified diet for prawn. IV. Evaluation of protein, amino acids and their mixture as nitrogen source. Bull. Jap. Soc. Sci. Fish., 41: 101-103.
Divakaran S. (1994) An evaluation of polyamino acids as an improved amino acid source in marine shrimp (Penaeus vannamei) feeds. Aquaculture, 128: 363-366.
Fox J.M., Lawrence A.L. & Li-Chan E. (1995) Dietary requirement for lysine by juvenile Penaeus vannamei using intact and free amino acid sources. Aquaculture, 131: 279-290.
Glencross B.D, Smith D.M, Tonks M.L, Tabrett S.J & Williams K.C. (1999) A reference diet for nutritional studies of the giant tiger prawn Penaeus monodon. Aquaculture Nutrition, 5: 33-39.
Grieve P. (1994) Amino acid supplementation of aquaculture feeds: A technology audit. Final Report to Fisheries Research and Development Corporation, Project 93/120-07, pp 60.
Litster P., Smith J.D., Vijaya D.M. & Bhashkar H.P. (1993) Microencapsulation techniques for prawn feeds formulation. Final Report to the Fishing Industry Research Council, FIRC Project 17 (FRDC ref 90/65).
Mi F.L., Tseng Y.C, Chen C.T. & Shyu S.S. (1997a) Preparation and release properties of biodegradable chitin microcapsules: I. Preparation of 6-mercaptopurine microcapsules by phase separation. J. Microencapsulation, 14: 15-25.
Mi F.L. Tseng Y.C, Chen C.T. & Shyu S.S. (1997b) Preparation and release properties of biodegradable chitin microcapsules: II. Sustained release of 6-mercaptopurine from chitin microcapsules. J. Microencapsulation, 14: 211-223.
Millamena O.M., Bautista-Teruel M.N. & Kanazawa A. (1996). Methionine requirement of juvenile tiger shrimp Penaeus monodon Fabricius. Aquaculture, 143: 403-410.
Smith D.M. & Dall W. (1991) Metabolism of proline by the tiger prawn Penaeus esculentus. Mar. Biol., 110:85-91.
Smith D.M., Burford M.A., Tabrett S.J., Irvin S.J. & Ward L. (2002) The effect of feeding frequency on water quality and growth of the black tiger shrimp Penaeus monodon. Aquaculture, 207: 125-136.
Teshima S., Kanazawa A. & Koshio S. (1992) Supplemental effects of methionine-enriched plastein in Penaeus japonicus diets. Aquaculture, 101: 85-93.
Teshima S., Kanazawa A. & Uchiyama Y. (1986) Dietary value of several proteins and supplemental amino acids for larvae of the prawn Penaeus japonicus. Aquaculture, 51: 225-235.
FRDC Project No. 96/392 Smith et al.
NSW Fisheries 13
4.2. Cost effectiveness of feed attractants and/or stimulants in diets for Penaeus monodon
David M. Smith, Simon J. Tabrett, Margaret C. Barclay & Simon J. Irvin
CSIRO Marine Laboratories, P.O. Box 120, Cleveland Qld 4163
Summary
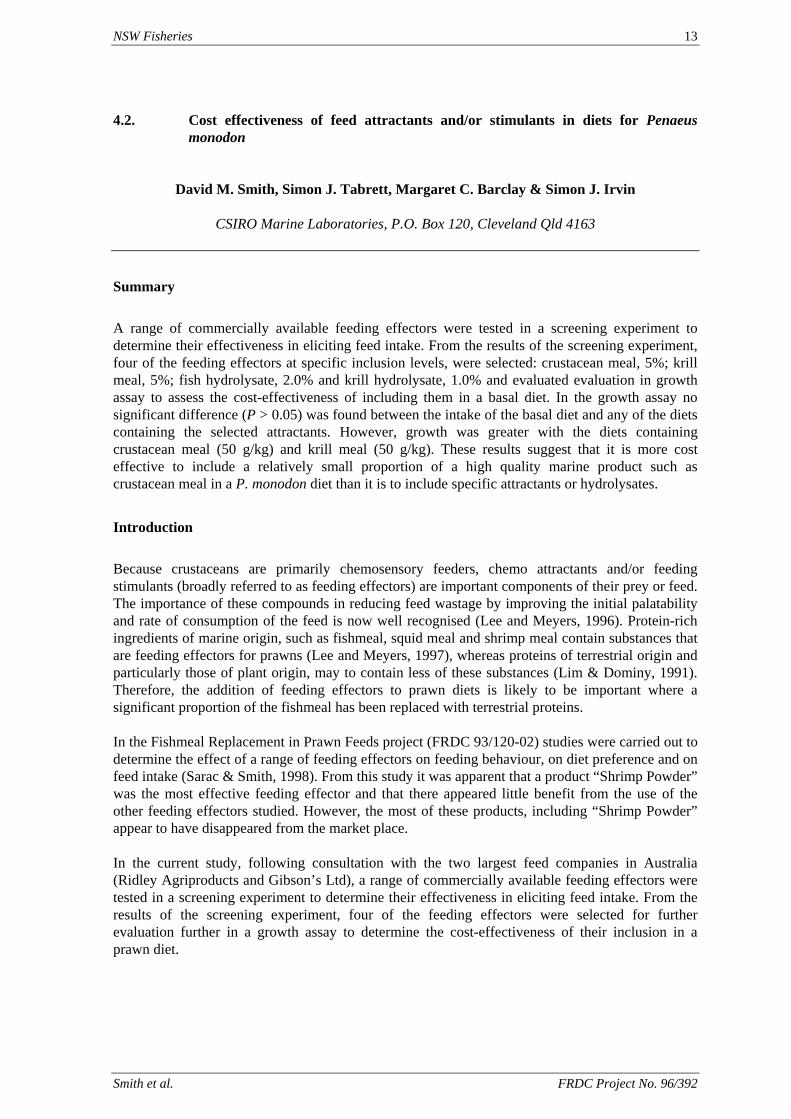
A range of commercially available feeding effectors were tested in a screening experiment to determine their effectiveness in eliciting feed intake. From the results of the screening experiment, four of the feeding effectors at specific inclusion levels, were selected: crustacean meal, 5%; krill meal, 5%; fish hydrolysate, 2.0% and krill hydrolysate, 1.0% and evaluated evaluation in growth assay to assess the cost-effectiveness of including them in a basal diet. In the growth assay no significant difference (P > 0.05) was found between the intake of the basal diet and any of the diets containing the selected attractants. However, growth was greater with the diets containing crustacean meal (50 g/kg) and krill meal (50 g/kg). These results suggest that it is more cost effective to include a relatively small proportion of a high quality marine product such as crustacean meal in a P. monodon diet than it is to include specific attractants or hydrolysates.
Introduction
Because crustaceans are primarily chemosensory feeders, chemo attractants and/or feeding stimulants (broadly referred to as feeding effectors) are important components of their prey or feed. The importance of these compounds in reducing feed wastage by improving the initial palatability and rate of consumption of the feed is now well recognised (Lee and Meyers, 1996). Protein-rich ingredients of marine origin, such as fishmeal, squid meal and shrimp meal contain substances that are feeding effectors for prawns (Lee and Meyers, 1997), whereas proteins of terrestrial origin and particularly those of plant origin, may to contain less of these substances (Lim & Dominy, 1991). Therefore, the addition of feeding effectors to prawn diets is likely to be important where a significant proportion of the fishmeal has been replaced with terrestrial proteins. In the Fishmeal Replacement in Prawn Feeds project (FRDC 93/120-02) studies were carried out to determine the effect of a range of feeding effectors on feeding behaviour, on diet preference and on feed intake (Sarac & Smith, 1998). From this study it was apparent that a product “Shrimp Powder” was the most effective feeding effector and that there appeared little benefit from the use of the other feeding effectors studied. However, the most of these products, including “Shrimp Powder” appear to have disappeared from the market place. In the current study, following consultation with the two largest feed companies in Australia (Ridley Agriproducts and Gibson’s Ltd), a range of commercially available feeding effectors were tested in a screening experiment to determine their effectiveness in eliciting feed intake. From the results of the screening experiment, four of the feeding effectors were selected for further evaluation further in a growth assay to determine the cost-effectiveness of their inclusion in a prawn diet.
Smith et al. FRDC Project No. 96/392
14 NSW Fisheries
Materials and Methods
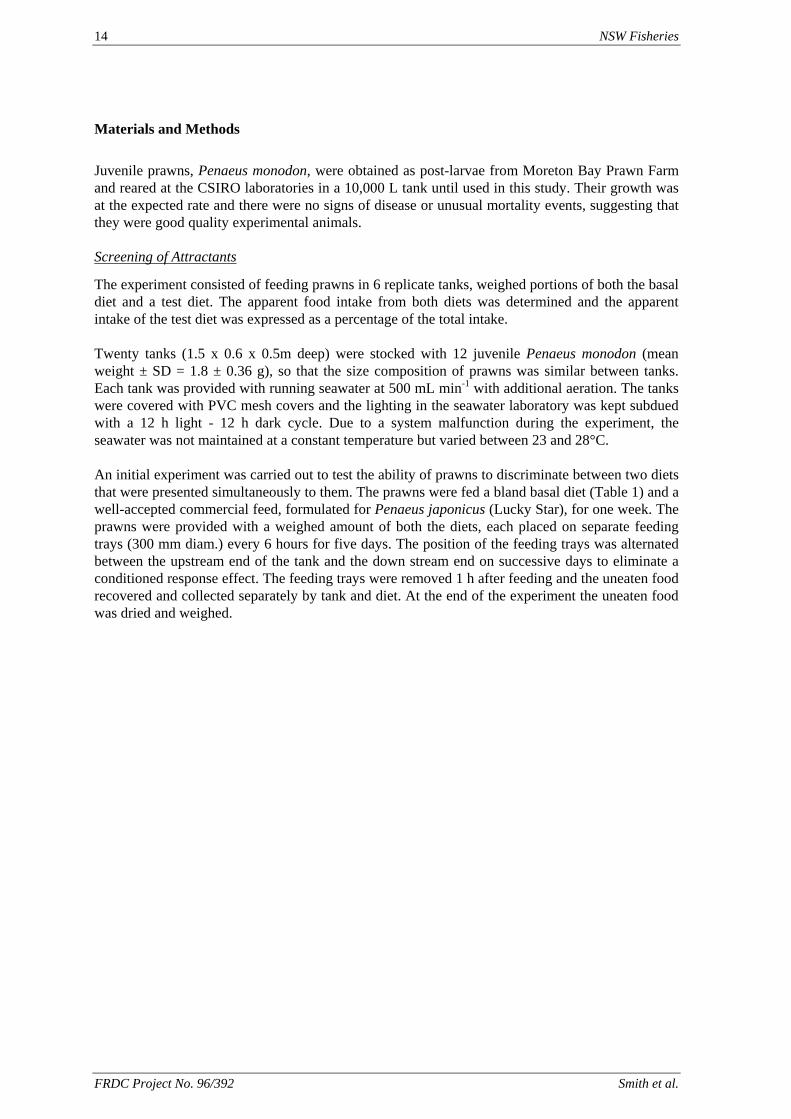
Juvenile prawns, Penaeus monodon, were obtained as post-larvae from Moreton Bay Prawn Farm and reared at the CSIRO laboratories in a 10,000 L tank until used in this study. Their growth was at the expected rate and there were no signs of disease or unusual mortality events, suggesting that they were good quality experimental animals. Screening of Attractants
The experiment consisted of feeding prawns in 6 replicate tanks, weighed portions of both the basal diet and a test diet. The apparent food intake from both diets was determined and the apparent intake of the test diet was expressed as a percentage of the total intake. Twenty tanks (1.5 x 0.6 x 0.5m deep) were stocked with 12 juvenile Penaeus monodon (mean weight ± SD = 1.8 ± 0.36 g), so that the size composition of prawns was similar between tanks. Each tank was provided with running seawater at 500 mL min-1 with additional aeration. The tanks were covered with PVC mesh covers and the lighting in the seawater laboratory was kept subdued with a 12 h light - 12 h dark cycle. Due to a system malfunction during the experiment, the seawater was not maintained at a constant temperature but varied between 23 and 28°C. An initial experiment was carried out to test the ability of prawns to discriminate between two diets that were presented simultaneously to them. The prawns were fed a bland basal diet (Table 1) and a well-accepted commercial feed, formulated for Penaeus japonicus (Lucky Star), for one week. The prawns were provided with a weighed amount of both the diets, each placed on separate feeding trays (300 mm diam.) every 6 hours for five days. The position of the feeding trays was alternated between the upstream end of the tank and the down stream end on successive days to eliminate a conditioned response effect. The feeding trays were removed 1 h after feeding and the uneaten food recovered and collected separately by tank and diet. At the end of the experiment the uneaten food was dried and weighed.
FRDC Project No. 96/392 Smith et al.
NSW Fisheries 15
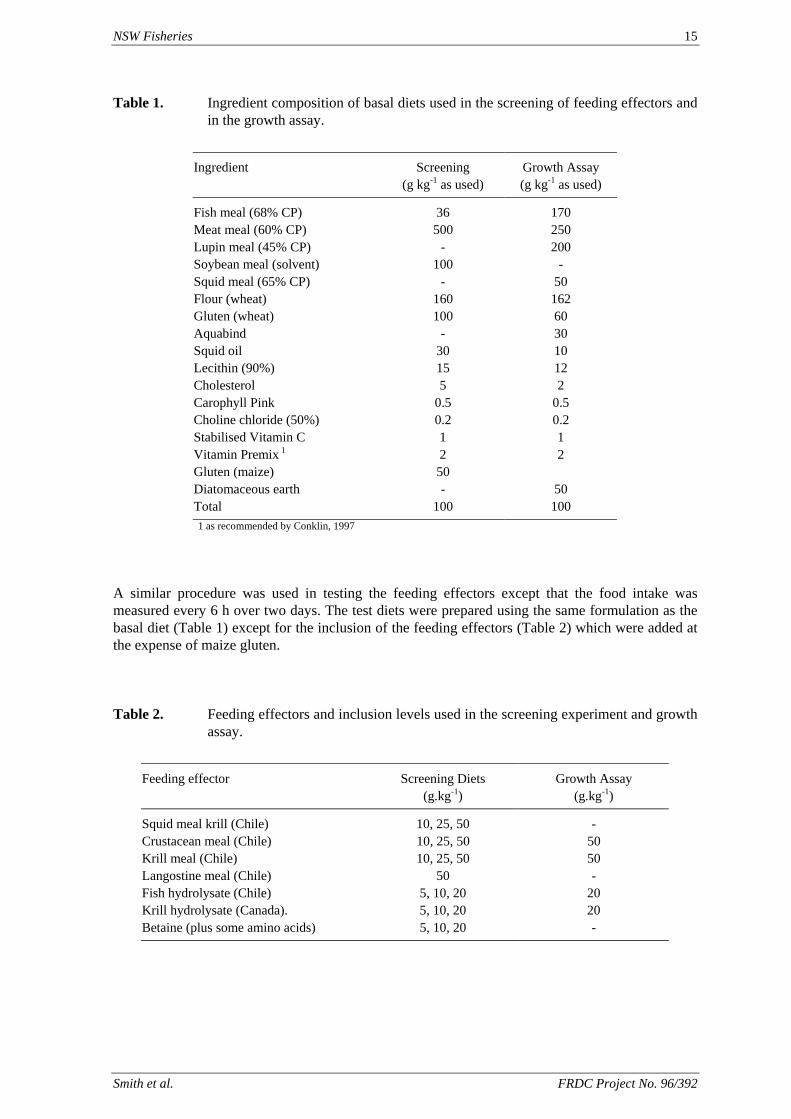
Table 1. Ingredient composition of basal diets used in the screening of feeding effectors and in the growth assay.
Ingredient Screening Growth Assay (g kg-1 as used) (g kg-1 as used)
Fish meal (68% CP) 36 170 Meat meal (60% CP) 500 250 Lupin meal (45% CP) - 200 Soybean meal (solvent) 100 - Squid meal (65% CP) - 50 Flour (wheat) 160 162 Gluten (wheat) 100 60 Aquabind - 30 Squid oil 30 10 Lecithin (90%) 15 12 Cholesterol 5 2 Carophyll Pink 0.5 0.5 Choline chloride (50%) 0.2 0.2 Stabilised Vitamin C 1 1 Vitamin Premix 1 2 2 Gluten (maize) 50 Diatomaceous earth - 50 Total 100 100 1 as recommended by Conklin, 1997
A similar procedure was used in testing the feeding effectors except that the food intake was measured every 6 h over two days. The test diets were prepared using the same formulation as the basal diet (Table 1) except for the inclusion of the feeding effectors (Table 2) which were added at the expense of maize gluten. Table 2. Feeding effectors and inclusion levels used in the screening experiment and growth
assay.
Feeding effector Screening Diets (g.kg-1)
Growth Assay (g.kg-1)
Squid meal krill (Chile) 10, 25, 50 - Crustacean meal (Chile) 10, 25, 50 50 Krill meal (Chile) 10, 25, 50 50 Langostine meal (Chile) 50 - Fish hydrolysate (Chile) 5, 10, 20 20 Krill hydrolysate (Canada). 5, 10, 20 20 Betaine (plus some amino acids) 5, 10, 20 -
Smith et al. FRDC Project No. 96/392
16 NSW Fisheries
Cost-effectiveness growth experiment
The experiment consisted of a 6 week growth assay with five treatments (basal diet and four diets containing feeding effectors) each replicated five times. Twenty-five tanks (1.5 x 0.6 x 0.5m deep) were each stocked with 12 juvenile P. monodon (mean weight ± SD = 2.2 ± 0.35 g), so that the size composition of prawns was similar between tanks. The tank array used in the screening experiment was used in this experiment under the same operating conditions except that water temperatures were maintained at 28°C. The basal diet was used in the growth assay was a modification of the basal diet used in the screening experiment. It was designed to be similar to a practical commercial formulation containing a minimum amount of fishmeal (or other ingredients of marine origin) and significant proportions of dehulled lupin meal and meat meal (Table 1). The basal diet and test diets were made to the same formulation except that feeding effectors were added at the expense of diatomaceous earth. The feeding effectors and the inclusion level at which they were used (Table 2) were selected on the basis of the results of the screening experiment. The prawns were conditioned to the diets by feeding them on the basal diet for one week before the start of the experiment. Throughout the experiment, a weighed portion of the allocated diet was placed on a feeding tray (300 mm diam.) in each tank every 6 hours. At the end of this period, and immediately before the next feeding, the tray was removed from the tank and the uneaten food recovered. The uneaten food from each tank was collected over successive 3-week periods, and dried and weighed. The prawns were weighed at the start of the experiment, after 3 weeks and at 6 weeks. Any mortalities were noted and a dead or missing prawn was replaced with a tagged prawn of similar size. Daily water temperatures and salinities were recorded. Diet preparation
The ingredients were dry mixed and a volume of water equivalent to about 40% of the weight of dry ingredients water was added and mixed further to form a crumbly dough. The dough was extruded through the mincer attachment on a Hobart mixer (Hobart Corporation, Ohio, USA). The extruded, spaghetti-like strands were steamed for 5 min in a commercial food steamer (Curtin, Sydney), air dried overnight and broken-up into pellets 10-15 mm in length. The pellets were stored at -10ºC until used. The dry matter content of the diets was determined by drying at 105°C for 4 h. A correction factor for leaching loss from the diets was determined from weighed samples of each diet that were placed in a tank of seawater for 6 h. On removal from the water, they were lightly rinsed with distilled water and dried at 105°C and weighed. Statistical analysis
The average weight, survival or food intake within a tank was the statistical unit for the data analysis. Differences across treatments in initial weight, growth rate, specific growth rate (SGR), survival, apparent food intake, daily food intake as a percentage of body weight (%BW.d-1) and FCR were tested using one-way ANOVA in accordance with the design of the experiment. Diet preference data (ratio of weight of attractant diet consumed to total weight of food consumed), survival and food intake data (%BW.d-1) were arcsine transformed prior to analysis. Differences between treatment effects were examined a-posteriorly using Fischer’s protected ‘t’ test (Snedecor & Cochran, 1967) wherein differences between means were examined only where the ‘F’ test of the ANOVA was significant (P < 0.05).
FRDC Project No. 96/392 Smith et al.
NSW Fisheries 17
Results
Screening of feeding effectors
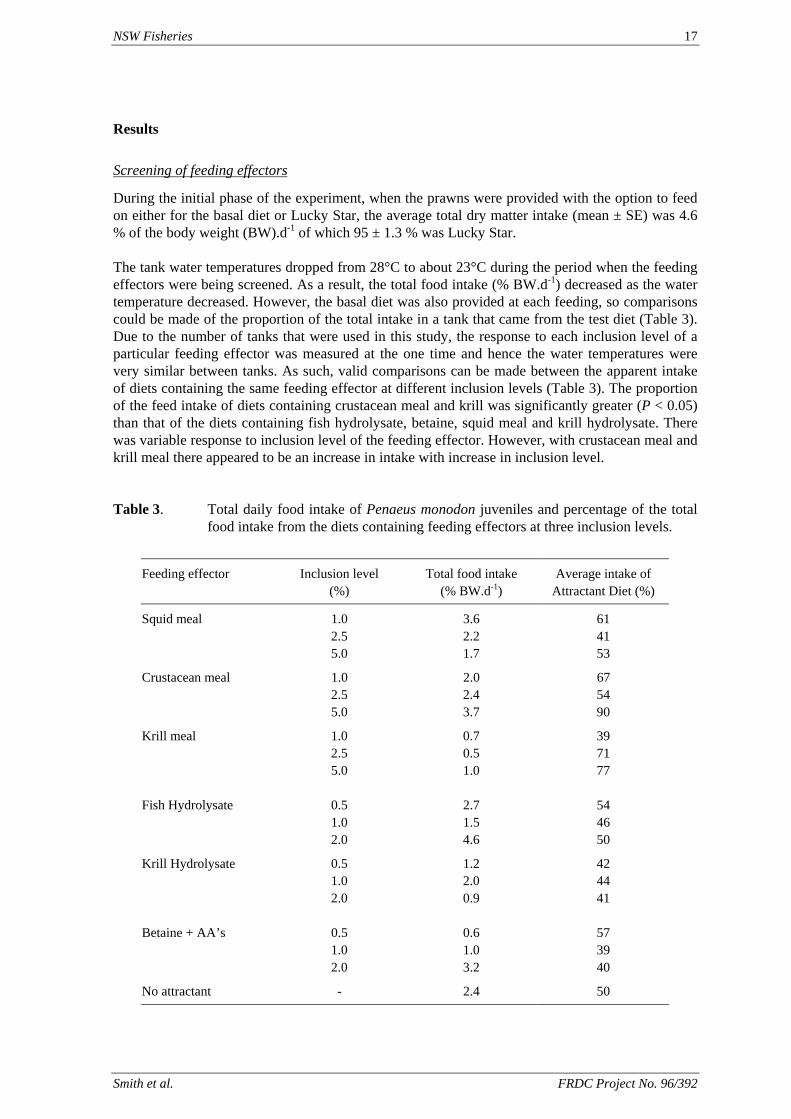
During the initial phase of the experiment, when the prawns were provided with the option to feed on either for the basal diet or Lucky Star, the average total dry matter intake (mean ± SE) was 4.6 % of the body weight (BW).d-1 of which 95 ± 1.3 % was Lucky Star. The tank water temperatures dropped from 28°C to about 23°C during the period when the feeding effectors were being screened. As a result, the total food intake (% BW.d-1) decreased as the water temperature decreased. However, the basal diet was also provided at each feeding, so comparisons could be made of the proportion of the total intake in a tank that came from the test diet (Table 3). Due to the number of tanks that were used in this study, the response to each inclusion level of a particular feeding effector was measured at the one time and hence the water temperatures were very similar between tanks. As such, valid comparisons can be made between the apparent intake of diets containing the same feeding effector at different inclusion levels (Table 3). The proportion of the feed intake of diets containing crustacean meal and krill was significantly greater (P < 0.05) than that of the diets containing fish hydrolysate, betaine, squid meal and krill hydrolysate. There was variable response to inclusion level of the feeding effector. However, with crustacean meal and krill meal there appeared to be an increase in intake with increase in inclusion level. Table 3. Total daily food intake of Penaeus monodon juveniles and percentage of the total
food intake from the diets containing feeding effectors at three inclusion levels.
Feeding effector Inclusion level (%)
Total food intake (% BW.d-1)
Average intake of Attractant Diet (%)
Squid meal 1.0 3.6 61 2.5 2.2 41 5.0 1.7 53
Crustacean meal 1.0 2.0 67 2.5 2.4 54 5.0 3.7 90
Krill meal 1.0 0.7 39 2.5 0.5 71 5.0 1.0 77 Fish Hydrolysate 0.5 2.7 54 1.0 1.5 46 2.0 4.6 50
Krill Hydrolysate 0.5 1.2 42 1.0 2.0 44 2.0 0.9 41 Betaine + AA’s 0.5 0.6 57 1.0 1.0 39 2.0 3.2 40
No attractant - 2.4 50
Smith et al. FRDC Project No. 96/392
18 NSW Fisheries
Cost-effectiveness growth assay
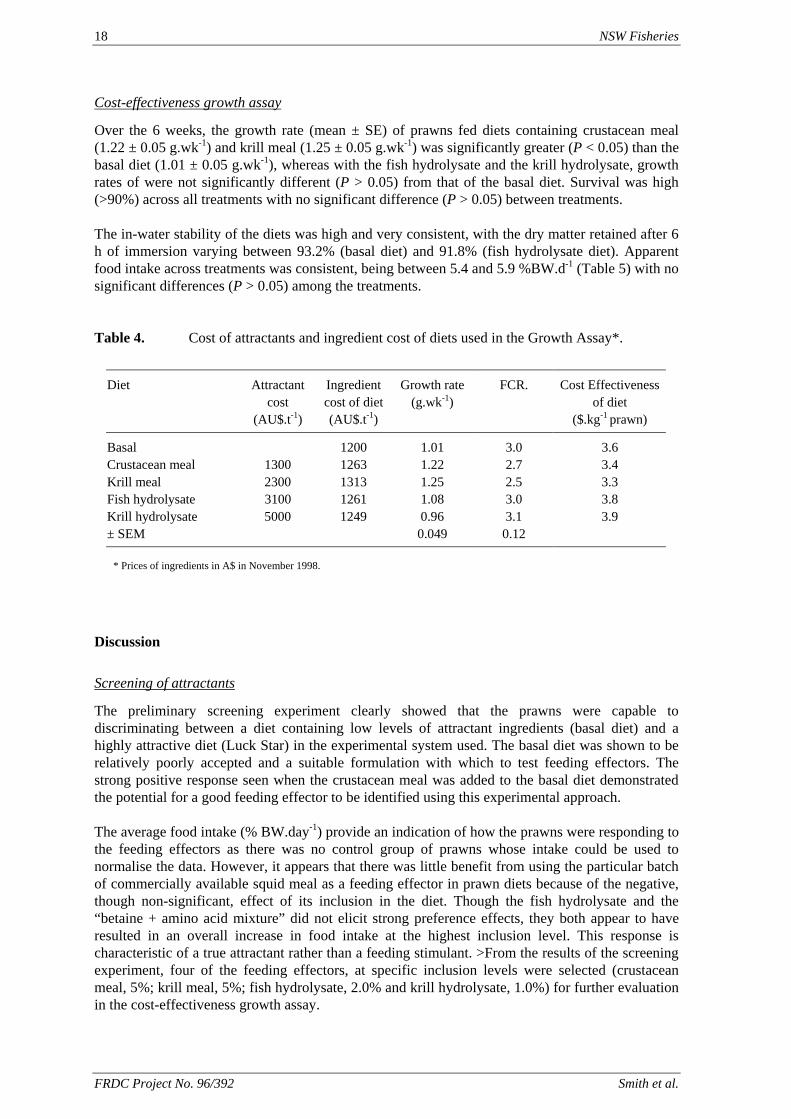
Over the 6 weeks, the growth rate (mean ± SE) of prawns fed diets containing crustacean meal (1.22 ± 0.05 g.wk-1) and krill meal (1.25 ± 0.05 g.wk-1) was significantly greater (P < 0.05) than the basal diet (1.01 ± 0.05 g.wk-1), whereas with the fish hydrolysate and the krill hydrolysate, growth rates of were not significantly different (P > 0.05) from that of the basal diet. Survival was high (>90%) across all treatments with no significant difference (P > 0.05) between treatments. The in-water stability of the diets was high and very consistent, with the dry matter retained after 6 h of immersion varying between 93.2% (basal diet) and 91.8% (fish hydrolysate diet). Apparent food intake across treatments was consistent, being between 5.4 and 5.9 %BW.d-1 (Table 5) with no significant differences (P > 0.05) among the treatments. Table 4. Cost of attractants and ingredient cost of diets used in the Growth Assay*.
Diet Attractant cost
(AU$.t-1)
Ingredient cost of diet (AU$.t-1)
Growth rate (g.wk-1)
FCR. Cost Effectiveness of diet
($.kg-1 prawn)
Basal 1200 1.01 3.0 3.6 Crustacean meal 1300 1263 1.22 2.7 3.4 Krill meal 2300 1313 1.25 2.5 3.3 Fish hydrolysate 3100 1261 1.08 3.0 3.8 Krill hydrolysate 5000 1249 0.96 3.1 3.9 ± SEM 0.049 0.12
* Prices of ingredients in A$ in November 1998.
Discussion
Screening of attractants
The preliminary screening experiment clearly showed that the prawns were capable to discriminating between a diet containing low levels of attractant ingredients (basal diet) and a highly attractive diet (Luck Star) in the experimental system used. The basal diet was shown to be relatively poorly accepted and a suitable formulation with which to test feeding effectors. The strong positive response seen when the crustacean meal was added to the basal diet demonstrated the potential for a good feeding effector to be identified using this experimental approach. The average food intake (% BW.day-1) provide an indication of how the prawns were responding to the feeding effectors as there was no control group of prawns whose intake could be used to normalise the data. However, it appears that there was little benefit from using the particular batch of commercially available squid meal as a feeding effector in prawn diets because of the negative, though non-significant, effect of its inclusion in the diet. Though the fish hydrolysate and the “betaine + amino acid mixture” did not elicit strong preference effects, they both appear to have resulted in an overall increase in food intake at the highest inclusion level. This response is characteristic of a true attractant rather than a feeding stimulant. >From the results of the screening experiment, four of the feeding effectors, at specific inclusion levels were selected (crustacean meal, 5%; krill meal, 5%; fish hydrolysate, 2.0% and krill hydrolysate, 1.0%) for further evaluation in the cost-effectiveness growth assay.
FRDC Project No. 96/392 Smith et al.
NSW Fisheries 19
Cost-effectiveness growth experiment
No significant difference (P > 0.05) was found between the intake of the basal diet and any of the diets containing the attractants, with the intake varying between 4.9 and 5.4 %BW.d-1 (mean ± SD = 5.2 ± 0.54). This suggests that prawns may either feed to satiation on any reasonable diet if there was no alternative available, or that the basal diet contained sufficient feeding effectors to make the addition of further feeding unnecessary. The basal diet used in the growth assay contained more fishmeal than the basal diet used in the screening experiment. The additional fishmeal may have contributed sufficient feeding effectors to raise the attractiveness of the diet over a threshold, which resulted in the higher than expected food intake. However, from a practical perspective, the formulation of the basal diet contained the absolute minimum of fishmeal or marine product and hence was a valid formulation to use to assess the cost effectiveness of the feeding effectors. The growth rates of the prawns varied between 1.0 and 1.2 g.wk-1 (Table 4) with a significantly higher growth rate (P < 0.05) with the diets containing crustacean meal and krill meal. Given that there was not a significant difference in food intake, this suggests that the crustacean meal and the krill meal provided additional nutrients that were not provided by the other feeding effectors. In addition, as there was not a significant difference in food intake, feed conversion ratios (FCR), which varied between 2.5 and 3.1 (Table 4), tended to be a reflection of the growth rates. Using ingredient costs that were obtained from suppliers and feed industry sources at the time of the experiment (November 1998), the cost of feed required to produce 1 kg of live prawn was found to vary between $3.3 and $3.9 (Table 4). There appeared to be an economic benefit in adding the crustacean meal and krill meal to the diet whereas there appeared to be no benefit of adding the fish or krill hydrolysates. These results indicate that the addition of specific attractants to a typical prawn diet is unlikely to result in an increase in food intake or to be cost effective. The selection of quality feed ingredients of marine origin, included at a minimum of 200 g kg-1 of the diet, appears a more cost-effective option.
References
Lee P.G. & Meyers S.P. (1996) Chemoattraction and feeding stimulation in crustaceans. Aquaculture Nutrition, 2: 157-164.
Lee P.G. & Meyers S.P. (1997) Chemoattraction and feeding stimulation In: Crustacean Nutrition, Advances in World Aquaculture, Volume 6. (ed. by L.R. D’Abramo, D.E. Conklin & D.M. Akiyama), World Aquaculture Society, Baton Rouge, Louisiana, pp. 292-352.
Lim C. & Dominy W.G. (1991) Utilization of plant proteins by warmwater fish. In: Proceedings of the Aquaculture Feed Processing and Nutrition Workshop, 19-25 September 1991, Thailand and Indonesia, (ed. by D.M. Akiyama & R.K.H. Tan), American Soybean Association, Singapore, pp 80-98.
Sarac H.Z. & Smith D.M. (1998) Evaluation of commercial feed attractants. In: Smith, D.M. (Ed.), Fishmeal replacement in aquaculture feeds for prawns, Final Report of Project 120-02, Fisheries Research and Development Corporation, Canberra, pp. 122-137.
Snedecor G.W. & Cochran W.G. (1967) Statistical Methods, 6th Edition. Iowa University Press, Iowa, USA.
Smith et al. FRDC Project No. 96/392
20 NSW Fisheries
4.3. Protein to energy relationships for the black tiger prawn Penaeus monodon
David M. Smith & Simon J. Tabrett
CSIRO Marine Laboratories, P.O. Box 120, Cleveland Qld 4163
Summary
The response of the black tiger prawn, Penaeus monodon, to different levels of dietary digestible protein and energy has been studied. The protocol adopted was designed to eliminate the confounding factors seen in previous protein/energy studies with this species. The results of the study have suggested that with a low energy diet (13.5 MJ.kg-1) the optimum P:E ratio is about 22.2 mg.kJ-1 which corresponds to a dietary DCP content of 300 g .kg-1. However, with the higher energy diets (15.0 and 16.5 MJ.kg-1), energy did not appear to become limiting even with diets containing in excess of 45 g .kg-1 DCP. It is possible that the use of carbohydrate to adjust dietary energy has added an additional variable that has confounded the interpretation of the results. Because of the importance of defining the protein to energy relationship in prawns, this work should continue. An alternative approach would be to look at the protein to energy requirements based on a single essential amino acid such as lysine and to vary the energy content of the diets using a lysine deficient protein.
Introduction
A nutritionally balanced pelleted diet is essential for the long-term viability of an intensive prawn aquaculture industry. The development of an improved artificial diet for prawns requires a knowledge and understanding of their nutrient requirements. The protein requirement of Penaeus monodon is generally accepted as being 400 – 500 g.kg-1 of the diet. Protein is one of the most expensive components of the current commercial feeds. Prawns utilise protein for growth and also as a source of energy. However, it is expensive and possibly inefficient to feed protein as an energy source. The main waste product of protein catabolism is ammonia, which is excreted across the gills by the prawn (Chen and Nan, 1994). Nitrogen, particularly ammonia, is one of the major waste nutrients in aquaculture pond water, having an impact on the cultured animals, and on the environment when it is discharged from the ponds. As ammonia concentration in the water increases, the ability of the prawns to excrete ammonia is diminished, causing a build up of waste products in the blood and tissue (Chien, 1992). Ammonia is toxic to P. monodon at more than 42.6 mg.L-1 (Chen et al., 1990), but will also depress growth at lower concentrations (Mevel & Chamroux, 1981). Balancing the diet for protein and energy such that protein is utilised for growth would reduce the excretion of ammonia by the prawns. This would aid pond management, reduce the impact on the environment and also reduce the risk of retarding growth through elevated ammonia levels in the water. A number of studies have been conducted to identify the optimum protein to energy ratio of prawn diets, where protein utilisation for growth is maximised and lipid and carbohydrate are used as energy sources (Sedgwick, 1979; Smith et al., 1985; Bautista, 1986; Hajra et al., 1988). In these studies, the methods of estimating dietary protein and energy varied from the use of physiological values found for fish or pigs, to direct analysis of the diets. However in none of the studies was the digestible (or metabolisable) energy of the diets used to determine the optimum dietary protein to energy ratio. Smith & Saraç (1998) studied the response of P. monodon to three series of semi-purified diets that were formulated to specific digestible energy (DE) and digestible crude protein
FRDC Project No. 96/392 Smith et al.
NSW Fisheries 21
(DCP) content. They found that the prawns’ growth response increased with increased DCP intake and protein content of the diet (despite the DCP content extending to about 570 g.kg-1). They also found that there was no apparent relationship between DE intake and growth response. In this study, we sought to clarify the issues identified by Smith & Saraç (1998) using similar diets, by quantifying as accurately as possible the apparent food intake (AFI) of the prawns. Three isoenergenic series of diets (on a DE basis) have been formulated each with diets varying incrementally in DCP content. We studied the growth response of sub-adult Penaeus monodon to these diets over a 28-day period under a restricted feeding regimen.
Materials and Methods
Experimental design
The growth of individual Penaeus monodon was measured over 28 days, to determine their response to varying levels of digestible crude protein (DCP) intake at either of three levels of digestible energy (DE). Prawns of about 12g (11.94 ± 0.79g) live weight were held individually in 40 × 70L fibreglass tanks. Each tank was supplied with heated seawater at a rate of 500mL.min-1 and each tank was individually aerated. Water temperature in the tanks was maintained at 28.0 ± 0.4°C. The trial was repeated 3 times with new animals of similar weight from the same stock. Animals and treatments were assigned to tanks in a completely randomised design and the randomisation was repeated for each iteration. There were two replicates of each protein/energy treatment within each iteration of the trial. Animals were allowed to acclimate to experimental diets and conditions for 5 days prior to the start of each 28d period. The prawns were weighed at the start of the trial, halfway through the experiment (day 14) and again on day 28. A high quality commercial diet was used as a control. This diet was fed to 4 animals in each iteration and offered ad libitum. The prawns on the experimental diets were fed twice daily at below the satiation intake. This strategy was adopted to ensure that differences in growth response were due only to the dietary protein to energy ratio and not confounded by compensatory changes in food intake. Feeding was restricted to 3% body weight (BW). d-1 because at this feeding rate all animals consumed their daily ration except when they were in late pre-moult. All uneaten food (refusals) were collected, dried and weighed. The specific growth rate (SGR) of each prawn was calculated using the formula:
T BWI) BWF - ( )- (%.dSGR lnln1001 ×=
where BWF is the final weight, BWI is the initial weight and T is time in days. Diets
The three series of diets were formulated and prepared to provide three levels of DE (13.5, 15.0 and 16.5 MJ/kg-1 Dry Matter (DM)), each with six digestible crude protein levels (Table 1). The diets were based on four semi-purified ingredients whose digestible protein and digestible energy content had been previously determined. These ingredients were defatted squid mantle meal, pre-gelatinised starch, squid oil and diatomaceous earth (used as a filler). The proportions of these ingredients in each of the 18 diets were adjusted incrementally to provide the required digestible protein and digestible energy levels. The lipid content of the diets was held constant at 7% DM. A vitamin pre-mix and alginate binder were also included in the diets at a constant inclusion level. A commercial feed for Penaeus japonicus (Ebistar #12) was used as a reference diet.
Smith et al. FRDC Project No. 96/392
22 NSW Fisheries
Defatted squid mantle meal was prepared by heat–pump drying cleaned squid mantle. The dry mantles were ground into a meal with a hammermill and the lipid extracted using a hexane/ethanol (2:1) solvent mixture. The experimental diets were prepared by mixing all dry ingredients thoroughly in a commercial food mixer (Hobart). Water (a volume equivalent to about 60% of the weight of dry ingredients) was added to make a dough and again mixed thoroughly. The dough was extruded through a 3mm die into a bath of 10% calcium chloride (CaCl2) and allowed to sit for 2 minutes before being drained and spread into mesh trays for drying. The diets were dried at ambient temperature in a fume hood for approx. 24h until they are approximately 88%DM. Chemical analysis
Samples of each diet were homogenised in a water-cooled Knifetec grinder (Tekator, Sweden) so that all the material passed through a 1.0 mm sieve and were analysed for DM and cholesterol content, and diets for DM, ash, crude protein, total lipid, gross energy and cholesterol content. DM was determined by weighing before and after drying at 105°C for 16 h and cooling in a vacuum desiccator; ash by heating a weighed and dried sample at 550°C for 16 h before cooling in a desiccator and re-weighing (method 938.08, AOAC 1999). Crude protein was determined by the Kjeldahl method. Total lipid was determined gravimetrically following a chloroform-methanol (2:1) extraction using the method of Folch, Lees & Sloane-Stanley (1957). Gross energy was determined by isothermal bomb calorimetry using a Leco AC200 Bomb Calorimeter (Leco Corp. St. Joseph, MI, USA). Pellet Stability
The dry matter of each diet was determined by drying a 1g sample at 105°C overnight. The dry matter stability in seawater was also determined for each diet. Duplicate samples of each diet (approx. 1g) were weighed, placed into a container with a 1mm nylon mesh base that was immersed in 100mL of seawater in a capped jar. The jars are gently agitated (40 oscillations.min-1) in a shaking water bath at 28°C for 4h. After this period the mesh containers and pellets were removed and rinsed with deionized water and the pellets dried at 105°C overnight and weighed. Pellet stability (PS) was calculated as the percent of dry matter retained by the 1mm screen after 4 hours. Stability was used to apply a leaching loss correction to the mass of uneaten food (r) and adjust the estimate of food intake (I) using the formula:
PS100 r - DM I offered
×=
where DMoffered is the dry weight of food offered to each animal.
FRDC Project No. 96/392 Smith et al.
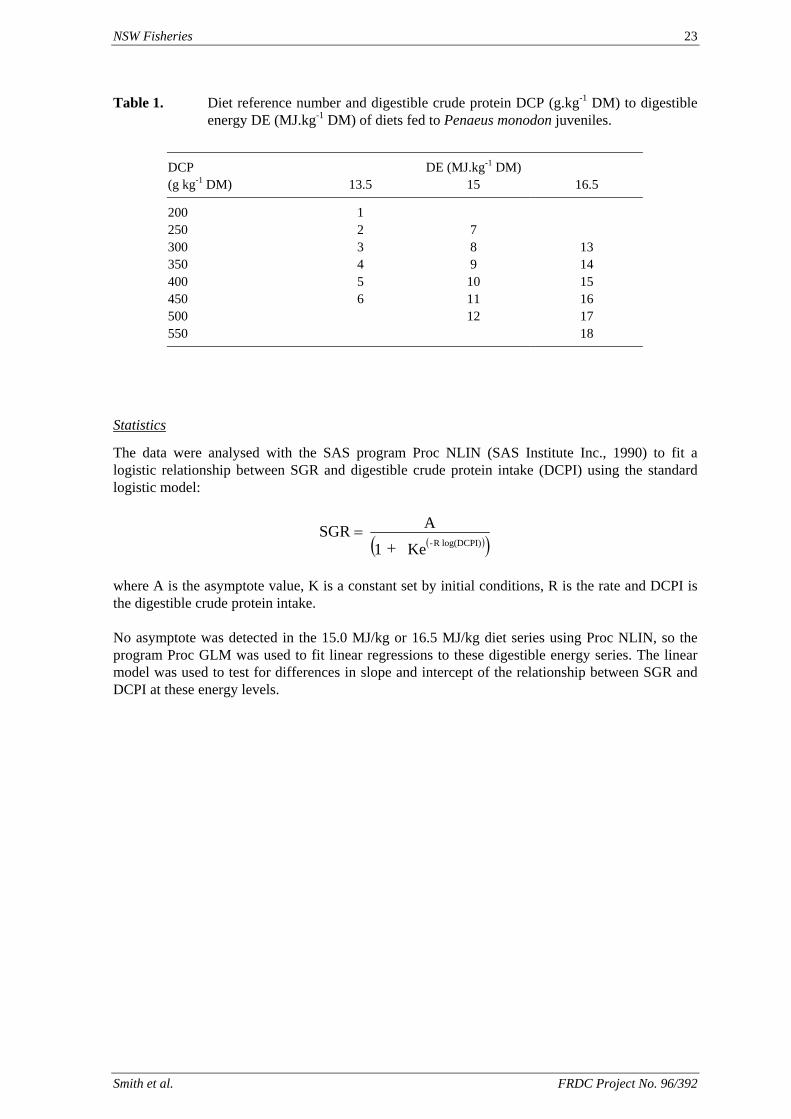
NSW Fisheries 23
Table 1. Diet reference number and digestible crude protein DCP (g.kg-1 DM) to digestible energy DE (MJ.kg-1 DM) of diets fed to Penaeus monodon juveniles.
DCP DE (MJ.kg-1 DM) (g kg-1 DM) 13.5 15 16.5
200 1 250 2 7 300 3 8 13 350 4 9 14 400 5 10 15 450 6 11 16 500 12 17 550 18
Statistics
The data were analysed with the SAS program Proc NLIN (SAS Institute Inc., 1990) to fit a logistic relationship between SGR and digestible crude protein intake (DCPI) using the standard logistic model:
( )( )Ke 1
A SGRlog(DCPI) R- +
=
where A is the asymptote value, K is a constant set by initial conditions, R is the rate and DCPI is the digestible crude protein intake. No asymptote was detected in the 15.0 MJ/kg or 16.5 MJ/kg diet series using Proc NLIN, so the program Proc GLM was used to fit linear regressions to these digestible energy series. The linear model was used to test for differences in slope and intercept of the relationship between SGR and DCPI at these energy levels.
Smith et al. FRDC Project No. 96/392
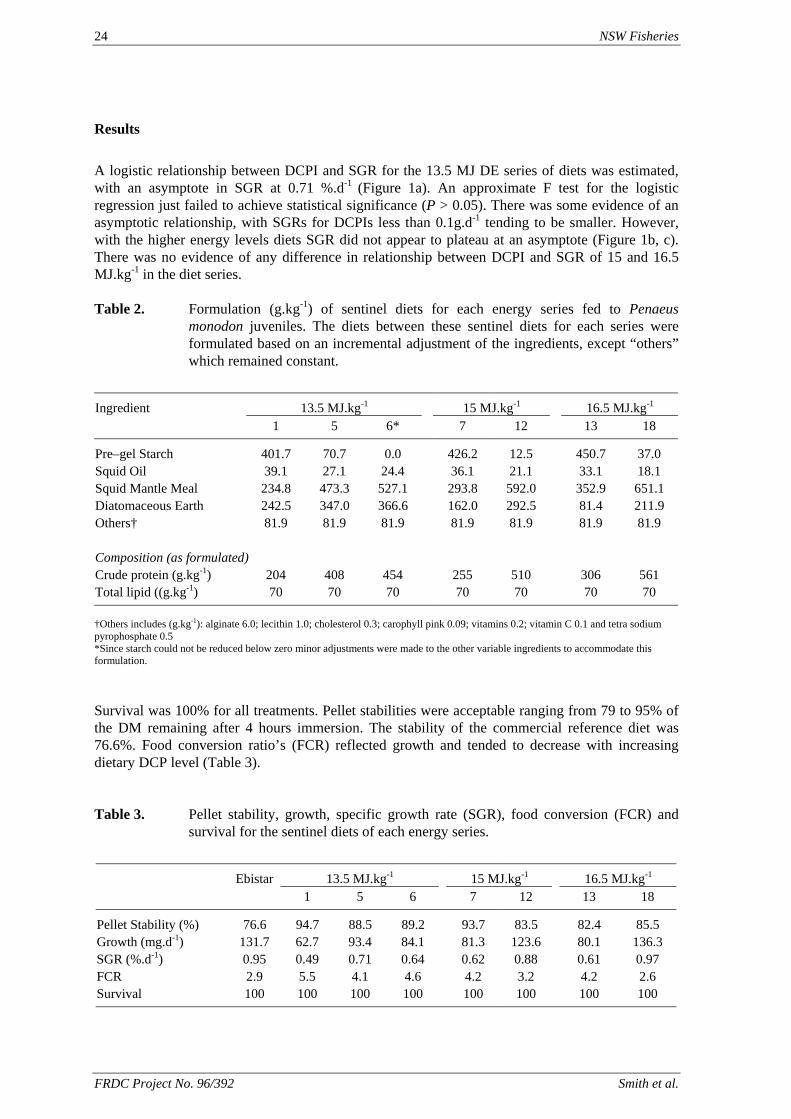
24 NSW Fisheries
Results
A logistic relationship between DCPI and SGR for the 13.5 MJ DE series of diets was estimated, with an asymptote in SGR at 0.71 %.d-1 (Figure 1a). An approximate F test for the logistic regression just failed to achieve statistical significance (P > 0.05). There was some evidence of an asymptotic relationship, with SGRs for DCPIs less than 0.1g.d-1 tending to be smaller. However, with the higher energy levels diets SGR did not appear to plateau at an asymptote (Figure 1b, c). There was no evidence of any difference in relationship between DCPI and SGR of 15 and 16.5 MJ.kg-1 in the diet series. Table 2. Formulation (g.kg-1) of sentinel diets for each energy series fed to Penaeus
monodon juveniles. The diets between these sentinel diets for each series were formulated based on an incremental adjustment of the ingredients, except “others” which remained constant.
Ingredient 13.5 MJ.kg-1 15 MJ.kg-1 16.5 MJ.kg-1 1 5 6* 7 12 13 18
Pre–gel Starch 401.7 70.7 0.0 426.2 12.5 450.7 37.0 Squid Oil 39.1 27.1 24.4 36.1 21.1 33.1 18.1 Squid Mantle Meal 234.8 473.3 527.1 293.8 592.0 352.9 651.1 Diatomaceous Earth 242.5 347.0 366.6 162.0 292.5 81.4 211.9 Others† 81.9 81.9 81.9 81.9 81.9 81.9 81.9 Composition (as formulated) Crude protein (g.kg-1) 204 408 454 255 510 306 561 Total lipid ((g.kg-1) 70 70 70 70 70 70 70 †Others includes (g.kg-1): alginate 6.0; lecithin 1.0; cholesterol 0.3; carophyll pink 0.09; vitamins 0.2; vitamin C 0.1 and tetra sodium pyrophosphate 0.5 *Since starch could not be reduced below zero minor adjustments were made to the other variable ingredients to accommodate this formulation. Survival was 100% for all treatments. Pellet stabilities were acceptable ranging from 79 to 95% of the DM remaining after 4 hours immersion. The stability of the commercial reference diet was 76.6%. Food conversion ratio’s (FCR) reflected growth and tended to decrease with increasing dietary DCP level (Table 3). Table 3. Pellet stability, growth, specific growth rate (SGR), food conversion (FCR) and
survival for the sentinel diets of each energy series. Ebistar 13.5 MJ.kg-1 15 MJ.kg-1 16.5 MJ.kg-1 1 5 6 7 12 13 18
Pellet Stability (%) 76.6 94.7 88.5 89.2 93.7 83.5 82.4 85.5 Growth (mg.d-1) 131.7 62.7 93.4 84.1 81.3 123.6 80.1 136.3 SGR (%.d-1) 0.95 0.49 0.71 0.64 0.62 0.88 0.61 0.97 FCR 2.9 5.5 4.1 4.6 4.2 3.2 4.2 2.6 Survival 100 100 100 100 100 100 100 100
FRDC Project No. 96/392 Smith et al.
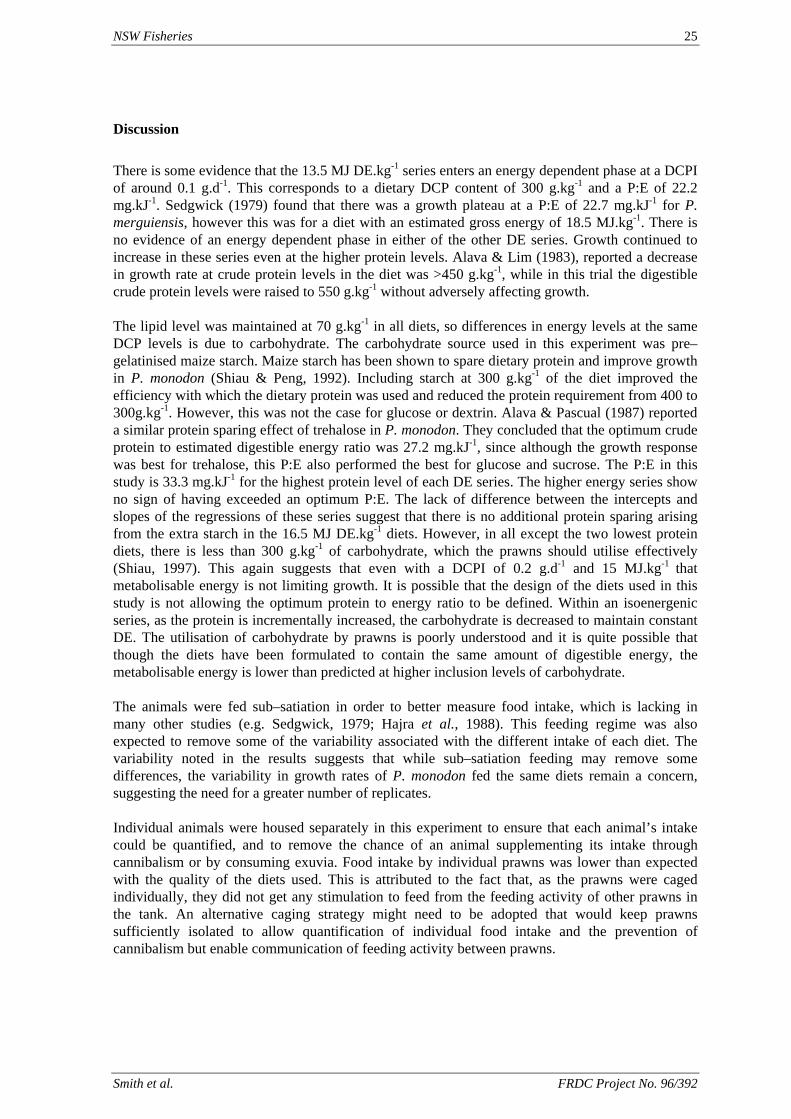
NSW Fisheries 25
Discussion
There is some evidence that the 13.5 MJ DE.kg-1 series enters an energy dependent phase at a DCPI of around 0.1 g.d-1. This corresponds to a dietary DCP content of 300 g.kg-1 and a P:E of 22.2 mg.kJ-1. Sedgwick (1979) found that there was a growth plateau at a P:E of 22.7 mg.kJ-1 for P. merguiensis, however this was for a diet with an estimated gross energy of 18.5 MJ.kg-1. There is no evidence of an energy dependent phase in either of the other DE series. Growth continued to increase in these series even at the higher protein levels. Alava & Lim (1983), reported a decrease in growth rate at crude protein levels in the diet was >450 g.kg-1, while in this trial the digestible crude protein levels were raised to 550 g.kg-1 without adversely affecting growth. The lipid level was maintained at 70 g.kg-1 in all diets, so differences in energy levels at the same DCP levels is due to carbohydrate. The carbohydrate source used in this experiment was pre–gelatinised maize starch. Maize starch has been shown to spare dietary protein and improve growth in P. monodon (Shiau & Peng, 1992). Including starch at 300 g.kg-1 of the diet improved the efficiency with which the dietary protein was used and reduced the protein requirement from 400 to 300g.kg-1. However, this was not the case for glucose or dextrin. Alava & Pascual (1987) reported a similar protein sparing effect of trehalose in P. monodon. They concluded that the optimum crude protein to estimated digestible energy ratio was 27.2 mg.kJ-1, since although the growth response was best for trehalose, this P:E also performed the best for glucose and sucrose. The P:E in this study is 33.3 mg.kJ-1 for the highest protein level of each DE series. The higher energy series show no sign of having exceeded an optimum P:E. The lack of difference between the intercepts and slopes of the regressions of these series suggest that there is no additional protein sparing arising from the extra starch in the 16.5 MJ DE.kg-1 diets. However, in all except the two lowest protein diets, there is less than 300 g.kg-1 of carbohydrate, which the prawns should utilise effectively (Shiau, 1997). This again suggests that even with a DCPI of 0.2 g.d-1 and 15 MJ.kg-1 that metabolisable energy is not limiting growth. It is possible that the design of the diets used in this study is not allowing the optimum protein to energy ratio to be defined. Within an isoenergenic series, as the protein is incrementally increased, the carbohydrate is decreased to maintain constant DE. The utilisation of carbohydrate by prawns is poorly understood and it is quite possible that though the diets have been formulated to contain the same amount of digestible energy, the metabolisable energy is lower than predicted at higher inclusion levels of carbohydrate. The animals were fed sub–satiation in order to better measure food intake, which is lacking in many other studies (e.g. Sedgwick, 1979; Hajra et al., 1988). This feeding regime was also expected to remove some of the variability associated with the different intake of each diet. The variability noted in the results suggests that while sub–satiation feeding may remove some differences, the variability in growth rates of P. monodon fed the same diets remain a concern, suggesting the need for a greater number of replicates. Individual animals were housed separately in this experiment to ensure that each animal’s intake could be quantified, and to remove the chance of an animal supplementing its intake through cannibalism or by consuming exuvia. Food intake by individual prawns was lower than expected with the quality of the diets used. This is attributed to the fact that, as the prawns were caged individually, they did not get any stimulation to feed from the feeding activity of other prawns in the tank. An alternative caging strategy might need to be adopted that would keep prawns sufficiently isolated to allow quantification of individual food intake and the prevention of cannibalism but enable communication of feeding activity between prawns.
Smith et al. FRDC Project No. 96/392
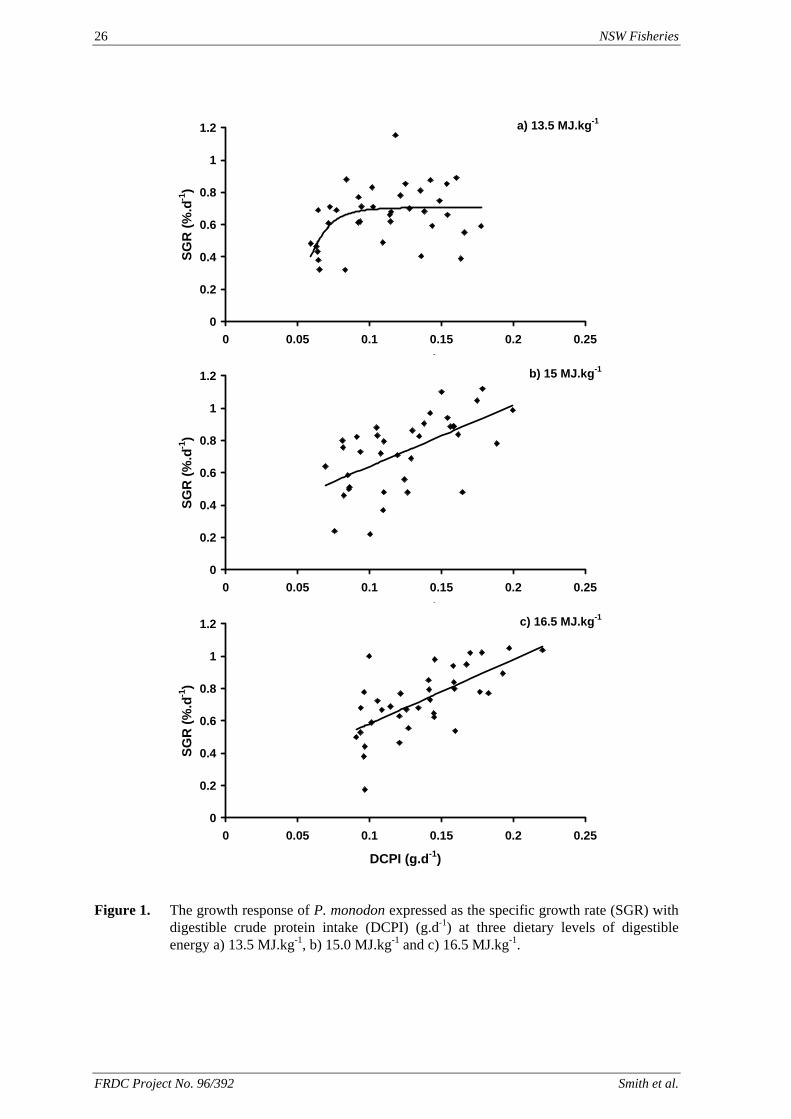
26 NSW Fisheries
a) 13.5 MJ.kg-1
0
0.2
0.4
0.6
0.8
1
1.2
0 0.05 0.1 0.15 0.2 0.251
SGR
(%.d
-1)
b) 15 MJ.kg-1
0
0.2
0.4
0.6
0.8
1
1.2
0 0.05 0.1 0.15 0.2 0.251
SGR
(%.d
-1)
c) 16.5 MJ.kg-1
0
0.2
0.4
0.6
0.8
1
1.2
0 0.05 0.1 0.15 0.2 0.25
DCPI (g.d-1)
SGR
(%.d
-1)
Figure 1. The growth response of P. monodon expressed as the specific growth rate (SGR) with digestible crude protein intake (DCPI) (g.d-1) at three dietary levels of digestible energy a) 13.5 MJ.kg-1, b) 15.0 MJ.kg-1 and c) 16.5 MJ.kg-1.
FRDC Project No. 96/392 Smith et al.
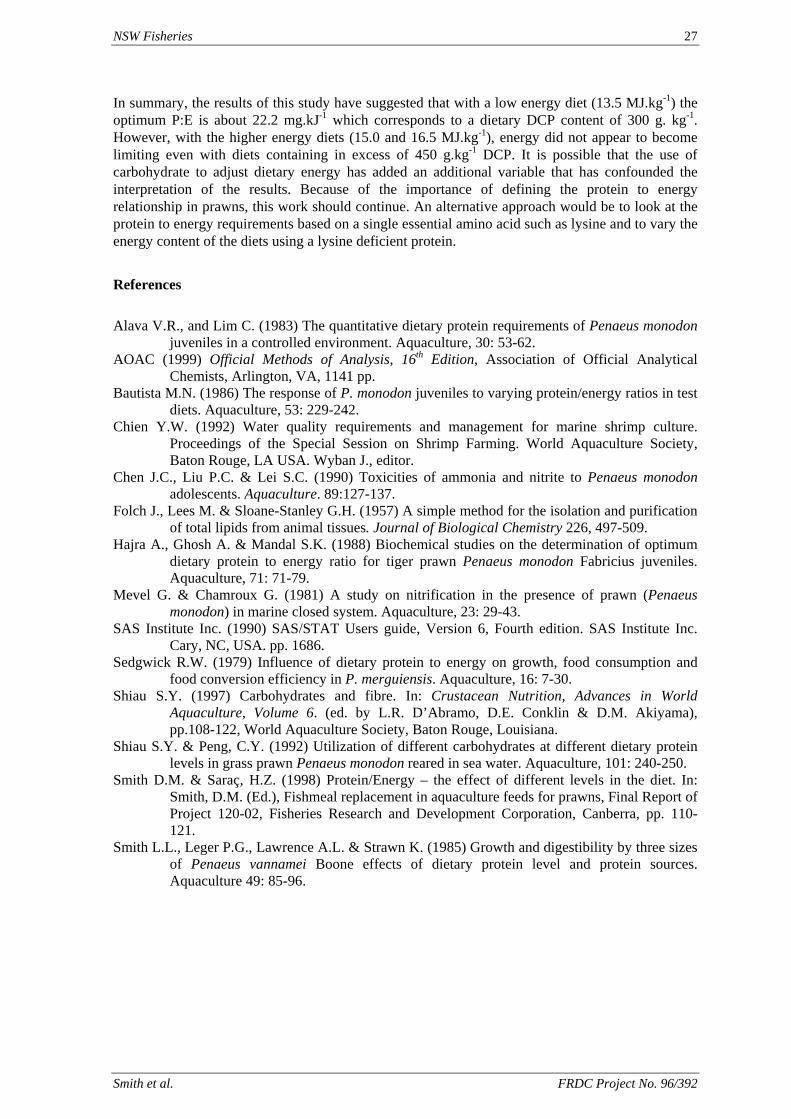
NSW Fisheries 27
In summary, the results of this study have suggested that with a low energy diet (13.5 MJ.kg-1) the optimum P:E is about 22.2 mg.kJ-1 which corresponds to a dietary DCP content of 300 g. kg-1. However, with the higher energy diets (15.0 and 16.5 MJ.kg-1), energy did not appear to become limiting even with diets containing in excess of 450 g.kg-1 DCP. It is possible that the use of carbohydrate to adjust dietary energy has added an additional variable that has confounded the interpretation of the results. Because of the importance of defining the protein to energy relationship in prawns, this work should continue. An alternative approach would be to look at the protein to energy requirements based on a single essential amino acid such as lysine and to vary the energy content of the diets using a lysine deficient protein.
References
Alava V.R., and Lim C. (1983) The quantitative dietary protein requirements of Penaeus monodon juveniles in a controlled environment. Aquaculture, 30: 53-62.
AOAC (1999) Official Methods of Analysis, 16th Edition, Association of Official Analytical Chemists, Arlington, VA, 1141 pp.
Bautista M.N. (1986) The response of P. monodon juveniles to varying protein/energy ratios in test diets. Aquaculture, 53: 229-242.
Chien Y.W. (1992) Water quality requirements and management for marine shrimp culture. Proceedings of the Special Session on Shrimp Farming. World Aquaculture Society, Baton Rouge, LA USA. Wyban J., editor.
Chen J.C., Liu P.C. & Lei S.C. (1990) Toxicities of ammonia and nitrite to Penaeus monodon adolescents. Aquaculture. 89:127-137.
Folch J., Lees M. & Sloane-Stanley G.H. (1957) A simple method for the isolation and purification of total lipids from animal tissues. Journal of Biological Chemistry 226, 497-509.
Hajra A., Ghosh A. & Mandal S.K. (1988) Biochemical studies on the determination of optimum dietary protein to energy ratio for tiger prawn Penaeus monodon Fabricius juveniles. Aquaculture, 71: 71-79.
Mevel G. & Chamroux G. (1981) A study on nitrification in the presence of prawn (Penaeus monodon) in marine closed system. Aquaculture, 23: 29-43.
SAS Institute Inc. (1990) SAS/STAT Users guide, Version 6, Fourth edition. SAS Institute Inc. Cary, NC, USA. pp. 1686.
Sedgwick R.W. (1979) Influence of dietary protein to energy on growth, food consumption and food conversion efficiency in P. merguiensis. Aquaculture, 16: 7-30.
Shiau S.Y. (1997) Carbohydrates and fibre. In: Crustacean Nutrition, Advances in World Aquaculture, Volume 6. (ed. by L.R. D’Abramo, D.E. Conklin & D.M. Akiyama), pp.108-122, World Aquaculture Society, Baton Rouge, Louisiana.
Shiau S.Y. & Peng, C.Y. (1992) Utilization of different carbohydrates at different dietary protein levels in grass prawn Penaeus monodon reared in sea water. Aquaculture, 101: 240-250.
Smith D.M. & Saraç, H.Z. (1998) Protein/Energy – the effect of different levels in the diet. In: Smith, D.M. (Ed.), Fishmeal replacement in aquaculture feeds for prawns, Final Report of Project 120-02, Fisheries Research and Development Corporation, Canberra, pp. 110-121.
Smith L.L., Leger P.G., Lawrence A.L. & Strawn K. (1985) Growth and digestibility by three sizes of Penaeus vannamei Boone effects of dietary protein level and protein sources. Aquaculture 49: 85-96.
Smith et al. FRDC Project No. 96/392
28 NSW Fisheries
4.4. Cholesterol requirement of sub-adult black tiger prawn Penaeus monodon (Fabricius)
David M. Smith, Simon J. Tabrett & Margaret C. Barclay
CSIRO Marine Laboratories, P.O. Box 120, Cleveland Qld 4163
Abstract
The high cost of cholesterol used in aquaculture diets for prawns makes it important to precisely define their requirement for this essential nutrient in order to avoid excess supplementation of the diet. Two experiments were carried out to determine the cholesterol requirement of sub-adult (about 3 g) Penaeus monodon (Fabricius). The growth response and survival of prawns were compared following feeding for up to 8 weeks with diets in which the cholesterol content varied between 0.7 and 8.5 g kg-1. Feed intake was quantified and the retention of ingested cholesterol determined by whole body analysis. The cholesterol requirement of sub-adult P. monodon was found to be about 75 mg kg-1 body weight d-1. The optimum dietary cholesterol content was approximately 1.7 g kg-1 (dry matter), which is appreciably lower than the current recommendation of 2.5 to 4 g kg-1 of diet. In most practical prawn diets, the endogenous cholesterol in the ingredients provides more than 1.7 g kg-1 of cholesterol. Hence, our research suggests that it may be unnecessary to add expensive, supplementary cholesterol to commercial prawn diets.
Introduction
Cholesterol and closely related sterols, essential nutrients in the diets of penaeid prawns, cannot be synthesised de novo (Teshima & Kanazawa, 1971). Cholesterol has a crucial role in the moulting process and is important in maintaining the integrity and chemical permeability of cell walls. A dietary cholesterol deficiency is most commonly manifested as reduced growth rate (reviewed by Teshima 1997). However, in many of the studies, a deficiency has not resulted in an increase in mortality, though Sheen, Liu, Chen & Chen (1994) observed a marked increase in mortality of juvenile Penaeus monodon (Fabricius) fed a diet containing 0.2 g kg-1 cholesterol. Although many studies with marine crustaceans have not shown an interaction between dietary cholesterol and dietary phospholipid (Teshima 1997), a strong interaction has been demonstrated with P. vannamei Boone [= Litopenaeus vannamei Perez Farfante & Kensley] (Gong, Lawrence, Jiang, Castille, & Gatlin 1999). Phospholipids play an important role in the digestion and transport of cholesterol (Teshima 1997) and an adequate source of dietary phospholipid must be provided, particularly in nutrient requirements studies. Published requirements of penaeids for cholesterol vary (Teshima 1997), and range between 2 and 20 g kg-1 of diet. More recent studies with P. monodon (Sheen et al. 1994), P. vannanei, (Duerr & Walsh 1996; Gong et al. 1999), and with Penaeus japonicus Bate [= Marsupenaeus japonicus Perez Farfante & Kensley] (Teshima, Ishikawa, Koshio & Kanazawa 1997) suggest that the requirement of these penaeids is at the lower end of this range. In all these studies, the level of dietary phospholipid appears to be adequate and not limiting the utilisation of the cholesterol. Cholesterol, either as a purified chemical or through a naturally rich source, is routinely added to formulations of commercial prawn diets to provide 2.5 to 4.0 g kg-1 of cholesterol (Akiyama, Dominy & Lawrence 1992). Cholesterol is one of the most expensive ingredients used in prawn
FRDC Project No. 96/392 Smith et al.

NSW Fisheries 29
feeds and the addition of 2 kg of cholesterol to 1 t of feed represents more than 10% of the total ingredient cost of the diet. A significant reduction in the amount of supplementary cholesterol could be achieved if the requirement of P. monodon was more precisely defined and endogenous cholesterol present in the other dietary ingredients was included. In this study two separate feeding experiments were conducted to define the cholesterol requirement of sub-adult P. monodon (3 to 10 g). The first involved a series of diets with a cholesterol content between 2.3 and 8.5 g kg-1 of diet. The results of this experiment indicated the need to examine the requirements at a finer scale. As a result, we carried out a second experiment to study the response to cholesterol at dietary levels of between 0.7 and 2.7 g kg-1. The requirement for cholesterol and the optimum dietary cholesterol content were defined from the growth response of the prawns and from the retention of ingested cholesterol.
Materials and Methods
Prawns used in the two experiments were obtained as postlarvae (PL15) from commercial hatcheries and reared in 10 t tanks at the CSIRO Marine Laboratory, Cleveland until they weighed approximately 2 g. At this stage they were sorted by size, transferred to 2.5 t tanks and held at 28 to 30ºC until required for the experiments. Experiment 1
A preliminary experiment was carried out to study the growth response of P. monodon to diets containing a relatively wide range of cholesterol concentrations. The experiment consisted of an 8-week growth assay of eight dietary treatments. All diets were variants of a basal diet (Diet E1-1, Table 1). They differed only in the amount of supplementary cholesterol, with a corresponding decrease in wheat flour. Cholesterol (Sigma, 98% purity) was added in 0.9 g kg-1 increments, from 0.0 to 6.3 g kg-1. Prior to the experiment, the prawns were weighed (range 2.5 to 4.5 g), sorted into five groups, each within 0.5 g, and stocked into blocks of eight tanks with prawns of a particular weight range in each block. A randomised balanced block design with five replicates for each treatment was used, with each treatment randomly allocated to one tank within each block. Experiment 2
The results of Experiment 1 indicated that there was a need to examine the requirement for cholesterol at a finer scale and at lower concentrations. The experiment consisted of a 6-week growth assay of six dietary treatments, in a randomised balanced design with seven replicates for each treatment. Prawns with an initial mean (± SD) weight of 3.30 ± 0.15 g were used. The diets, except for a reference diet, were all variants of a basal diet (Diet E2-1, Table 1). They differed only in the amount of supplementary cholesterol, with a corresponding decrease in diatomaceous earth. Cholesterol (Sigma, 98% purity) was added in 0.5 g kg-1 increments from 0 to 2 g kg-1. The reference diet was a commercial prawn diet made by Ridley Aquafeeds, Narangba, Australia.
Smith et al. FRDC Project No. 96/392
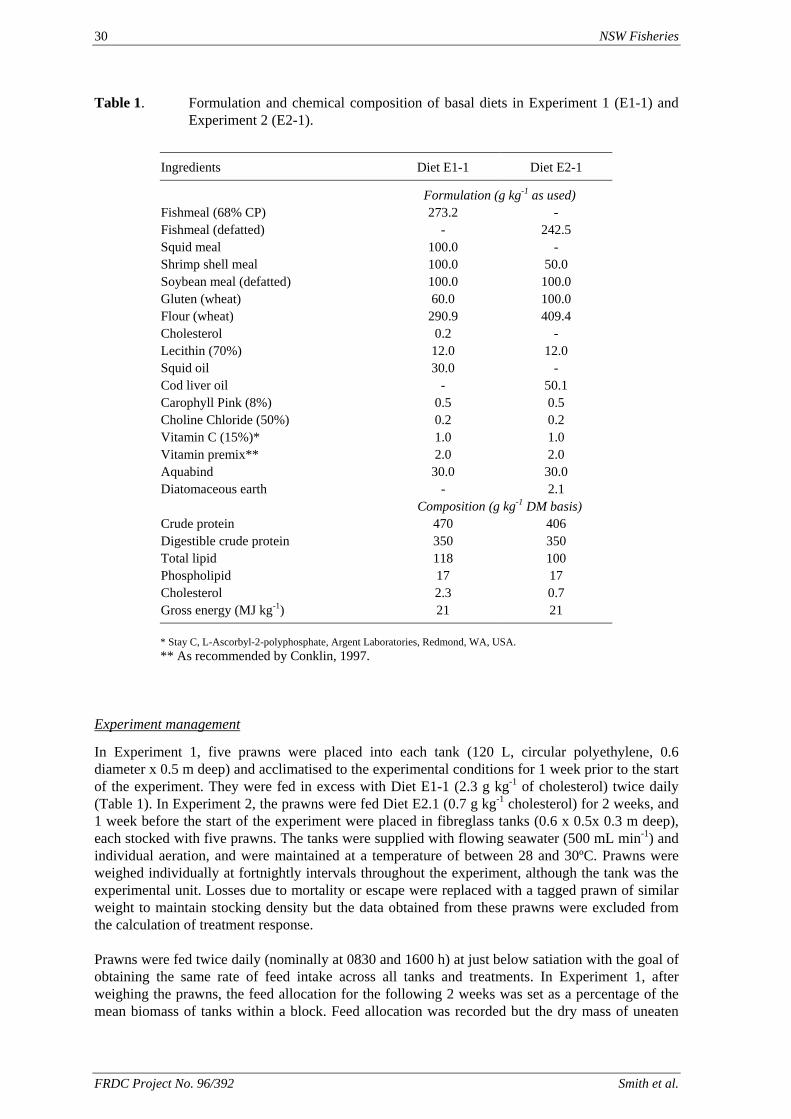
30 NSW Fisheries
Table 1. Formulation and chemical composition of basal diets in Experiment 1 (E1-1) and Experiment 2 (E2-1).
Ingredients Diet E1-1 Diet E2-1
Formulation (g kg-1 as used) Fishmeal (68% CP) 273.2 - Fishmeal (defatted) - 242.5 Squid meal 100.0 - Shrimp shell meal 100.0 50.0 Soybean meal (defatted) 100.0 100.0 Gluten (wheat) 60.0 100.0 Flour (wheat) 290.9 409.4 Cholesterol 0.2 - Lecithin (70%) 12.0 12.0 Squid oil 30.0 - Cod liver oil - 50.1 Carophyll Pink (8%) 0.5 0.5 Choline Chloride (50%) 0.2 0.2 Vitamin C (15%)* 1.0 1.0 Vitamin premix** 2.0 2.0 Aquabind 30.0 30.0 Diatomaceous earth - 2.1 Composition (g kg-1 DM basis) Crude protein 470 406 Digestible crude protein 350 350 Total lipid 118 100 Phospholipid 17 17 Cholesterol 2.3 0.7 Gross energy (MJ kg-1) 21 21 * Stay C, L-Ascorbyl-2-polyphosphate, Argent Laboratories, Redmond, WA, USA. ** As recommended by Conklin, 1997.
Experiment management
In Experiment 1, five prawns were placed into each tank (120 L, circular polyethylene, 0.6 diameter x 0.5 m deep) and acclimatised to the experimental conditions for 1 week prior to the start of the experiment. They were fed in excess with Diet E1-1 (2.3 g kg-1 of cholesterol) twice daily (Table 1). In Experiment 2, the prawns were fed Diet E2.1 (0.7 g kg-1 cholesterol) for 2 weeks, and 1 week before the start of the experiment were placed in fibreglass tanks (0.6 x 0.5x 0.3 m deep), each stocked with five prawns. The tanks were supplied with flowing seawater (500 mL min-1) and individual aeration, and were maintained at a temperature of between 28 and 30ºC. Prawns were weighed individually at fortnightly intervals throughout the experiment, although the tank was the experimental unit. Losses due to mortality or escape were replaced with a tagged prawn of similar weight to maintain stocking density but the data obtained from these prawns were excluded from the calculation of treatment response. Prawns were fed twice daily (nominally at 0830 and 1600 h) at just below satiation with the goal of obtaining the same rate of feed intake across all tanks and treatments. In Experiment 1, after weighing the prawns, the feed allocation for the following 2 weeks was set as a percentage of the mean biomass of tanks within a block. Feed allocation was recorded but the dry mass of uneaten
FRDC Project No. 96/392 Smith et al.
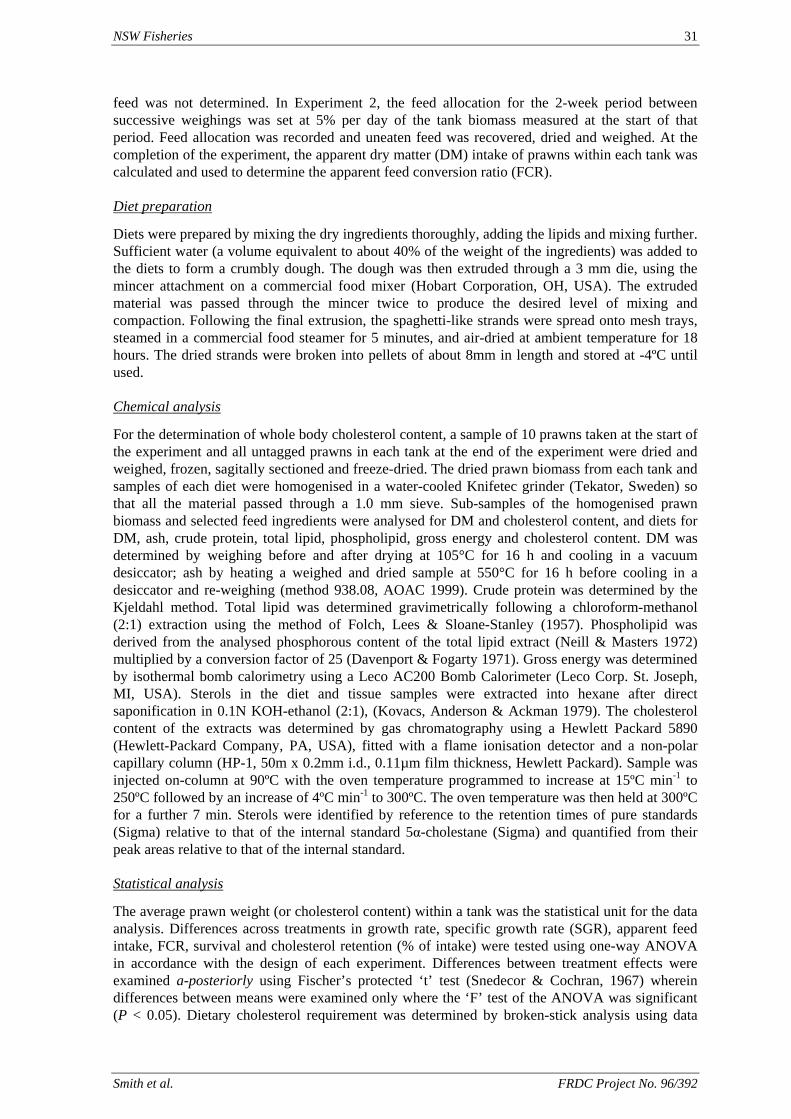
NSW Fisheries 31
feed was not determined. In Experiment 2, the feed allocation for the 2-week period between successive weighings was set at 5% per day of the tank biomass measured at the start of that period. Feed allocation was recorded and uneaten feed was recovered, dried and weighed. At the completion of the experiment, the apparent dry matter (DM) intake of prawns within each tank was calculated and used to determine the apparent feed conversion ratio (FCR). Diet preparation
Diets were prepared by mixing the dry ingredients thoroughly, adding the lipids and mixing further. Sufficient water (a volume equivalent to about 40% of the weight of the ingredients) was added to the diets to form a crumbly dough. The dough was then extruded through a 3 mm die, using the mincer attachment on a commercial food mixer (Hobart Corporation, OH, USA). The extruded material was passed through the mincer twice to produce the desired level of mixing and compaction. Following the final extrusion, the spaghetti-like strands were spread onto mesh trays, steamed in a commercial food steamer for 5 minutes, and air-dried at ambient temperature for 18 hours. The dried strands were broken into pellets of about 8mm in length and stored at -4ºC until used. Chemical analysis
For the determination of whole body cholesterol content, a sample of 10 prawns taken at the start of the experiment and all untagged prawns in each tank at the end of the experiment were dried and weighed, frozen, sagitally sectioned and freeze-dried. The dried prawn biomass from each tank and samples of each diet were homogenised in a water-cooled Knifetec grinder (Tekator, Sweden) so that all the material passed through a 1.0 mm sieve. Sub-samples of the homogenised prawn biomass and selected feed ingredients were analysed for DM and cholesterol content, and diets for DM, ash, crude protein, total lipid, phospholipid, gross energy and cholesterol content. DM was determined by weighing before and after drying at 105°C for 16 h and cooling in a vacuum desiccator; ash by heating a weighed and dried sample at 550°C for 16 h before cooling in a desiccator and re-weighing (method 938.08, AOAC 1999). Crude protein was determined by the Kjeldahl method. Total lipid was determined gravimetrically following a chloroform-methanol (2:1) extraction using the method of Folch, Lees & Sloane-Stanley (1957). Phospholipid was derived from the analysed phosphorous content of the total lipid extract (Neill & Masters 1972) multiplied by a conversion factor of 25 (Davenport & Fogarty 1971). Gross energy was determined by isothermal bomb calorimetry using a Leco AC200 Bomb Calorimeter (Leco Corp. St. Joseph, MI, USA). Sterols in the diet and tissue samples were extracted into hexane after direct saponification in 0.1N KOH-ethanol (2:1), (Kovacs, Anderson & Ackman 1979). The cholesterol content of the extracts was determined by gas chromatography using a Hewlett Packard 5890 (Hewlett-Packard Company, PA, USA), fitted with a flame ionisation detector and a non-polar capillary column (HP-1, 50m x 0.2mm i.d., 0.11µm film thickness, Hewlett Packard). Sample was injected on-column at 90ºC with the oven temperature programmed to increase at 15ºC min-1 to 250ºC followed by an increase of 4ºC min-1 to 300ºC. The oven temperature was then held at 300ºC for a further 7 min. Sterols were identified by reference to the retention times of pure standards (Sigma) relative to that of the internal standard 5α-cholestane (Sigma) and quantified from their peak areas relative to that of the internal standard. Statistical analysis
The average prawn weight (or cholesterol content) within a tank was the statistical unit for the data analysis. Differences across treatments in growth rate, specific growth rate (SGR), apparent feed intake, FCR, survival and cholesterol retention (% of intake) were tested using one-way ANOVA in accordance with the design of each experiment. Differences between treatment effects were examined a-posteriorly using Fischer’s protected ‘t’ test (Snedecor & Cochran, 1967) wherein differences between means were examined only where the ‘F’ test of the ANOVA was significant (P < 0.05). Dietary cholesterol requirement was determined by broken-stick analysis using data
Smith et al. FRDC Project No. 96/392
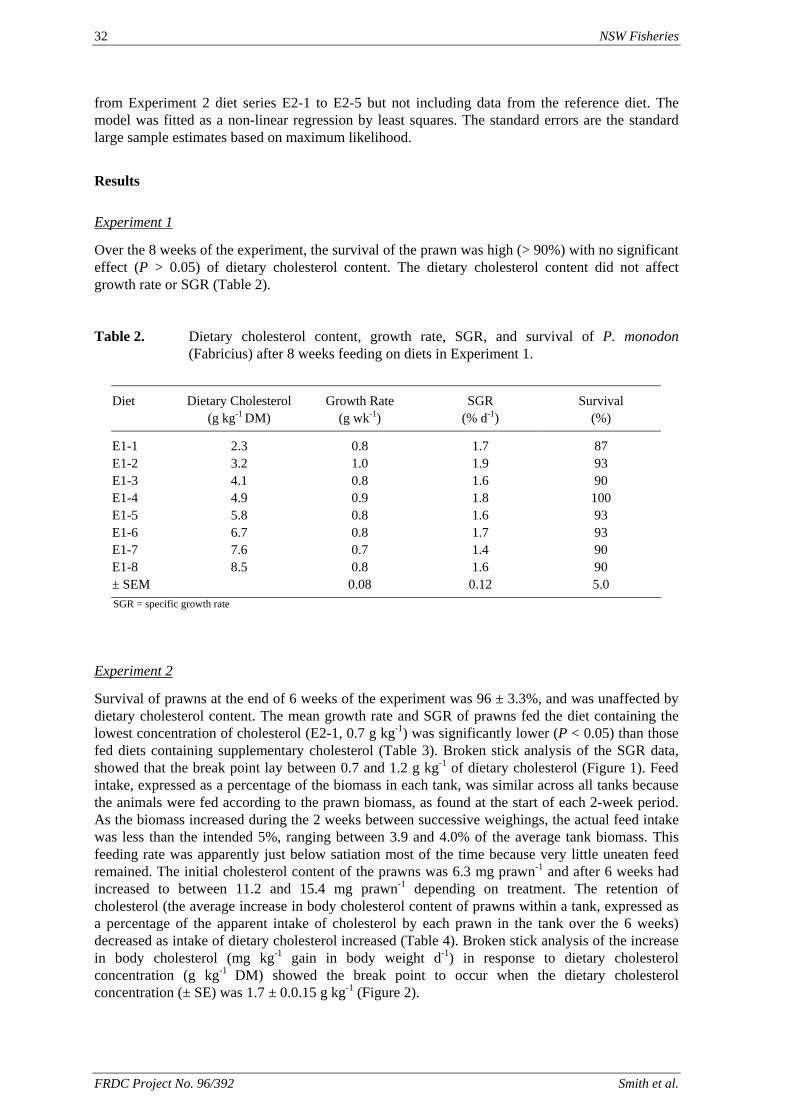
32 NSW Fisheries
from Experiment 2 diet series E2-1 to E2-5 but not including data from the reference diet. The model was fitted as a non-linear regression by least squares. The standard errors are the standard large sample estimates based on maximum likelihood.
Results
Experiment 1
Over the 8 weeks of the experiment, the survival of the prawn was high (> 90%) with no significant effect (P > 0.05) of dietary cholesterol content. The dietary cholesterol content did not affect growth rate or SGR (Table 2). Table 2. Dietary cholesterol content, growth rate, SGR, and survival of P. monodon
(Fabricius) after 8 weeks feeding on diets in Experiment 1.
Diet Dietary Cholesterol (g kg-1 DM)
Growth Rate (g wk-1)
SGR (% d-1)
Survival (%)
E1-1 2.3 0.8 1.7 87 E1-2 3.2 1.0 1.9 93 E1-3 4.1 0.8 1.6 90 E1-4 4.9 0.9 1.8 100 E1-5 5.8 0.8 1.6 93 E1-6 6.7 0.8 1.7 93 E1-7 7.6 0.7 1.4 90 E1-8 8.5 0.8 1.6 90 ± SEM 0.08 0.12 5.0 SGR = specific growth rate
Experiment 2
Survival of prawns at the end of 6 weeks of the experiment was 96 ± 3.3%, and was unaffected by dietary cholesterol content. The mean growth rate and SGR of prawns fed the diet containing the lowest concentration of cholesterol (E2-1, 0.7 g kg-1) was significantly lower (P < 0.05) than those fed diets containing supplementary cholesterol (Table 3). Broken stick analysis of the SGR data, showed that the break point lay between 0.7 and 1.2 g kg-1 of dietary cholesterol (Figure 1). Feed intake, expressed as a percentage of the biomass in each tank, was similar across all tanks because the animals were fed according to the prawn biomass, as found at the start of each 2-week period. As the biomass increased during the 2 weeks between successive weighings, the actual feed intake was less than the intended 5%, ranging between 3.9 and 4.0% of the average tank biomass. This feeding rate was apparently just below satiation most of the time because very little uneaten feed remained. The initial cholesterol content of the prawns was 6.3 mg prawn-1 and after 6 weeks had increased to between 11.2 and 15.4 mg prawn-1 depending on treatment. The retention of cholesterol (the average increase in body cholesterol content of prawns within a tank, expressed as a percentage of the apparent intake of cholesterol by each prawn in the tank over the 6 weeks) decreased as intake of dietary cholesterol increased (Table 4). Broken stick analysis of the increase in body cholesterol (mg kg-1 gain in body weight d-1) in response to dietary cholesterol concentration (g kg-1 DM) showed the break point to occur when the dietary cholesterol concentration (± SE) was 1.7 ± 0.0.15 g kg-1 (Figure 2).
FRDC Project No. 96/392 Smith et al.
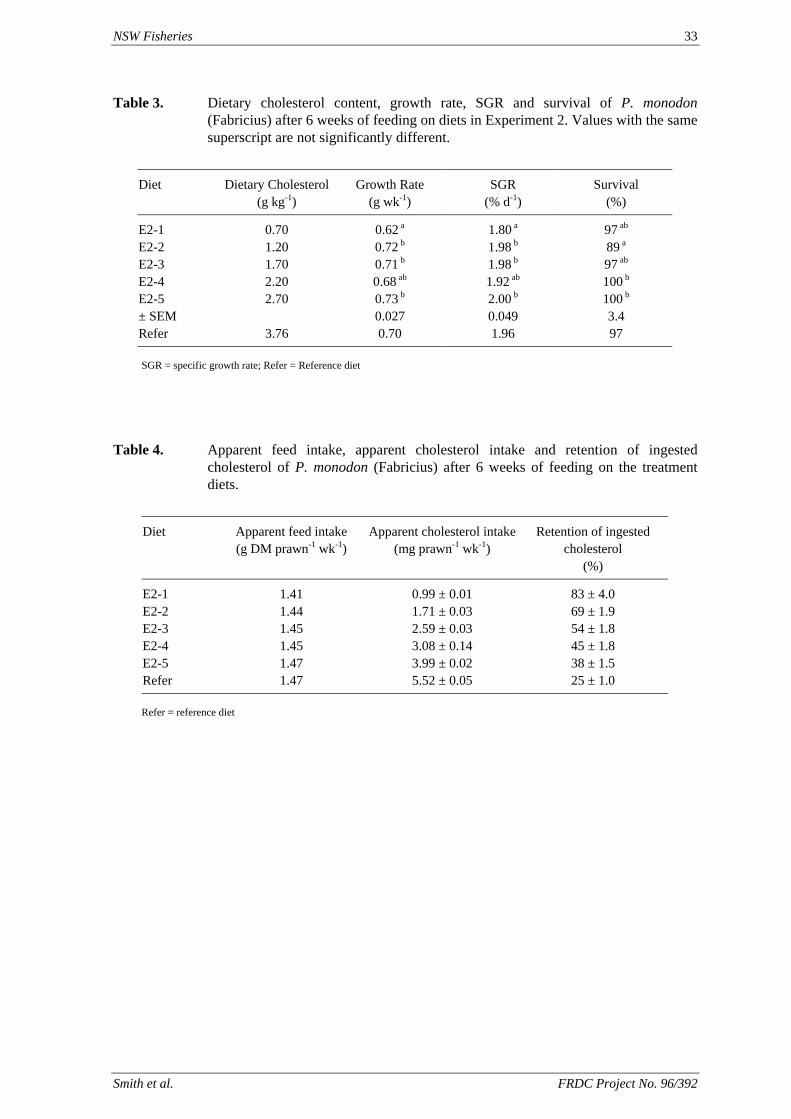
NSW Fisheries 33
Table 3. Dietary cholesterol content, growth rate, SGR and survival of P. monodon (Fabricius) after 6 weeks of feeding on diets in Experiment 2. Values with the same superscript are not significantly different.
Diet Dietary Cholesterol
(g kg-1) Growth Rate
(g wk-1) SGR
(% d-1) Survival
(%)
E2-1 0.70 0.62 a 1.80 a 97 ab E2-2 1.20 0.72 b 1.98 b 89 a E2-3 1.70 0.71 b 1.98 b 97 ab E2-4 2.20 0.68 ab 1.92 ab 100 b E2-5 2.70 0.73 b 2.00 b 100 b ± SEM 0.027 0.049 3.4 Refer 3.76 0.70 1.96 97 SGR = specific growth rate; Refer = Reference diet
Table 4. Apparent feed intake, apparent cholesterol intake and retention of ingested
cholesterol of P. monodon (Fabricius) after 6 weeks of feeding on the treatment diets.
Diet Apparent feed intake
(g DM prawn-1 wk-1) Apparent cholesterol intake
(mg prawn-1 wk-1) Retention of ingested
cholesterol (%)
E2-1 1.41 0.99 ± 0.01 83 ± 4.0 E2-2 1.44 1.71 ± 0.03 69 ± 1.9 E2-3 1.45 2.59 ± 0.03 54 ± 1.8 E2-4 1.45 3.08 ± 0.14 45 ± 1.8 E2-5 1.47 3.99 ± 0.02 38 ± 1.5 Refer 1.47 5.52 ± 0.05 25 ± 1.0 Refer = reference diet
Smith et al. FRDC Project No. 96/392
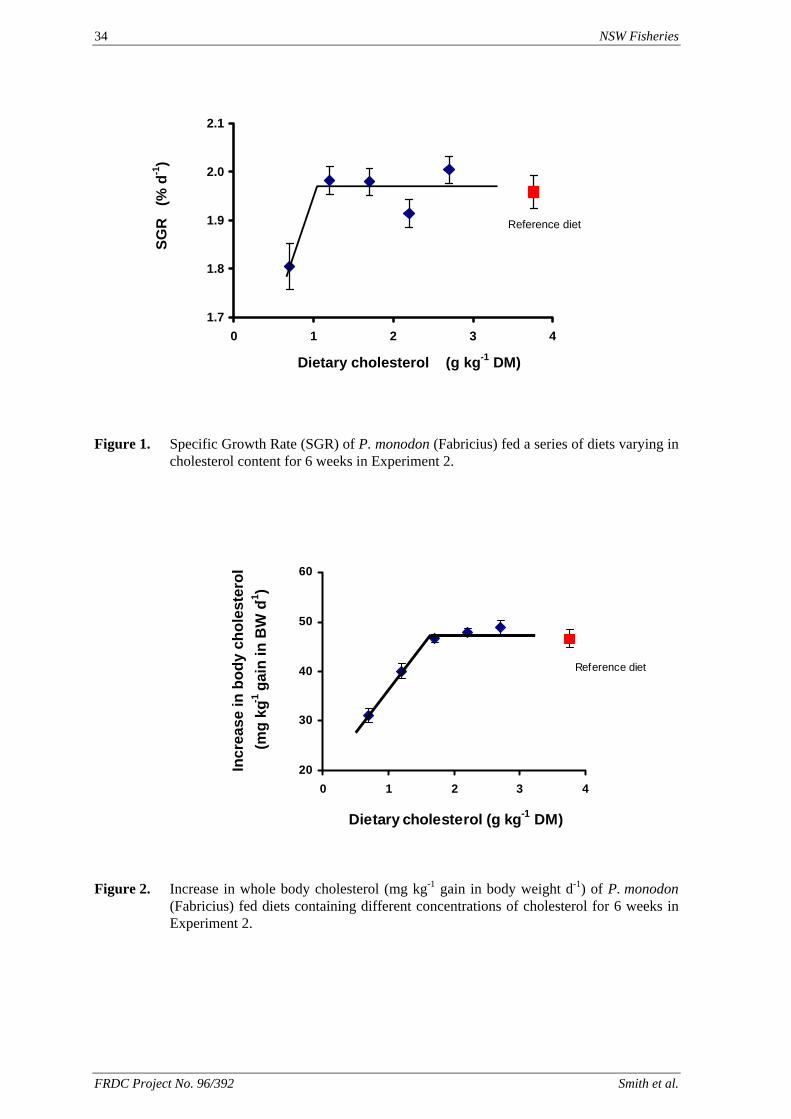
34 NSW Fisheries
1.7
1.8
1.9
2.0
2.1
0 1 2 3 4
Dietary cholesterol (g kg-1 DM)
SGR
(%
d-1
)
Reference diet
Figure 1. Specific Growth Rate (SGR) of P. monodon (Fabricius) fed a series of diets varying in cholesterol content for 6 weeks in Experiment 2.
20
30
40
50
60
0 1 2 3 4
Dietary cholesterol (g kg-1 DM)
Incr
ease
in b
ody
chol
este
rol
(mg
kg-1
gain
in B
W d
-1)
Reference diet
Figure 2. Increase in whole body cholesterol (mg kg-1 gain in body weight d-1) of P. monodon (Fabricius) fed diets containing different concentrations of cholesterol for 6 weeks in Experiment 2.
FRDC Project No. 96/392 Smith et al.
NSW Fisheries 35
The cholesterol content of a number of commercially available feed ingredients held at this laboratory ranged between 1.7 and 13.0 g kg-1 (Table 5). The cholesterol content of different batches of the same ingredient was variable, with that of fishmeal varying between 3.7 and 4.9 g kg-1. Table 5. Cholesterol content of selected feed ingredients.
Ingredient Source Cholesterol (g kg-1 DM)
Fishmeal (68% CP) Peru 4.2 Shrimp shell meal USA 6.3 Langostine meal Chile 3.8 Krill meal Chile 4.6 Squid meal Japan 7.9 Meat meal (52% CP) Australia 1.7 Squid oil Taiwan 13.0 Cod liver oil USA 3.1
Discussion
The growth response of prawns in both studies, indicated that the cholesterol requirement of P. monodon could be met with a dietary cholesterol content of less than 2.3 g kg-1. The growth responses measured in Experiment 2 suggest that the requirement would be met with between 0.7 and 1.2 g kg-1 of diet. However, the increase in whole body cholesterol content (Experiment 2) suggests that the requirement was met when the dietary cholesterol content was close to 1.7 g kg-1. As the dietary cholesterol content increased, retention efficiency consistently decreased, with the whole body cholesterol content reaching a maximum when the dietary cholesterol content was 1.7 g kg-1. This maximum level appears to reflect the optimum whole body cholesterol content for structural and metabolic purposes, and so indicates the requirement. Our study supports the conclusion of Teshima et al. (1997) that the whole body cholesterol content was a better indicator of requirement than growth response. Our growth response results are consistent with the findings of Chen (1993) and Sheen et al. (1994) for smaller (0.25 to 0.5 g), juvenile P. monodon. Chen (1993) found that a dietary cholesterol content of 5 g kg-1 was optimal when prawns were fed diets containing 0, 5 and 10 g kg-1 of cholesterol. Sheen et al. (1994), attempting to determine a more accurate requirement, found that the growth response of prawns fed diets containing 2 g kg-1 cholesterol was not significantly different from those fed 4, 6 or 8 g kg-1. These results and ours suggest that there may be little difference in the cholesterol requirements of juvenile and sub-adult P. monodon. The use of a sub-satiation feeding strategy is a useful approach to quantify apparent feed intake in slow feeding animals such as crustaceans. With this approach in Experiment 2, the feed intake of each tank of prawns was managed so that the apparent feed intake was similar across all treatments and tanks, both on a percentage of biomass basis and in absolute terms (Table 4). As the diets that contained supplementary cholesterol (Diet E2-2 to E2-5) resulted in the same growth rate as that obtained with the reference diet, it would appear that the basal diet (Diet E2-1) was nutritionally adequate except for its cholesterol content. As such, growth was being limited equally across all treatments by the restricted feed intake, with a further constraint being imposed by the deficiency of dietary cholesterol. Provided that the feed intake is not excessively limited to the extent that the
Smith et al. FRDC Project No. 96/392
36 NSW Fisheries
scope for growth is not severely constrained, a restricted feeding regimen is an effective method for defining nutrient requirements (Glencross, Smith, Tonks, Tabrett & Williams 1999). A restricted feeding protocol ensures that a dietary deficiency is not compensated for by an increase in voluntary feed consumption. Nutrient requirements of crustaceans are most frequently reported as concentration in the diet. However, when the nutrition of a species is well understood and feed intake can be accurately quantified, the requirement is increasingly being reported on the basis of absolute intake per unit body weight (BW) per day. Teshima et al. (1997) quantified the feed intake of juvenile P. japonicus and reported the requirement for cholesterol both as a concentration of the diet (2.6 to 6.0 g kg-1, depending on feeding rate) and on an absolute intake basis (180 to 200 mg kg-1 BW d –1). Using the same calculation process, we determined the requirement of sub-adult P. monodon to be 75 mg kg-1 BW d-1. Sub-adult prawns (>3 g BW) during the grow-out phase of commercial prawn farming operations consume the largest amounts of feed in the production process. As such cost of the grow-out diet has a much greater effect on the profitability farming operation than the diets for the smaller prawns. Accurate specification of the requirement for nutrients, particularly the expensive nutrients such as cholesterol, will minimise over-specification and hence reduce the cost of the diet and hence the cost of prawn production. In summary, the cholesterol requirements of sub-adult P. monodon was determined to be about 75 mg kg-1 BW d-1. The optimum dietary cholesterol content was about 1.7 g kg-1 (on a DM basis) which is appreciably less than the 2.5 to 4 g kg-1 recommended for inclusion in prawn feeds (Akiyama et al., 1992). In most practical prawn diet formulations that contain a significant proportion of ingredients of animal origin (such as fishmeal, prawn meal, meat meal or squid oil), the endogenous cholesterol in the ingredients provides more than the required amount (1.7 g kg-1) of cholesterol. Hence, it is likely that in many commercial diet formulations there is no need for the inclusion of supplementary cholesterol and, by its exclusion, significant savings in the ingredient cost of the diets may be made.
Acknowledgments
We wish to thank Simon Irvin for his technical support and Kevin Williams for his advice and critical reading of the manuscript. This work was carried out with financial support from the Aquaculture Diet Development Sub-program of the Fisheries Research and Development Corporation (Australia) and from CSIRO.
References
Akiyama D.M., Dominy W.G. & Lawrence A.L. (1992) Penaeid shrimp nutrition for the commercial feed industry: Revised. In: Proceedings of the Aquaculture Feed Processing and Nutrition Workshop, 19-25 September 1991, Thailand and Indonesia, (ed. by D.M. Akiyama & R.K.H. Tan). pp 80-98. American Soybean Association, Singapore.
AOAC (1999) Official Methods of Analysis, 16th Edition, Association of Official Analytical Chemists, Arlington, VA, 1141 pp.
Chen H.Y. (1993) Requirements of marine shrimp, Penaeus monodon, juveniles for phosphatidylcholine and cholesterol. Aquaculture 109, 165-176.
Conklin D.E. (1997) Vitamins. In: Crustacean Nutrition, Advances in World Aquaculture, Volume 6. (ed. by L.R. D’Abramo, D.E. Conklin & D.M. Akiyama), pp. 126, World Aquaculture Society, Baton Rouge, Louisiana.
FRDC Project No. 96/392 Smith et al.
NSW Fisheries 37
Davenport J.B. & Fogarty A.C. (1971) Chemical determination of the structure of lipids. In: Biochemistry and Methodology of Lipids (ed. by A.R. Johnson & J.B. Fogarty), pp. 265-294, John Wiley & Sons Inc, New York.
Duerr E.O. & Walsh W.A. (1996) Evaluation of cholesterol additions to a soybean meal-based diet for juvenile, Penaeus vannamei, in an outdoor growth trial. Aquaculture Nutrition 2, 111-116.
Folch J., Lees M. & Sloane-Stanley G.H. (1957) A simple method for the isolation and purification of total lipids from animal tissues. Journal of Biological Chemistry 226, 497-509.
Glencross B.D., Smith D.M., Tonks M.L., Tabrett S.J. & Williams K.C. (1999) A reference diet for nutritional studies of the giant tiger shrimp Penaeus monodon. Aquaculture Nutrition 5, 33-39.
Gong H., Lawrence A.L., Jiang D., Castille F.L. & Gatlin III D.M. (1999) Effects of dietary cholesterol and phospholipid on survival and growth of Penaeus vannamei juveniles. In: Book of Abstracts, World Aquaculture ’99, The Annual International Conference and Exposition of the World Aquaculture Society. 26 April – 2 May 1999, Sydney Australia, pp 294. World Aquaculture Society, Baton Rouge.
Kovacs M.I.P., Anderson W.E. & Ackman R.G. (1979) A simple method for the determination of cholesterol and some plant sterols in fishery-based food products. Journal of Food Science 44, 1299-1305.
Neill A.R. & Masters C.J. (1972) Metabolism of fatty acids by spermatozoa. Biochemical Journal 127, 375-385.
Sheen S.S., Liu P.C., Chen S.N. & Chen J.C. (1994) Cholesterol requirement of juvenile tiger shrimp (Penaeus monodon). Aquaculture 125, 131-137.
Snedecor G.W. & Cochran W.G. (1967) Statistical Methods, 6th Edition. Iowa University Press, Iowa, USA.
Teshima S. (1997) Phospholipids and Sterols. In: Crustacean Nutrition, Advances in World Aquaculture, Volume 6. (ed. by L.R. D’Abramo, D.E. Conklin & D.M. Akiyama), pp. 71-84, World Aquaculture Society, Baton Rouge, Louisiana.
Teshima S.I. & Kanazawa A. (1971) Biosynthesis of sterols in the lobster Panilurus japonica, the shrimp, Penaeus japonicus, and the crab, Portunus trituberculatus. Comp. Biochem. Physiol. 38B, 597-602.
Teshima S., Ishikawa M., Koshio S. & Kanazawa A. (1997) Assessment of cholesterol requirements in the shrimp, Penaeus japonicus. Aquaculture Nutrition 3, 247-253.
Smith et al. FRDC Project No. 96/392
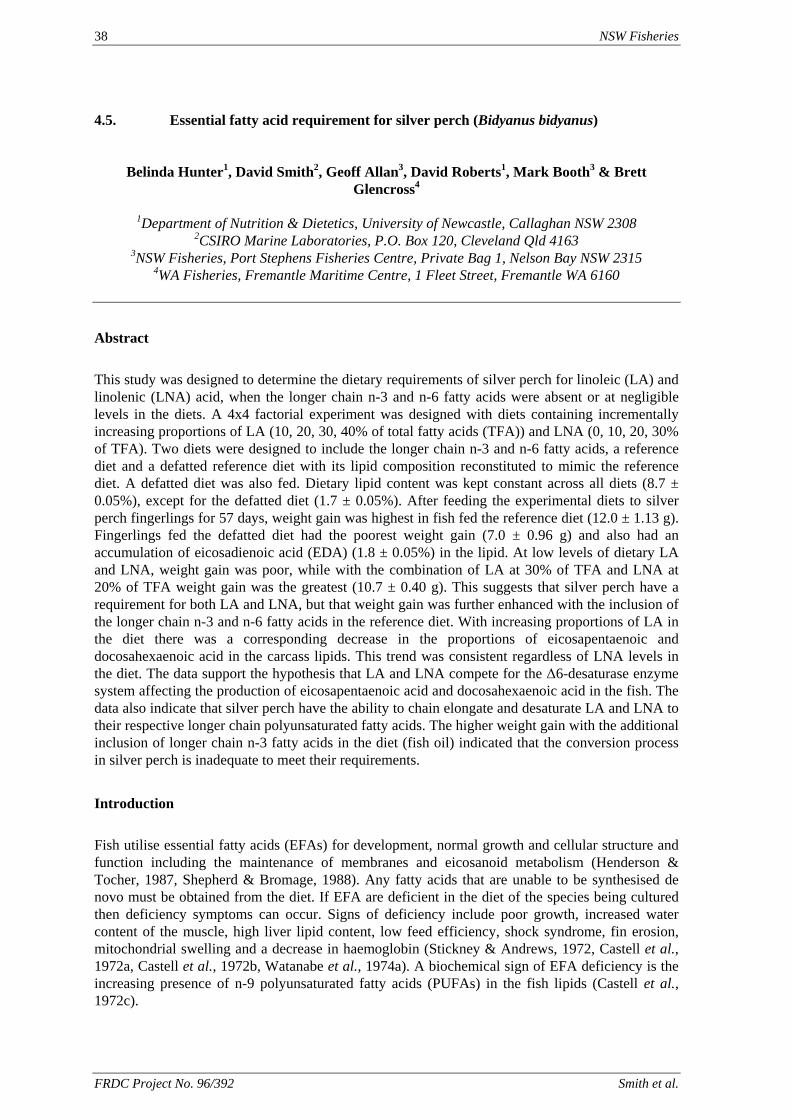
38 NSW Fisheries
4.5. Essential fatty acid requirement for silver perch (Bidyanus bidyanus)
Belinda Hunter1, David Smith2, Geoff Allan3, David Roberts1, Mark Booth3 & Brett
Glencross4
1Department of Nutrition & Dietetics, University of Newcastle, Callaghan NSW 2308 2CSIRO Marine Laboratories, P.O. Box 120, Cleveland Qld 4163
3NSW Fisheries, Port Stephens Fisheries Centre, Private Bag 1, Nelson Bay NSW 2315 4WA Fisheries, Fremantle Maritime Centre, 1 Fleet Street, Fremantle WA 6160
Abstract
This study was designed to determine the dietary requirements of silver perch for linoleic (LA) and linolenic (LNA) acid, when the longer chain n-3 and n-6 fatty acids were absent or at negligible levels in the diets. A 4x4 factorial experiment was designed with diets containing incrementally increasing proportions of LA (10, 20, 30, 40% of total fatty acids (TFA)) and LNA (0, 10, 20, 30% of TFA). Two diets were designed to include the longer chain n-3 and n-6 fatty acids, a reference diet and a defatted reference diet with its lipid composition reconstituted to mimic the reference diet. A defatted diet was also fed. Dietary lipid content was kept constant across all diets (8.7 ± 0.05%), except for the defatted diet (1.7 ± 0.05%). After feeding the experimental diets to silver perch fingerlings for 57 days, weight gain was highest in fish fed the reference diet (12.0 ± 1.13 g). Fingerlings fed the defatted diet had the poorest weight gain (7.0 ± 0.96 g) and also had an accumulation of eicosadienoic acid (EDA) (1.8 ± 0.05%) in the lipid. At low levels of dietary LA and LNA, weight gain was poor, while with the combination of LA at 30% of TFA and LNA at 20% of TFA weight gain was the greatest (10.7 ± 0.40 g). This suggests that silver perch have a requirement for both LA and LNA, but that weight gain was further enhanced with the inclusion of the longer chain n-3 and n-6 fatty acids in the reference diet. With increasing proportions of LA in the diet there was a corresponding decrease in the proportions of eicosapentaenoic and docosahexaenoic acid in the carcass lipids. This trend was consistent regardless of LNA levels in the diet. The data support the hypothesis that LA and LNA compete for the ∆6-desaturase enzyme system affecting the production of eicosapentaenoic acid and docosahexaenoic acid in the fish. The data also indicate that silver perch have the ability to chain elongate and desaturate LA and LNA to their respective longer chain polyunsaturated fatty acids. The higher weight gain with the additional inclusion of longer chain n-3 fatty acids in the diet (fish oil) indicated that the conversion process in silver perch is inadequate to meet their requirements.
Introduction
Fish utilise essential fatty acids (EFAs) for development, normal growth and cellular structure and function including the maintenance of membranes and eicosanoid metabolism (Henderson & Tocher, 1987, Shepherd & Bromage, 1988). Any fatty acids that are unable to be synthesised de novo must be obtained from the diet. If EFA are deficient in the diet of the species being cultured then deficiency symptoms can occur. Signs of deficiency include poor growth, increased water content of the muscle, high liver lipid content, low feed efficiency, shock syndrome, fin erosion, mitochondrial swelling and a decrease in haemoglobin (Stickney & Andrews, 1972, Castell et al., 1972a, Castell et al., 1972b, Watanabe et al., 1974a). A biochemical sign of EFA deficiency is the increasing presence of n-9 polyunsaturated fatty acids (PUFAs) in the fish lipids (Castell et al., 1972c).
FRDC Project No. 96/392 Smith et al.
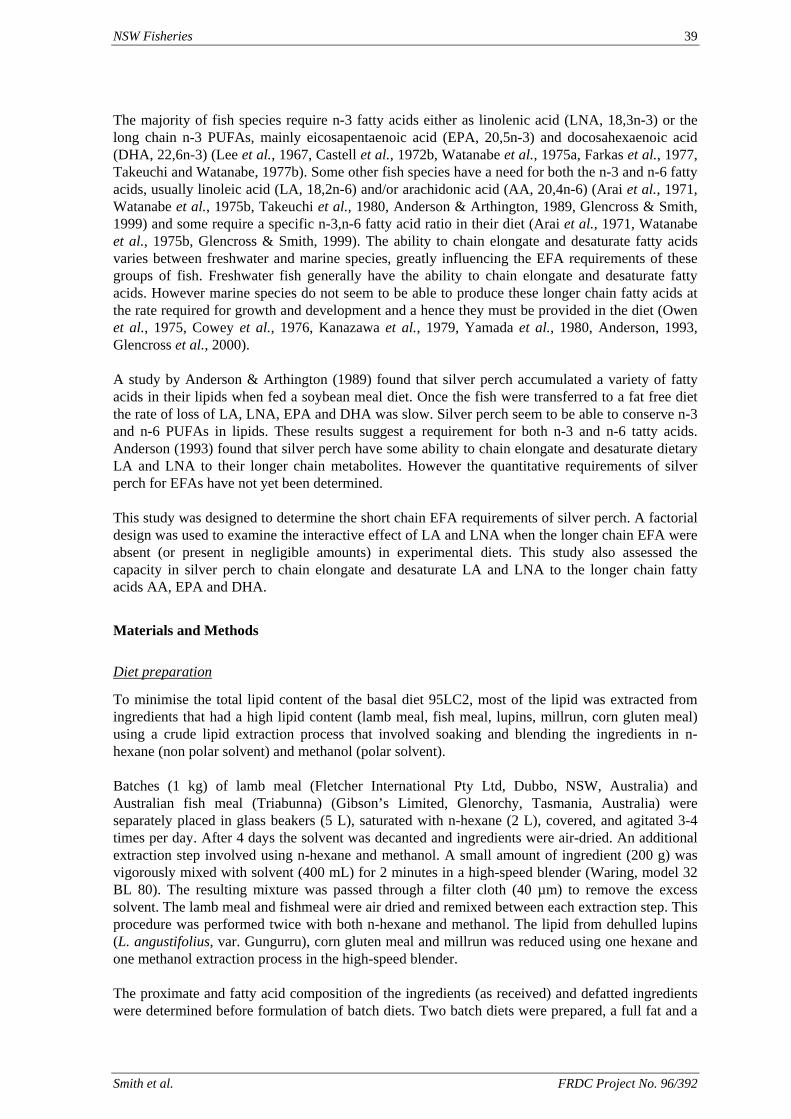
NSW Fisheries 39
The majority of fish species require n-3 fatty acids either as linolenic acid (LNA, 18,3n-3) or the long chain n-3 PUFAs, mainly eicosapentaenoic acid (EPA, 20,5n-3) and docosahexaenoic acid (DHA, 22,6n-3) (Lee et al., 1967, Castell et al., 1972b, Watanabe et al., 1975a, Farkas et al., 1977, Takeuchi and Watanabe, 1977b). Some other fish species have a need for both the n-3 and n-6 fatty acids, usually linoleic acid (LA, 18,2n-6) and/or arachidonic acid (AA, 20,4n-6) (Arai et al., 1971, Watanabe et al., 1975b, Takeuchi et al., 1980, Anderson & Arthington, 1989, Glencross & Smith, 1999) and some require a specific n-3,n-6 fatty acid ratio in their diet (Arai et al., 1971, Watanabe et al., 1975b, Glencross & Smith, 1999). The ability to chain elongate and desaturate fatty acids varies between freshwater and marine species, greatly influencing the EFA requirements of these groups of fish. Freshwater fish generally have the ability to chain elongate and desaturate fatty acids. However marine species do not seem to be able to produce these longer chain fatty acids at the rate required for growth and development and a hence they must be provided in the diet (Owen et al., 1975, Cowey et al., 1976, Kanazawa et al., 1979, Yamada et al., 1980, Anderson, 1993, Glencross et al., 2000). A study by Anderson & Arthington (1989) found that silver perch accumulated a variety of fatty acids in their lipids when fed a soybean meal diet. Once the fish were transferred to a fat free diet the rate of loss of LA, LNA, EPA and DHA was slow. Silver perch seem to be able to conserve n-3 and n-6 PUFAs in lipids. These results suggest a requirement for both n-3 and n-6 tatty acids. Anderson (1993) found that silver perch have some ability to chain elongate and desaturate dietary LA and LNA to their longer chain metabolites. However the quantitative requirements of silver perch for EFAs have not yet been determined. This study was designed to determine the short chain EFA requirements of silver perch. A factorial design was used to examine the interactive effect of LA and LNA when the longer chain EFA were absent (or present in negligible amounts) in experimental diets. This study also assessed the capacity in silver perch to chain elongate and desaturate LA and LNA to the longer chain fatty acids AA, EPA and DHA.
Materials and Methods
Diet preparation
To minimise the total lipid content of the basal diet 95LC2, most of the lipid was extracted from ingredients that had a high lipid content (lamb meal, fish meal, lupins, millrun, corn gluten meal) using a crude lipid extraction process that involved soaking and blending the ingredients in n-hexane (non polar solvent) and methanol (polar solvent). Batches (1 kg) of lamb meal (Fletcher International Pty Ltd, Dubbo, NSW, Australia) and Australian fish meal (Triabunna) (Gibson’s Limited, Glenorchy, Tasmania, Australia) were separately placed in glass beakers (5 L), saturated with n-hexane (2 L), covered, and agitated 3-4 times per day. After 4 days the solvent was decanted and ingredients were air-dried. An additional extraction step involved using n-hexane and methanol. A small amount of ingredient (200 g) was vigorously mixed with solvent (400 mL) for 2 minutes in a high-speed blender (Waring, model 32 BL 80). The resulting mixture was passed through a filter cloth (40 µm) to remove the excess solvent. The lamb meal and fishmeal were air dried and remixed between each extraction step. This procedure was performed twice with both n-hexane and methanol. The lipid from dehulled lupins (L. angustifolius, var. Gungurru), corn gluten meal and millrun was reduced using one hexane and one methanol extraction process in the high-speed blender. The proximate and fatty acid composition of the ingredients (as received) and defatted ingredients were determined before formulation of batch diets. Two batch diets were prepared, a full fat and a
Smith et al. FRDC Project No. 96/392
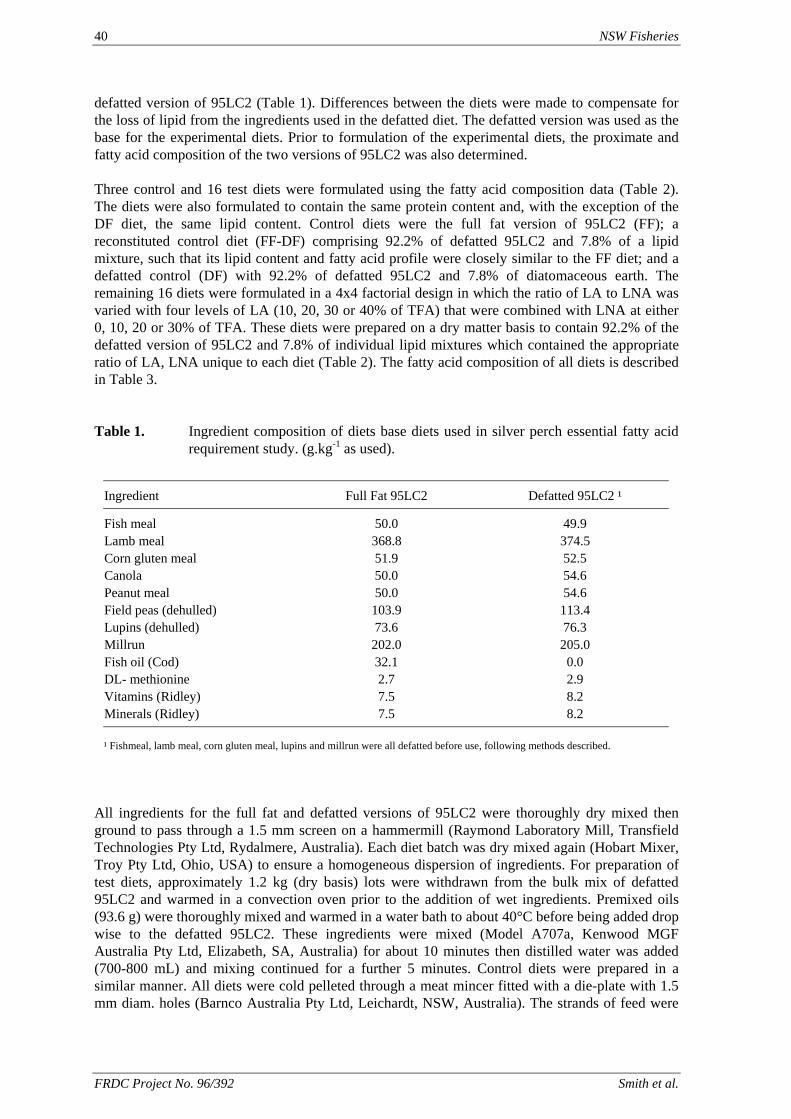
40 NSW Fisheries
defatted version of 95LC2 (Table 1). Differences between the diets were made to compensate for the loss of lipid from the ingredients used in the defatted diet. The defatted version was used as the base for the experimental diets. Prior to formulation of the experimental diets, the proximate and fatty acid composition of the two versions of 95LC2 was also determined. Three control and 16 test diets were formulated using the fatty acid composition data (Table 2). The diets were also formulated to contain the same protein content and, with the exception of the DF diet, the same lipid content. Control diets were the full fat version of 95LC2 (FF); a reconstituted control diet (FF-DF) comprising 92.2% of defatted 95LC2 and 7.8% of a lipid mixture, such that its lipid content and fatty acid profile were closely similar to the FF diet; and a defatted control (DF) with 92.2% of defatted 95LC2 and 7.8% of diatomaceous earth. The remaining 16 diets were formulated in a 4x4 factorial design in which the ratio of LA to LNA was varied with four levels of LA (10, 20, 30 or 40% of TFA) that were combined with LNA at either 0, 10, 20 or 30% of TFA. These diets were prepared on a dry matter basis to contain 92.2% of the defatted version of 95LC2 and 7.8% of individual lipid mixtures which contained the appropriate ratio of LA, LNA unique to each diet (Table 2). The fatty acid composition of all diets is described in Table 3. Table 1. Ingredient composition of diets base diets used in silver perch essential fatty acid
requirement study. (g.kg-1 as used).
Ingredient Full Fat 95LC2 Defatted 95LC2 ¹
Fish meal 50.0 49.9 Lamb meal 368.8 374.5 Corn gluten meal 51.9 52.5 Canola 50.0 54.6 Peanut meal 50.0 54.6 Field peas (dehulled) 103.9 113.4 Lupins (dehulled) 73.6 76.3 Millrun 202.0 205.0 Fish oil (Cod) 32.1 0.0 DL- methionine 2.7 2.9 Vitamins (Ridley) 7.5 8.2 Minerals (Ridley) 7.5 8.2 ¹ Fishmeal, lamb meal, corn gluten meal, lupins and millrun were all defatted before use, following methods described.
All ingredients for the full fat and defatted versions of 95LC2 were thoroughly dry mixed then ground to pass through a 1.5 mm screen on a hammermill (Raymond Laboratory Mill, Transfield Technologies Pty Ltd, Rydalmere, Australia). Each diet batch was dry mixed again (Hobart Mixer, Troy Pty Ltd, Ohio, USA) to ensure a homogeneous dispersion of ingredients. For preparation of test diets, approximately 1.2 kg (dry basis) lots were withdrawn from the bulk mix of defatted 95LC2 and warmed in a convection oven prior to the addition of wet ingredients. Premixed oils (93.6 g) were thoroughly mixed and warmed in a water bath to about 40°C before being added drop wise to the defatted 95LC2. These ingredients were mixed (Model A707a, Kenwood MGF Australia Pty Ltd, Elizabeth, SA, Australia) for about 10 minutes then distilled water was added (700-800 mL) and mixing continued for a further 5 minutes. Control diets were prepared in a similar manner. All diets were cold pelleted through a meat mincer fitted with a die-plate with 1.5 mm diam. holes (Barnco Australia Pty Ltd, Leichardt, NSW, Australia). The strands of feed were
FRDC Project No. 96/392 Smith et al.
NSW Fisheries 41
then dried in a convection oven at < 35°C for approximately 5 hours until moisture content was < 10% before being broken up in to ~ 5 mm long pellets. During the course of the experiment, all treatments diets were maintained in a nitrogen atmosphere to prevent possible oxidation of TFA. Animals and experimental design
Prior to stocking, silver perch were held in 10,000 L tanks and fed a standard silver perch diet SP35 (Allan, et al. 2000). Fingerlings were sedated in a bath of ethyl p-aminobenzoate (30 mg/L) then caught at random, weighed individually (mean initial weight ± SD; .1.8 ± 0.12 g) and systematically stocked into aerated tanks (8 fingerlings/tank). A sample of the fish used to stock the experiment was frozen and stored for later analysis. Four randomly selected replicate tanks were provided for each of the 19 dietary treatments. Fish that died during the experiment were replaced with weighed, fin clipped fish and these were later excluded from all estimates of fish performance and carcass analysis.
Smith et al. FRDC Project No. 96/392
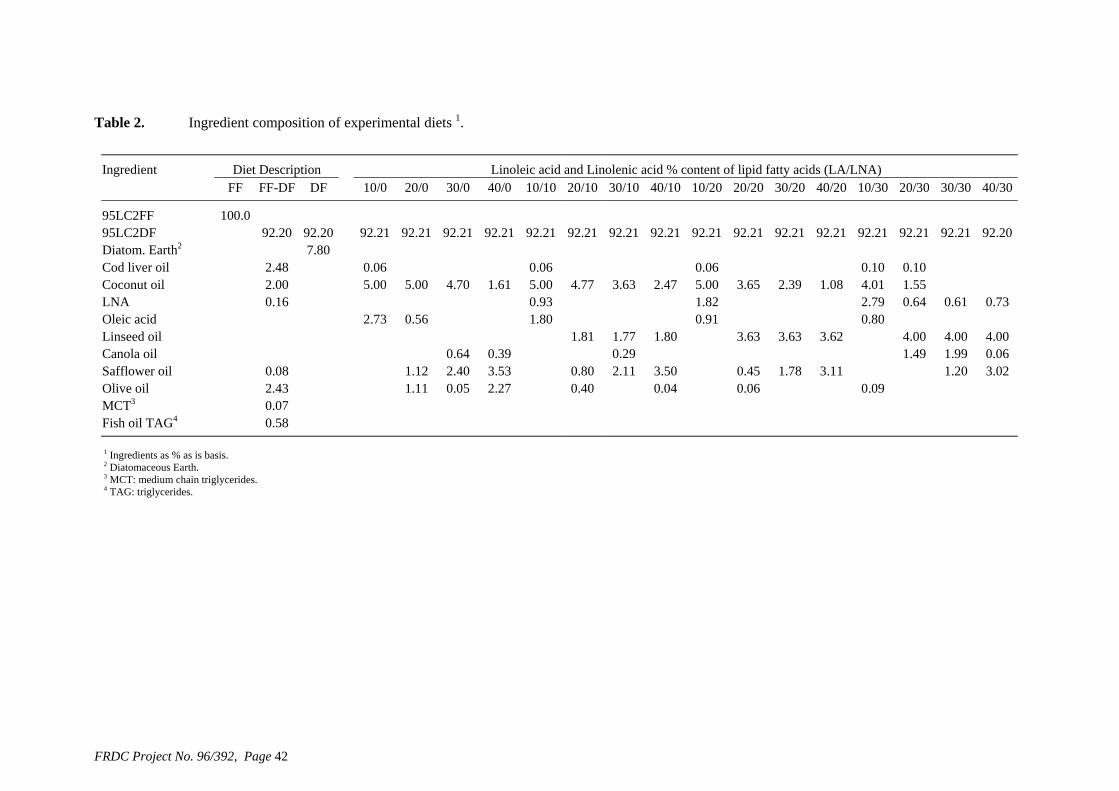
Table 2. Ingredient composition of experimental diets 1.
Ingredient
Diet Description
Linoleic acid and Linolenic acid % content of lipid fatty acids (LA/LNA) FF FF-DF DF 10/0 20/0 30/0 40/0 10/10 20/10 30/10 10/20 20/20 30/20 40/20 10/30 20/30 30/30 40/30
95LC2FF 0.0
.8
.07
.58
1095LC2DF 92.20 92.20 92.21
92.21 92.21
40/10
92.21 92.21 92.21 92.21 92.21 92.21 92.21 92.21 92.21 92.21 92.21 92.21 92.20Diatom. Earth2 7
0
Cod liver oil 2.48 0.06 0.06 0.06 0.10 0.10Coconut oil
2.00 5.00
5.00 4.70 1.61 5.00 4.77
3.63 2.47 5.00 3.65
2.39 1.08 4.01 1.55
LNA 0.16 0.93 1.82 2.79 0.64
0.61 0.73Oleic acid 2.73
0.56 1.80 0.91
0.80
Linseed oil 1.81 1.77 1.80
3.63 3.63 3.62 4.00 4.00 4.00Canola oil 0.64 0.39 0.29 1.49
1.99 0.06
Safflower oil
0.08 1.12 2.40 3.53 0.80 2.11
3.50 0.45 1.78
3.11
1.20
3.02 Olive oil 2.43 1.11 0.05 2.27 0.40 0.04 0.06 0.09
MCT3 0Fish oil TAG4 0 1 Ingredients as % as is basis. 2 Diatomaceous Earth. 3 MCT: medium chain triglycerides. 4 TAG: triglycerides.
FRDC Project No. 96/392, Page 42
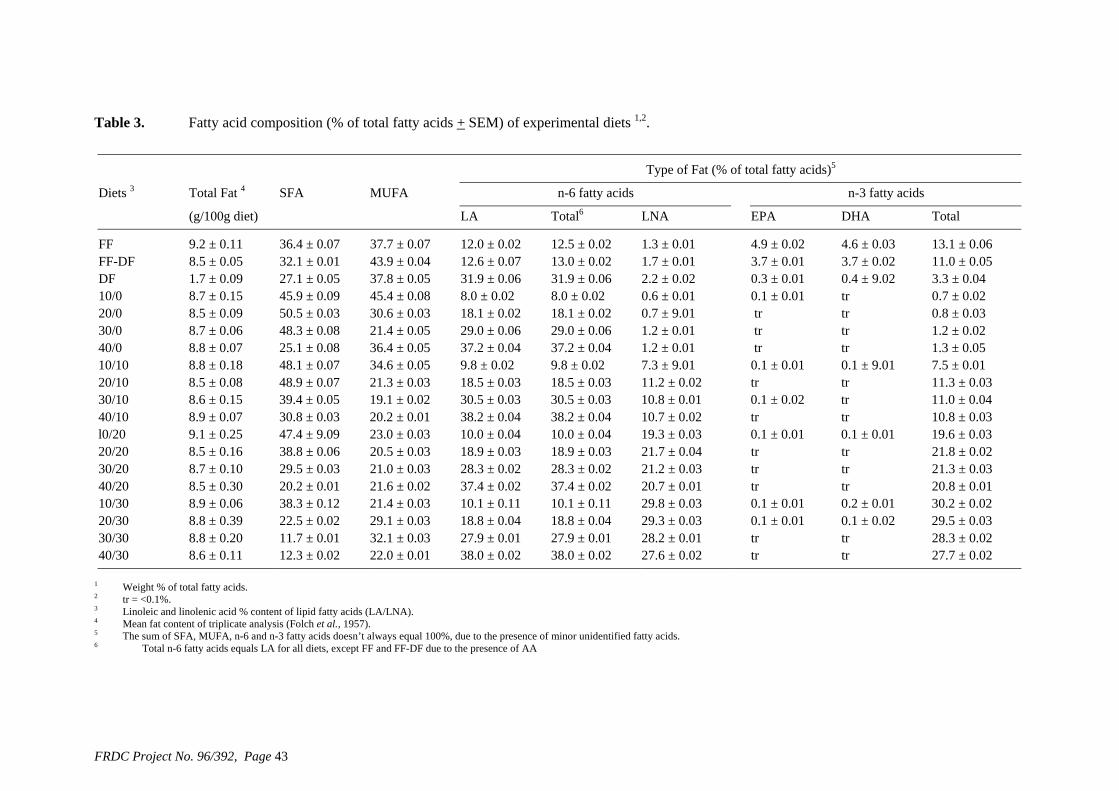
Table 3. Fatty acid composition (% of total fatty acids + SEM) of experimental diets 1,2. Type of Fat (% of total fatty acids)5
Diets 3 Total Fat 4 SFA MUFA n-6 fatty acids n-3 fatty acids
(g/100g diet) LA Total6 LNA EPA DHA Total
FF 9.2 ± 0.11 36.4 ± 0.07 37.7 ± 0.07 12.0 ± 0.02 12.5 ± 0.02 1.3 ± 0.01 4.9 ± 0.02 4.6 ± 0.03 13.1 ± 0.06 FF-DF 8.5 ± 0.05 32.1 ± 0.01 43.9 ± 0.04 12.6 ± 0.07 13.0 ± 0.02 1.7 ± 0.01 3.7 ± 0.01 3.7 ± 0.02 11.0 ± 0.05 DF 1.7 ± 0.09 27.1 ± 0.05 37.8 ± 0.05 31.9 ± 0.06 31.9 ± 0.06 2.2 ± 0.02 0.3 ± 0.01 0.4 ± 9.02 3.3 ± 0.04 10/0 8.7 ± 0.15 45.9 ± 0.09 45.4 ± 0.08 8.0 ± 0.02 8.0 ± 0.02 0.6 ± 0.01 0.1 ± 0.01 tr 0.7 ± 0.02 20/0 8.5 ± 0.09 50.5 ± 0.03 30.6 ± 0.03 18.1 ± 0.02 18.1 ± 0.02 0.7 ± 9.01 tr tr 0.8 ± 0.03 30/0 8.7 ± 0.06 48.3 ± 0.08 21.4 ± 0.05 29.0 ± 0.06 29.0 ± 0.06 1.2 ± 0.01 tr tr 1.2 ± 0.02 40/0 8.8 ± 0.07 25.1 ± 0.08 36.4 ± 0.05 37.2 ± 0.04 37.2 ± 0.04 1.2 ± 0.01 tr tr 1.3 ± 0.05 10/10 8.8 ± 0.18 48.1 ± 0.07 34.6 ± 0.05 9.8 ± 0.02 9.8 ± 0.02 7.3 ± 9.01 0.1 ± 0.01 0.1 ± 9.01 7.5 ± 0.01 20/10 8.5 ± 0.08 48.9 ± 0.07 21.3 ± 0.03 18.5 ± 0.03 18.5 ± 0.03 11.2 ± 0.02 tr tr 11.3 ± 0.03 30/10 8.6 ± 0.15 39.4 ± 0.05 19.1 ± 0.02 30.5 ± 0.03 30.5 ± 0.03 10.8 ± 0.01 0.1 ± 0.02 tr 11.0 ± 0.04 40/10 8.9 ± 0.07 30.8 ± 0.03 20.2 ± 0.01 38.2 ± 0.04 38.2 ± 0.04 10.7 ± 0.02 tr tr 10.8 ± 0.03 l0/20 9.1 ± 0.25 47.4 ± 9.09 23.0 ± 0.03 10.0 ± 0.04 10.0 ± 0.04 19.3 ± 0.03 0.1 ± 0.01 0.1 ± 0.01 19.6 ± 0.03 20/20 8.5 ± 0.16 38.8 ± 0.06 20.5 ± 0.03 18.9 ± 0.03 18.9 ± 0.03 21.7 ± 0.04 tr tr 21.8 ± 0.02 30/20 8.7 ± 0.10 29.5 ± 0.03 21.0 ± 0.03 28.3 ± 0.02 28.3 ± 0.02 21.2 ± 0.03 tr tr 21.3 ± 0.03 40/20 8.5 ± 0.30 20.2 ± 0.01 21.6 ± 0.02 37.4 ± 0.02 37.4 ± 0.02 20.7 ± 0.01 tr tr 20.8 ± 0.01 10/30 8.9 ± 0.06 38.3 ± 0.12 21.4 ± 0.03 10.1 ± 0.11 10.1 ± 0.11 29.8 ± 0.03 0.1 ± 0.01 0.2 ± 0.01 30.2 ± 0.02 20/30 8.8 ± 0.39 22.5 ± 0.02 29.1 ± 0.03 18.8 ± 0.04 18.8 ± 0.04 29.3 ± 0.03 0.1 ± 0.01 0.1 ± 0.02 29.5 ± 0.03 30/30 8.8 ± 0.20 11.7 ± 0.01 32.1 ± 0.03 27.9 ± 0.01 27.9 ± 0.01 28.2 ± 0.01 tr tr 28.3 ± 0.02 40/30 8.6 ± 0.11 12.3 ± 0.02 22.0 ± 0.01 38.0 ± 0.02 38.0 ± 0.02 27.6 ± 0.02 tr tr 27.7 ± 0.02
1 Weight % of total fatty acids. 2 tr = <0.1%. 3 Linoleic and linolenic acid % content of lipid fatty acids (LA/LNA). 4 Mean fat content of triplicate analysis (Folch et al., 1957). 5 The sum of SFA, MUFA, n-6 and n-3 fatty acids doesn’t always equal 100%, due to the presence of minor unidentified fatty acids. 6 Total n-6 fatty acids equals LA for all diets, except FF and FF-DF due to the presence of AA
FRDC Project No. 96/392, Page 43
44 NSW Fisheries
Experimental tanks (76 x 70 L) were supplied with continuously flowing, pre-heated water at a rate of 600 mL/minute. All water was filtered of particulate material, and passed through a 2 m³ biological filter and an ultra violet conditioning unit (Australian Ultra Violet Products Pty Ltd, Seven Hills, NSW, Australia) before recirculation to the laboratory. Approximately 30% of the circulating water continuously discharged as effluent. Automatically controlled fluorescent lighting provided a 12 hour light/ 12 hour dark photoperiod. All tanks were siphoned twice weekly to remove any accumulated faeces. Replacement fish were held in a polyethylene tank (200 L) in the same laboratory being supplied with single pass water from the same system. Water quality was monitored weekly by sampling from 20 tanks (on a rotating basis) using a model 611 Intelligent Water Quality Analyser (Yeo-Kal Electronics Pty Ltd, Brookvale, NSW, Australia). During the experiment, water temperature (range 25.1 to 27.1°C), dissolved oxygen (6.4-8.1 mg/L), pH (between 7.9 and 8.9) and salinity (1.0-6.5) as measured using this equipment. Nitrite and ammonia (< 40 µg/L N02-N and <100 µg/L total ammonia-N respectively) were measured using the indophenol blue colorimetric method. Un-ionised ammonia concentrations, measured as ammonia nitrogen (NH3-N) were calculated weekly from measurements of total ammonia nitrogen (total ammonia-N) (Allan et al., 1990). Experimental diets were introduced to the fingerlings 24 hours after stocking. Fish were fed a weighed ration of their respective diets twice daily (40% at 0815 hours and 60% at 1500 hours), beginning at 3% biomass/day then to satiation for the remainder of the study. Feed rates were adjusted daily following a scoring protocol designed to track the satiation response of each individual tank. Any uneaten food was collected from the tanks approximately 20 minutes after feeding, dried and weighed. Fish were fed for a period of 57 days after which they were weighed and killed with an overdose of anaesthetic (benzocaine). Weight gain (g), feed consumption (g), food conversion ratio (FCR; dry basis food consumed (g)/ net wet weight gain of fish (g)), and survival (%; number of original fish at harvest x 100/ number fish stocked) were measured. Two fish from each tank had their heads and viscera removed (livers stored at -20°C for later analysis). All fish carcasses from the initial and final samples were freeze-dried and homogenised for lipid analysis. All measured indices were reported as mean ± SEM. Biochemical analyses
Dry matter was determined by weighing before and after drying at 105°C for 16 h and cooling in a vacuum desiccator; ash by heating a weighed and dried sample at 550°C for 16 h before cooling in a desiccator and re-weighing (method 938.08, AOAC 1999). Crude protein was determined by the Kjeldahl method. Gross energy was determined by isothermal bomb calorimetry using a Leco AC200 Bomb Calorimeter (Leco Corp. St. Joseph, MI, USA). Total lipid was determined gravimetrically following a chloroform-methanol (2,1) extraction using the method of Folch et al. (1957). The lipid from a sample (2 g) of the pooled fish homogenate and liver was extracted by the method of Folch et al. (1957), chloroform was removed under vacuum and the weighed extract stored in chloroform (2 ml,) at -20°C until analysis. A sample (2 mg) of fish and liver lipid extract was treated to form fatty acid methyl esters using the method of direct transesterication (Lepage & Roy, 1986) with the fatty acids tridecanoic (13:0) and heneicosanoic (21:0) added as internal standards. Analysis of the fatty acid methyl esters was by flame ionisation capillary gas chromatography (Hewlett Packard 5890 series II) using a fused silica capillary column (DB 225, 30 m x 0.25 mm, ID x 0.25 um, J and W Scientific, Folsom, California, USA). Injector temperature was 250°C with column temperature programmed from 170°C to 220°C with detector temperature at 250°C. Identification was by comparison with known fatty acid standards. A sample of lipid was sent to another laboratory (Child Nutrition Research Centre, Flinders Medical Centre, SA, Australia) for the identification of two unknown fatty acids. These fatty acids were identified as octadecanoic acid (18:2n-9) and eicosadienoic acid (20:2n-9, EDA) by using both flame ionisation detection and mass spectrometry gas chromatography.
FRDC Project No. 96/392 Smith et al.
NSW Fisheries 45
Samples of the total lipid extract (100 mg) were separated into the neutral lipid and polar lipid fractions by passing the total lipid though a glass column (10 mm ID) packed with silicic acid/celite (1:1, 2 g). The neutral lipid fraction was eluted from the column with chloroform (60 mL). The polar lipid fraction (predominantly phospholipid) was then eluted from the column with methanol (60 mL). Solvents were removed from the neutral lipid and polar lipid fractions under vacuum and the weighed extract stored in chloroform (2 mL) and methanol (2 mL) respectively at -20°C until analysis. Samples (2 mg) of the lipid fractions were transesterified and analysed for fatty acids as described above. The neutral lipid fraction was predominantly triglyceride and will be referred to as the ‘triglycerides’ and the polar lipid fraction was predominantly phospholipid and will be referred to as the ‘phospholipids’. The phospholipids were measured as an indication of total membrane lipids and the triglycerides as an estimate of storage fat. Statistical analyses
The effect of diet on fingerling weight gain and body composition were tested using a single factor ANOVA and a two factorial ANOVA. Comparison between means, where necessary, were made using Student Newman Kuel's (SNK) multiple range test (P < 0.05) (Statgraphics Version 5, 1993). Data for weight gain and body composition satisfied Cochran's test for homogeneity of variance (Winer, 1971). Cochran's test for homogeneity of variance (Winer, 1971) was performed on fatty acid compositional data (total lipid, triglyceride, phospholipid fraction and liver lipids). When this data was heterogenous, they were transformed (log10) prior to analysis.
Smith et al. FRDC Project No. 96/392Page
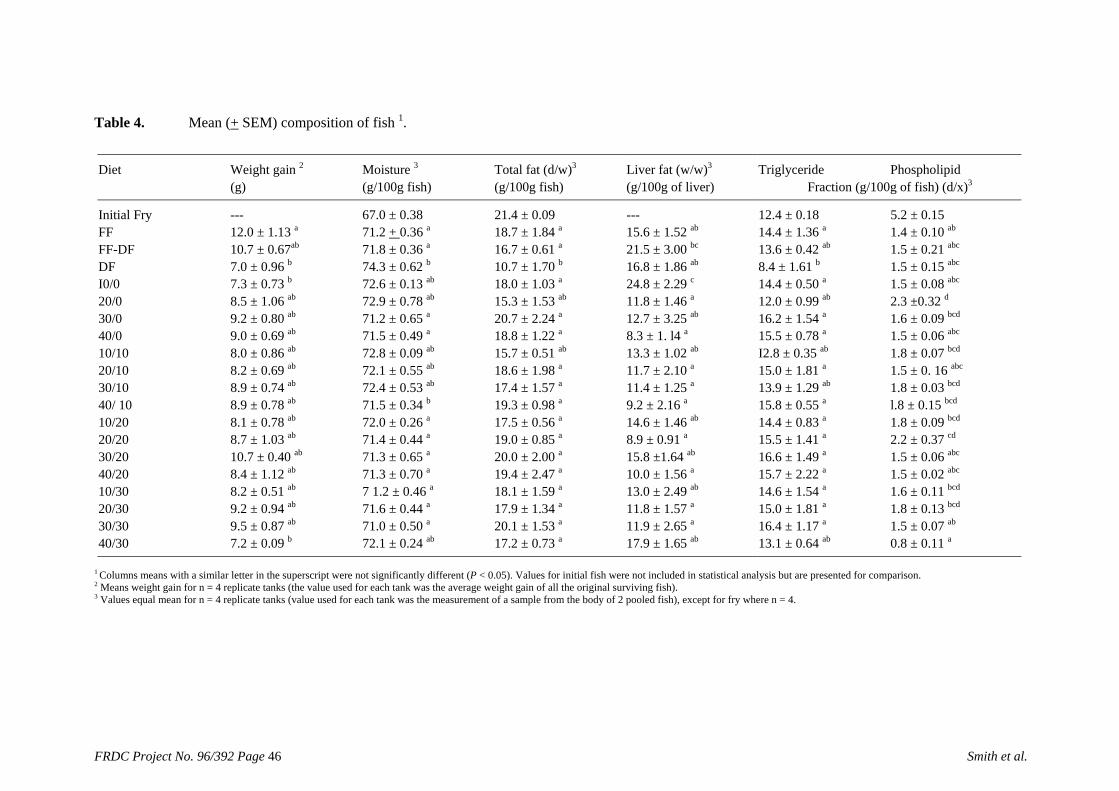
Table 4. Mean (+ SEM) composition of fish 1. Diet Weight gain 2 Moisture 3 Total fat (d/w)3 Liver fat (w/w)3 Triglyceride Phospholipid (g) (g/100g fish) (g/100g fish) (g/100g of liver) Fraction (g/100g of fish) (d/x)3
Initial Fry --- 67.0 ± 0.38 21.4 ± 0.09 --- 12.4 ± 0.18 5.2 ± 0.15 FF 12.0 ± 1.13 a 71.2 + 0.36 a 18.7 ± 1.84 a 15.6 ± 1.52 ab 14.4 ± 1.36 a 1.4 ± 0.10 ab FF-DF 10.7 ± 0.67ab 71.8 ± 0.36 a 16.7 ± 0.61 a 21.5 ± 3.00 bc 13.6 ± 0.42 ab 1.5 ± 0.21 abc DF 7.0 ± 0.96 b 74.3 ± 0.62 b 10.7 ± 1.70 b 16.8 ± 1.86 ab 8.4 ± 1.61 b 1.5 ± 0.15 abc I0/0 7.3 ± 0.73 b 72.6 ± 0.13 ab 18.0 ± 1.03 a 24.8 ± 2.29 c 14.4 ± 0.50 a 1.5 ± 0.08 abc 20/0 8.5 ± 1.06 ab 72.9 ± 0.78 ab 15.3 ± 1.53 ab 11.8 ± 1.46 a 12.0 ± 0.99 ab
2.3 ±0.32 d 30/0 9.2 ± 0.80 ab 71.2 ± 0.65 a 20.7 ± 2.24 a 12.7 ± 3.25 ab 16.2 ± 1.54 a 1.6 ± 0.09 bcd 40/0 9.0 ± 0.69 ab 71.5 ± 0.49 a 18.8 ± 1.22 a 8.3 ± 1. l4 a 15.5 ± 0.78 a 1.5 ± 0.06 abc 10/10 8.0 ± 0.86 ab 72.8 ± 0.09 ab 15.7 ± 0.51 ab 13.3 ± 1.02 ab I2.8 ± 0.35 ab 1.8 ± 0.07 bcd 20/10 8.2 ± 0.69 ab 72.1 ± 0.55 ab 18.6 ± 1.98 a 11.7 ± 2.10 a 15.0 ± 1.81 a 1.5 ± 0. 16 abc 30/10 8.9 ± 0.74 ab 72.4 ± 0.53 ab 17.4 ± 1.57 a 11.4 ± 1.25 a 13.9 ± 1.29 ab 1.8 ± 0.03 bcd 40/ 10 8.9 ± 0.78 ab 71.5 ± 0.34 b 19.3 ± 0.98 a 9.2 ± 2.16 a 15.8 ± 0.55 a l.8 ± 0.15 bcd 10/20 8.1 ± 0.78 ab 72.0 ± 0.26 a 17.5 ± 0.56 a 14.6 ± 1.46 ab 14.4 ± 0.83 a 1.8 ± 0.09 bcd 20/20 8.7 ± 1.03 ab 71.4 ± 0.44 a 19.0 ± 0.85 a 8.9 ± 0.91 a 15.5 ± 1.41 a 2.2 ± 0.37 cd 30/20 10.7 ± 0.40 ab 71.3 ± 0.65 a 20.0 ± 2.00 a 15.8 ±1.64 ab 16.6 ± 1.49 a 1.5 ± 0.06 abc 40/20 8.4 ± 1.12 ab 71.3 ± 0.70 a 19.4 ± 2.47 a 10.0 ± 1.56 a 15.7 ± 2.22 a 1.5 ± 0.02 abc 10/30 8.2 ± 0.51 ab 7 1.2 ± 0.46 a 18.1 ± 1.59 a 13.0 ± 2.49 ab 14.6 ± 1.54 a 1.6 ± 0.11 bcd 20/30 9.2 ± 0.94 ab 71.6 ± 0.44 a 17.9 ± 1.34 a 11.8 ± 1.57 a 15.0 ± 1.81 a 1.8 ± 0.13 bcd 30/30 9.5 ± 0.87 ab 71.0 ± 0.50 a 20.1 ± 1.53 a 11.9 ± 2.65 a 16.4 ± 1.17 a 1.5 ± 0.07 ab 40/30 7.2 ± 0.09 b 72.1 ± 0.24 ab 17.2 ± 0.73 a 17.9 ± 1.65 ab 13.1 ± 0.64 ab 0.8 ± 0.11 a
1 Columns means with a similar letter in the superscript were not significantly different (P < 0.05). Values for initial fish were not included in statistical analysis but are presented for comparison. 2 Means weight gain for n = 4 replicate tanks (the value used for each tank was the average weight gain of all the original surviving fish). 3 Values equal mean for n = 4 replicate tanks (value used for each tank was the measurement of a sample from the body of 2 pooled fish), except for fry where n = 4.
FRDC Project No. 96/392 Page 46 Smith et al.
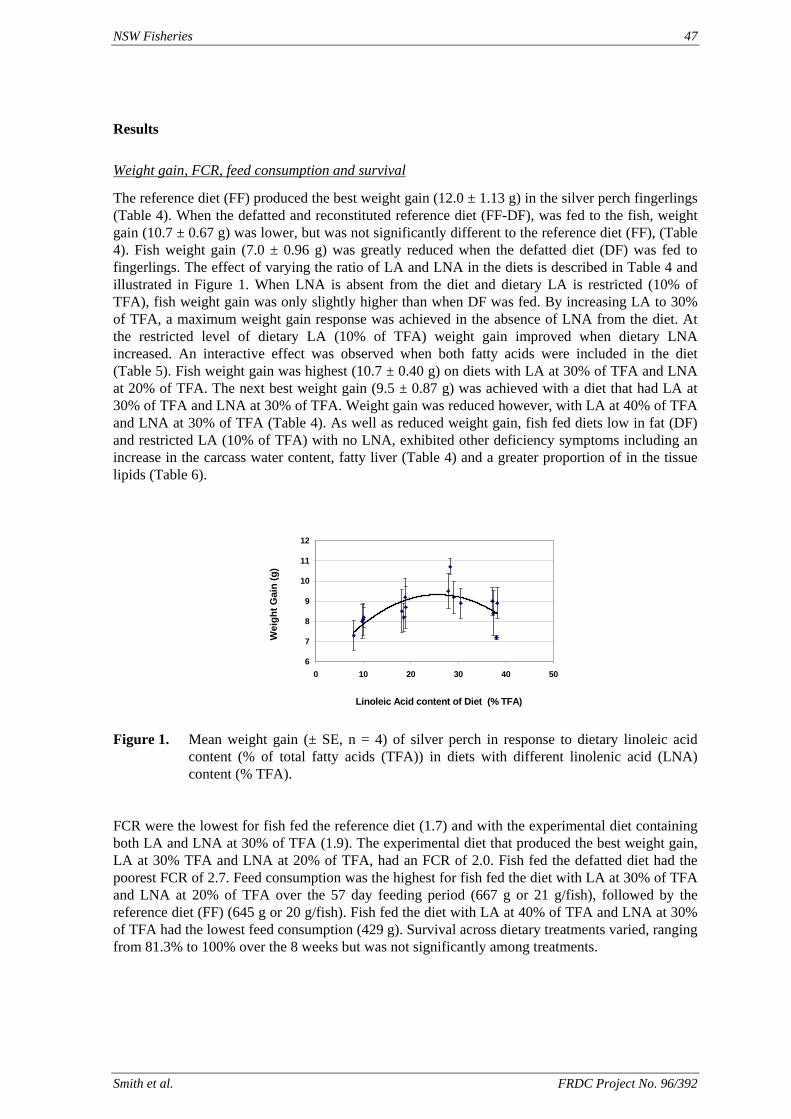
NSW Fisheries 47
Results
Weight gain, FCR, feed consumption and survival
The reference diet (FF) produced the best weight gain (12.0 ± 1.13 g) in the silver perch fingerlings (Table 4). When the defatted and reconstituted reference diet (FF-DF), was fed to the fish, weight gain (10.7 ± 0.67 g) was lower, but was not significantly different to the reference diet (FF), (Table 4). Fish weight gain (7.0 ± 0.96 g) was greatly reduced when the defatted diet (DF) was fed to fingerlings. The effect of varying the ratio of LA and LNA in the diets is described in Table 4 and illustrated in Figure 1. When LNA is absent from the diet and dietary LA is restricted (10% of TFA), fish weight gain was only slightly higher than when DF was fed. By increasing LA to 30% of TFA, a maximum weight gain response was achieved in the absence of LNA from the diet. At the restricted level of dietary LA (10% of TFA) weight gain improved when dietary LNA increased. An interactive effect was observed when both fatty acids were included in the diet (Table 5). Fish weight gain was highest (10.7 ± 0.40 g) on diets with LA at 30% of TFA and LNA at 20% of TFA. The next best weight gain (9.5 ± 0.87 g) was achieved with a diet that had LA at 30% of TFA and LNA at 30% of TFA. Weight gain was reduced however, with LA at 40% of TFA and LNA at 30% of TFA (Table 4). As well as reduced weight gain, fish fed diets low in fat (DF) and restricted LA (10% of TFA) with no LNA, exhibited other deficiency symptoms including an increase in the carcass water content, fatty liver (Table 4) and a greater proportion of in the tissue lipids (Table 6).
6
7
8
9
10
11
12
0 10 20 30 40 50
Linoleic Acid content of Diet (% TFA)
Wei
ght G
ain
(g)
Figure 1. Mean weight gain (± SE, n = 4) of silver perch in response to dietary linoleic acid
content (% of total fatty acids (TFA)) in diets with different linolenic acid (LNA) content (% TFA).
FCR were the lowest for fish fed the reference diet (1.7) and with the experimental diet containing both LA and LNA at 30% of TFA (1.9). The experimental diet that produced the best weight gain, LA at 30% TFA and LNA at 20% of TFA, had an FCR of 2.0. Fish fed the defatted diet had the poorest FCR of 2.7. Feed consumption was the highest for fish fed the diet with LA at 30% of TFA and LNA at 20% of TFA over the 57 day feeding period (667 g or 21 g/fish), followed by the reference diet (FF) (645 g or 20 g/fish). Fish fed the diet with LA at 40% of TFA and LNA at 30% of TFA had the lowest feed consumption (429 g). Survival across dietary treatments varied, ranging from 81.3% to 100% over the 8 weeks but was not significantly among treatments.
Smith et al. FRDC Project No. 96/392
48 NSW Fisheries
Lipid composition
There was a narrow range in carcass lipid content across all treatments (15.3 to 20.7%, d/w), except for the fish fed the defatted diet (10.7%, d/w) (Table 4). The lipid composition of the fish varied significantly among treatments (P < 0.05) being influenced by the fatty acid composition of the diets (P < 0.05) (Table 6). When both LA and LNA were present in the diet, an interactive effect (P < 0.05) was seen with saturated fatty acids (SFAs), monounsaturated fatty acids (MUFAs), 18,2n-9, LNA and EDA (Table 5). Increasing amounts of dietary LA and LNA resulted in a decrease in the proportion of SFAs (predominantly 16,0) and MUFAs (predominantly 18,1n-9) of the fish while the PUFA content increased (Table 6). The type of PUFAs also varied significantly across experimental diets (P < 0.05) (Table 6). When the dietary level of LNA was kept constant (either at 0, 10, 20 or 30% of TFA) and dietary LA was increased (10 through to 40% of TFA) the proportion of LA, LNA and AA in the carcass lipid increased (Table 6) and the mean proportion of EPA and DHA decreased (Table 6) (Figure 2). Triglyceride content
On average, triglycerides comprised 80.3 ± 2.01% of the total lipids and varied significantly across diets (P < 0.05) (Table 4). SFAs, MUFAs and PUFAs in the triglyceride fraction also differed greatly across experimental diets (Table 7) such that the dietary fatty acids influenced the fatty acids in triglycerides. As the dietary proportion of LA, LNA, EPA and DHA rose in the diet there was an increase in these fatty acids in the triglyceride fraction (Table 7). Phospholipid content
The phospholipids comprised 9.4 ± 2.8% of the total lipid and varied significantly across diets (P < 0.05) (Table 4). Differences in the SFAs, MUFAs and PUFAs existed in the phospholipids (Table 8). However, as the dietary proportion of LNA, EPA and DHA increased there were no significant changes in these n-3 fatty acids in the phospholipid fraction (Table 8). Liver fat content and composition
There was a significant difference in liver fat content across dietary treatments (8.3 to 24.8%, w/w) (Table 4), an interactive effect (P < 0.05) was seen with liver fat content when LA and LNA were present in the diet (Table 5). There was a significant difference in the proportions of SFAs, MUFAs and PUFAs (Table 9). Alterations in dietary LA and LNA influenced the proportions of fatty acids in the liver. When dietary LA and/or LNA increased the proportion of EDA in they, liver decreased. An increase in dietary LA caused an increase in the proportion of AA, however an increase in dietary LNA led to a decrease in the AA proportion in the liver. The relationship between dietary LA and LNA on the DHA content of the liver was more complicated. Generally, the proportion of DHA in the liver increased as dietary LNA increased.
FRDC Project No. 96/392 Smith et al.
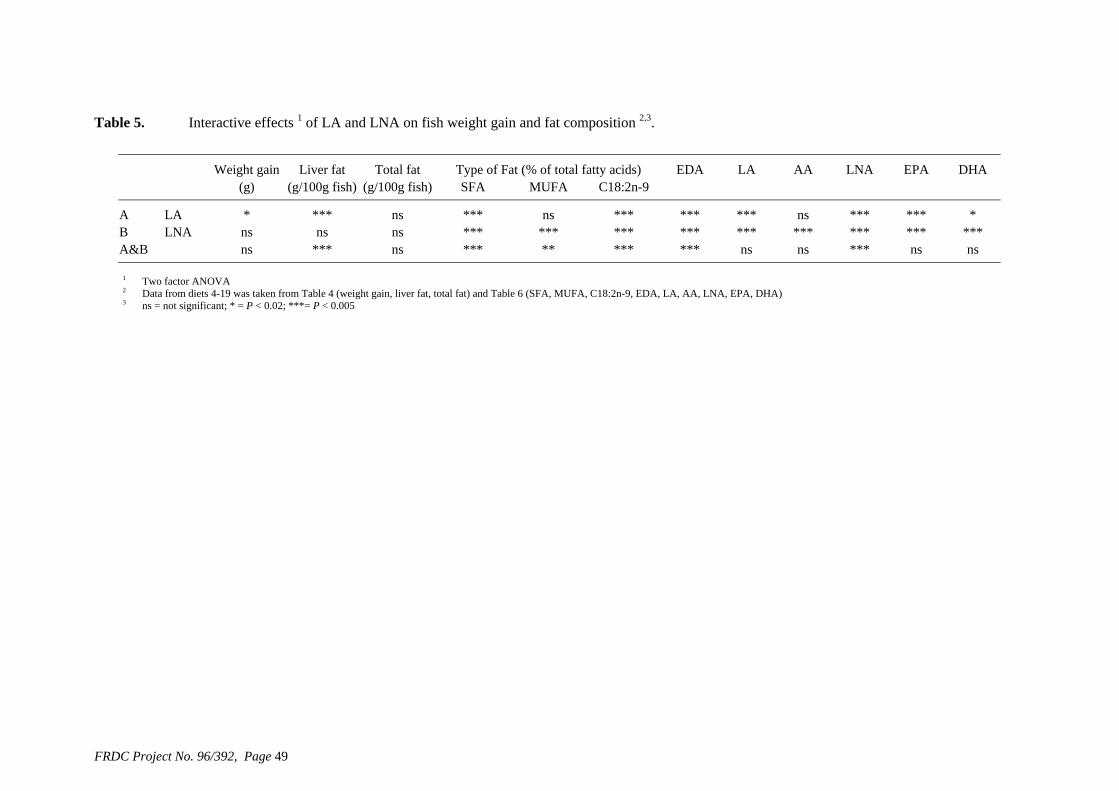
Table 5. Interactive effects 1 of LA and LNA on fish weight gain and fat composition 2,3.
Weight gain
Liver fat Total fat Type of Fat (% of total fatty acids)
EDA
LA AA LNA EPA DHA (g) (g/100g fish) (g/100g fish) SFA MUFA C18:2n-9
A
LA * *** ns *** ns *** *** *** ns *** *** *B LNA
ns ns ns *** *** *** *** *** *** *** *** ***
A&B ns *** ns *** ** *** *** ns ns *** ns ns 1 Two factor ANOVA 2 Data from diets 4-19 was taken from Table 4 (weight gain, liver fat, total fat) and Table 6 (SFA, MUFA, C18:2n-9, EDA, LA, AA, LNA, EPA, DHA) 3 ns = not significant; * = P < 0.02; ***= P < 0.005
FRDC Project No. 96/392, Page 49
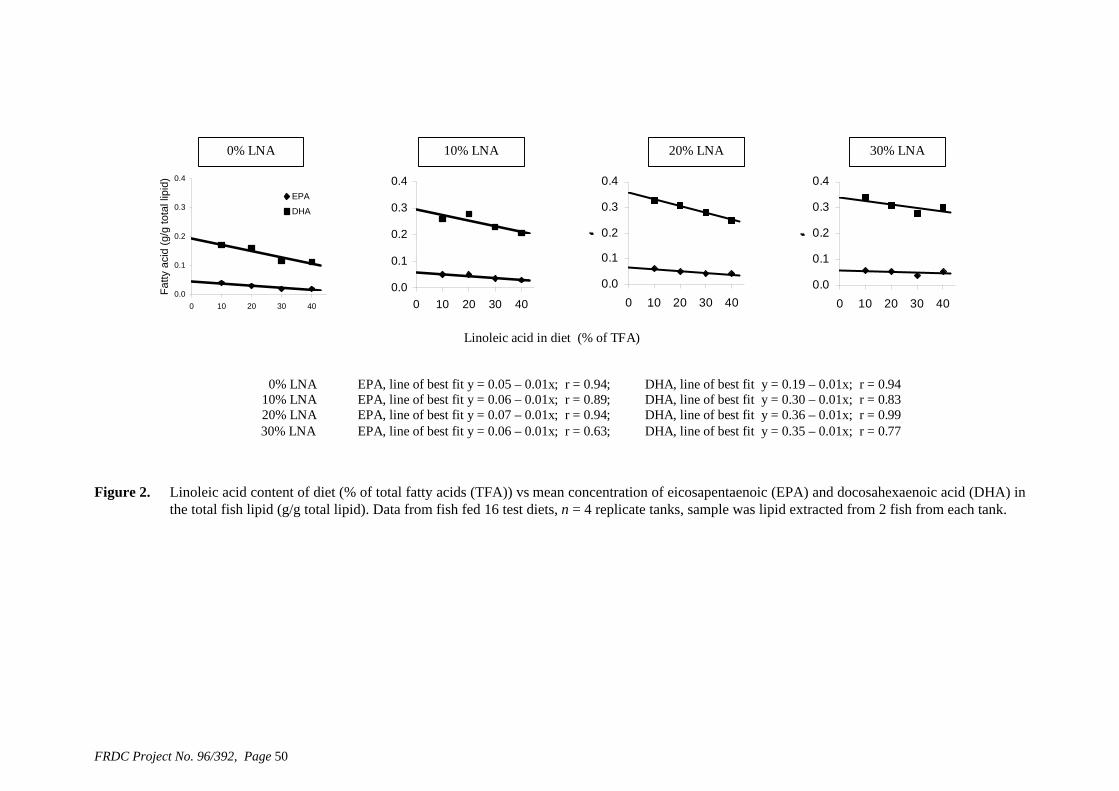
0.0
0.1
0.2
0.3
0.4
0 10 20 30 40
Fatty
aci
d (g
/g to
tal l
ipid
)
EPA
DHA
0.0
0.1
0.2
0.3
0.4
0 10 20 30 40
f
0.0
0.1
0.2
0.3
0.4
0 10 20 30 400.0
0.1
0.2
0.3
0.4
0 10 20 30 40
0% LNA 10% LNA 20% LNA 30% LNA
0% LNA EPA, line of best fit y = 0.05 – 0.01x; r = 0.94; DHA, line of best fit y = 0.19 – 0.01x; r = 0.9410% LNA EPA, line of best fit y = 0.06 – 0.01x; r = 0.89; DHA, line of best fit y = 0.30 – 0.01x; r = 0.8320% LNA EPA, line of best fit y = 0.07 – 0.01x; r = 0.94; DHA, line of best fit y = 0.36 – 0.01x; r = 0.9930% LNA EPA, line of best fit y = 0.06 – 0.01x; r = 0.63; DHA, line of best fit y = 0.35 – 0.01x; r = 0.77
Linoleic acid in diet (% of TFA)
Figure 2. Linoleic acid content of diet (% of total fatty acids (TFA)) vs mean concentration of eicosapentaenoic (EPA) and docosahexaenoic acid (DHA) in the total fish lipid (g/g total lipid). Data from fish fed 16 test diets, n = 4 replicate tanks, sample was lipid extracted from 2 fish from each tank.
FRDC Project No. 96/392, Page 50
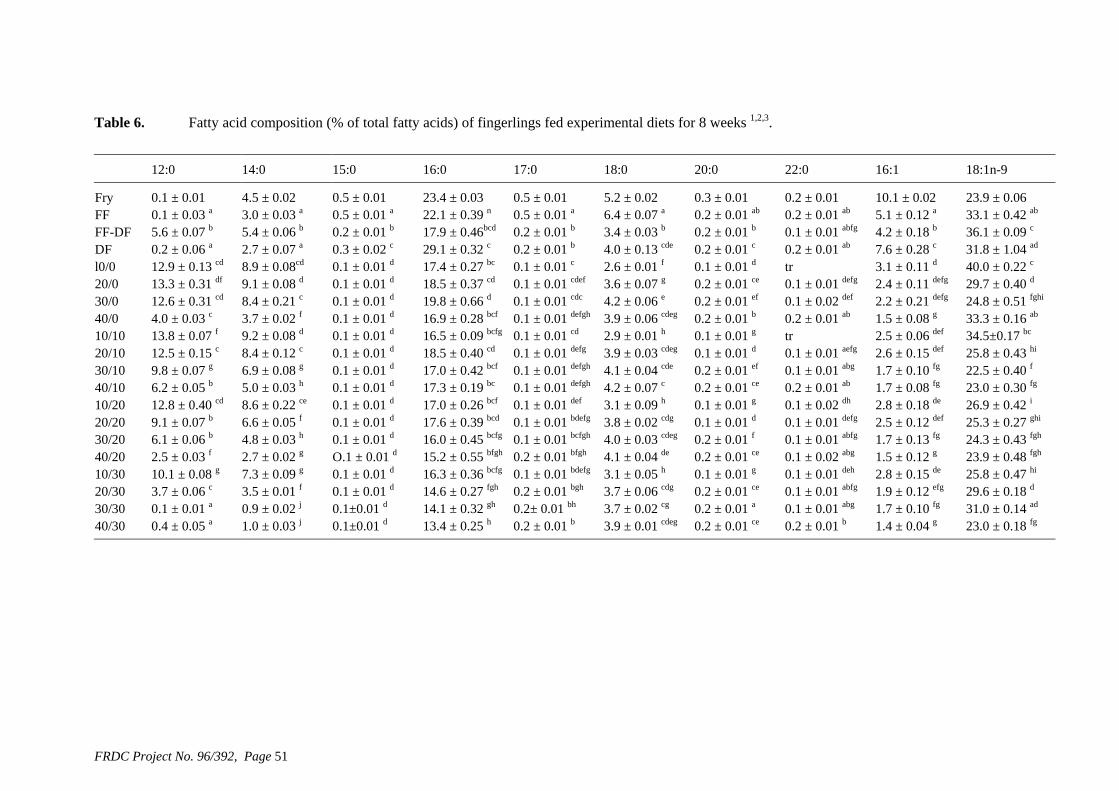
Table 6. Fatty acid composition (% of total fatty acids) of fingerlings fed experimental diets for 8 weeks 1,2,3. 12:0 14:0 15:0 16:0 17:0 18:0 20:0 22:0 16:1 18:1n-9
Fry 0.1 ± 0.01 4.5 ± 0.02 0.5 ± 0.01 23.4 ± 0.03 0.5 ± 0.01 5.2 ± 0.02 0.3 ± 0.01 0.2 ± 0.01 10.1 ± 0.02 23.9 ± 0.06 FF 0.1 ± 0.03 a 3.0 ± 0.03 a 0.5 ± 0.01 a 22.1 ± 0.39 n 0.5 ± 0.01 a 6.4 ± 0.07 a 0.2 ± 0.01 ab 0.2 ± 0.01 ab 5.1 ± 0.12 a 33.1 ± 0.42 ab FF-DF 5.6 ± 0.07 b 5.4 ± 0.06 b 0.2 ± 0.01 b 17.9 ± 0.46bcd 0.2 ± 0.01 b 3.4 ± 0.03 b 0.2 ± 0.01 b 0.1 ± 0.01 abfg 4.2 ± 0.18 b 36.1 ± 0.09 c DF 0.2 ± 0.06 a 2.7 ± 0.07 a 0.3 ± 0.02 c 29.1 ± 0.32 c 0.2 ± 0.01 b 4.0 ± 0.13 cde 0.2 ± 0.01 c 0.2 ± 0.01 ab 7.6 ± 0.28 c 31.8 ± 1.04 ad l0/0 12.9 ± 0.13 cd 8.9 ± 0.08cd 0.1 ± 0.01 d 17.4 ± 0.27 bc 0.1 ± 0.01 c 2.6 ± 0.01 f 0.1 ± 0.01 d tr 3.1 ± 0.11 d 40.0 ± 0.22 c 20/0 13.3 ± 0.31 df 9.1 ± 0.08 d 0.1 ± 0.01 d 18.5 ± 0.37 cd 0.1 ± 0.01 cdef 3.6 ± 0.07 g 0.2 ± 0.01 ce 0.1 ± 0.01 defg 2.4 ± 0.11 defg 29.7 ± 0.40 d 30/0 12.6 ± 0.31 cd 8.4 ± 0.21 c 0.1 ± 0.01 d 19.8 ± 0.66 d 0.1 ± 0.01 cdc 4.2 ± 0.06 e 0.2 ± 0.01 ef 0.1 ± 0.02 def 2.2 ± 0.21 defg 24.8 ± 0.51 fghi 40/0 4.0 ± 0.03 c 3.7 ± 0.02 f 0.1 ± 0.01 d 16.9 ± 0.28 bcf 0.1 ± 0.01 defgh 3.9 ± 0.06 cdeg 0.2 ± 0.01 b 0.2 ± 0.01 ab 1.5 ± 0.08 g 33.3 ± 0.16 ab 10/10 13.8 ± 0.07 f 9.2 ± 0.08 d 0.1 ± 0.01 d 16.5 ± 0.09 bcfg 0.1 ± 0.01 cd 2.9 ± 0.01 h 0.1 ± 0.01 g tr 2.5 ± 0.06 def
34.5±0.17 bc 20/10 12.5 ± 0.15 c 8.4 ± 0.12 c 0.1 ± 0.01 d 18.5 ± 0.40 cd 0.1 ± 0.01 defg 3.9 ± 0.03 cdeg 0.1 ± 0.01 d 0.1 ± 0.01 aefg 2.6 ± 0.15 def 25.8 ± 0.43 hi 30/10 9.8 ± 0.07 g 6.9 ± 0.08 g 0.1 ± 0.01 d 17.0 ± 0.42 bcf 0.1 ± 0.01 defgh 4.1 ± 0.04 cde 0.2 ± 0.01 ef 0.1 ± 0.01 abg 1.7 ± 0.10 fg 22.5 ± 0.40 f 40/10 6.2 ± 0.05 b 5.0 ± 0.03 h 0.1 ± 0.01 d 17.3 ± 0.19 bc 0.1 ± 0.01 defgh 4.2 ± 0.07 c 0.2 ± 0.01 ce 0.2 ± 0.01 ab 1.7 ± 0.08 fg 23.0 ± 0.30 fg 10/20 12.8 ± 0.40 cd 8.6 ± 0.22 ce 0.1 ± 0.01 d 17.0 ± 0.26 bcf 0.1 ± 0.01 def 3.1 ± 0.09 h 0.1 ± 0.01 g 0.1 ± 0.02 dh 2.8 ± 0.18 de 26.9 ± 0.42 i 20/20 9.1 ± 0.07 b 6.6 ± 0.05 f 0.1 ± 0.01 d 17.6 ± 0.39 bcd 0.1 ± 0.01 bdefg 3.8 ± 0.02 cdg 0.1 ± 0.01 d 0.1 ± 0.01 defg 2.5 ± 0.12 def 25.3 ± 0.27 ghi 30/20 6.1 ± 0.06 b 4.8 ± 0.03 h 0.1 ± 0.01 d 16.0 ± 0.45 bcfg 0.1 ± 0.01 bcfgh 4.0 ± 0.03 cdeg 0.2 ± 0.01 f 0.1 ± 0.01 abfg 1.7 ± 0.13 fg 24.3 ± 0.43 fgh 40/20 2.5 ± 0.03 f 2.7 ± 0.02 g O.1 ± 0.01 d 15.2 ± 0.55 bfgh 0.2 ± 0.01 bfgh 4.1 ± 0.04 de 0.2 ± 0.01 ce 0.1 ± 0.02 abg 1.5 ± 0.12 g 23.9 ± 0.48 fgh 10/30 10.1 ± 0.08 g 7.3 ± 0.09 g 0.1 ± 0.01 d 16.3 ± 0.36 bcfg 0.1 ± 0.01 bdefg 3.1 ± 0.05 h 0.1 ± 0.01 g 0.1 ± 0.01 deh 2.8 ± 0.15 de 25.8 ± 0.47 hi 20/30 3.7 ± 0.06 c 3.5 ± 0.01 f 0.1 ± 0.01 d
14.6 ± 0.27 fgh 0.2 ± 0.01 bgh 3.7 ± 0.06 cdg 0.2 ± 0.01 ce 0.1 ± 0.01 abfg 1.9 ± 0.12 efg 29.6 ± 0.18 d
30/30 0.1 ± 0.01 a 0.9 ± 0.02 j 0.1±0.01 d 14.1 ± 0.32 gh 0.2± 0.01 bh 3.7 ± 0.02 cg 0.2 ± 0.01 a 0.1 ± 0.01 abg 1.7 ± 0.10 fg 31.0 ± 0.14 ad 40/30 0.4 ± 0.05 a 1.0 ± 0.03 j 0.1±0.01 d 13.4 ± 0.25 h 0.2 ± 0.01 b 3.9 ± 0.01 cdeg 0.2 ± 0.01 ce 0.2 ± 0.01 b 1.4 ± 0.04 g 23.0 ± 0.18 fg
FRDC Project No. 96/392, Page 51
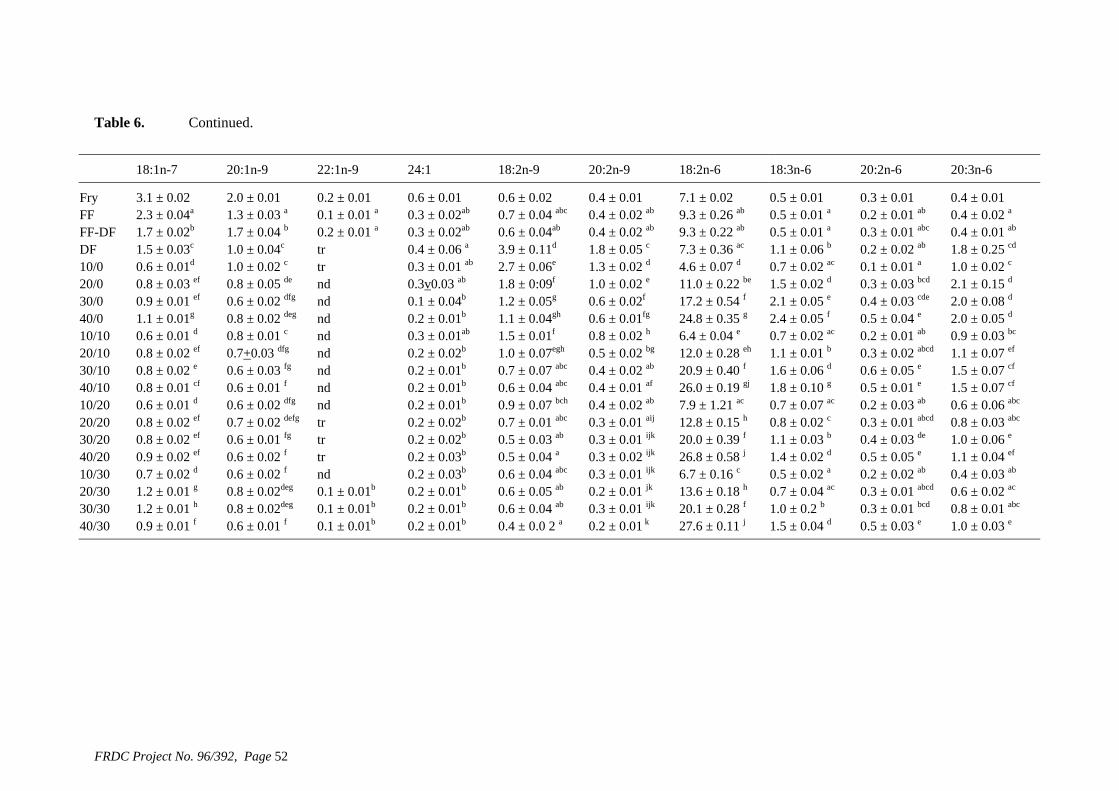
Table 6. Continued.
18:1n-7 20:1n-9 22:1n-9 24:1 18:2n-9 20:2n-9 18:2n-6 18:3n-6 20:2n-6 20:3n-6
Fry 3.1 ± 0.02 2.0 ± 0.01 0.2 ± 0.01 0.6 ± 0.01 0.6 ± 0.02 0.4 ± 0.01 7.1 ± 0.02 0.5 ± 0.01 0.3 ± 0.01 0.4 ± 0.01 FF 2.3 ± 0.04a 1.3 ± 0.03 a 0.1 ± 0.01 a 0.3 ± 0.02ab 0.7 ± 0.04 abc 0.4 ± 0.02 ab 9.3 ± 0.26 ab 0.5 ± 0.01 a 0.2 ± 0.01 ab 0.4 ± 0.02 a FF-DF 1.7 ± 0.02b 1.7 ± 0.04 b 0.2 ± 0.01 a 0.3 ± 0.02ab 0.6 ± 0.04ab 0.4 ± 0.02 ab 9.3 ± 0.22 ab 0.5 ± 0.01 a 0.3 ± 0.01 abc 0.4 ± 0.01 ab DF 1.5 ± 0.03c 1.0 ± 0.04c tr 0.4 ± 0.06 a 3.9 ± 0.11d 1.8 ± 0.05 c 7.3 ± 0.36 ac 1.1 ± 0.06 b 0.2 ± 0.02 ab 1.8 ± 0.25 cd 10/0 0.6 ± 0.01d 1.0 ± 0.02 c tr 0.3 ± 0.01 ab 2.7 ± 0.06e 1.3 ± 0.02 d 4.6 ± 0.07 d 0.7 ± 0.02 ac 0.1 ± 0.01 a 1.0 ± 0.02 c 20/0 0.8 ± 0.03 ef 0.8 ± 0.05 de nd 0.3v0.03 ab 1.8 ± 0:09f 1.0 ± 0.02 e 11.0 ± 0.22 be 1.5 ± 0.02 d 0.3 ± 0.03 bcd 2.1 ± 0.15 d 30/0 0.9 ± 0.01 ef 0.6 ± 0.02 dfg nd 0.1 ± 0.04b 1.2 ± 0.05g 0.6 ± 0.02f 17.2 ± 0.54 f 2.1 ± 0.05 e 0.4 ± 0.03 cde 2.0 ± 0.08 d 40/0 1.1 ± 0.01g 0.8 ± 0.02 deg nd 0.2 ± 0.01b 1.1 ± 0.04gh 0.6 ± 0.01fg 24.8 ± 0.35 g 2.4 ± 0.05 f 0.5 ± 0.04 e 2.0 ± 0.05 d 10/10 0.6 ± 0.01 d 0.8 ± 0.01 c nd 0.3 ± 0.01ab 1.5 ± 0.01f 0.8 ± 0.02 h 6.4 ± 0.04 e 0.7 ± 0.02 ac 0.2 ± 0.01 ab 0.9 ± 0.03 bc 20/10 0.8 ± 0.02 ef 0.7+0.03 dfg nd 0.2 ± 0.02b 1.0 ± 0.07egh 0.5 ± 0.02 bg 12.0 ± 0.28 eh 1.1 ± 0.01 b 0.3 ± 0.02 abcd 1.1 ± 0.07 ef 30/10 0.8 ± 0.02 e 0.6 ± 0.03 fg nd 0.2 ± 0.01b 0.7 ± 0.07 abc 0.4 ± 0.02 ab 20.9 ± 0.40 f 1.6 ± 0.06 d 0.6 ± 0.05 e 1.5 ± 0.07 cf 40/10 0.8 ± 0.01 cf 0.6 ± 0.01 f nd 0.2 ± 0.01b 0.6 ± 0.04 abc 0.4 ± 0.01 af 26.0 ± 0.19 gj 1.8 ± 0.10 g 0.5 ± 0.01 e 1.5 ± 0.07 cf 10/20 0.6 ± 0.01 d 0.6 ± 0.02 dfg nd 0.2 ± 0.01b 0.9 ± 0.07 bch 0.4 ± 0.02 ab 7.9 ± 1.21 ac 0.7 ± 0.07 ac 0.2 ± 0.03 ab 0.6 ± 0.06 abc 20/20 0.8 ± 0.02 ef 0.7 ± 0.02 defg tr 0.2 ± 0.02b 0.7 ± 0.01 abc 0.3 ± 0.01 aij 12.8 ± 0.15 h 0.8 ± 0.02 c 0.3 ± 0.01 abcd 0.8 ± 0.03 abc 30/20 0.8 ± 0.02 ef 0.6 ± 0.01 fg tr 0.2 ± 0.02b 0.5 ± 0.03 ab 0.3 ± 0.01 ijk 20.0 ± 0.39 f 1.1 ± 0.03 b 0.4 ± 0.03 de 1.0 ± 0.06 e 40/20 0.9 ± 0.02 ef 0.6 ± 0.02 f tr 0.2 ± 0.03b 0.5 ± 0.04 a 0.3 ± 0.02 ijk 26.8 ± 0.58 j 1.4 ± 0.02 d 0.5 ± 0.05 e 1.1 ± 0.04 ef 10/30 0.7 ± 0.02 d 0.6 ± 0.02 f nd 0.2 ± 0.03b 0.6 ± 0.04 abc 0.3 ± 0.01 ijk 6.7 ± 0.16 c 0.5 ± 0.02 a 0.2 ± 0.02 ab 0.4 ± 0.03 ab 20/30 1.2 ± 0.01 g 0.8 ± 0.02deg 0.1 ± 0.01b 0.2 ± 0.01b 0.6 ± 0.05 ab 0.2 ± 0.01 jk 13.6 ± 0.18 h 0.7 ± 0.04 ac 0.3 ± 0.01 abcd 0.6 ± 0.02 ac 30/30 1.2 ± 0.01 h 0.8 ± 0.02deg 0.1 ± 0.01b 0.2 ± 0.01b 0.6 ± 0.04 ab 0.3 ± 0.01 ijk 20.1 ± 0.28 f 1.0 ± 0.2 b 0.3 ± 0.01 bcd 0.8 ± 0.01 abc 40/30 0.9 ± 0.01 f 0.6 ± 0.01 f 0.1 ± 0.01b 0.2 ± 0.01b 0.4 ± 0.0 2 a 0.2 ± 0.01 k 27.6 ± 0.11 j 1.5 ± 0.04 d 0.5 ± 0.03 e 1.0 ± 0.03 e
FRDC Project No. 96/392, Page 52
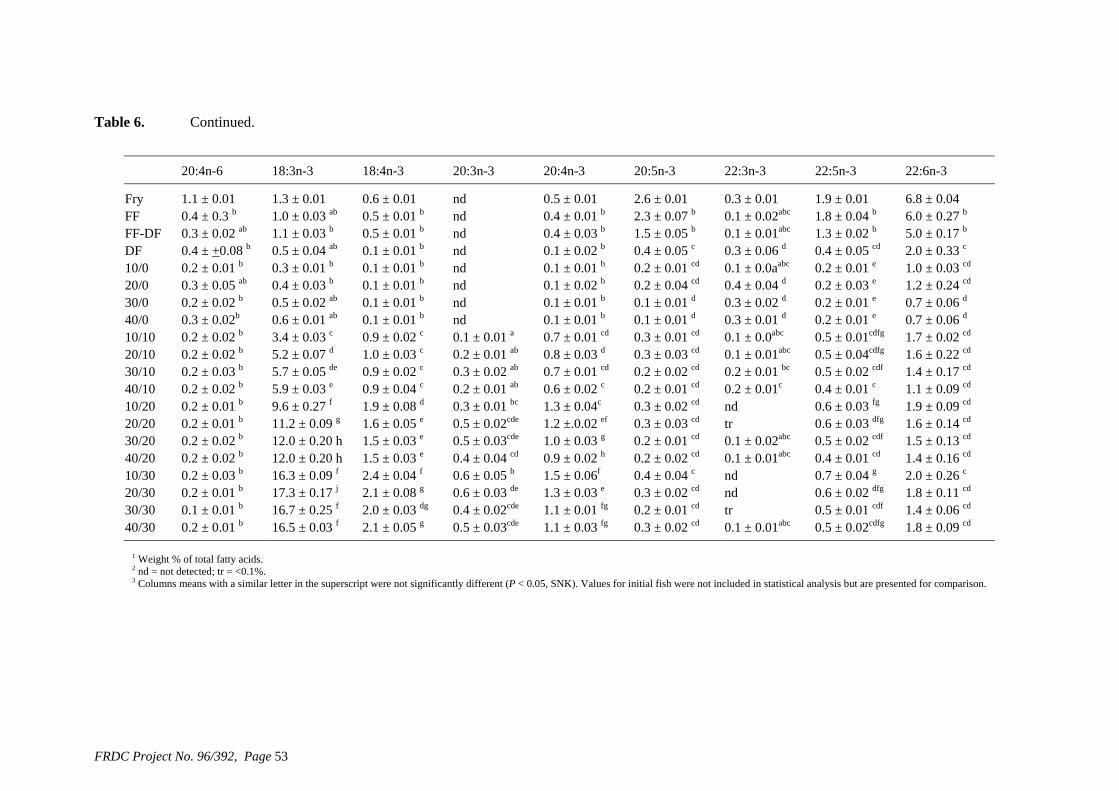
Table 6. Continued.
20:4n-6 18:3n-3 18:4n-3 20:3n-3 20:4n-3 20:5n-3 22:3n-3 22:5n-3 22:6n-3
Fry 1.1 ± 0.01 1.3 ± 0.01 0.6 ± 0.01 nd 0.5 ± 0.01 2.6 ± 0.01 0.3 ± 0.01 1.9 ± 0.01 6.8 ± 0.04 FF 0.4 ± 0.3 b 1.0 ± 0.03 ab 0.5 ± 0.01 b nd 0.4 ± 0.01 b 2.3 ± 0.07 b 0.1 ± 0.02abc 1.8 ± 0.04 b 6.0 ± 0.27 b FF-DF
0.3 ± 0.02 ab 1.1 ± 0.03 b 0.5 ± 0.01 b nd 0.4 ± 0.03 b 1.5 ± 0.05 b 0.1 ± 0.01abc 1.3 ± 0.02 b 5.0 ± 0.17 b
DF 0.4 ± +0.08 b 0.5 ± 0.04 ab 0.1 ± 0.01 b nd 0.1 ± 0.02 b 0.4 ± 0.05 c 0.3 ± 0.06 d 0.4 ± 0.05 cd 2.0 ± 0.33 c 10/0 0.2 ± 0.01 b 0.3 ± 0.01 b 0.1 ± 0.01 b nd 0.1 ± 0.01 b 0.2 ± 0.01 cd 0.1 ± 0.0aabc 0.2 ± 0.01 e 1.0 ± 0.03 cd 20/0 0.3 ± 0.05 ab 0.4 ± 0.03 b 0.1 ± 0.01 b nd 0.1 ± 0.02 b 0.2 ± 0.04 cd 0.4 ± 0.04 d 0.2 ± 0.03 e 1.2 ± 0.24 cd 30/0 0.2 ± 0.02 b 0.5 ± 0.02 ab 0.1 ± 0.01 b nd 0.1 ± 0.01 b 0.1 ± 0.01 d 0.3 ± 0.02 d 0.2 ± 0.01 e 0.7 ± 0.06 d 40/0 0.3 ± 0.02b 0.6 ± 0.01 ab 0.1 ± 0.01 b nd 0.1 ± 0.01 b 0.1 ± 0.01 d 0.3 ± 0.01 d 0.2 ± 0.01 e 0.7 ± 0.06 d 10/10 0.2 ± 0.02 b 3.4 ± 0.03 c 0.9 ± 0.02 c 0.1 ± 0.01 a 0.7 ± 0.01 cd 0.3 ± 0.01 cd 0.1 ± 0.0abc 0.5 ± 0.01cdfg 1.7 ± 0.02 cd 20/10 0.2 ± 0.02 b 5.2 ± 0.07 d 1.0 ± 0.03 c 0.2 ± 0.01 ab 0.8 ± 0.03 d 0.3 ± 0.03 cd 0.1 ± 0.01abc 0.5 ± 0.04cdfg 1.6 ± 0.22 cd 30/10 0.2 ± 0.03 b 5.7 ± 0.05 de 0.9 ± 0.02 c 0.3 ± 0.02 ab 0.7 ± 0.01 cd 0.2 ± 0.02 cd 0.2 ± 0.01 bc 0.5 ± 0.02 cdf 1.4 ± 0.17 cd 40/10 0.2 ± 0.02 b 5.9 ± 0.03 e 0.9 ± 0.04 c 0.2 ± 0.01 ab 0.6 ± 0.02 c 0.2 ± 0.01 cd 0.2 ± 0.01c 0.4 ± 0.01 c 1.1 ± 0.09 cd 10/20 0.2 ± 0.01 b 9.6 ± 0.27 f 1.9 ± 0.08 d 0.3 ± 0.01 bc 1.3 ± 0.04c 0.3 ± 0.02 cd nd 0.6 ± 0.03 fg 1.9 ± 0.09 cd 20/20 0.2 ± 0.01 b 11.2 ± 0.09 g 1.6 ± 0.05 e 0.5 ± 0.02cde 1.2 ±.0.02 ef 0.3 ± 0.03 cd tr 0.6 ± 0.03 dfg 1.6 ± 0.14 cd 30/20 0.2 ± 0.02 b 12.0 ± 0.20 h 1.5 ± 0.03 e 0.5 ± 0.03cde 1.0 ± 0.03 g 0.2 ± 0.01 cd 0.1 ± 0.02abc 0.5 ± 0.02 cdf 1.5 ± 0.13 cd 40/20 0.2 ± 0.02 b 12.0 ± 0.20 h 1.5 ± 0.03 e 0.4 ± 0.04 cd 0.9 ± 0.02 h 0.2 ± 0.02 cd 0.1 ± 0.01abc 0.4 ± 0.01 cd 1.4 ± 0.16 cd 10/30 0.2 ± 0.03 b 16.3 ± 0.09 f 2.4 ± 0.04 f 0.6 ± 0.05 b 1.5 ± 0.06f 0.4 ± 0.04 c nd 0.7 ± 0.04 g 2.0 ± 0.26 c 20/30 0.2 ± 0.01 b 17.3 ± 0.17 j 2.1 ± 0.08 g 0.6 ± 0.03 de 1.3 ± 0.03 e 0.3 ± 0.02 cd nd 0.6 ± 0.02 dfg 1.8 ± 0.11 cd 30/30 0.1 ± 0.01 b 16.7 ± 0.25 f 2.0 ± 0.03 dg 0.4 ± 0.02cde 1.1 ± 0.01 fg 0.2 ± 0.01 cd tr 0.5 ± 0.01 cdf 1.4 ± 0.06 cd 40/30 0.2 ± 0.01 b 16.5 ± 0.03 f 2.1 ± 0.05 g 0.5 ± 0.03cde 1.1 ± 0.03 fg 0.3 ± 0.02 cd 0.1 ± 0.01abc 0.5 ± 0.02cdfg 1.8 ± 0.09 cd
1 Weight % of total fatty acids. 2 nd = not detected; tr = <0.1%. 3 Columns means with a similar letter in the superscript were not significantly different (P < 0.05, SNK). Values for initial fish were not included in statistical analysis but are presented for comparison.
FRDC Project No. 96/392, Page 53
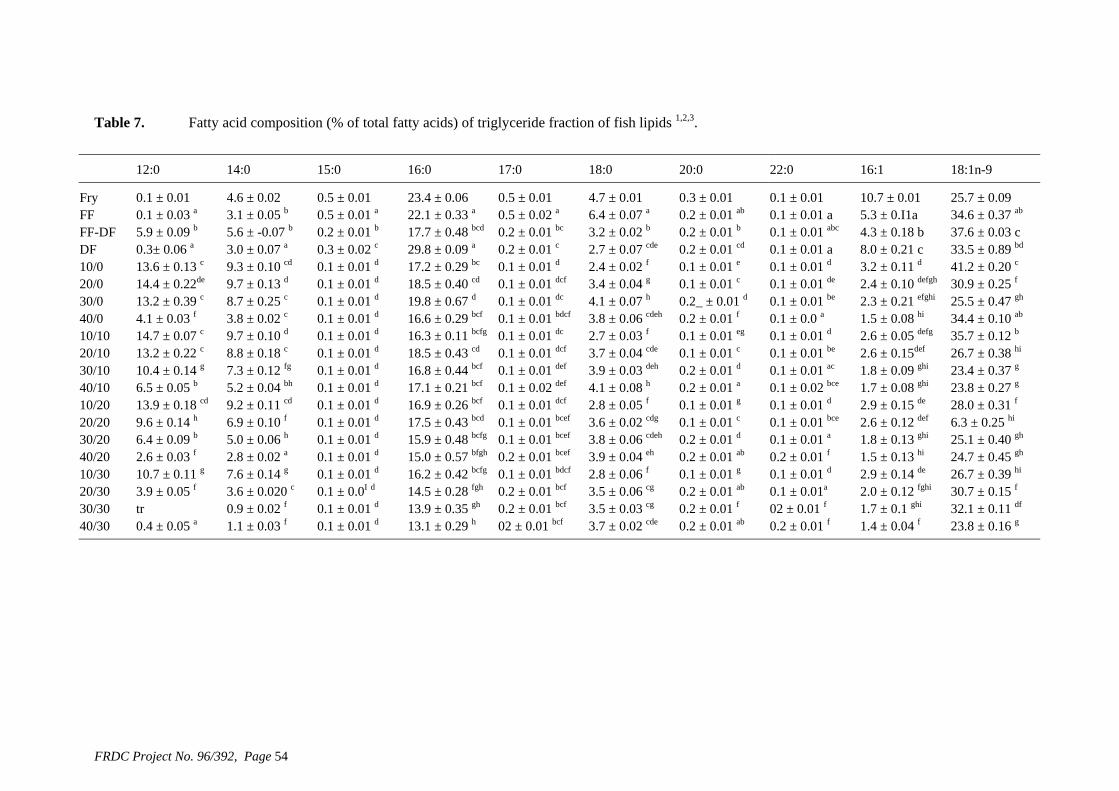
Table 7. Fatty acid composition (% of total fatty acids) of triglyceride fraction of fish lipids 1,2,3.
12:0 14:0 15:0 16:0 17:0 18:0 20:0 22:0 16:1 18:1n-9
Fry 0.1 ± 0.01 4.6 ± 0.02 0.5 ± 0.01 23.4 ± 0.06 0.5 ± 0.01 4.7 ± 0.01 0.3 ± 0.01 0.1 ± 0.01 10.7 ± 0.01 25.7 ± 0.09 FF 0.1 ± 0.03 a 3.1 ± 0.05 b 0.5 ± 0.01 a 22.1 ± 0.33 a 0.5 ± 0.02 a 6.4 ± 0.07 a 0.2 ± 0.01 ab 0.1 ± 0.01 a 5.3 ± 0.I1a 34.6 ± 0.37 ab FF-DF
5.9 ± 0.09 b
5.6 ± -0.07 b 0.2 ± 0.01 b 17.7 ± 0.48 bcd 0.2 ± 0.01 bc 3.2 ± 0.02 b 0.2 ± 0.01 b 0.1 ± 0.01 abc 4.3 ± 0.18 b 37.6 ± 0.03 c
DF 0.3± 0.06 a 3.0 ± 0.07 a 0.3 ± 0.02 c 29.8 ± 0.09 a 0.2 ± 0.01 c 2.7 ± 0.07 cde 0.2 ± 0.01 cd 0.1 ± 0.01 a 8.0 ± 0.21 c 33.5 ± 0.89 bd 10/0 13.6 ± 0.13 c 9.3 ± 0.10 cd 0.1 ± 0.01 d 17.2 ± 0.29 bc 0.1 ± 0.01 d 2.4 ± 0.02 f 0.1 ± 0.01 e 0.1 ± 0.01 d 3.2 ± 0.11 d 41.2 ± 0.20 c 20/0 14.4 ± 0.22de 9.7 ± 0.13 d 0.1 ± 0.01 d 18.5 ± 0.40 cd 0.1 ± 0.01 dcf 3.4 ± 0.04 g 0.1 ± 0.01 c 0.1 ± 0.01 de 2.4 ± 0.10 defgh 30.9 ± 0.25 f 30/0 13.2 ± 0.39 c 8.7 ± 0.25 c 0.1 ± 0.01 d 19.8 ± 0.67 d 0.1 ± 0.01 dc 4.1 ± 0.07 h 0.2_ ± 0.01 d 0.1 ± 0.01 be 2.3 ± 0.21 efghi 25.5 ± 0.47 gh 40/0 4.1 ± 0.03 f 3.8 ± 0.02 c 0.1 ± 0.01 d 16.6 ± 0.29 bcf 0.1 ± 0.01 bdcf 3.8 ± 0.06 cdeh 0.2 ± 0.01 f 0.1 ± 0.0 a 1.5 ± 0.08 hi 34.4 ± 0.10 ab 10/10 14.7 ± 0.07 c 9.7 ± 0.10 d 0.1 ± 0.01 d 16.3 ± 0.11 bcfg 0.1 ± 0.01 dc 2.7 ± 0.03 f 0.1 ± 0.01 eg 0.1 ± 0.01 d 2.6 ± 0.05 defg 35.7 ± 0.12 b 20/10 13.2 ± 0.22 c 8.8 ± 0.18 c 0.1 ± 0.01 d 18.5 ± 0.43 cd 0.1 ± 0.01 dcf 3.7 ± 0.04 cde 0.1 ± 0.01 c 0.1 ± 0.01 be 2.6 ± 0.15def 26.7 ± 0.38 hi 30/10 10.4 ± 0.14 g 7.3 ± 0.12 fg 0.1 ± 0.01 d 16.8 ± 0.44 bcf 0.1 ± 0.01 def 3.9 ± 0.03 deh 0.2 ± 0.01 d 0.1 ± 0.01 ac 1.8 ± 0.09 ghi 23.4 ± 0.37 g 40/10 6.5 ± 0.05 b 5.2 ± 0.04 bh 0.1 ± 0.01 d 17.1 ± 0.21 bcf 0.1 ± 0.02 def 4.1 ± 0.08 h 0.2 ± 0.01 a 0.1 ± 0.02 bce 1.7 ± 0.08 ghi 23.8 ± 0.27 g 10/20 13.9 ± 0.18 cd 9.2 ± 0.11 cd 0.1 ± 0.01 d 16.9 ± 0.26 bcf 0.1 ± 0.01 dcf 2.8 ± 0.05 f 0.1 ± 0.01 g 0.1 ± 0.01 d 2.9 ± 0.15 de 28.0 ± 0.31 f 20/20 9.6 ± 0.14 h 6.9 ± 0.10 f 0.1 ± 0.01 d 17.5 ± 0.43 bcd 0.1 ± 0.01 bcef 3.6 ± 0.02 cdg 0.1 ± 0.01 c 0.1 ± 0.01 bce 2.6 ± 0.12 def 6.3 ± 0.25 hi 30/20 6.4 ± 0.09 b 5.0 ± 0.06 h 0.1 ± 0.01 d 15.9 ± 0.48 bcfg 0.1 ± 0.01 bcef 3.8 ± 0.06 cdeh 0.2 ± 0.01 d 0.1 ± 0.01 a 1.8 ± 0.13 ghi 25.1 ± 0.40 gh 40/20 2.6 ± 0.03 f 2.8 ± 0.02 a 0.1 ± 0.01 d 15.0 ± 0.57 bfgh 0.2 ± 0.01 bcef 3.9 ± 0.04 eh 0.2 ± 0.01 ab 0.2 ± 0.01 f 1.5 ± 0.13 hi 24.7 ± 0.45 gh 10/30 10.7 ± 0.11 g 7.6 ± 0.14 g 0.1 ± 0.01 d 16.2 ± 0.42 bcfg 0.1 ± 0.01 bdcf 2.8 ± 0.06 f 0.1 ± 0.01 g 0.1 ± 0.01 d 2.9 ± 0.14 de 26.7 ± 0.39 hi 20/30 3.9 ± 0.05 f 3.6 ± 0.020 c 0.1 ± 0.0I d 14.5 ± 0.28 fgh 0.2 ± 0.01 bcf 3.5 ± 0.06 cg 0.2 ± 0.01 ab 0.1 ± 0.01a 2.0 ± 0.12 fghi 30.7 ± 0.15 f 30/30 tr 0.9 ± 0.02 f 0.1 ± 0.01 d 13.9 ± 0.35 gh 0.2 ± 0.01 bcf 3.5 ± 0.03 cg 0.2 ± 0.01 f 02 ± 0.01 f 1.7 ± 0.1 ghi 32.1 ± 0.11 df 40/30 0.4 ± 0.05 a 1.1 ± 0.03 f 0.1 ± 0.01 d 13.1 ± 0.29 h 02 ± 0.01 bcf 3.7 ± 0.02 cde 0.2 ± 0.01 ab 0.2 ± 0.01 f 1.4 ± 0.04 f 23.8 ± 0.16 g
FRDC Project No. 96/392, Page 54
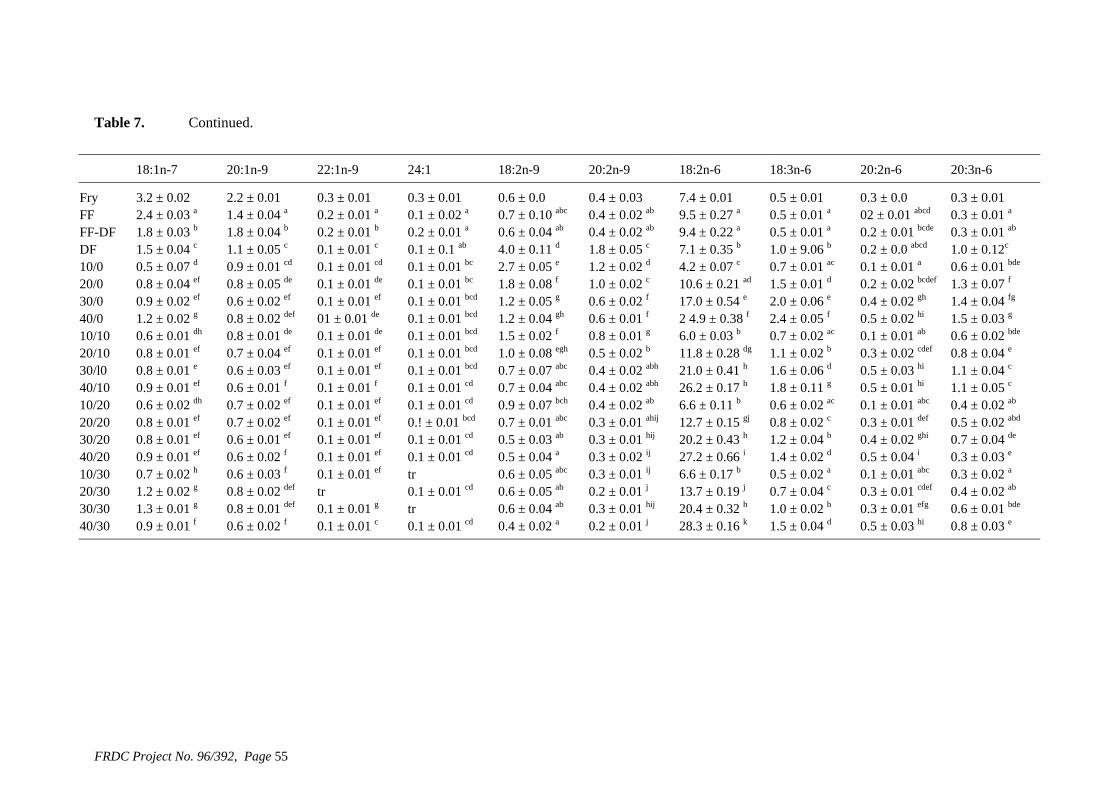
Table 7. Continued.
18:1n-7 20:1n-9 22:1n-9 24:1 18:2n-9 20:2n-9 18:2n-6 18:3n-6 20:2n-6 20:3n-6
Fry 3.2 ± 0.02 2.2 ± 0.01 0.3 ± 0.01 0.3 ± 0.01 0.6 ± 0.0 0.4 ± 0.03 7.4 ± 0.01 0.5 ± 0.01 0.3 ± 0.0 0.3 ± 0.01 FF 2.4 ± 0.03 a 1.4 ± 0.04 a 0.2 ± 0.01 a 0.1 ± 0.02 a 0.7 ± 0.10 abc 0.4 ± 0.02 ab 9.5 ± 0.27 a 0.5 ± 0.01 a 02 ± 0.01 abcd 0.3 ± 0.01 a FF-DF 1.8 ± 0.03 b 1.8 ± 0.04 b 0.2 ± 0.01 b 0.2 ± 0.01 a 0.6 ± 0.04 ab 0.4 ± 0.02 ab 9.4 ± 0.22 a 0.5 ± 0.01 a 0.2 ± 0.01 bcde 0.3 ± 0.01 ab DF 1.5 ± 0.04 c 1.1 ± 0.05 c 0.1 ± 0.01 c 0.1 ± 0.1 ab 4.0 ± 0.11 d 1.8 ± 0.05 c 7.1 ± 0.35 b 1.0 ± 9.06 b 0.2 ± 0.0 abcd 1.0 ± 0.12c 10/0 0.5 ± 0.07 d 0.9 ± 0.01 cd 0.1 ± 0.01 cd 0.1 ± 0.01 bc 2.7 ± 0.05 e 1.2 ± 0.02 d 4.2 ± 0.07 c 0.7 ± 0.01 ac 0.1 ± 0.01 a 0.6 ± 0.01 bde 20/0 0.8 ± 0.04 ef 0.8 ± 0.05 de 0.1 ± 0.01 de 0.1 ± 0.01 bc 1.8 ± 0.08 f 1.0 ± 0.02 c 10.6 ± 0.21 ad 1.5 ± 0.01 d 0.2 ± 0.02 bcdef 1.3 ± 0.07 f 30/0 0.9 ± 0.02 ef 0.6 ± 0.02 ef 0.1 ± 0.01 ef 0.1 ± 0.01 bcd 1.2 ± 0.05 g 0.6 ± 0.02 f 17.0 ± 0.54 e 2.0 ± 0.06 e 0.4 ± 0.02 gh 1.4 ± 0.04 fg 40/0 1.2 ± 0.02 g 0.8 ± 0.02 def 01 ± 0.01 de 0.1 ± 0.01 bcd 1.2 ± 0.04 gh 0.6 ± 0.01 f 2 4.9 ± 0.38 f 2.4 ± 0.05 f 0.5 ± 0.02 hi 1.5 ± 0.03 g 10/10 0.6 ± 0.01 dh 0.8 ± 0.01 de 0.1 ± 0.01 de 0.1 ± 0.01 bcd 1.5 ± 0.02 f 0.8 ± 0.01 g 6.0 ± 0.03 b 0.7 ± 0.02 ac 0.1 ± 0.01 ab 0.6 ± 0.02 bde 20/10 0.8 ± 0.01 ef 0.7 ± 0.04 ef 0.1 ± 0.01 ef 0.1 ± 0.01 bcd 1.0 ± 0.08 egh 0.5 ± 0.02 b 11.8 ± 0.28 dg 1.1 ± 0.02 b 0.3 ± 0.02 cdef 0.8 ± 0.04 e 30/l0 0.8 ± 0.01 e 0.6 ± 0.03 ef 0.1 ± 0.01 ef 0.1 ± 0.01 bcd 0.7 ± 0.07 abc 0.4 ± 0.02 abh 21.0 ± 0.41 h 1.6 ± 0.06 d 0.5 ± 0.03 hi 1.1 ± 0.04 c 40/10 0.9 ± 0.01 ef 0.6 ± 0.01 f 0.1 ± 0.01 f 0.1 ± 0.01 cd 0.7 ± 0.04 abc 0.4 ± 0.02 abh 26.2 ± 0.17 h 1.8 ± 0.11 g 0.5 ± 0.01 hi 1.1 ± 0.05 c 10/20 0.6 ± 0.02 dh 0.7 ± 0.02 ef 0.1 ± 0.01 ef 0.1 ± 0.01 cd 0.9 ± 0.07 bch 0.4 ± 0.02 ab 6.6 ± 0.11 b 0.6 ± 0.02 ac 0.1 ± 0.01 abc 0.4 ± 0.02 ab 20/20 0.8 ± 0.01 ef 0.7 ± 0.02 ef 0.1 ± 0.01 ef 0.! ± 0.01 bcd 0.7 ± 0.01 abc 0.3 ± 0.01 ahij 12.7 ± 0.15 gj 0.8 ± 0.02 c 0.3 ± 0.01 def 0.5 ± 0.02 abd 30/20 0.8 ± 0.01 ef 0.6 ± 0.01 ef 0.1 ± 0.01 ef 0.1 ± 0.01 cd 0.5 ± 0.03 ab 0.3 ± 0.01 hij 20.2 ± 0.43 h 1.2 ± 0.04 b 0.4 ± 0.02 ghi 0.7 ± 0.04 de 40/20 0.9 ± 0.01 ef 0.6 ± 0.02 f 0.1 ± 0.01 ef 0.1 ± 0.01 cd 0.5 ± 0.04 a 0.3 ± 0.02 ij 27.2 ± 0.66 i 1.4 ± 0.02 d 0.5 ± 0.04 i 0.3 ± 0.03 e 10/30 0.7 ± 0.02 h 0.6 ± 0.03 f 0.1 ± 0.01 ef tr 0.6 ± 0.05 abc 0.3 ± 0.01 ij 6.6 ± 0.17 b 0.5 ± 0.02 a 0.1 ± 0.01 abc 0.3 ± 0.02 a 20/30 1.2 ± 0.02 g 0.8 ± 0.02 def tr 0.1 ± 0.01 cd 0.6 ± 0.05 ab 0.2 ± 0.01 j 13.7 ± 0.19 j 0.7 ± 0.04 c 0.3 ± 0.01 cdef 0.4 ± 0.02 ab 30/30 1.3 ± 0.01 g 0.8 ± 0.01 def 0.1 ± 0.01 g tr 0.6 ± 0.04 ab 0.3 ± 0.01 hij 20.4 ± 0.32 h 1.0 ± 0.02 b 0.3 ± 0.01 efg 0.6 ± 0.01 bde 40/30 0.9 ± 0.01 f 0.6 ± 0.02 f 0.1 ± 0.01 c 0.1 ± 0.01 cd 0.4 ± 0.02 a 0.2 ± 0.01 j 28.3 ± 0.16 k 1.5 ± 0.04 d 0.5 ± 0.03 hi 0.8 ± 0.03 e
FRDC Project No. 96/392, Page 55
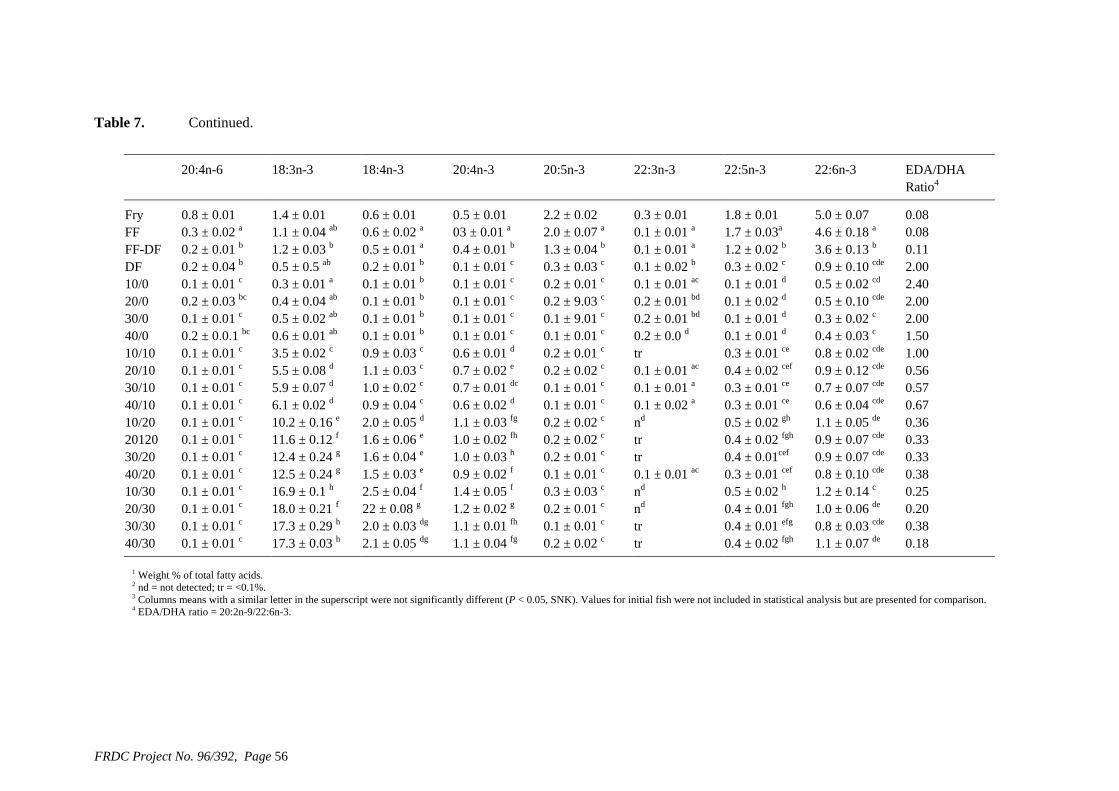
Table 7. Continued.
20:4n-6 18:3n-3 18:4n-3 20:4n-3 20:5n-3 22:3n-3 22:5n-3 22:6n-3 EDA/DHARatio4
Fry 0.8 ± 0.01 1.4 ± 0.01 0.6 ± 0.01 0.5 ± 0.01 2.2 ± 0.02 0.3 ± 0.01 1.8 ± 0.01 5.0 ± 0.07 0.08 FF 0.3 ± 0.02 a 1.1 ± 0.04 ab 0.6 ± 0.02 a 03 ± 0.01 a 2.0 ± 0.07 a 0.1 ± 0.01 a 1.7 ± 0.03a 4.6 ± 0.18 a
n
0.08FF-DF 0.2 ± 0.01 b 1.2 ± 0.03 b 0.5 ± 0.01 a 0.4 ± 0.01 b 1.3 ± 0.04 b 0.1 ± 0.01 a 1.2 ± 0.02 b 3.6 ± 0.13 b 0.11DF 0.2 ± 0.04 b 0.5 ± 0.5 ab 0.2 ± 0.01 b 0.1 ± 0.01 c 0.3 ± 0.03 c 0.1 ± 0.02 b 0.3 ± 0.02 c 0.9 ± 0.10 cde 2.0010/0 0.1 ± 0.01 c 0.3 ± 0.01 a 0.1 ± 0.01 b 0.1 ± 0.01 c 0.2 ± 0.01 c 0.1 ± 0.01 ac 0.1 ± 0.01 d 0.5 ± 0.02 cd 2.4020/0 0.2 ± 0.03 bc 0.4 ± 0.04 ab 0.1 ± 0.01 b 0.1 ± 0.01 c 0.2 ± 9.03 c 0.2 ± 0.01 bd 0.1 ± 0.02 d 0.5 ± 0.10 cde 2.0030/0 0.1 ± 0.01 c 0.5 ± 0.02 ab 0.1 ± 0.01 b 0.1 ± 0.01 c 0.1 ± 9.01 c 0.2 ± 0.01 bd 0.1 ± 0.01 d 0.3 ± 0.02 c 2.0040/0 0.2 ± 0.0.1 bc 0.6 ± 0.01 ab 0.1 ± 0.01 b 0.1 ± 0.01 c 0.1 ± 0.01 c 0.2 ± 0.0 d 0.1 ± 0.01 d 0.4 ± 0.03 c 1.5010/10 0.1 ± 0.01 c 3.5 ± 0.02 c 0.9 ± 0.03 c 0.6 ± 0.01 d 0.2 ± 0.01 c tr 0.3 ± 0.01 ce 0.8 ± 0.02 cde 1.0020/10 0.1 ± 0.01 c 5.5 ± 0.08 d 1.1 ± 0.03 c 0.7 ± 0.02 e 0.2 ± 0.02 c 0.1 ± 0.01 ac 0.4 ± 0.02 cef 0.9 ± 0.12 cde 0.5630/10 0.1 ± 0.01 c 5.9 ± 0.07 d 1.0 ± 0.02 c 0.7 ± 0.01 dc 0.1 ± 0.01 c 0.1 ± 0.01 a 0.3 ± 0.01 ce 0.7 ± 0.07 cde 0.5740/10 0.1 ± 0.01 c 6.1 ± 0.02 d 0.9 ± 0.04 c 0.6 ± 0.02 d 0.1 ± 0.01 c 0.1 ± 0.02 a
n0.3 ± 0.01 ce 0.6 ± 0.04 cde 0.67
10/20 0.1 ± 0.01 c 10.2 ± 0.16 e 2.0 ± 0.05 d 1.1 ± 0.03 fg 0.2 ± 0.02 c d 0.5 ± 0.02 gh 1.1 ± 0.05 de 0.3620120 0.1 ± 0.01 c 11.6 ± 0.12 f 1.6 ± 0.06 e 1.0 ± 0.02 fh 0.2 ± 0.02 c tr 0.4 ± 0.02 fgh 0.9 ± 0.07 cde 0.3330/20 0.1 ± 0.01 c 12.4 ± 0.24 g 1.6 ± 0.04 e 1.0 ± 0.03 h 0.2 ± 0.01 c tr 0.4 ± 0.01cef 0.9 ± 0.07 cde 0.3340/20 0.1 ± 0.01 c 12.5 ± 0.24 g 1.5 ± 0.03 e 0.9 ± 0.02 f 0.1 ± 0.01 c 0.1 ± 0.01 ac
n0.3 ± 0.01 cef 0.8 ± 0.10 cde 0.38
10/30 0.1 ± 0.01 c 16.9 ± 0.1 h 2.5 ± 0.04 f 1.4 ± 0.05 f 0.3 ± 0.03 c d 0.5 ± 0.02 h 1.2 ± 0.14 c 0.2520/30 0.1 ± 0.01 c 18.0 ± 0.21 f 22 ± 0.08 g 1.2 ± 0.02 g 0.2 ± 0.01 c d 0.4 ± 0.01 fgh 1.0 ± 0.06 de 0.2030/30 0.1 ± 0.01 c 17.3 ± 0.29 h 2.0 ± 0.03 dg 1.1 ± 0.01 fh 0.1 ± 0.01 c tr 0.4 ± 0.01 efg 0.8 ± 0.03 cde 0.3840/30 0.1 ± 0.01 c 17.3 ± 0.03 h 2.1 ± 0.05 dg 1.1 ± 0.04 fg 0.2 ± 0.02 c tr 0.4 ± 0.02 fgh 1.1 ± 0.07 de 0.18
1 Weight % of total fatty acids. 2 nd = not detected; tr = <0.1%. 3 Columns means with a similar letter in the superscript were not significantly different (P < 0.05, SNK). Values for initial fish were not included in statistical analysis but are presented for comparison. 4 EDA/DHA ratio = 20:2n-9/22:6n-3.
FRDC Project No. 96/392, Page 56
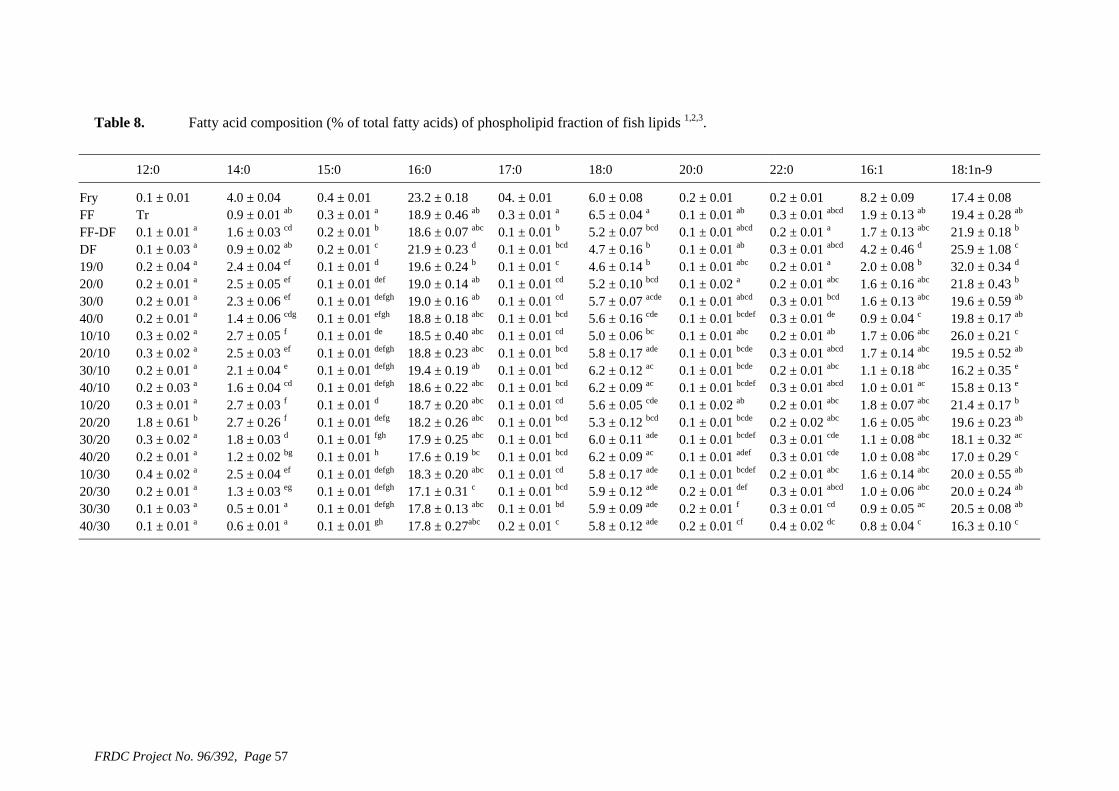
Table 8. Fatty acid composition (% of total fatty acids) of phospholipid fraction of fish lipids 1,2,3.
12:0 14:0 15:0 16:0 17:0 18:0 20:0 22:0 16:1 18:1n-9
Fry 0.1 ± 0.01 4.0 ± 0.04 0.4 ± 0.01 23.2 ± 0.18 04. ± 0.01 6.0 ± 0.08 0.2 ± 0.01 0.2 ± 0.01 8.2 ± 0.09 17.4 ± 0.08 FF Tr 0.9 ± 0.01 ab 0.3 ± 0.01 a 18.9 ± 0.46 ab 0.3 ± 0.01 a 6.5 ± 0.04 a 0.1 ± 0.01 ab 0.3 ± 0.01 abcd 1.9 ± 0.13 ab 19.4 ± 0.28 ab FF-DF 0.1 ± 0.01 a 1.6 ± 0.03 cd 0.2 ± 0.01 b 18.6 ± 0.07 abc 0.1 ± 0.01 b 5.2 ± 0.07 bcd 0.1 ± 0.01 abcd 0.2 ± 0.01 a 1.7 ± 0.13 abc 21.9 ± 0.18 b DF 0.1 ± 0.03 a 0.9 ± 0.02 ab 0.2 ± 0.01 c 21.9 ± 0.23 d 0.1 ± 0.01 bcd 4.7 ± 0.16 b 0.1 ± 0.01 ab 0.3 ± 0.01 abcd 4.2 ± 0.46 d 25.9 ± 1.08 c 19/0 0.2 ± 0.04 a 2.4 ± 0.04 ef 0.1 ± 0.01 d 19.6 ± 0.24 b 0.1 ± 0.01 c 4.6 ± 0.14 b 0.1 ± 0.01 abc 0.2 ± 0.01 a 2.0 ± 0.08 b 32.0 ± 0.34 d 20/0 0.2 ± 0.01 a 2.5 ± 0.05 ef 0.1 ± 0.01 def 19.0 ± 0.14 ab 0.1 ± 0.01 cd 5.2 ± 0.10 bcd 0.1 ± 0.02 a 0.2 ± 0.01 abc 1.6 ± 0.16 abc 21.8 ± 0.43 b 30/0 0.2 ± 0.01 a 2.3 ± 0.06 ef 0.1 ± 0.01 defgh 19.0 ± 0.16 ab 0.1 ± 0.01 cd 5.7 ± 0.07 acde 0.1 ± 0.01 abcd 0.3 ± 0.01 bcd 1.6 ± 0.13 abc 19.6 ± 0.59 ab 40/0 0.2 ± 0.01 a 1.4 ± 0.06 cdg 0.1 ± 0.01 efgh 18.8 ± 0.18 abc 0.1 ± 0.01 bcd 5.6 ± 0.16 cde 0.1 ± 0.01 bcdef 0.3 ± 0.01 de 0.9 ± 0.04 c 19.8 ± 0.17 ab 10/10 0.3 ± 0.02 a 2.7 ± 0.05 f 0.1 ± 0.01 de 18.5 ± 0.40 abc 0.1 ± 0.01 cd 5.0 ± 0.06 bc 0.1 ± 0.01 abc 0.2 ± 0.01 ab 1.7 ± 0.06 abc 26.0 ± 0.21 c 20/10 0.3 ± 0.02 a 2.5 ± 0.03 ef 0.1 ± 0.01 defgh 18.8 ± 0.23 abc 0.1 ± 0.01 bcd 5.8 ± 0.17 ade 0.1 ± 0.01 bcde 0.3 ± 0.01 abcd 1.7 ± 0.14 abc 19.5 ± 0.52 ab 30/10 0.2 ± 0.01 a 2.1 ± 0.04 e 0.1 ± 0.01 defgh 19.4 ± 0.19 ab 0.1 ± 0.01 bcd 6.2 ± 0.12 ac 0.1 ± 0.01 bcde 0.2 ± 0.01 abc 1.1 ± 0.18 abc 16.2 ± 0.35 e 40/10 0.2 ± 0.03 a 1.6 ± 0.04 cd 0.1 ± 0.01 defgh 18.6 ± 0.22 abc 0.1 ± 0.01 bcd 6.2 ± 0.09 ac 0.1 ± 0.01 bcdef 0.3 ± 0.01 abcd 1.0 ± 0.01 ac 15.8 ± 0.13 e 10/20 0.3 ± 0.01 a 2.7 ± 0.03 f 0.1 ± 0.01 d 18.7 ± 0.20 abc 0.1 ± 0.01 cd 5.6 ± 0.05 cde 0.1 ± 0.02 ab 0.2 ± 0.01 abc 1.8 ± 0.07 abc 21.4 ± 0.17 b 20/20 1.8 ± 0.61 b 2.7 ± 0.26 f 0.1 ± 0.01 defg 18.2 ± 0.26 abc 0.1 ± 0.01 bcd 5.3 ± 0.12 bcd 0.1 ± 0.01 bcde 0.2 ± 0.02 abc 1.6 ± 0.05 abc 19.6 ± 0.23 ab 30/20 0.3 ± 0.02 a 1.8 ± 0.03 d 0.1 ± 0.01 fgh 17.9 ± 0.25 abc 0.1 ± 0.01 bcd 6.0 ± 0.11 ade 0.1 ± 0.01 bcdef 0.3 ± 0.01 cde 1.1 ± 0.08 abc 18.1 ± 0.32 ac 40/20 0.2 ± 0.01 a 1.2 ± 0.02 bg 0.1 ± 0.01 h 17.6 ± 0.19 bc 0.1 ± 0.01 bcd 6.2 ± 0.09 ac 0.1 ± 0.01 adef 0.3 ± 0.01 cde 1.0 ± 0.08 abc 17.0 ± 0.29 c 10/30 0.4 ± 0.02 a 2.5 ± 0.04 ef 0.1 ± 0.01 defgh 18.3 ± 0.20 abc 0.1 ± 0.01 cd 5.8 ± 0.17 ade 0.1 ± 0.01 bcdef 0.2 ± 0.01 abc 1.6 ± 0.14 abc 20.0 ± 0.55 ab 20/30 0.2 ± 0.01 a 1.3 ± 0.03 eg 0.1 ± 0.01 defgh 17.1 ± 0.31 c 0.1 ± 0.01 bcd 5.9 ± 0.12 ade 0.2 ± 0.01 def 0.3 ± 0.01 abcd 1.0 ± 0.06 abc 20.0 ± 0.24 ab 30/30 0.1 ± 0.03 a 0.5 ± 0.01 a 0.1 ± 0.01 defgh 17.8 ± 0.13 abc 0.1 ± 0.01 bd 5.9 ± 0.09 ade 0.2 ± 0.01 f 0.3 ± 0.01 cd 0.9 ± 0.05 ac 20.5 ± 0.08 ab 40/30 0.1 ± 0.01 a 0.6 ± 0.01 a 0.1 ± 0.01 gh 17.8 ± 0.27abc 0.2 ± 0.01 c 5.8 ± 0.12 ade 0.2 ± 0.01 cf 0.4 ± 0.02 dc 0.8 ± 0.04 c 16.3 ± 0.10 c
FRDC Project No. 96/392, Page 57
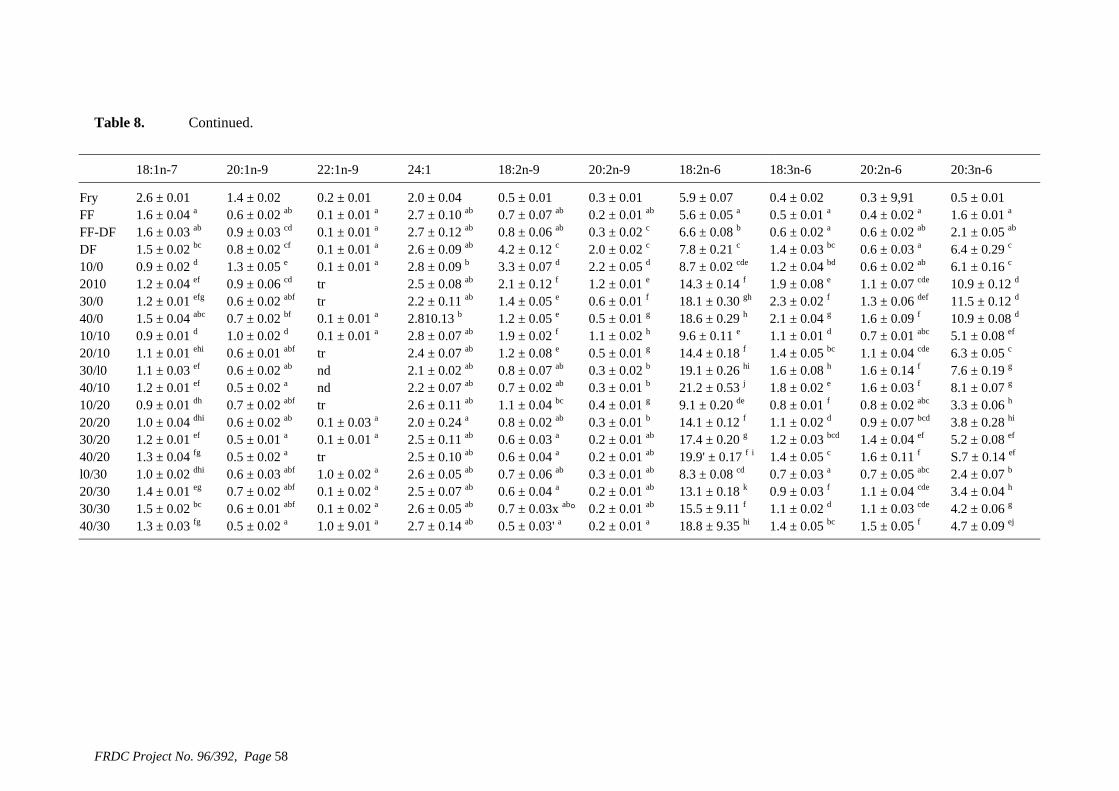
Table 8. Continued.
18:1n-7 20:1n-9 22:1n-9 24:1 18:2n-9 20:2n-9 18:2n-6 18:3n-6 20:2n-6 20:3n-6
Fry 2.6 ± 0.01 1.4 ± 0.02 0.2 ± 0.01 2.0 ± 0.04 0.5 ± 0.01 0.3 ± 0.01 5.9 ± 0.07 0.4 ± 0.02 0.3 ± 9,91 0.5 ± 0.01 FF 1.6 ± 0.04 a 0.6 ± 0.02 ab 0.1 ± 0.01 a 2.7 ± 0.10 ab 0.7 ± 0.07 ab 0.2 ± 0.01 ab 5.6 ± 0.05 a 0.5 ± 0.01 a 0.4 ± 0.02 a 1.6 ± 0.01 a FF-DF 1.6 ± 0.03 ab 0.9 ± 0.03 cd 0.1 ± 0.01 a 2.7 ± 0.12 ab 0.8 ± 0.06 ab 0.3 ± 0.02 c 6.6 ± 0.08 b 0.6 ± 0.02 a 0.6 ± 0.02 ab 2.1 ± 0.05 ab DF 1.5 ± 0.02 bc 0.8 ± 0.02 cf 0.1 ± 0.01 a 2.6 ± 0.09 ab 4.2 ± 0.12 c 2.0 ± 0.02 c 7.8 ± 0.21 c 1.4 ± 0.03 bc 0.6 ± 0.03 a 6.4 ± 0.29 c 10/0 0.9 ± 0.02 d 1.3 ± 0.05 e 0.1 ± 0.01 a 2.8 ± 0.09 b 3.3 ± 0.07 d 2.2 ± 0.05 d 8.7 ± 0.02 cde 1.2 ± 0.04 bd 0.6 ± 0.02 ab 6.1 ± 0.16 c 2010 1.2 ± 0.04 ef 0.9 ± 0.06 cd tr 2.5 ± 0.08 ab 2.1 ± 0.12 f 1.2 ± 0.01 e 14.3 ± 0.14 f 1.9 ± 0.08 e 1.1 ± 0.07 cde 10.9 ± 0.12 d 30/0 1.2 ± 0.01 efg 0.6 ± 0.02 abf tr 2.2 ± 0.11 ab 1.4 ± 0.05 e 0.6 ± 0.01 f 18.1 ± 0.30 gh 2.3 ± 0.02 f 1.3 ± 0.06 def 11.5 ± 0.12 d 40/0 1.5 ± 0.04 abc 0.7 ± 0.02 bf 0.1 ± 0.01 a 2.810.13 b 1.2 ± 0.05 e 0.5 ± 0.01 g 18.6 ± 0.29 h 2.1 ± 0.04 g 1.6 ± 0.09 f 10.9 ± 0.08 d 10/10 0.9 ± 0.01 d 1.0 ± 0.02 d 0.1 ± 0.01 a 2.8 ± 0.07 ab 1.9 ± 0.02 f 1.1 ± 0.02 h 9.6 ± 0.11 e 1.1 ± 0.01 d 0.7 ± 0.01 abc 5.1 ± 0.08 ef 20/10 1.1 ± 0.01 ehi 0.6 ± 0.01 abf tr 2.4 ± 0.07 ab 1.2 ± 0.08 e 0.5 ± 0.01 g 14.4 ± 0.18 f 1.4 ± 0.05 bc 1.1 ± 0.04 cde 6.3 ± 0.05 c 30/l0 1.1 ± 0.03 ef 0.6 ± 0.02 ab nd 2.1 ± 0.02 ab 0.8 ± 0.07 ab 0.3 ± 0.02 b 19.1 ± 0.26 hi 1.6 ± 0.08 h 1.6 ± 0.14 f 7.6 ± 0.19 g 40/10 1.2 ± 0.01 ef 0.5 ± 0.02 a nd 2.2 ± 0.07 ab 0.7 ± 0.02 ab 0.3 ± 0.01 b 21.2 ± 0.53 j 1.8 ± 0.02 e 1.6 ± 0.03 f 8.1 ± 0.07 g 10/20 0.9 ± 0.01 dh 0.7 ± 0.02 abf tr 2.6 ± 0.11 ab 1.1 ± 0.04 bc 0.4 ± 0.01 g 9.1 ± 0.20 de 0.8 ± 0.01 f 0.8 ± 0.02 abc 3.3 ± 0.06 h 20/20 1.0 ± 0.04 dhi 0.6 ± 0.02 ab 0.1 ± 0.03 a 2.0 ± 0.24 a 0.8 ± 0.02 ab 0.3 ± 0.01 b 14.1 ± 0.12 f 1.1 ± 0.02 d 0.9 ± 0.07 bcd 3.8 ± 0.28 hi 30/20 1.2 ± 0.01 ef 0.5 ± 0.01 a 0.1 ± 0.01 a 2.5 ± 0.11 ab 0.6 ± 0.03 a 0.2 ± 0.01 ab 17.4 ± 0.20 g 1.2 ± 0.03 bcd 1.4 ± 0.04 ef 5.2 ± 0.08 ef 40/20 1.3 ± 0.04 fg 0.5 ± 0.02 a tr 2.5 ± 0.10 ab 0.6 ± 0.04 a 0.2 ± 0.01 ab 19.9' ± 0.17 f i 1.4 ± 0.05 c 1.6 ± 0.11 f S.7 ± 0.14 ef l0/30 1.0 ± 0.02 dhi 0.6 ± 0.03 abf 1.0 ± 0.02 a 2.6 ± 0.05 ab 0.7 ± 0.06 ab 0.3 ± 0.01 ab 8.3 ± 0.08 cd 0.7 ± 0.03 a 0.7 ± 0.05 abc 2.4 ± 0.07 b 20/30 1.4 ± 0.01 eg 0.7 ± 0.02 abf 0.1 ± 0.02 a 2.5 ± 0.07 ab 0.6 ± 0.04 a 0.2 ± 0.01 ab 13.1 ± 0.18 k 0.9 ± 0.03 f 1.1 ± 0.04 cde 3.4 ± 0.04 h 30/30 1.5 ± 0.02 bc 0.6 ± 0.01 abf 0.1 ± 0.02 a 2.6 ± 0.05 ab 0.7 ± 0.03x ab° 0.2 ± 0.01 ab 15.5 ± 9.11 f 1.1 ± 0.02 d 1.1 ± 0.03 cde 4.2 ± 0.06 g 40/30 1.3 ± 0.03 fg 0.5 ± 0.02 a 1.0 ± 9.01 a 2.7 ± 0.14 ab 0.5 ± 0.03' a 0.2 ± 0.01 a 18.8 ± 9.35 hi 1.4 ± 0.05 bc 1.5 ± 0.05 f 4.7 ± 0.09 ej
FRDC Project No. 96/392, Page 58
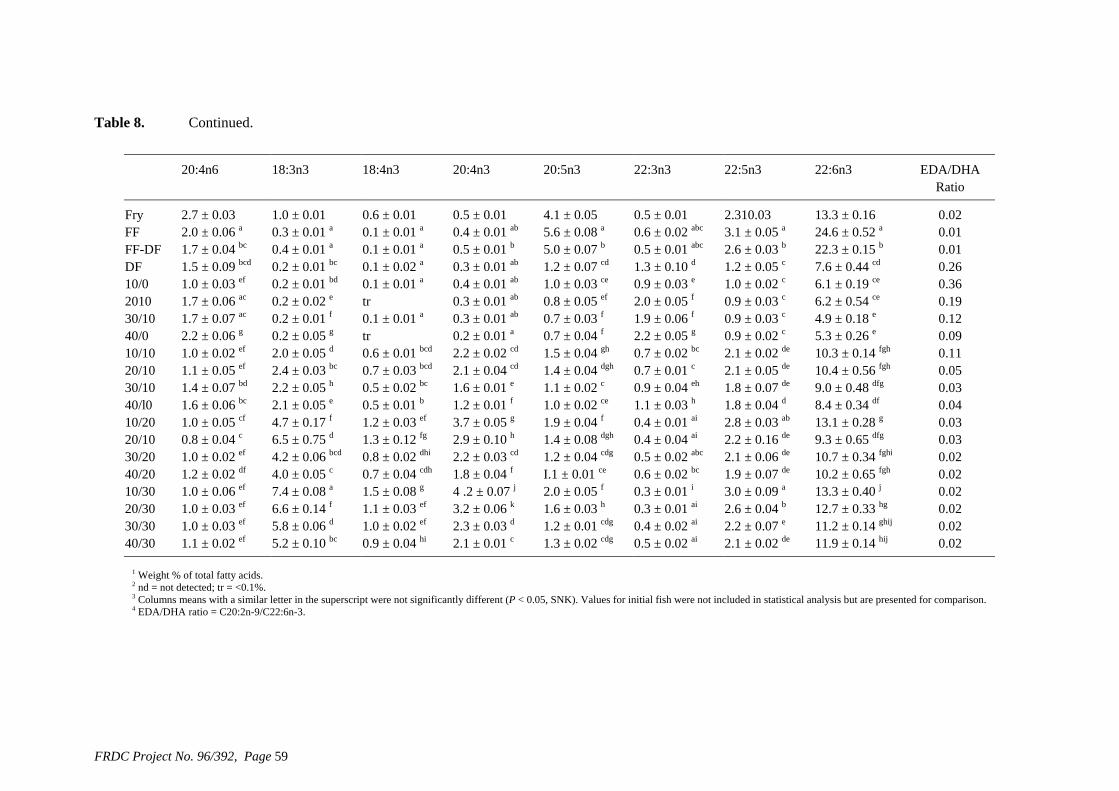
Table 8. Continued.
20:4n6 18:3n3 18:4n3 20:4n3 20:5n3 22:3n3 22:5n3 22:6n3 EDA/DHARatio
1.0 ± 0.01 0.6 ± 0.01 0.5 ± 0.01 0.5 ± 0.01 2.310.03 13.3 ± 0.16 0.02 FF 2.0 ± 0.06 a 0.3 ± 0.01 a 0.1 ± 0.01 a 0.4 ± 0.01 ab 5.6 ± 0.08 a 0.6 ± 0.02 abc 3.1 ± 0.05 a 24.6 ± 0.52 a 0.01FF-DF 1.7 ± 0.04 bc 0.4 ± 0.01 a 0.1 ± 0.01 a
0.1 ± 0.02 0.5 ± 0.01 b 5.0 ± 0.07 b
1.2 ± 0.07 cd0.5 ± 0.01 abc 2.6 ± 0.03 b 22.3 ± 0.15 b 0.01
DF 1.5 ± 0.09 bcd 0.2 ± 0.01 bc 0.3 ± 0.01 ab 1.3 ± 0.10 d 1.2 ± 0.05 c 7.6 ± 0.44 cd 0.260.10/0 1.0 ± 0.03 ef 0.2 ± 0.01 bd
0.2 ± 0.02 0.1 ± 0.01 a 0.4 ± 0.01 ab 1.0 ± 0.03 ce 0.9 ± 0.03 e
2.0 ± 0.05 1.0 ± 0.02 c 6.1 ± 0.19 ce
2010 1.7 ± 0.06 ac tr 0.3 ± 0.01 ab 0.8 ± 0.05 ef 0.7 ± 0.03
0.9 ± 0.03 c 0.9 ± 0.03
6.2 ± 0.54 ce 0.190.30/10 1.7 ± 0.07 ac 0.2 ± 0.01 f
0.2 ± 0.05 g 0.1 ± 0.01 a 0.3 ± 0.01 ab
0.2 ± 0.01 1.9 ± 0.06 f 2.2 ± 0.05 g
4.9 ± 0.18 e
40/0 2.2 ± 0.06 g tr 0.7 ± 0.04 f 0.9 ± 0.02 c 5.3 ± 0.26 e
10/10 20/10
1.0 ± 0.02 ef 1.1 ± 0.05
2.0 ± 0.05 d 2.4 ± 0.03 bc
0.6 ± 0.01 bcd 0.7 ± 0.03
2.2 ± 0.02 cd 1.5 ± 0.04 gh 0.7 ± 0.02 bc 2.1 ± 0.02 de 10.3 ± 0.14 fgh 0.112.1 ± 0.04 cd 1.6 ± 0.01
1.4 ± 0.04 dgh 1.1 ± 0.02
0.7 ± 0.01 c 0.9 ± 0.04 eh
2.1 ± 0.05 de 1.8 ± 0.07
10.4 ± 0.56 fgh
9.0 ± 0.48 df0.05
40/l0 1.6 ± 0.06 bc 2.1 ± 0.05 e 0.5 ± 0.01 b 1.2 ± 0.03 ef
1.2 ± 0.01 f 1.0 ± 0.02 ce 1.1 ± 0.03 h 1.8 ± 0.04 d 8.4 ± 0.34 df 0.0410/20 1.0 ± 0.05 cf 4.7 ± 0.17 f 3.7 ± 0.05 g 1.9 ± 0.04 f 0.4 ± 0.01 ai 2.8 ± 0.03 ab 13.1 ± 0.28 g 0.0320/10 0.8 ± 0.04 c 6.5 ± 0.75 d 1.3 ± 0.12 fg 2.9 ± 0.10 h 1.4 ± 0.08 dgh
1.2 ± 0.04 0.4 ± 0.04 ai 2.2 ± 0.16 de 9.3 ± 0.65 dfg 0.03
30/20 1.0 ± 0.02 ef 4.2 ± 0.06 bcd 0.8 ± 0.02 dhi 2.2 ± 0.03 cd 0.5 ± 0.02 abc 2.1 ± 0.06 de 10.7 ± 0.34 fghi 0.0240/20 1.2 ± 0.02 df 4.0 ± 0.05 c 0.7 ± 0.04 cdh 1.8 ± 0.04 f I.1 ± 0.01 ce 0.6 ± 0.02 bc 1.9 ± 0.07 de 10.2 ± 0.65 fgh 0.0210/30 1.0 ± 0.06 ef 7.4 ± 0.08 a 1.5 ± 0.08 g 4 .2 ± 0.07 j 2.0 ± 0.05 f 0.3 ± 0.01 i 3.0 ± 0.09 a 13.3 ± 0.40 j
12.7 ± 0.33 hg0.02
20/30 1.0 ± 0.03 ef 6.6 ± 0.14 f 1.1 ± 0.03 ef 3.2 ± 0.06 k 1.6 ± 0.03 h 0.3 ± 0.01 ai 2.6 ± 0.04 b 0.0230/30 1.0 ± 0.03 ef 5.8 ± 0.06 d 1.0 ± 0.02 ef 2.3 ± 0.03 d 1.2 ± 0.01 cdg 0.4 ± 0.02 ai 2.2 ± 0.07 e 11.2 ± 0.14 ghij 0.0240/30 1.1 ± 0.02 ef 5.2 ± 0.10 bc 0.9 ± 0.04 hi 2.1 ± 0.01 c 1.3 ± 0.02 cdg 0.5 ± 0.02 ai 2.1 ± 0.02 de 11.9 ± 0.14 hij 0.02
Fry 2.7 ± 0.03 4.1 ± 0.05
a 36
e f f c 12
a 0.09
ef bcd 30/10 1.4 ± 0.07 bd 2.2 ± 0.05 h 0.5 ± 0.02 bc e c de g 0.03
cdg
1 Weight % of total fatty acids. 2 nd = not detected; tr = <0.1%. 3 Columns means with a similar letter in the superscript were not significantly different (P < 0.05, SNK). Values for initial fish were not included in statistical analysis but are presented for comparison. 4 EDA/DHA ratio = C20:2n-9/C22:6n-3.
FRDC Project No. 96/392, Page 59
60 NSW Fisheries
Discussion
Effects on weight gain
The data supports the view that silver perch can chain elongate and desaturate short chain PUFA to produce long chain PUFA, although this process is subject to competitive interference from both LA and LNA. However, even at the highest levels of LNA (30% of TFA), conversion is poor and the levels of EPA and DHA do not approach those seen in the lipids of fish fed diets containing as little as at 0.3% of TFA for each of EPA and DHA. Weight gain was significantly affected by the proportion of both LA and LNA in the dietary lipid. Diets containing LA at 10% of TFA with no LNA, produced growth rates similar to that of the DF diet, which contained no added LA or LNA. There was also an increase in the deficiency indicator, EDA, to a similar level to that found in fish fed the defatted diet. This suggests that LA at 10% of TFA is insufficient to meet the nutrient requirements of silver perch fingerlings. Increasing the LNA content of the diet to 10% of TFA resulted in slightly better weight gain and reduced the proportion of EDA. Continued addition of LNA to 30% of TFA, did not improve weight gain further but did eliminate the indication of biochemical deficiency. Increasing LA to 20% of TFA in the absence of LNA improved weight gain but left the biochemical deficiency unchanged. Adding in LNA at this level of LA (20%) resulted in continued improvement in weight gain and removed signs of biochemical deficiency (accumulation of EDA). This suggests the principal fatty acid determinant of weight gain is the n-6 fatty acid LA but that the n-3 fatty acid LNA is also required for other biochemical purposes. This is further emphasised when LA is at 30% of TFA and LNA of 20% of TFA, where the best weight gain was achieved, with no biochemical signs of deficiency. Additional LNA at this level of LA produced lower weight gain suggesting a possible toxic effect that is seen again when LA is at 40% of TFA and LNA is at 30% TFA, where weight gain has declined to that of the defatted diet. Takeuchi and Watanabe (1979) found excess amounts of dietary LNA (80% of TFA) and total n-3 PUFAs (40% of TFA) resulted in poor weight gain and low feed efficiency in rainbow trout. Watanabe (1982) stated that a mechanism might be involved that monitors and maintains a proper level of body lipid unsaturation in fish. Weight gain was further enhanced in fish fed diets (FF and FF-DF) containing greater proportions of the preformed longer chain n-3 PUFAs, EPA and DHA. This suggests that these longer chain PUFAs have a greater effect on the weight gain of silver perch than the shorter chain PUFAs, LA and LNA. This effect has been shown in other species of freshwater fish such as rainbow trout (Lee et al., 1967, Castell et al., 1972a, Castell et al., 1972b, Castell et al., 1972c, Watanabe et al., 1974a, Watanabe et al., 1974b, Takeuchi and Watanabe, 1977b), carp (Watanabe et al., 1975a, Watanabe et al., 1975b, Farkas et al., 1977, Takeuchi and Watanabe, 1977a) and channel catfish (Stickney & Andrews, 1972, Stickney & McGeachin, 1983, Stickney et al., 1984, Robinson, 1989). From these results EFA requirement of LA and LNA for silver perch are 30% of TFA as LA and 20% of TFA as LNA. If this were to be expressed as % (w/w) of diet, LA and LNA would be at approximately 2.5% and 2.3%, respectively of the diet. However, if AA, EPA and DHA are included in the diet of silver perch then the proportion of LA and LNA could potentially be reduced. Conversely if AA, EPA and DHA requirements are examined when LA and LNA are maintained at 30% and 20% of total fatty acids, respectively then improved growth may occur as shown in farmed prawns (Glencross and Smith, 2000). These results suggest that fatty acids of both the n-6 and n-3 series, especially the longer chain fatty acids, are essential in the diet for silver perch and supports the conclusions of Anderson and Arthington (1989) and Anderson (1993). By using these optimal requirements for LA and LNA the identification of EPA, DHA and AA requirements could be determined. This may result in the identification of the optimal fatty acid
FRDC Project No. 96/392 Smith et al.
NSW Fisheries 61
requirements for silver perch. In this experiment maximum growth was achieved with the reference diet (95LC2), which contained 3.2% fish oil. Once optimal fatty acid requirements have been determined fish oil could be replaced with other oils or purified fatty acids in the diets of silver perch. However this method would be more expensive then including fish oil in the diet. Deficiency signs
Deficiency signs in fingerlings fed the DF diet were poor weight gain, increased carcass moisture content and a fatty liver, also seen in EFA deficient rainbow trout (Castell et al., 1972b, Watanabe et al., 1974a). Elevated levels of EDA, a metabolite of 18:ln-9, were detected in lipids of fish fed the defatted diet in this study. A trace amount of eicosatrienoic acid (ETA; 20:3n-9), a biochemical marker of fatty acid deficiency reported by Castle et al. (1972c) was detected in silver perch and continued feeding on these diets might have lead to an increase in production of this fatty acid. Anderson (1993) fed a fat free diet to juvenile silver perch for 125 days but did not find ETA to be elevated. It is likely that silver perch accumulate this intermediate in preference to ETA when fed a deficient diet. Ghana et al. (1997) detected an accumulation of EDA as well as 18:2n-9 and ETA in the phospholipid fraction of skin and opercular membrane of rainbow trout fed an EFA deficient diet. Castle et al (1972c) suggested that the 20:3n-9 to 22:6n-3 (ETA:DHA) ratio in the phospholipid fraction could be used as an indicator of EFA deficiency and that EFA requirement of fish can be satisfied when the ratio is < 0.4. As silver perch produced very little ETA, a better indicator of deficiency could be 20:2n-9 to 22:6n-3 (EDA:DHA) ratio. Fingerlings fed the DF and the diet with 10% of TFA as LA with no LNA, had an EDA:DHA ratio of 0.3 and 0.4, respectively. According to these results, feeding 10% of TFA as LA with no LNA produced EFA deficiency in these silver perch fingerlings, suggesting this ratio is a useful marker for this species. A study conducted by Webster et al (1994) also found the ETA:DHA ratio an insufficient indicator of EFA deficiency in striped bass. They suggested that a more appropriate indicator would be the ETA:EPA ratio in the phospholipid fraction and fish with a ratio >0.1 exhibit EFA deficiency. In this study the indicator would need to be the EDA:EPA ratio, and using this ratio indicates that all fingerlings exhibit EFA deficiency, except the fingerlings fed the FF and FF-DF diets. As this is clearly not the case, this ratio is not a useful indicator of EFA deficiency in silver perch fingerlings. Effects on lipid composition
Triglyceride and phospholipid content of silver perch were affected to some degree by EFA deficiency. Results showed that the fatty acid composition of phospholipids (membrane component) was conserved at the expense of the storage component (triglyceride). At all levels of dietary LA and LNA, there were no significant changes in the proportion of EPA and DHA in the phospholipid fraction in lipids, suggesting these fatty acids are conserved and hence essential to silver perch. Watanabe (1982) commented that alterations in fish lipid or fatty acid composition are due to changes in triglyceride content while the phospholipid fraction remains constant. Anderson and Arthington (1989) also found an almost constant level of DHA in the phospholipid fraction in juvenile silver perch fed a fat free diet. The diets that contained pre-existing long chain PUFAs, showed significant proportions of EPA and DHA in the lipids of fish fed these diets. The DF diet, which contained very low levels of the dietary long chain PUFAs, (0.3% of TFA as EPA and 0.4% of TFA acids as DHA) still resulted in the fish retaining significant proportions of EPA and DHA in their lipids despite poor growth and accumulation of an EFA deficiency marker. This again suggests there is conservation of these important metabolically active fatty acids. Biomembranes preferentially incorporate these longer chain fatty acids, especially DHA, into their structure to give membranes the higher degree of fluidity required by fish species. When channel catfish were fasted for a period of 80 days, DHA was retained in both muscle and liver tissue (Webster et al., 1994), while rainbow trout fed an EFA deficient diet for approximately 3 months also conserved DHA in the phospholipid fraction of skin and opercular membrane (Ghioni et al., 1997). The metabolically active DHA has been reported to
Smith et al. FRDC Project No. 96/392
62 NSW Fisheries
have a greater effect on weight gain than LNA in carp and rainbow trout (Takeuchi and Watanabe, 1977b, Takeuchi, 1996). This seems also to be the case with silver perch suggesting that less dietary DHA than LNA may be required to achieve maximum weight gain. Fingerlings fed diets that contained no AA produced small amounts of this fatty acid in fish lipid, indicating the conversion of LA to AA occurs in silver perch. The four diets containing only a small amount of endogenous LNA (no added LNA), produced fish with minimal EPA and DHA suggesting limited conversion from LNA. As LA rose in these four diets the proportion of EPA and DHA fell further suggesting competition for conversion from LNA. The ∆6-desaturase is the rate limiting enzyme for both the conversion of LA to oxidation to 22:6n-3 (DHA), which has been shown in, fish tissue (Mourente & Tocher, 1993). Studies of these enzymes in silver perch are needed to confirm the suggested effects from the fatty acid results reported here, gamma-linolenic acid (18:3n-6) and also for LNA to stearidonic acid (18:4n-3), both reactions being the initial steps in the conversion to important intermediates in the n-6 series (AA) and n-3 series (EPA and DHA). In diets with LNA at 10% of TFA, more DHA was present but as the LA proportion rose, the DHA proportion fell, suggesting competitive inhibition of conversion from LNA. At 20% of TFA as LNA, DHA was higher again with increased proportions of precursor intermediates, 20,4n-3 and 18,4n-3. Again, as LA rose at this LNA level, product and precursor intermediate levels fell. At the highest level of LNA (30% of fatty acids), there is sufficient LNA present to overcome any apparent inhibitory effects of LA. In these experimental diets, as LA and LNA proportions were increased there was no real increase in AA and EPA proportions in fish lipids indicating a lack of activity of the ∆5-desaturase enzyme in silver perch. A study by Tocher et al. (1996) found a low ∆5-desaturase activity in an EFA deficient cell line, derived from epithelial papilloma line of carp, a freshwater species. However studies with Atlantic salmon and rainbow trout, both freshwater species, found both ∆6 and ∆5-desaturase activity in fish tissues (Tocher, 1990, Tocher and Dick, 1990). Due to the low activity of ∆5-desaturase in silver perch, the production of DHA may have occurred from the ∆6-desaturase of 24:5n-3 to 24:6n-3, followed by β oxidation to 22,6n-3 (DHA) which has been shown in fish tissue (Mourente & Tocher, 1993). Studies of these enzymes in silver perch are needed to confirm the suggested effects from the fatty acid results reported here. The results of this study show that silver perch require both n-6 and n-3 fatty acids in their diets. Acceptable weight gain can be achieved with feeding a 9% lipid diet containing 30% of TFA as LA and 20% of TFA as LNA, but maximal weight gain is achieved when the n-6 PUFA, AA, and the n-3 PUFAs, EPA and DHA, are also incorporated into the diet. Silver perch have the ability to chain elongate and desaturate fatty acids to their longer chain metabolites, but this does not seem to be at a sufficient rate to achieve optimal growth and feed efficiency in the absence of a minimal amount of preformed dietary EPA and DHA.
FRDC Project No. 96/392 Smith et al.

Table 9. Fatty acid composition (% of total fatty acids) of silver perch liver lipids. 1,2,3.
12:0 14:0 15:0 16:0 17:0 18:0 20:0 22:0 16:1 18:1n-9
FF tr 2.8 ± 0.16 ab 0.4 ± 0.04 a 27.6 ± 0.70 ab 0.5 ± 0.05 a 9.9 ± 0.29 abc 0.2 ± 0.01 abc 0.2 ± 0.01 abc 5.7 ± 0.13 a 39.5 ± 0.10 ab FF-DF 1.6 ± 0.52 c 4.9 ± 0.40 abc 0.2 ± 0.02 bc 24.1 ± 0.79 ac 0.2 ± 0.02 bcd 7.8 ± 0.47 ade 0.2 ± 0.01 abc 0.1 ± 0.01 abc 5.3 ± 0.25 ab 41.7 ± 0.56 ab DF 0.1 ± 0.01 a 3.6 ± 0.14 ab 0.3 ± 0.04 ab 30.9 ± 1.32 b 0.2 ± 0.02 bcd 8.3 ± 0.68 ade 0.1 ± 0.01 ab 0.1 ± 0.01 ade 9.4 ± 0.50 c 36.2 ± 1.64 acd 10/0 2.6 ± 0.15 d
2.8 ± 0.11 de9.5 ± 0.25 d 0.1 ± 0.01 c 26./1 ± 0.19 abc 0.1 ± 0.01 d 5.8 ± 0.20 d
10.3 ± 0.29 0.1 ± 0.01 a 0.1 ± 0.01 e
0.1 ± 0.01 de4.6 ± 0.19 bd 44.0 ± 0.49 b
20/0 abc bc bcd abc eh
0.1 ± 0.01 bc 0.1 ± 0.01 e ac bd df
0.2 ± 0.01 bc 24.9 ± 0.83 ac 0.2 ± 0.01 bcd 11.6 ± 0.95bc abc abc 3.5 ± 0.20 def efghi
cd
4.1 ± 0.09 ab 1.7 ± 0.12 a 2.0 ± 0.07 a
9.7 ± 0.53 d 0.2 ± 0.01 bc 0.1 ± 0.02
26.4 ± 0.45 abc 0.2 ± 0.02 bcd 0.2 ± 0.02
0.1 ± 0.01 ab 0.2 ± 0.01
3.3 ± 0.19 ef 31.9 ± 0.49 cefgh 26.6 ± 1.05 30/0
40/0 2.8 ± 0.42 de 7.8 ± 0.73 cd 26.0 ± 0.72 abc 12.7 ± 0.33 ef 0.1 ± 0.01 abd 2.6 ± 0.11 eg 1.0 ± 0.12 b 3.7 ± 0.31 ab 23.2 ± 0.97 ac
22.9 ± 0.43 0.2 ± 0.02 bcd 0.1 ± 0.01
11.4 ± 0.32 bc 6.9 ± 0.13 de
0.2 ± 0.02 abc 0.2 ± 0.01 abc 1.9 ± 0.08 g 4.0 ± 0.13
32.4 ± 1.28 cdefgh 10/10 3.2 ± 0.18 e 9.3 ± 0.54 d
7.8 ± 0.59 cd0.1 ± 0.01 ab 0.2 ± 0.01
0.1 ± 0.01 de 0.2 ± 0.01
38.5 ± 0.50 ad 29.5 ± 0.60 20/10
30/10 2.5 ± 0.15 d 2.6 ± 0.42 d 7.6 ± 1.10 cd 0.2 ± 0.02 bc 23.1 ± 0.33 ac 0.2 ± 0.01 bcd 10.2 ± 0.54 abc 0.2 ± 0.01 abc 0.1 ± 0.01 abd 2.2 ± 0.21 eg 25.3 ± 0.87 f
40/10 1.8 ± 0.11 c 4.6 ± 0.20 ab 0.1 ± 0.01 c 22.6 ± 1.08 ac 0.2 ± 0.01 bcd 11.9 ± 0.58 c 0.2 ± 0.01 abc 0.2 ± 0.01 bc 2.2 ± 0.16 eg 24.5 ± 1.57 f 10/20 3.1 ± 0.19 e 9.1 ± 0.35 d
5.7 ± 0.20 bc0.1 ± 0.01 e 24.1 ± 0.88 ac 0.2 ± 0.01 bd 6.9 ± 0.28 de 0.1 ± 0.01 ab 0.1 ± 0.01 de 4.1 ± 0.16 df 33.3 ± 0.69 cdgh
20/20 2.1 ± 0.22 cd 0.1 ± 0.01 c 22.0 ± 0.23 ac 0.2 ± 0.01 bd 8.7 ± 0.20 abc 0.2 ± 0.01 abc 0.1 ± 0.01 abd 3.3 ± 0.08 ef 28.5 ± 0.74 efgh 30/20 2.1 ± 0.10 cd 5.9 ± 0.35 bc 0.2 ± 0.02 bc 26.3 ± 1.01 abc 0.2 ± 0.03 bcd 12.3 ± 0.44 cf 0.2 ± 0.01 cde 0.2 ± 0.02 e 2.4 ± 0.20 eg 30.4 ± 0.54 cefghi 40/20 0.8 ± 0.12 b 3.0 ± 0.31 ab
7.9 ± 0.88 0.1 ± 0.02 bc 20.5 ± 0.92 c 0.2 ± 0.02 bcd 10.6 ± 0.27 abc 0.2 ± 0.02 bcd 0.2 ± 0.01 abc 1.8 ± 0.09 8 26.0 ± 0.53 ef
10/30 2.6 ± 0.48 d 0.1 ± 0.03 c 24.5 ± 1.15 ac 0.2 ± 0.04 bcd 7.8 ± 0.37 ade 0.2 ± 0.02 abc 0.1 ± 0.01 ade 4.1 ± 0.23 df 32.8 ± 1.44 cdfgh 20/30 1.0 ± 0.13 b 0.1 ± 0.01 bc 23.5 ± 0.30 ac 0.2 ± 0.01 bcd 10.0 ± 0.22 abc 0.3 ± 0.03 def 0.2 ± 0.02 bc 3.1 ± 0.16 efg 35.9 ± 0.72 acdh 30/30 0.1 ± 0.01 a 0.1 ± 0.01 bc 24.4 ± 1.30 ac 0.3 ± 0.02 bc 11.4 ± 0.80 bc 0.3 ± 0.03 ef 0.2 ± 0.01 c 2.5 ± 0.17 eg 35.9 ± 1.11 acdh 40/30 0.2 ± 0.04 a 0.2 ± 0.01 bc 27.2 ± 0.36 ab 0.3 ± 0.02 c 14.3 ± 0.50 f 0.3 ± 0.01 f 0.3 ± 0.01 f 2.3 ± 0.05 eg 32.2 ± 0.63 cdefgh
FRDC Project No. 96/392, Page 63

Table 9. Continued. 18:1n-7 20:1n-9 22:1n-9 24:1 18:2n-9 20:2n-9 18:2n-6 18:3n-6 20:2n-6
FF 2.4 ± 0.04 a 1.5 ± 0.03 ab 0.2 ± 0.01 a
c
abcde bcde efgh
g abc bce 2.2 ± 0.32 e 0.5 ± 0.04 gh a 0.6 ± 0.05 de 0.2 ± 0.01 abcd
ef a 1.0 ± 0.04 def 1.0 ± 0.10 a 0. ab abdef 0. hi cde f
0.2 ± 0.02 abc 0.6 ± 0.04 hi def
defg
h 1.6 ± 0.06 h
1.1 ± 0.10 abcde 0.4 ± 0.05 ab 0.3 ± 0.03 abc 2.4 ± 0.13 ab 0.2 ± 0.01 a 0.2 ± 0.01 abc FF-DF 2.1 ± 0.01 b 1.8 ± 0.07 b 0.2 ± 0.01 a 0.9 ± 0.07 abc 0.5 ± 0.03 ab
1.8 ± 0.11 0.3 ± 0.02 abc 3.7 ± 0.72 abcd 0.2 ± 0.03 a 0.2 ± 0.01 abcde
DF 1.9 ± 0.07 c I.1 ± 0.03 a 0.2 ± 0.01 a 0.8 ± 0.07 abc 0.7 ± 0.05 c
0.6 ± 0.04 deL.5 ± 0.18 ab 0.3 ± 0.05 a 0.1 ± 0.01ab
10/0 0.8 ± 0.03 d 1.4 ± 0.02 ab 0.2 ± 0.01 a 0.6 ± 0.05 a 1.2 ± 0.09 bcdef 1.2 ± 0.08 a 4.2 ± 0.31
0.2 ± 0.01 a 0.1 ± 0.01 a 20/0 1.1 ± 0.04 efg 1.2 ± 0.08 ab 0.I ± 0.01 a 0.7 ± 0.11 abc 1.5 ± 9.17 ef 0.6 ± 0.04 de 0.9 ± 0.13 abc
1.5 ± 0.29 0.3 ± 0.02 abcdefg
0.4 ± 0.04 30/0 40/0
1.1 ± 0.03 defg 1.3 ± 0.07
1.0 ± 0.04 a 0.1 ± 0.01 a 0.7 ± 0.05 ab 0.8 ± 0.09
1.2 ± 0.18 bcdef 0.5 ± 0.07 ce 0.4 ± 0.05
7.5 ± 0.48 defg 1.0 ± 0.07 a 0.2 ± 0.02 a
0.1 ± 0.01 1.4 ± 0.19 cde 10.1 ± 0.87 gh
10/10 20/10
0.9 ± 0.02 de 1.2 ± 0.03 g
1.3 ± 0.03 ab 1.1 ± 0.07
0.8 ± 0.04 abc 1.3 ± 0.17 cdef 3.2 ± 0.21 abc 0.5 ± 0.08 a 0.1 ± 0.01 a
I ± 0.01 a1.1 ± 0.09 abcde 0.7 ± 0.05
0.9 ± 0.16 abdef 0.8 ± 0.12
0.3 ± 0.03 abc 310.02 abc
5.5 ± 0.32 bcdef 1N.7 ± 0.41
0.7 ± 0.13 ab 1.7 ± 0.17
0.4 ± 0.02 cdefg 0.6 ± 0.06 30/10
40/10 1.1 ± 0.04 defg 0.9 ± 0.03
1.3 ± 0.42 ab 0.1 ± 0.02 a 0.9 ± 0.04 abcd 0.7 ± 0.08abde 13.0 ± 1.23 hi 1.9 ± 0.31 e 10/20 1.1 ± 0.02 a 0.2 ± 0.01 a 0.7 ± 0.06 ab 0.8 ± 0.05 abdef 0.3 ± 0.02 abc 4.0 ± 0.28 abcd 0.5 ± 0.05 a 0.2 ± 0.01 abcde 20/20 1.0 ± 0.02 defg 1.0 ± 0.03 a 0.1 ± 0.01 a 0.8 ± 0.05 abc 0.8 ± 0.03 abdef 0.3 ± 0.01 abc 8.0 ± 0.17 efg 1.1 ± 0.04 abcd 0.4 ± 0.01 efgh 30/20 1.2 ± 0.03 fg
1.0 ± 0.04 1.2 ± 0.03 ab 0.2 ± 0.02 a 1.3 ± 0.09 bcde 0.3 ± 0.05 a 0.2 ± 0.02 a 7.3 ± 0.56 defg 0.5 ± 0.01 a 0.4 ± 0.05 fgh
40/20 0.9 ± 0.08 a 0.2 ± 0.04 a 0.8 ± 0.10 abc 0.7 ± 0.10 abde 0.2 ± 0.04 ab 14.6 ± 0.53 f 1.8 ± 0.21 cde 0.7 ± 0.04 f 10/30 1.1 ± 0.05 defg
1.5 ± 9.02 1.3 ± 0.14 ab 0.2 ± 0.03 a 1.0 ± 0:12 abcd 0.6 ± 0.12 abd 0.2 ± 0.02 ab 3.5 ± 0.32 abcd 0.3 ± 0.07 a 0.2 ± 0.02 abcdef
20/30 1.2 ± 0.03 ab 0.2 ± 0.01 a 1.3 ± 0.11 cde 0.5 ± 0.05 ab 0.2 ± 0.01 a 5.5 ± 0.22 bcdef 0.5 ± 0.06 a 0.3 ± 0.03 bcdefg 30/30 1.2 ± 0.04 ab 0.2 ± 0.02 a 1.4 ± 0.12 de 0.4 ± 9.08 ab 0.2 ± 0.02 a 7.1 ± 1.28 cdefg 0.6 ± 0.16 ab 0.3 ± 0.04 bcdefg 40/30 1.5 ± 0.05 h 1.1 ± 0.05 a 0.4 ± 0.02 b 1.5 ± 0.06 e 0.2 ± 0.02 a 0.1 ± 0.02 a 8.4 ± 0.61 fg 0.4 ± 0.03 a 0.4 ± 0.03 defg
FRDC Project No. 96/392, Page 64
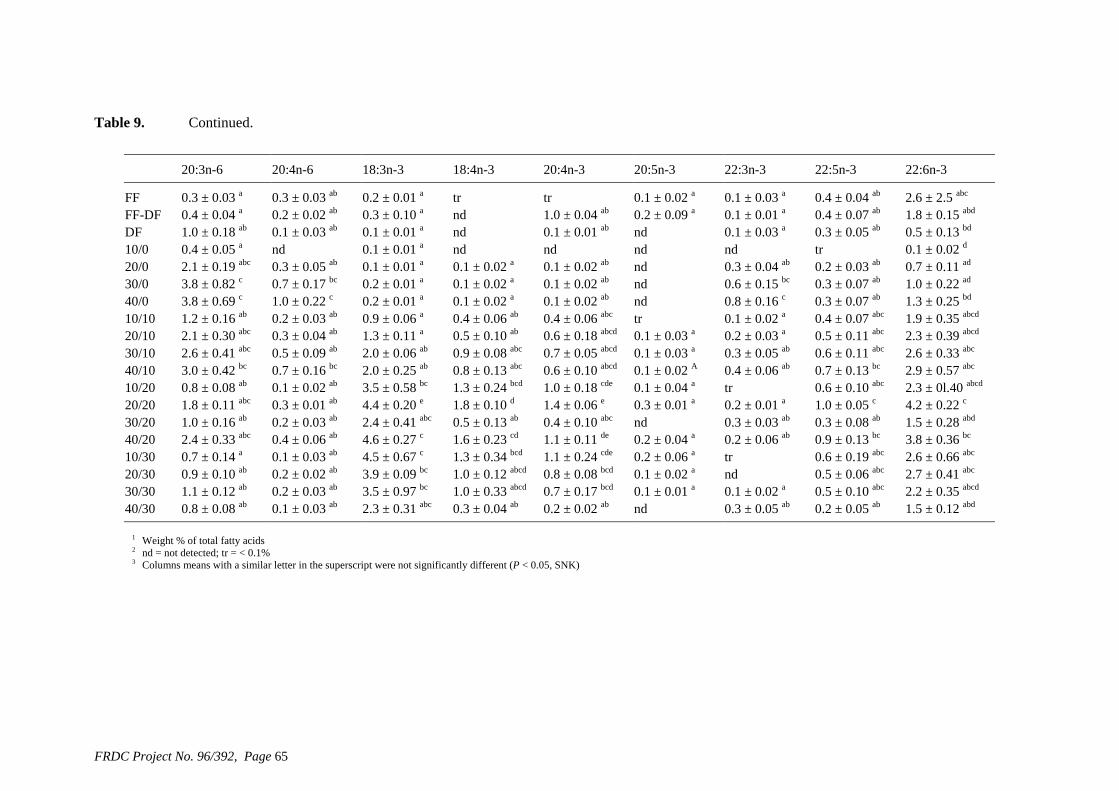
Table 9. Continued.
20:3n-6 20:4n-6 18:3n-3 18:4n-3 20:4n-3 20:5n-3 22:3n-3 22:5n-3 22:6n-3
FF 0.3 ± 0.03 a 0.3 ± 0.03 ab 0.2 ± 0.01 a tr tr 0.1 ± 0.02 a 0.1 ± 0.03 a 0.4 ± 0.04 ab 2.6 ± 2.5 abc FF-DF 0.4 ± 0.04 a 0.2 ± 0.02 ab 0.3 ± 0.10 a nd 1.0 ± 0.04 ab 0.2 ± 0.09 a 0.1 ± 0.01 a 0.4 ± 0.07 ab 1.8 ± 0.15 abd DF 1.0 ± 0.18 ab 0.1 ± 0.03 ab 0.1 ± 0.01 a nd 0.1 ± 0.01 ab
nd 0.1 ± 0.03 a
0.3 ± 0.05 ab
0.5 ± 0.13 bd 0.1 0.0210/0 0.4 ± 0.05 a nd 0.1 ± 0.01 a nd ± d
abc abcd abcd 1 ± 0.03 a a
abc abc ab bc abc
20/20 abc ab e d e a 2 ± 0.01 a c
ab
nd nd nd tr20/0 2.1 ± 0.19 abc 0.3 ± 0.05 ab 0.1 ± 0.01 a 0.1 ± 0.02 a 0.1 ± 0.02 ab nd 0.3 ± 0.04 ab 0.2 ± 0.03 ab 0.7 ± 0.11 ad 30/0 3.8 ± 0.82 c 0.7 ± 0.17 bc 0.2 ± 0.01 a 0.1 ± 0.02 a 0.1 ± 0.02 ab nd 0.6 ± 0.15 bc 0.3 ± 0.07 ab 1.0 ± 0.22 ad 40/0 10/10
3.8 ± 0.69 c 1.0 ± 0.22 c 0.2 ± 0.01 a 0.1 ± 0.02 a 0.4 ± 0.06 ab
0.1 ± 0.02 ab nd 0.8 ± 0.16 c 0.3 ± 0.07 ab 0.4 ± 0.07
1.3 ± 0.25 bd 1.9 ± 0.35 1.2 ± 0.16 ab 0.2 ± 0.03 ab 0.9 ± 0.06 a 0.4 ± 0.06 abc
0.6 ± 0.18 tr 0.
0.1 ± 0.02 a 0.2 ± 0.03 20/10 2.1 ± 0.30 abc
2.6 ± 0.41 0.3 ± 0.04 ab 1.3 ± 0.11 a 0.5 ± 0.10 ab
0.9 ± 0.08 0.5 ± 0.11 abc 2.3 ± 0.39 abcd
30/10 0.5 ± 0.09 ab 2.0 ± 0.06 ab 0.7 ± 0.05 abcd 0.1 ± 0.03 a 0.1 ± 0.02 A
0.3 ± 0.05 ab 0.4 ± 0.06
0.6 ± 0.11 abc 0.7 ± 0.13
2.6 ± 0.33 abc 2.9 ± 0.57 40/10
10/20 3.0 ± 0.42 bc 0.7 ± 0.16 bc 2.0 ± 0.25 ab 0.8 ± 0.13 abc 0.6 ± 0.10 abcd 0.8 ± 0.08 ab 1.8 ± 0.11
0.1 ± 0.02 ab 0.3 ± 0.01
3.5 ± 0.58 bc 4.4 ± 0.20
1.3 ± 0.24 bcd 1.8 ± 0.10
1.0 ± 0.18 cde 1.4 ± 0.06
0.1 ± 0.04 a 0.3 ± 0.01
tr 0.
0.6 ± 0.10 abc 1.0 ± 0.05
2.3 ± 0l.40 abcd 4.2 ± 0.22 c
30/20 1.0 ± 0.16 ab 0.2 ± 0.03 ab 2.4 ± 0.41 abc 0.5 ± 0.13 ab 0.4 ± 0.10 abc nd 0.3 ± 0.03 ab 0.3 ± 0.08 ab 1.5 ± 0.28 abd 40/20 2.4 ± 0.33 abc 0.4 ± 0.06 ab 4.6 ± 0.27 c 1.6 ± 0.23 cd 1.1 ± 0.11 de 0.2 ± 0.04 a 0.2 ± 0.06 ab 0.9 ± 0.13 bc 3.8 ± 0.36 bc 10/30 0.7 ± 0.14 a 0.1 ± 0.03 ab 4.5 ± 0.67 c 1.3 ± 0.34 bcd 1.1 ± 0.24 cde 0.2 ± 0.06 a tr 0.6 ± 0.19 abc 2.6 ± 0.66 abc 20/30 0.9 ± 0.10 ab 0.2 ± 0.02 ab 3.9 ± 0.09 bc 1.0 ± 0.12 abcd 0.8 ± 0.08 bcd 0.1 ± 0.02 a nd 0.5 ± 0.06 abc 2.7 ± 0.41 abc 30/30 1.1 ± 0.12 ab 0.2 ± 0.03 ab
0.1 ± 0.03 3.5 ± 0.97 bc 1.0 ± 0.33 abcd 0.7 ± 0.17 bcd 0.1 ± 0.01 a 0.1 ± 0.02 a 0.5 ± 0.10 abc 2.2 ± 0.35 abcd
40/30 0.8 ± 0.08 ab 2.3 ± 0.31 abc 0.3 ± 0.04 ab 0.2 ± 0.02 ab nd 0.3 ± 0.05 ab 0.2 ± 0.05 ab 1.5 ± 0.12 abd 1 Weight % of total fatty acids 2 nd = not detected; tr = < 0.1% 3 Columns means with a similar letter in the superscript were not significantly different (P < 0.05, SNK)
FRDC Project No. 96/392, Page 65
66 NSW Fisheries
References
Allan G.L., Maguire G.B. & Hopkins S.J. (1990) Acute and chronic toxicity of ammonia to juvenile Metapenaeus macleayi and Penaeus monodon and the influence of low dissolved-oxygen levels. Aquaculture, 91, 265-280.
Allan G.L., Rowland S.J., Mifsud C., Glendenning D., Stone D.A.J. & Ford A. (2000) Replacement of fish meal in diets for Australian silver perch, Bidyanus bidyanus V. Least-cost formulation of practical diets. Aquaculture, 186, 327-340.
Anderson A.J. (1993) Studies on the Nutritional Requirements of Silver Perch (Bidyanus bidyanus). Griffith University (thesis).
Anderson A.J. & Arthington A.H. (1989) Effect of dietary lipids on the fatty acid composition of silver perch (Lefopotherapon bidyanus) lipids. Comp. Biochem. Physiol., 93B, 715-720.
Arai S., Nose T. & Hashimoto Y. (1971) A purified test diet for the eel, Anguilla japonica. Bull. Freshwater Fish. Res. Lab., 21, 161-178.
Castell J.D., Sinnhuber R.O., Wales J.H. & Lee D.J. (1972a) Essential fatty acids in the diet of rainbow trout (Salmo gairdneri), growth, feed conversion and some gross deficiency symptoms. J. Nutr., 102, 77-86.
Castell J.D., Sinnhuber R.O., Lee D.J. & Wales J.H. (1972b) Essential fatty acids in the diet of rainbow trout (Salmo gairdneri), physiological symptoms of EFA deficiency. J. Nutr., 102, 87-92.
Castell J.D., Lee D.J. & Sinnhuber R. (1972c) Essential fatty acids in the diet of rainbow trout (Salmo gairdneri), lipid metabolism and fatty acid composition. J. Nutr, 102, 93-100.
Cowey C.B. (1979) Protein and amino acid requirements of finfish. In K. Tiews, and J. E, Halver (Eds), Proceedings of the World Symposium on Finish Nutrition and Fishfeed Technology. Hamberg, Heenemann. Vol 1, pp 3-16.
Cowey C.B., Owen J.M., Adron J.W. & Middleton, C. (I976) Studies on the nutrition of marine flatfish. The effect of different dietary fatty acids on the growth and fatty acid composition of turbot (Scophthalmus maximus). British J. Nutr., 36, 479-48b.
Farkas T., Csengeri I., Majoros F. & Olah J. (1977) Metabolism of fatty acids in fish. I. Development of essential fatty acid deficiency in the carp, Cyprinus carpio Linnaeus 1758. Aquaculture, 11, 147-157.
Folch J., Lees M. & Sloane-Stanley G.H. (1957) A simple method for the isolation and purification of total lipids from animal tissues. J. Biol. Chem., 226, 497-509.
Ghioni C., Bell J.G., Bell M.V. & Sargent, J.R. (1997) Fatty acid composition, eicosanoid production and permeability in skin tissues of rainbow trout (Oncorhynchus mykiss) fed a control or an essential fatty acid deficient diet. Prostaglandins, Leukotrienes and Essential Fatty Acids, 56, 479-489.
Glencross B.D. & Smith D.M. (1999) The linoleic and linolenic acid requirements in the diet of the prawn, Penaeus monodon. Aquacult. Nutr., 5, 53-63.
Glencross B.D., Smith D.M., Thomas M.R. & Williams K.C. (2001) Optimising the essential fatty acid and total neutral lipid requirements for weight gain of the prawn, Penaeus monodon ; Aquaculture; IN PRESS.
Henderson R.J. & Tocher D.E. (1987) The lipid composition and biochemistry of freshwater fish. Prog. Lipid Res., 26, 281-347.
Kanazawa A., Teshima S., & Ono K. (1979) Relationship between essential fatty acid requirements of aquatic animals and the capacity for bioconversion of. linolenic acid to highly unsaturated fatty acids. Comp. Biochem. Physiol., 63B, 295-298.
Lee D.J., Roehm J.N., Yu T.C. & Sinnhuber R.O. (1967) Effect of 3 fatty acids on the growth rate of rainbow trout, Salmo gairdnerii. J. Nutr., 92, 93-98.
Lepage G. & Roy C.C. (1986) Direct transesterification of all classes of lipids in a one-step reaction. J. Lipid Res., 27, 114-120.
FRDC Project No. 96/392 Smith et al.
NSW Fisheries 67
Mourente G. & Tocher D.R. (1993) Incorporation and metabolism of 14C-labelled polyunsaturated fatty acids in juvenile gilthead sea bream Sparus aurata L. in vivo. Fish Physiol. Biochem., 10, 443-453.
Owen J.M., Adron J.W., Middleton C. & Cowey C.B. (1975) Elongation and desaturation of dietary fatty acids in turbot Scophthalmus maximus L, and rainbow trout, Salmo gairdnerii Rich. Lipids, 10, 528-531.
Robinson E.H. (1989) Channel catfish nutrition. Aquatic Sciences, 1, 365-391. Shepherd C.J., Bromage, N.R. (1988) Intensive Fish Farming. Oxford, BSP Professional Books. Stickney R.R. & Andrews J.W. (1972) Effects of dietary lipids on growth, food conversion, lipid
and fatty acid composition of channel catfish. J. Nutr., 102, 249-258. Stickney R.R. & McGeachin R.B. (1983) Response of young channel catfish to diets containing
purified fatty acids. Transactions of the American Fish. Soc., 112, 665-669. Stickney R.R., McGeachin R.B. & Robinson E.H. (1984) Effect of dietary linoleic acid level on
growth, food conversion and survival of channel catfish. J. World Mariculture Soc., 15, 186-190.
Takeuchi T. (1996) Essential fatty acid requirements in carp. Archiv Fur Tierernahrung, 49, 23-32. Takeuchi T. & Watanabe T. (1979) Effect of excess amounts of essential fatty acids on growth of
rainbow trout. Nippon Suisan Gakkaishi, 45, 1517-1519. Takeuchi T. & Watanabe T. (1977a) Dietary levels of methyl laurate and essential fatty acid
requirement of rainbow trout. Bull. Jap. Soc. Sci. Fish., 43, 893-898. Takeuchi T. & Watanabe T. (1977b) Effect of eicosapentenoic acid and docosahexaenoic acid in
pollock liver oil on growth and fatty acid composition of rainbow trout. Bull. Jap. Soc.Sci. Fish., 43, 947-953.
Takeuchi T., Arai S., Watanabe T. & Shimma Y. (1980) Requirement of eel Anguilla japonica for essential fatty acids. Bull. Jap. Soc. Sci. Fish., 46, 345-353.
Tocher D.R. (1990) Incorporation and metabolism of (n-3} and (n-6) polyunsaturated fatty acids in phospholipid classes in cultured rainbow trout (Salmo gairdneri) cells. Fish Physiol. Biochem., 8, 239-249.
Tocher D.R. & Dick J.R. (1990) Incorporation and metabolism of (n-3) and (n-6) polyunsaturated fatty acids in phospholipid classes in cultured Atlantic salmon (Salmo salar) cells. Comp. Biochem. Physiol., 96B, 73-79.
Tocher D.R., Dick J.R. & Sargent J.R. (1996) Stimulation of proliferation of an essential fatty acid-deficient fish cell line by C20 and C22 polyunsaturated fatty acids and effects on fatty acid composition. Prostaglandins, Leukotrienes and Essential Fatty Acids, 55, 345-356.
Watanabe T. (1982) Lipid nutrition in fish. Comp. Biochem. Physiol. 73B, 3-15. Watanabe T., Ogino C., Koshiishi Y. & Matsunaga T. (1974a) Requirement of rainbow trout for
essential fatty acids. Bull. Jap. Soc. Sci. Fish., 40, 493-499. Watanabe T., Utsue 0., Kobayashi L. & Ogino C. (1974b) Effect of dietary methyl linolenate on
fatty acid composition of lipids in rainbow trout. Bull. Jap. Soc. Sci. Fish., 40, 387-392. Watanabe T. Utsue O. Kobayashi L. & Ogino C. (1975a) Effect of dietary methyl linoleate and
linolenate on growth of carp I. Bull. Jap. Soc.Sci. Fish., 41, 257-262. Watanabe T., Takeuchi T. & Ogino C. (1975b) Effect of dietary methyl linoleate and linolenate on
growth of carp-II. Bull. Jap. Soc. Sci. Fish., 41, 263-269. Webster C.D., Tidwell J.H., Croodgame L.S. & Yancey D.H. (1994) Effects of fasting on fatty acid
composition of muscle, liver and abdominal fat in channel catfish Ictalurus punctatus. J. World Aquacult. Soc., 25, 126-134.
Winer B.J. (1971) Statistical Principles in Experimental Design. New York, McGraw-Hill. Yamada K., Kobayashi K. & Yone Y. (1980) Conversion of linolenic acid to n3-highly unsaturated
fatty acids in marine fishes and rainbow trout. Bull. Jap. Soc. Sci. Fish., 46,1231-1233.
Smith et al. FRDC Project No. 96/392
68 NSW Fisheries
4.6. Utilisation of digestible nitrogen and energy from four agricultural ingredients by juvenile silver perch Bidyanus bidyanus
Mark A. Booth & Geoff L. Allan
NSW Fisheries, Port Stephens Fisheries Centre, Private Bag 1, Nelson Bay NSW 2315
Abstract
A comparative slaughter, growth assay was conducted using juvenile silver perch to evaluate different inclusion contents of peanut meal, canola meal, meat meal and dehulled field peas. Each ingredient was combined with a nutritionally balanced basal diet composed mainly of fishmeal (27%), soybean meal (21%), wheat (28%) and sorghum (11%) such that between 15 and 75% of the basal diet was wholly replaced by the test ingredient. In addition, the basal diet was replaced with 15, 30 or 45% of an inert filler (diatomaceous earth) in order to compare diets containing test ingredients and the inert filler. Fish were fed respective test diets under a slightly restricted feeding regime (90% apparent satiation), twice a day for 56 days. Weight gain of silver perch decreased steadily as the basal diet was systematically replaced with diatomaceous earth, confirming the limiting contribution to weight gain from the basal diet under a restricted feeding regime. Silver perch fed diets containing a mixture of the basal diet and either peanut meal, meat meal, canola meal or up to 60% field peas gained more weight than fish fed diets containing similar contents of the inert filler, indicating silver perch were able to utilise these ingredients to support growth. Regression analysis was applied to investigate protein and energy retention and models were fitted with 95% confidence and prediction intervals. Inspection of these relationships indicated various outliers which greatly affected the fitted models. We postulate that these outliers represent test diets which contain ingredients that are poorly utilised, or poorly utilised at particular inclusion contents. Removal of these outliers greatly improved the fit of each model. Using this approach, the partial efficiency of digestible protein for growth above maintenance was constant at 0.45 after diets containing more than 45% of peanut meal and 75% of field peas were removed from the fitted model. The partial efficiency of digestible energy for growth above maintenance was constant at 0.68 after diets containing 75% of field peas and 75% of canola were removed from the fitted model. Adherence of other diets containing test ingredients to the slope of each regression suggests that silver perch are capable of utilising any of the protein sources tested at all but the inclusion contents described above. Confirmation of this approach under different feeding regimes is required.
Introduction
Silver perch Bidyanus bidyanus, is an omnivorous Australian freshwater species that is capable of efficiently digesting a wide range of intact protein and energy sources (Allan et al. 1999; Allan et al. 2000a; Booth et al. 2001). Digestibility for many of these ingredients is to be additive, which has allowed the least-cost formulation of commercial diets based on the protein and energy composition of ingredients and their respective digestibility coefficients (Allan et al. 2000b). The equitable performance of silver perch reared on diets containing meat meal, cereal grains, legumes or oilseeds, compared to fish fed on diets containing significant quantities of fishmeal, demonstrates this species is also able to utilise the protein and energy from these ingredients (Allan et al. 2000c; Booth et al. 2000). This apparent ability to readily utilise ingredients indicates that
FRDC Project No. 96/392 Smith et al.
NSW Fisheries 69
high levels of replacement may be possible, but, to recommend upper inclusion contents for particular ingredients, ingredient utilisation under increasing inclusion contents must be measured. The use of regression analysis to explore the relationships between nutrient intake and nutrient retention in fish has become more prevalent in aquaculture research (e.g. Lupatsch et al. 1998; Lupatsch et al. 2001a & b; Rodehutschord & Pfeffer 1999; Shearer 2000). Regression analysis is typically applied to data generated from dose-response experiments. The resulting relationships or models are usually used to estimate optimal nutrient requirements based on a maximum response in the variable of interest (Mercer 1982; Shearer 2000). Regression can also be used to estimate nutrient retention efficiency by evaluating the slope produced from the regression of nutrient intake data against nutrient accretion data (Rodehutschord & Pfeffer 1999; Lupatsch et al. 1998, 2001a & b). Data points may fit linear or non-linear models (Hepher 1988; Shearer 2000) and points which depart or deviate from the resultant slope may indicate that the nutrient of interest is being poorly utilised. If this departure can be linked to the source of the nutrient (i.e. the ingredient), then it may provide some biological measure of the suitability of the ingredient in meeting the nutritional needs of the animal at both low and high levels of inclusion. In this paper, we relate the retention of dietary protein and energy by juvenile silver perch to increasing contents of peanut meal, canola meal, dehulled field peas, meat meal or diatomaceous earth (inert filler). This experiment was designed to investigate the effects of increasing the content of each of the aforementioned ingredients at the expense of a balanced reference diet (Allan & Rowland 1992). As such, the practical measure of utilisation was expected to be shown by the difference in weight gain between fish fed a mix of the reference diet and a specific ingredient and the reference diet and the same content of the inert filler. Direct substitution of the reference diet with the test proteins inevitably resulted in a wide variation in the digestible protein (DP) and digestible energy (DE) contents of respective diets, effectively subjecting silver perch to a dose-response situation. Therefore, by evaluating the growth of fish in this experiment with respect to variations in ingredient content and the estimated digestible protein and energy content of test diets, we aimed to gain a greater insight into the overall response of silver perch to ingredient substitution and nutrient utilisation.
Materials and Methods
Diets
A 56 day growth experiment was performed in order to evaluate different inclusion contents of commercial grades of peanut meal, canola meal, a premium grade meat meal (Ridley Aquafeeds Pty., Ltd., Australia) and dehulled field peas Pisum sativum. Each ingredient was systematically combined with a nutritionally balanced basal diet (SP35; Table 1; Allan & Rowland 1992; Allan et al. 1999) composed mainly of fishmeal (27%), soybean meal (21%), wheat (28%) and sorghum (11%) such that between 15 and 75% of the basal diet was wholly replaced by the test ingredient. In addition, the basal diet was systematically replaced with 15, 30 and 45% of diatomaceous earth (Melcann Ltd., West Footscray, VIC, Australia) (Tables 1 & 2). In total, 24 diets were manufactured for this experiment. The basal diet mixture was sourced as a mash (Janos Hoey Pty., Ltd., Forbes, NSW, Australia), and did not contain added vitamins or minerals. All test diets and the basal diet mixture were later fortified with 7.5 g kg-1 (dry basis) of a formulated vitamin/mineral pre-mix (Table 1). Diets were prepared by dry mixing the basal diet mixture, vitamins and minerals and test ingredients in their selected ratios before passing them through a laboratory scale hammer mill (Raymond Laboratory Mill, Transfield Technologies, Rydalmere, Australia) fitted with a 1.5 mm screen. Diets were then thoroughly re-mixed (Hobart Mixer: Troy Pty Ltd, City OH, USA) and combined with distilled water before being cold pelleted through a meat mincer fitted with a 2.0 mm pellet die (Barnco Australia Pty Ltd, Leichhardt, NSW,
Smith et al. FRDC Project No. 96/392
70 NSW Fisheries
Australia). Wet diets were dried in a convection drier (< 350C) for about six hours or until moisture contents were < 100 g kg-1. Following preparation, all diets were stored at < -15ºC until required. Fish and feeding strategy
Silver perch Bidyanus bidyanus were bred at the NSW Fisheries Grafton Research Centre and raised in earthen ponds using similar techniques to those described by Thurstan & Rowland (1994) before being transported to Port Stephens Fisheries Centre (PSFC). Before experiments, silver perch were fed exclusively on SP35 and periodically treated with 5-10 g l-1 NaCl to ensure they were free of ectoparasites and to prevent fungal infection (Rowland & Ingram 1991). Fish were anaesthetised using a bath of ethyl ρ-aminobenzoate (20-30 mg l-1), then caught at random, weighed individually then systematically distributed to 70 l experiment tanks. Eight fish (3.01 g ± 0.01; mean ± sem) were stocked into each aquaria with three aquaria randomly assigned to each dietary treatment. A representative selection of fish from the same pool were killed and frozen for initial chemical analysis. After stocking, fish were acclimatised to their respective test diets for 12 days during which time they were fed twice daily (0830 and 1500 h) to establish apparent satiation levels. After the acclimatisation phase, fish from individual aquaria were sedated and bulk weighed and then fish were switched to a slightly restricted feeding regime based on 90% of their current biomass (Jobling 1983). Fish were fed a slightly restricted ration to overcome perceived palatability problems and prevent fish increasing feed intake in response to any nutritional deficiencies. Fish were subsequently sedated and weighed every 14 days thereafter to adjust their feeding rations. When fish failed to consume their total ration on consecutive days, feed inputs were reduced accordingly. Any uneaten feed was collected from each tank after 20 – 30 min, dried to a constant weight and subtracted from the total feed input for that tank at the conclusion of the experiment. Fish which died during the experiment were weighed and replaced with weighed, fin clipped fish to maintain the stocking density of each aquaria. Fin clipped fish were identified at the end of the experiment and excluded from calculations involving weight gain and nutrient deposition. At the completion of the experiment, a representative selection of fish was removed from each aquaria, killed with an overdose of ethyl ρ-aminobenzoate and frozen (< -15° C) for chemical analysis. Laboratory facilities
Individual aquaria were supplied with continuously-flowing (400 – 500 ml min-1), temperature controlled water. Before reaching experiment tanks, re-circulated water was filtered through a rapid sand filter and a cartridge filter (nominal pore size 10 µm), then passed through a 2 m3 trickling bio-filter and an ultra-violet steriliser (Vf-9 Big Blue, Australian Ultra-Violet Products Proprietary. Limited, Seven Hills, NSW, Australia). Approximately 25% of water was exchanged each day. Each tank was covered with a clear perspex lid and aerated with two air-stone diffusers. Fluorescent lighting was automatically controlled to provide a 12 h light (0600 h to 1800 h) and 12 h dark photo-period. Water temperature (range 23.4 to 27.1°C), dissolved oxygen (range 4.6 to 8.0 mg l-1) and pH (between 6.9 and 8.5) were monitored regularly with a Model 611-Intelligent Water Quality Analyser (Yeo-Kal Electronics Proprietary Ltd, Brookvale, NSW, Australia). Colourimetric methods were adopted to measure total ammonia nitrogen (Dal Pont, Hogan & Newell 1973) and nitrite (Major, Dal Pont, Kyle & Newell 1972) once per week from 18-20 experiment tanks. Total ammonia-N remained below 600 µg l-1 and N02-N remained below 200 µg l-1 during the course of the trial. Chemical analyses
Chemical analyses (excluding gross energy) of feeds and whole fish were performed by the State Chemistry Laboratory (SCL) (Victoria Agriculture, Werribee, Australia). Nitrogen was determined from an adaptation of the standard Kjeldahl method (AOAC 1995) using an automated Tecator
FRDC Project No. 96/392 Smith et al.
NSW Fisheries 71
distillation apparatus. Fat was extracted from samples with diethyl ether in a continuous extraction procedure using an automated Soxtherm apparatus (Gerhardt) after which oven dried residue was weighed to calculate crude fat (AOAC 1995). Moisture and ash for feed samples were determined according to AOAC (1995), however, ash values for carcass samples were determined by difference. Gross energy analysis (bomb calorimetry) on feeds and whole fish were performed by the South Australian Research and Development Institute (SARDI) on sub-samples drawn from those prepared by SCL (Tables 2 & 3). Calculations
Silver perch fed the reference diet exhibited exponential growth with respect to time (weight (g) = 2.920.0265*day ; R2 = 0.99). As such, body weight (BW) was calculated as the geometric mean according to the formula presented in Lupatsch et al. (2001b) where BW = (initial weight x final weight)0.5. To our knowledge, the metabolic weights of protein and energy have not been determined for silver perch. Therefore, an iterative approach using linear regression analysis, similar to that presented in Rodehutscord and Pfeffer (1999), was used to estimate a weight exponent to which BW could be referred. Using this approach, a linear model based on BW raised to the power of 0.6 explained more of the variability in the data for each nutrient than models where BW was standardised by raising data to a power of 0.8 or 1.0, respectively (Table 4). Subsequently, intake and nutrient accretion data were standardised by referring original data values to the metabolic body weight of 0.6 (e.g. g kgBW-0.6 d-1 or kJ kgBW-0.6 d-1). Unless otherwise stated, all data displayed in figures represents the average value of three replicate tanks. Digestible nutrient values were calculated using the analytically measured nutrient contents of test ingredients and the reference diet and the apparent digestibility coefficients (ADC’s) for these components which were previously determined for silver perch; ADC’s are based on data for 30% dietary substitutions (Allan et al. 1999 & 2000; Booth et al. 2001). Curve fitting
After preliminary evaluation of the data sets, the relationship between dietary DP content and protein deposition was fitted with a 2nd order polynomial regression. The relationship between DP intake and protein deposition was adequately described by a simple linear regression. Both models were fitted with 95% confidence and prediction intervals. Inspection of these figures indicated various outliers which greatly affected the fitted models. Our premise is, that these outliers represent test diets which contain ingredients that are either poorly utilised or are poorly utilised at particular inclusion contents. Thus, exclusion of these outliers improves (reduces) the error term associated with each model, subsequently improving the R2 statistic. Only data points which fell outside the 95% prediction intervals were excluded from respective models. Similar procedures were applied to investigate the relationship between DE intake and energy deposition in silver perch. In this case, the relationship was best described by a simple linear regression. All regressions and statistical analysis were performed using Statgraphics Plus V4.1 (Manugistics® Incorporated, Rockville, MD, USA).
Results
There was an inverse relationship between the whole body moisture and whole body fat content of fish. In addition, the fat content of whole fish carcass appeared to be affected by the lipid content of the respective dietary treatments, and increased as dietary lipid content approached 6% (Table 3). Comparative performance indices for silver perch reared on test diets are presented in Table 5. Two data point outliers which corresponded to diets which contained 75% each of field peas or canola meal were removed from the model which described the relationship between DP content of test diets and protein deposition (Figure 1). Removal of these points increased the adjusted R2
Smith et al. FRDC Project No. 96/392
72 NSW Fisheries
statistic for this particular relationship from 0.69 to 0.84 with ANOVA indicating a highly significant relationship between the variables (F = 55.4; P < 0.0001; Equation 1). Equation 1 was used to predict the dietary DP content that gave maximum protein deposition. This value was 41.1%. Protein deposition (g kgBW-0.6 d-1) = -0.00126x2 + 0.1037x – 1.587 (Equation 1) The relationship between DP intake and protein deposition was linear and indicated that protein deposition was not limited by DP intake in this study (Figure 2). In this case, four outliers were excluded from the full data set corresponding to diets which contained 45, 60 or 75% peanut meal and those diets containing 75% field peas. Exclusion of these points improved the R2 statistic from 0.71 to 0.89 with ANOVA indicating a highly significant relationship between the variables (F = 106.5; P < 0.0001; Equation 2). Protein deposition (g kgBW-0.6 d-1) = 0.452x – 0.276 (Equation 2) An estimate of the protein requirement for maintenance (zero protein deposition) was made by extrapolation of Equation 2 to the x axis. This requirement was found to be 0.61g DP kgBW-0.6 d-1. Based on this equality, the partial efficiency of DP for growth above maintenance was constant and determined as 0.45. The relationship between DE intake and energy deposition was linear and was improved by removal of two outliers corresponding to diets which contained 75% field peas and 75% peanut meal (Figure 3). This improved the R2 statistic from 0.76 to 0.92 with ANOVA indicating a highly significant relationship between the variables (F = 224.0; P < 0.0001; Equation 3). Energy deposition was not limited by DE intake within the range investigated in this study. Energy requirements for maintenance in this study were estimated to be approximately 37.76 kJ kgBW-0.6 d-1 while the partial efficiency of DE for growth above maintenance was found to be 0.68 (Equation 3). Energy deposition (kJ kgBW-0.6 d-1) = 0.682x – 25.096 (Equation 3)
Discussion
In this study, weight gain of silver perch decreased steadily as the basal diet was systematically replaced with higher contents of diatomaceous earth, confirming the limiting contribution to weight gain from the basal diet under a restricted feeding regime. Silver perch fed diets containing a mixture of the basal diet and either peanut meal, meat meal, field peas (excluding the 75% inclusion level) or canola meal gained more weight under this protocol than fish fed diets containing similar contents of diatomaceous earth, indicating that silver perch were able to utilise these particular agricultural ingredients to support growth (protein deposition). Appraisal under a nutrient-response relationship identified that the increase in weight gain of silver perch in this study may have been strongly related to the intake of dietary protein or energy. Generally, the relationships between intake and physical accretion of ingested nutrients are thought to be graded and systematic in nature (Mercer 1982; Shearer 2000). The approach taken in this paper depends on the premise that, like other fish species, silver perch probably exhibit a predetermined, biologically driven pattern of growth. This pattern will, however, be affected by environmental and nutritional factors acting on the fish. Such a concept is discussed in a review by Bureau et al. (2000). The pattern of growth is therefore a “plastic one”, able to respond to the positive and negative factors impacting on it (Brett 1979; Bureau et al. 2000). In our study, we rely
FRDC Project No. 96/392 Smith et al.
NSW Fisheries 73
on the premise that although growth may respond to these factors, there is an underlying pattern of growth that is identifiable and relatively stable. This pattern can then be used to identify and exclude diets (i.e. in our case = ingredients) which result in departures from the “normal” modelled response. Secondly, after removal of outlying data points which belong to diets that we suggest are poorly utilised, the modelled response should be comparable to those presented for silver perch or other, similar species. This assumption was first checked by comparing the response of silver perch to increasing levels of dietary DP in our trial to those of an earlier experiment with fish of similar size (Allan et al. 2001). Optimum DP requirements for silver perch were previously determined using intersecting linear regression analysis after fish were fed diets in which DP varied between 9.5 and 40.4% and DE was held constant (13.4 – 15 MJ kg-1 diet; Allan et al. 2001). The optimum dietary DP (that content after which further increases in weight gain with increasing DP were not significant) was estimated as 28%. By re-analysing their original data set with a 2nd order polynomial regression, the dietary DP content which was predicted to give maximum protein deposition was 38.6%. This value is similar but slightly lower to 41.1% determined in this study. The possibility that we may have overestimated the DP and DE content of diets with high inclusion contents of the test ingredients in the present study cannot be discounted, as we used values based on apparent digestibility coefficients determined for 30% inclusion contents. Comparisons with published values for the utilisation efficiency of DP and DE can also be made. We determined that values for the coefficients of utilisation for DP and DE are constant (linear) at 0.45 and 0.68, respectively. An indication of the coefficient of utilisation for DP from the linear portion of the data presented in Allan et al. (2001) was found to be 0.34. For species such as channel catfish, the utilisation coefficient for crude protein derived from a series of purified diets averaged about 0.26 (Gatlin III et al. 1986). After interpretation of the linear portion of data presented in Jauncey (1982), the coefficient of utilisation for crude protein (white fish meal) in juvenile tilapia Sarotherodon mossambicus of similar size to silver perch used in our study was found to be 0.40, while the utlisation coefficient of metabolisable energy for growth above maintenance in tilapia Oreochromis niloticus was found to be about 0.67 (Meyer-Burgdorff et al. 1989). In separate studies, Lupatsch et al. (1988 and 2001b) found that utilisation of DE for growth above maintenance in gilthead seabream Sparus aurata was linear and ranged between 0.46 and 0.50 regardless of energy intake. In the same studies, utilisation of DP for growth above maintenance ranged between 0.28 (linear response) and an optimum of 0.47 (exponential response) (Lupatsch et al. 1988 and 2001b). Azevedo et al. (1998) and Rodehutscord & Pfeffer (1999) determined that the utilisation of DE for growth above maintenance in rainbow trout Oncorhynchus mykiss was 0.61 and 0.68, respectively. Similarly utilisation of DE and DP for growth above maintenance in European seabass Dicentrarchus labrax were linear at 0.68 and 0.52, respectively (Lupatsch et al. 2001a). The close agreement of our values to those presented by the aforementioned authors would appear to indicate that the responses seen in this study to nutrient density and nutrient intake are both systematic and realistic. Protein utilisation of the diets tested in this study was constant at 0.45 after all diets which contained more than 45% of peanut meal and 75% of field peas were excluded from the data set (Figure 2). Energy utilisation was constant at 0.68 after diets containing 75% of field peas and canola meal were removed from the data set. Adherence of other diets to the slope produced by each of these regressions suggests that silver perch are capable of utilising any of the protein sources tested in this study at all but the inclusion contents just described. Silver perch also exhibit a high apparent protein digestibility for the ingredients tested in this trial, with values for peanut meal, meat meal, field peas and canola of 98, 71, 88 and 83% respectively (Allan et al. 2000a; Booth et al. 2001). A high coefficient of digestibility may therefore be indicative of the ability of silver perch to utilise protein from these ingredients. Grow-out trials have further demonstrated the ability of silver perch to readily utilise diets which contain a variety of agricultural protein sources
Smith et al. FRDC Project No. 96/392
74 NSW Fisheries
at various inclusion contents. Ingredients used include meat meal, corn gluten, soybean meal, canola meal, peanut meal, lupins, wheat, sorghum and millrun (Stone et al. 2000; Allan et al. 2000b & c). These diets were generally formulated to DP and DE densities of 35% and 14MJ kg-1, respectively, with dietary contents of close to 40% meat meal and 30% wheat promoting the same weight gains as that of a commercial silver perch control diet (Allan et al. 2000c). While a practical formulation for an aquaculture diet would be unlikely to contain more than 40 or 50% of any ingredient, other than fish meal, the fact that silver perch are capable of utilising locally available ingredients at high dietary inclusion contents gives feed manufacturers greater flexibility with their formulations. Feeding fish either a satiation or ad-libitum ration may have changed the outcome of the approach used in this study, possibly reducing the efficiency of utilisation; assuming that maintenance costs remained similar. Feeding below satiation may also mask palatability or intake effects related to particular ingredients, especially as inclusion contents increase (Lupatsch et al. 2001b). These issues should be investigated as the value of an ingredient is determined by its influence on both nutrient utilisation and intake. Formulating diets for silver perch with balanced DP and DE densities but with varying amounts of the ingredients tested in the present study (excluding peanut meal above 30%, canola and field peas above 60%) should produce similar weight gains, at least for juvenile fish, provided no other nutrients are deficient.
Acknowledgments
The authors would like to acknowledge Ms Rebecca Warner-Smith, Mr Matt Goodwin and Mr David Stone for their technical help during the experiment. Thanks also to Dr Wayne O’Connor and Mr Stewart Fielder (PSFC) and Dr David Smith (CSIRO) for their useful comments on the manuscript. We extend special thanks to Ms Helena Heasman for her expert preparation of this document. We thank the State Chemistry Laboratory (SCL) of Victoria for analysis of the ingredient, diet and fish samples arising from this work. This work was funded by the Fisheries Research and Development Corporation (FRDC) and forms part of the Aquaculture Diet Development Subprogram.
References
Allan G.L. & Rowland S.J. (1992) Development of an experimental diet for silver perch (Bidyanus bidyanus). Austasia Aquaculture, 6, 39-40.
Allan G.L., Rowland S.J., Parkinson S., Stone D.A.J. & Jantrarotai W. (1999) Nutrient digestibility for juvenile silver perch Bidyanus bidyanus (Mitchell): development of methods. Aquaculture, 170, 131-145.
Allan G.A., Parkinson S., Booth M.A., Stone D.A.J., Rowland S.J., Frances J. & Warner-Smith R. (2000a) Replacement of fish meal in diets for Australian silver perch Bidyanus bidyanus: I. Digestibility of alternative ingredients. Aquaculture, 186, 293-310.
Allan G.L., Rowland S.J., Mifsud C., Glendenning D., Stone D.A.J. & Ford A. (2000b) Replacement of fish meal in diets for Australian silver perch Bidyanus bidyanus V. Least cost formulation of practical diets. Aquaculture, 186, 327-340.
Allan G.L., Stone D.A.J., Booth M.A. & Rowland S.J. (2000c) No fishmeal needed for new high performance silver perch diets. NSW Fisheries Magazine, Summer 2000, 44-45.
Allan G.L, Johnson R.J., Booth M.A. & Stone D.A.J. (2001) Estimating digestible protein requirements of silver perch, Bidyanus bidyanus Mitchell. Aquacult. Res., 32, 337-347.
AOAC (1995) Official methods of analysis of the association of official chemists. (Helrich, K. ed.), 15th ed., Published by the Association of the Official Analytical Chemists, Inc., Arlington, Virginia, USA.
FRDC Project No. 96/392 Smith et al.
NSW Fisheries 75
Azevedo P.A., Cho C.Y., Leeson S. & Bureau D.P. (1988) Effects of feeding level and water temperature on growth, nutrient and energy utilisation and waste outputs of rainbow trout (Oncorhynchus mykiss). Aquat. Living Res., 11, 227-238.
Booth M.A., Allan G.L. & Warner-Smith, R. (2000) Effects of grinding, steam conditioning and extrusion of a practical diet on digestibility and weight gain of silver perch, Bidyanus bidyanus. Aquaculture, 182, 287-299.
Booth M.A., Allan G.L., Frances J. & Parkinson S. (2001) Replacement of fish meal in diets for Australian silver perch Bidyanus bidyanus IV. Effects of dehulling and protein concentration on digestibility of grain legumes. Aquaculture, 196, 67-85.
Brett J.R. (1979) Environmental factors and growth. Chapter 10. Fish Physiology Vol. III, Academic Press Inc.
Bureau D.P., Azevedo P.A., Tapia-Salazar M. & Cuzon G. (2000) Pattern and cost of growth and nutrient deposition in fish and shrimp: potential implications and applications. In: Cruz-Suarez L.E., Ricque-Marie D., Tapia-Salazar M., Olvera-Novoa M.A. & Civera-Cerecedo R., (Eds.) Avances en Nutricion Acuicola V. Memorias del V Simposium Internacional de Nutricion Acuicola. 19-22 November 2000, Merida, Yucatan, Mexico.
Dal Pont G., Hogan M. & Newell B. (1973) Laboratory Techniques in Marine Chemistry. 2. Determination of ammonia in seawater and the preservation of samples for nitrate analysis. Aust. C.S.I.R.O. Div. Fish. Oceanogr. Rep., C.S.I.R.O., Sydney, 11 pp.
Gatlin III D.M., Poe W.E. & Wilson R.P. (1986) Protein and energy requirements of fingerling channel catfish for maintenance and maximum growth. J. Nutr., 116, 2121-2131. Hepher B. (1988) Nutrition of Pond Fishes. Cambridge University Press. Cambridge, U.K.. 387 pp. Jauncey K. (1982) The effects of varying dietary protein level on the growth, food conversion,
protein utilisation and body composition of juvenile tilapias (Sarotherodon mossambicus). Aquaculture, 27, 43-54.
Jobling M. (1983) Growth studies with fish – overcoming the problems of size variation. J. Fish Biol., 22, 153-157.
Lupatsch I., Kissil G.W.M., Sklan D. & Pfeffer E. (1998) Energy and protein requirements for maintenance and growth in gilthead seabream (Sparus aurata L). Aquacult. Nutr., 4, 165-173.
Lupatsch I., Kissil G.W.M. & Sklan D. (2001a) Optimisation of feeding regimes for European sea bass Dicentrarchus labrax: a factorial approach. Aquaculture, 202, 289-302.
Lupatsch I., Kissil G.W.M., Sklan D. & Pfeffer E. (2001b) Effects of varying dietary protein and energy supply on growth, body composition and protein utilisation in gilthead seabream (Sparus aurata L). Aquacult. Nutr., 7, 71-80.
Major G.A., Dal Pont J., Kyle J. & Newell B. (1972) Laboratory Techniques in Marine Chemistry. A Manual. Aust. C.S.I.R.O. Div. Fish. Oceanogr. Rep. No. 51, C.S.I.R.O., Sydney, 55 pp.
Mercer L.P. (1982) A quantitative nutrient-response relationship. J. Nutr., 112, 560-566. Meyer-Burgdorff K.H., Osman M.F. & Gunther K.D. (1989) Energy metabolism in Oreochromis
niloticus. Aquaculture, 79, 283-291. Rodehutscord M. & Pfeffer E. (1999) Maintenance requirement for digestible energy and
efficiency of utilisation of digestible energy for retention in rainbow trout, Oncorhynchus mykiss. Aquaculture, 179, 95-107.
Rowland S.J. & Ingram B.A. (1991) Diseases of Australian Native Fishes. Fisheries Bulletin, 4. NSW Fisheries, Sydney, NSW, Australia.
Shearer K.D. (2000) Experimental design, statistical analysis and modelling of dietary nutrient requirement studies in fish: a critical review. Aquacult. Nutr., 6, 91-102.
Stone D.A.J., Allan G.L., Parkinson S. & Rowland S.J. (2000) Replacement of fish meal in diets for Australian silver perch Bidyanus bidyanus III. Digestibility and growth using meat meal products. Aquaculture, 186, 311-326.
Thurstan S.J. & Rowland S.J. (1994) Techniques for the hatchery production of silver perch. In: Rowland, S.J. & Bryant, C. (Eds.), Silver Perch Culture. Proc. Silver Perch Aquaculture
Smith et al. FRDC Project No. 96/392
76 NSW Fisheries
Workshops, Grafton and Narrandera, April 1994. Austasia Aquaculture for NSW Fisheries, 29-39.
FRDC Project No. 96/392 Smith et al.
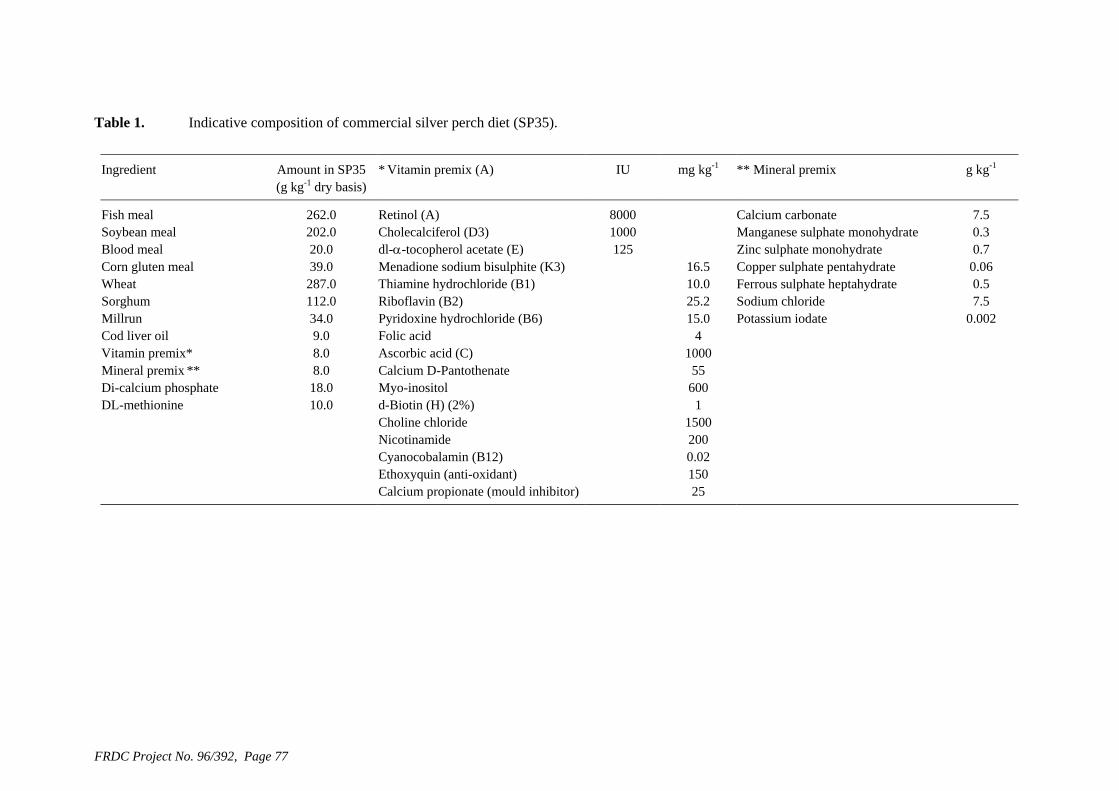
Table 1. Indicative composition of commercial silver perch diet (SP35).
Ingredient Amount in SP35 (g kg-1 dry basis)
* Vitamin premix (A) IU mg kg-1 ** Mineral premix g kg-1
Fish meal 262.0 Calcium carbonate
meal te (K3) Copper sulphate pentahydrate 287.0 Ferrous sulphate heptahydrate
acid (C)
2%)
Retinol (A) 8000 7.5 Soybean meal 202.0 Cholecalciferol (D3) 1000 Manganese sulphate monohydrate
Zinc sulphate monohydrate 0.3 0.7 Blood meal
Corn gluten20.0 39.0
dl-α-tocopherol acetate (E) Menadione sodium bisulphi
125
16.5 0.06 Wheat Thiamine hydrochloride (B1)
10.0 0.5
Sorghum 112.0 Riboflavin (B2) 25.2 Sodium chloride 7.5Millrun 34.0 Pyridoxine hydrochloride (B6) 15.0 Potassium iodate 0.002 Cod liver oil 9.0 Folic acid
Ascorbic 4
Vitamin premix* 8.0 1000 Mineral premix ** 8.0 Calcium D-Pantothenate 55Di-calcium phosphate 18.0 Myo-inositol
d-Biotin (H) ( 600
DL-methionine 10.0 1 Choline chloride 1500 Nicotinamide 200 Cyanocobalamin (B12) 0.02 Ethoxyquin (anti-oxidant) 150
Calcium propionate (mould inhibitor) 25
FRDC Project No. 96/392, Page 77
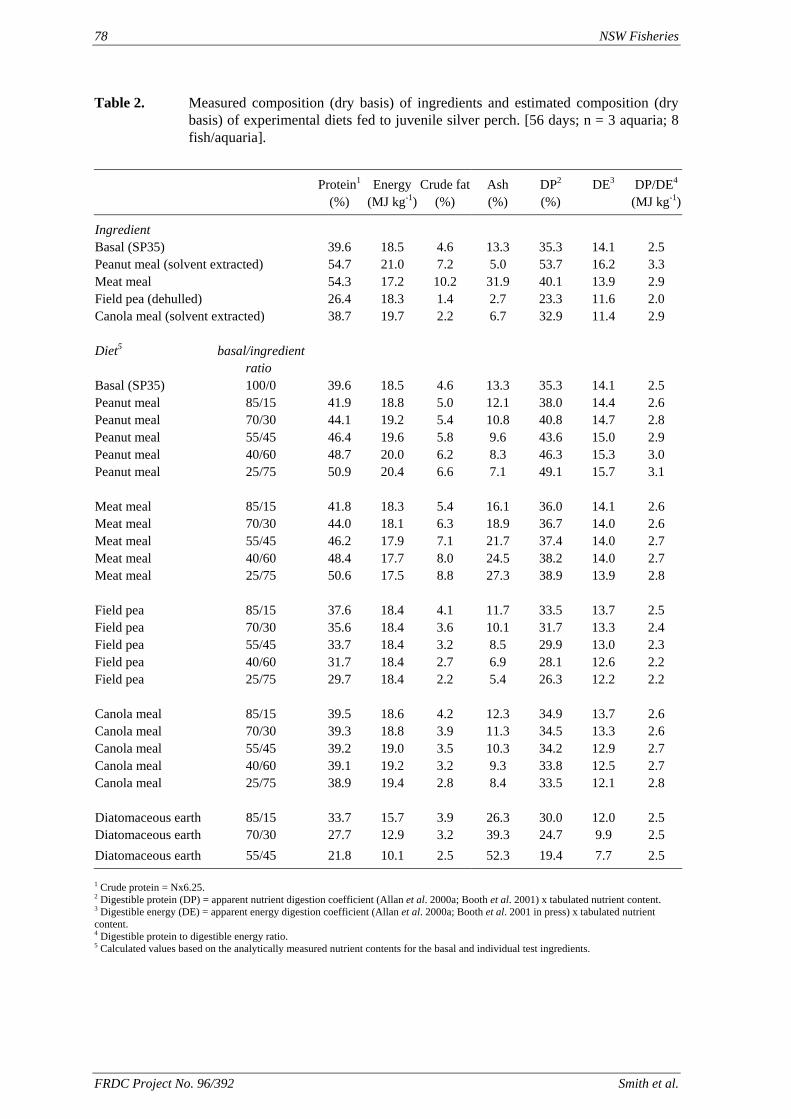
78 NSW Fisheries
Table 2. Measured composition (dry basis) of ingredients and estimated composition (dry basis) of experimental diets fed to juvenile silver perch. [56 days; n = 3 aquaria; 8 fish/aquaria].
Protein1
(%) Energy
(MJ kg-1)Crude fat
(%) Ash (%)
DP2
(%) DE3 DP/DE4
(MJ kg-1)
Ingredient
54.3 2.7
2.9
ratio 4.6
14.4 2.6 Peanut meal 70/30 19.2 40.8
8.3 15.3 3.1
41.8 5.4 16.1 14.1 44.0 18.1
37.6
29.9
Basal (SP35) 39.6 18.5 4.6 13.3 35.3 14.1 2.5 Peanut meal (solvent extracted) 54.7 21.0 7.2 5.0 53.7 16.2 3.3 Meat meal 17.2 10.2 31.9 40.1 13.9 2.9 Field pea (dehulled) 26.4 18.3 1.4 23.3 11.6 2.0 Canola meal (solvent extracted) 38.7 19.7 2.2 6.7 32.9 11.4 Diet5 basal/ingredient
Basal (SP35) 100/0 39.6 18.5 13.3 35.3 14.1 2.5 Peanut meal 85/15 41.9 18.8 5.0 12.1 38.0
44.1 5.4 10.8 14.7 2.8 Peanut meal 55/45 46.4 19.6 5.8 9.6 43.6 15.0 2.9 Peanut meal 40/60 48.7 20.0 6.2 46.3 3.0 Peanut meal 25/75 50.9 20.4 6.6 7.1 49.1 15.7
Meat meal 85/15 18.3 36.0 2.6 Meat meal 70/30 6.3 18.9 36.7 14.0 2.6 Meat meal 55/45 46.2 17.9 7.1 21.7 37.4 14.0 2.7 Meat meal 40/60 48.4 17.7 8.0 24.5 38.2 14.0 2.7 Meat meal 25/75 50.6 17.5 8.8 27.3 38.9 13.9 2.8 Field pea 85/15 18.4 4.1 11.7 33.5 13.7 2.5 Field pea 70/30 35.6 18.4 3.6 10.1 31.7 13.3 2.4 Field pea 55/45 33.7 18.4 3.2 8.5 13.0 2.3 Field pea 40/60 31.7 18.4 2.7 6.9 28.1 12.6 2.2 Field pea 25/75 29.7 18.4 2.2 5.4 26.3 12.2 2.2 Canola meal 85/15 39.5 18.6 4.2 12.3 34.9 13.7 2.6 Canola meal 70/30 39.3 18.8 3.9 11.3 34.5 13.3 2.6 Canola meal 55/45 39.2 19.0 3.5 10.3 34.2 12.9 2.7 Canola meal 40/60 39.1 19.2 3.2 9.3 33.8 12.5 2.7 Canola meal 25/75 38.9 19.4 2.8 8.4 33.5 12.1 2.8 Diatomaceous earth 85/15 33.7 15.7 3.9 26.3 30.0 12.0 2.5 Diatomaceous earth 70/30 27.7 12.9 3.2 39.3 24.7 9.9 2.5 Diatomaceous earth 55/45 21.8 10.1 2.5 52.3 19.4 7.7 2.5
1 Crude protein = Nx6.25. 2 Digestible protein (DP) = apparent nutrient digestion coefficient (Allan et al. 2000a; Booth et al. 2001) x tabulated nutrient content. 3 Digestible energy (DE) = apparent energy digestion coefficient (Allan et al. 2000a; Booth et al. 2001 in press) x tabulated nutrient content. 4 Digestible protein to digestible energy ratio. 5 Calculated values based on the analytically measured nutrient contents for the basal and individual test ingredients.
FRDC Project No. 96/392 Smith et al.
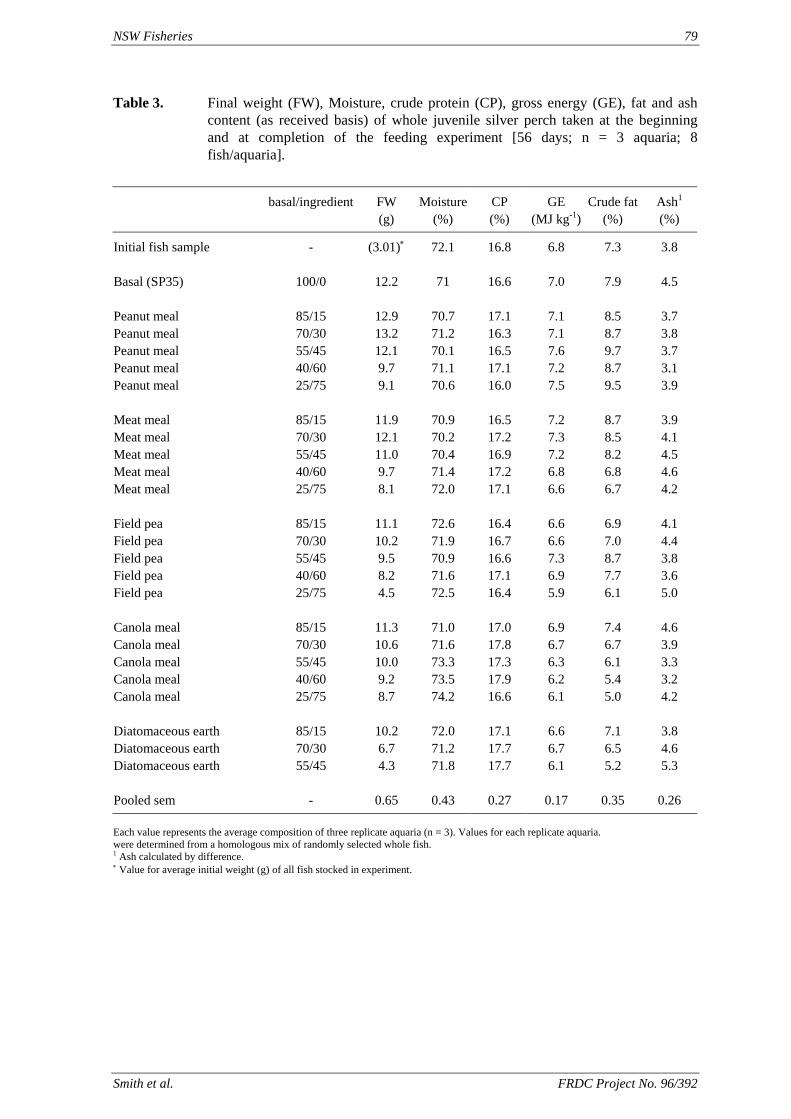
NSW Fisheries 79
Table 3. Final weight (FW), Moisture, crude protein (CP), gross energy (GE), fat and ash content (as received basis) of whole juvenile silver perch taken at the beginning and at completion of the feeding experiment [56 days; n = 3 aquaria; 8 fish/aquaria].
basal/ingredient FW Moisture CP GE Crude fat Ash1 (g) (%) (%) (MJ kg-1) (%)
- 72.1 6.8 7.3 Basal (SP35) 100/0 12.2 16.6
70/30 13.2 71.2 16.3 7.1 8.7 3.8 Peanut meal 55/45 12.1 70.1 16.5 7.6 9.7 3.7 Peanut meal 40/60 9.7 71.1 17.1 7.2 8.7 3.1 Peanut meal 25/75 9.1 70.6 16.0 7.5 9.5 3.9 Meat meal 85/15 11.9 70.9 16.5 7.2 8.7 3.9 Meat meal 70/30 12.1 70.2 17.2 7.3 8.5 4.1 Meat meal 55/45 11.0 70.4 16.9 7.2 8.2 4.5 Meat meal 40/60 9.7 71.4 17.2 6.8 6.8 4.6 Meat meal 25/75 8.1 72.0 17.1 6.6 6.7 4.2 Field pea 85/15 11.1 72.6 16.4 6.6 6.9 4.1 Field pea 70/30 10.2 71.9 16.7 6.6 7.0 4.4 Field pea 55/45 9.5 70.9 16.6 7.3 8.7 3.8 Field pea 40/60 8.2 71.6 17.1 6.9 7.7 3.6 Field pea 25/75 4.5 72.5 16.4 5.9 6.1 5.0 Canola meal 85/15 11.3 71.0 17.0 6.9 7.4 4.6 Canola meal 70/30 10.6 71.6 17.8 6.7 6.7 3.9 Canola meal 55/45 10.0 73.3 17.3 6.3 6.1 3.3 Canola meal 40/60 9.2 73.5 17.9 6.2 5.4 3.2 Canola meal 25/75 8.7 74.2 16.6 6.1 5.0 4.2 Diatomaceous earth 85/15 10.2 72.0 17.1 6.6 7.1 3.8 Diatomaceous earth 70/30 6.7 71.2 17.7 6.7 6.5 4.6 Diatomaceous earth 55/45 4.3 71.8 17.7 6.1 5.2 5.3 Pooled sem - 0.65 0.43 0.27 0.17 0.35 0.26
(%)
Initial fish sample (3.01)∗ 16.8 3.8
71 7.0 7.9 4.5
Peanut meal 85/15 12.9 70.7 17.1 7.1 8.5 3.7 Peanut meal
Each value represents the average composition of three replicate aquaria (n = 3). Values for each replicate aquaria. were determined from a homologous mix of randomly selected whole fish. 1 Ash calculated by difference. ∗ Value for average initial weight (g) of all fish stocked in experiment.
Smith et al. FRDC Project No. 96/392
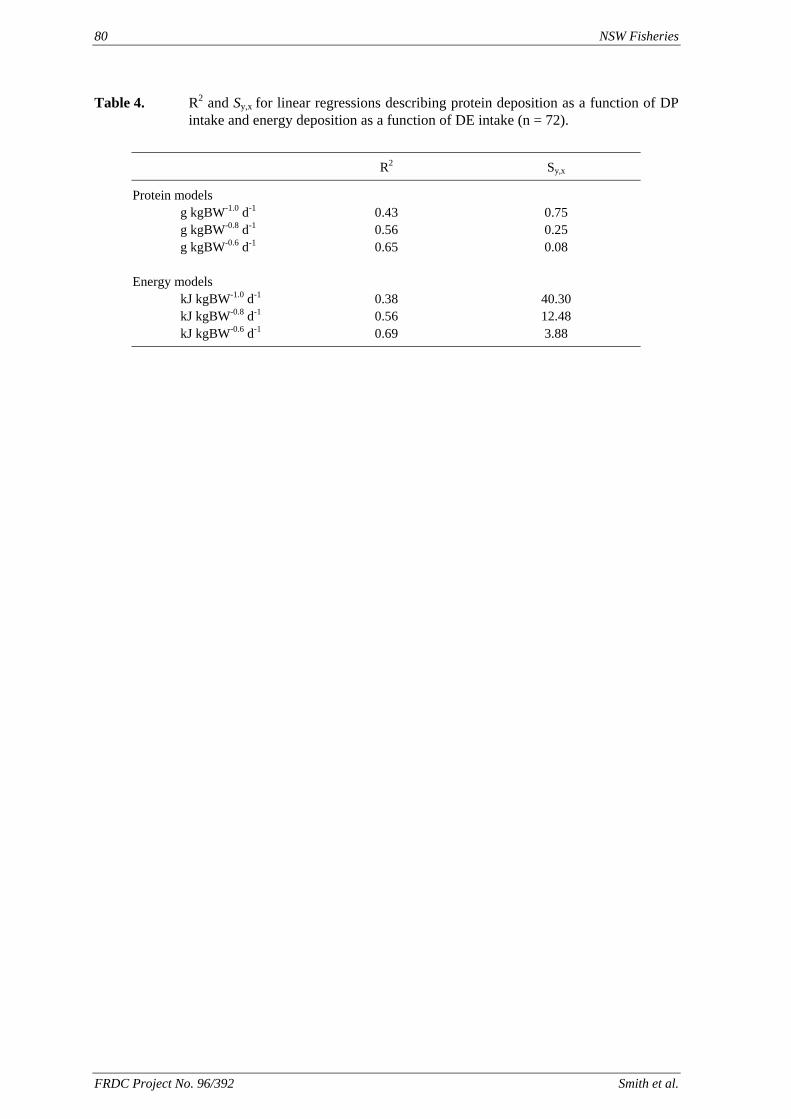
80 NSW Fisheries
Table 4. R2 and Sy,x for linear regressions describing protein deposition as a function of DP intake and energy deposition as a function of DE intake (n = 72).
R2 Sy,x
Protein models g kgBW-1.0 d-1 0.43
0.75 g kgBW-0.8 d-1 0.56 0.25 g kgBW-0.6 d-1 0.65 0.08 Energy models kJ kgBW-1.0 d-1 0.38 40.30 kJ kgBW-0.8 d-1 0.56 12.48 kJ kgBW-0.6 d-1 0.69 3.88
FRDC Project No. 96/392 Smith et al.
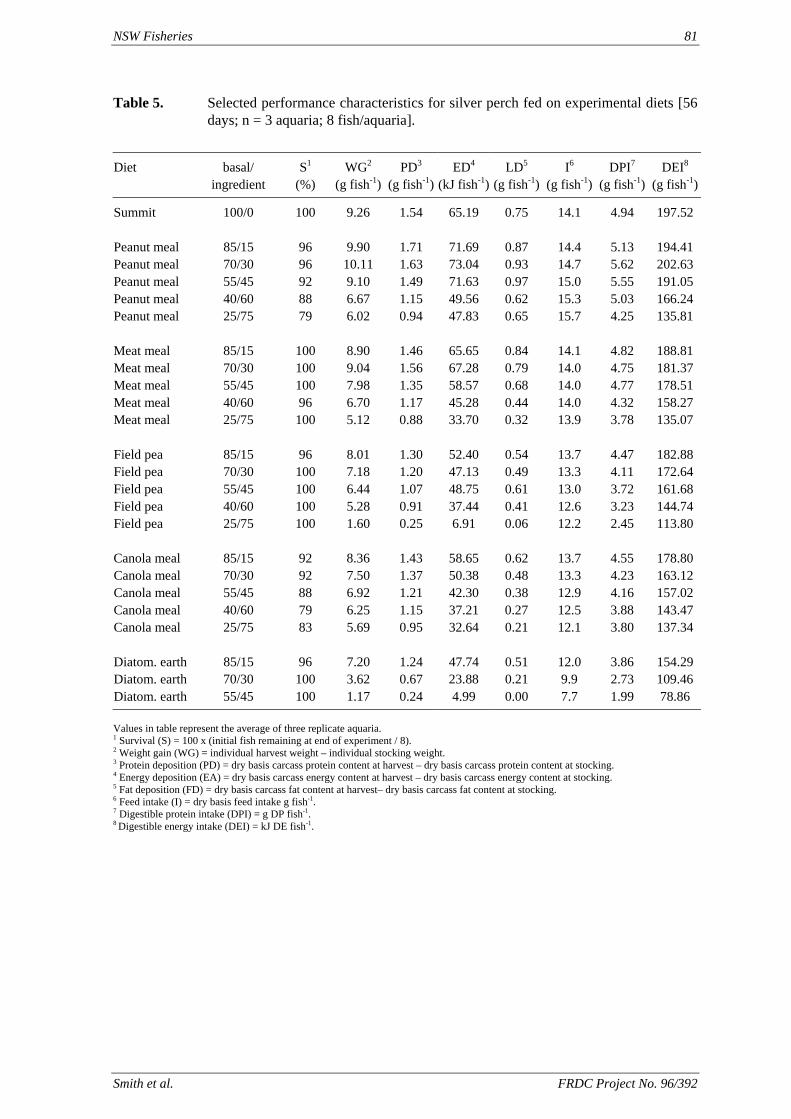
NSW Fisheries 81
Table 5. Selected performance characteristics for silver perch fed on experimental diets [56 days; n = 3 aquaria; 8 fish/aquaria].
Diet basal/
ingredient S1
(%) WG2
(g fish-1)PD3
(g fish-1)ED4
(kJ fish-1)LD5
(g fish-1)I6
(g fish-1) DPI7
(g fish-1) DEI8
(g fish-1)
Summit 100/0 100 9.26 1.54 65.19 0.75 14.1 4.94 197.52 Peanut meal 85/15 96 9.90 1.71 71.69 0.87 14.4 5.13 194.41 Peanut meal 70/30 96 10.11 1.63 73.04 0.93 14.7 5.62 202.63 Peanut meal 55/45 92 9.10 1.49 71.63 0.97 15.0 5.55 191.05 Peanut meal 40/60 88 6.67 1.15 49.56 0.62 15.3 5.03 166.24 Peanut meal 25/75 79 6.02 0.94 47.83 0.65 15.7 4.25 135.81 Meat meal 85/15 100 8.90 1.46 65.65 0.84 14.1 4.82 188.81 Meat meal 70/30 100 9.04 1.56 67.28 0.79 14.0 4.75 181.37 Meat meal 55/45 100 7.98 1.35 58.57 0.68 14.0 4.77 178.51 Meat meal 40/60 96 6.70 1.17 45.28 0.44
7.18 13.3 Field pea
40/60 100 0.06
Canola meal 8.36 1.43 4.55
88 0.27 3.88
96 3.86
70/30 100 23.88 9.9 109.46 55/45
14.0 4.32 158.27 Meat meal 25/75 100 5.12 0.88 33.70 0.32 13.9 3.78 135.07 Field pea 85/15 96 8.01 1.30 52.40 0.54 13.7 4.47 182.88 Field pea 70/30 100 1.20 47.13 0.49 4.11 172.64
55/45 100 6.44 1.07 48.75 0.61 13.0 3.72 161.68 Field pea 100 5.28 0.91 37.44 0.41 12.6 3.23 144.74 Field pea 25/75 1.60 0.25 6.91 12.2 2.45 113.80
85/15 92 58.65 0.62 13.7 178.80 Canola meal 70/30 92 7.50 1.37 50.38 0.48 13.3 4.23 163.12 Canola meal 55/45 6.92 1.21 42.30 0.38 12.9 4.16 157.02 Canola meal 40/60 79 6.25 1.15 37.21 12.5 143.47 Canola meal 25/75 83 5.69 0.95 32.64 0.21 12.1 3.80 137.34 Diatom. earth 85/15 7.20 1.24 47.74 0.51 12.0 154.29 Diatom. earth 3.62 0.67 0.21 2.73 Diatom. earth 100 1.17 0.24 4.99 0.00 7.7 1.99 78.86 Values in table represent the average of three replicate aquaria. 1 Survival (S) = 100 x (initial fish remaining at end of experiment / 8). 2 Weight gain (WG) = individual harvest weight – individual stocking weight. 3 Protein deposition (PD) = dry basis carcass protein content at harvest – dry basis carcass protein content at stocking. 4 Energy deposition (EA) = dry basis carcass energy content at harvest – dry basis carcass energy content at stocking. 5 Fat deposition (FD) = dry basis carcass fat content at harvest– dry basis carcass fat content at stocking. 6 Feed intake (I) = dry basis feed intake g fish-1. 7 Digestible protein intake (DPI) = g DP fish-1. 8 Digestible energy intake (DEI) = kJ DE fish-1.
Smith et al. FRDC Project No. 96/392
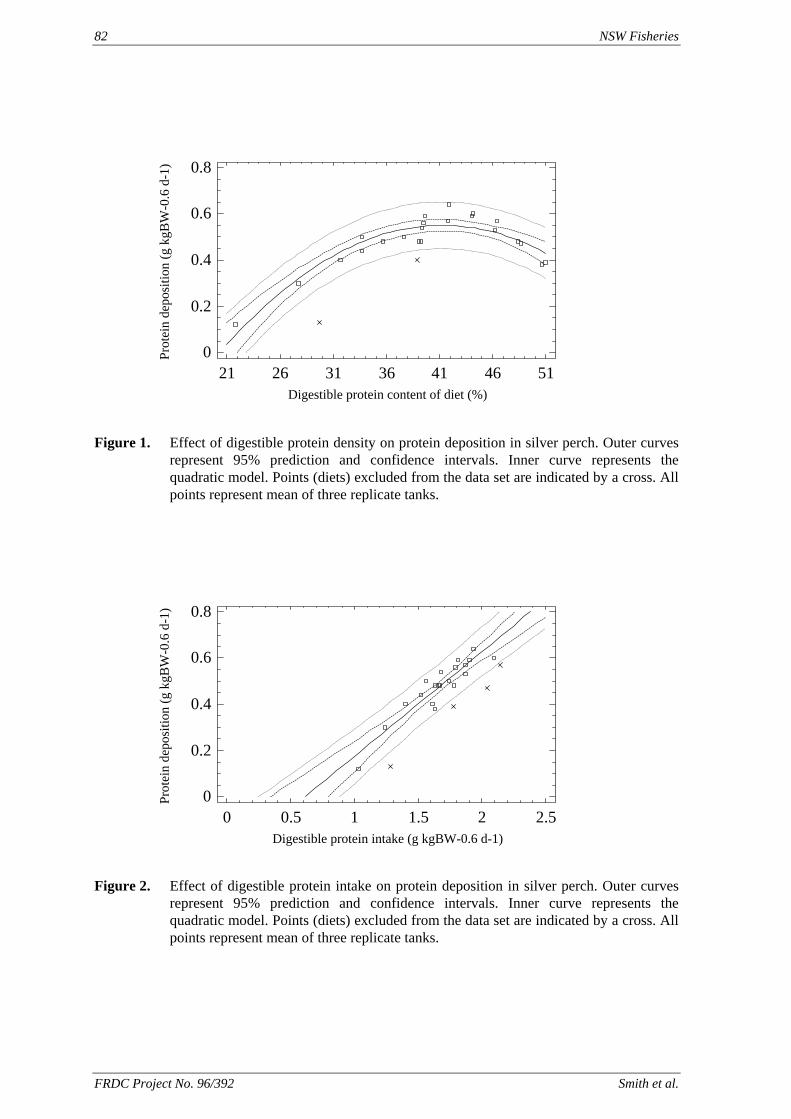
82 NSW Fisheries
Digestible protein content of diet (%)
Prot
ein
depo
sitio
n (g
kgB
W-0
.6 d
-1)
21 26 31 36 41 46 510
0.2
0.4
0.6
0.8
Figure 1. Effect of digestible protein density on protein deposition in silver perch. Outer curves
represent 95% prediction and confidence intervals. Inner curve represents the quadratic model. Points (diets) excluded from the data set are indicated by a cross. All points represent mean of three replicate tanks.
Digestible protein intake (g kgBW-0.6 d-1)
Prot
ein
depo
sitio
n (g
kgB
W-0
.6 d
-1)
0 0.5 1 1.5 2 2.50
0.2
0.4
0.6
0.8
Figure 2. Effect of digestible protein intake on protein deposition in silver perch. Outer curves
represent 95% prediction and confidence intervals. Inner curve represents the quadratic model. Points (diets) excluded from the data set are indicated by a cross. All points represent mean of three replicate tanks.
FRDC Project No. 96/392 Smith et al.
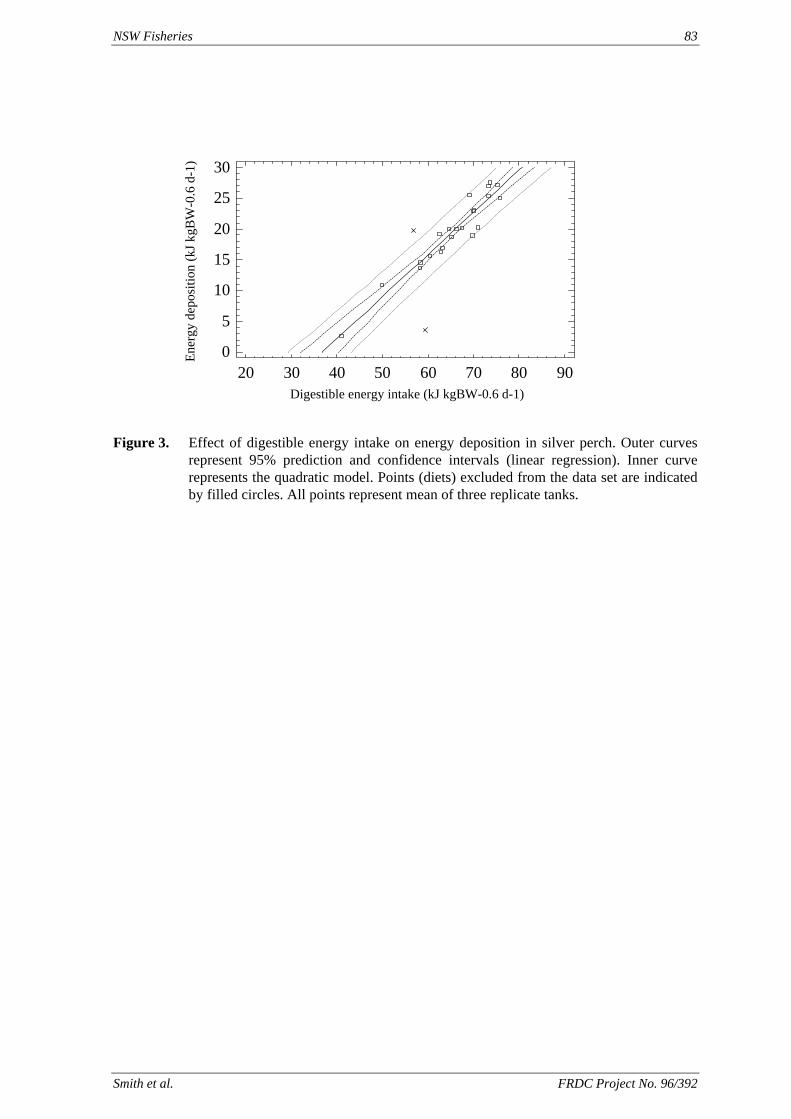
NSW Fisheries 83
Digestible energy intake (kJ kgBW-0.6 d-1)
Ener
gy d
epos
ition
(kJ k
gBW
-0.6
d-1
)
20 30 40 50 60 70 80 900
5
10
15
20
25
30
Figure 3. Effect of digestible energy intake on energy deposition in silver perch. Outer curves
represent 95% prediction and confidence intervals (linear regression). Inner curve represents the quadratic model. Points (diets) excluded from the data set are indicated by filled circles. All points represent mean of three replicate tanks.
Smith et al. FRDC Project No. 96/392
84 NSW Fisheries
4.7. The effects of dietary digestible protein and digestible energy content on protein retention efficiency of juvenile silver perch Bidyanus bidyanus
Geoff L. Allan & Mark A. Booth
NSW Fisheries, Port Stephens Fisheries Centre, Private Bag 1, Nelson Bay NSW 2315
Abstract
Effects of varying dietary digestible protein and digestible energy (DE) on protein retention efficiency, weight gain, protein deposition and carcass composition for silver perch (Bidyanus bidyanus) were studied. Using digestibility data for silver perch, we formulated three series of diets with different DE contents (13, 15 or 17 MJ DE kg-1). For each series, a “summit” diet with well in excess of expected requirements for protein for silver perch (based on previous research) and a “diluent” diet with only 10-13% digestible protein were formulated. By blending summit and diluent diets together in different ratios, five diets with different digestible protein contents were provided for each DE series. A commercial diet was also included to give 16 experimental diets in total. Eight juvenile fish (mean initial weight 1.2 g) were stocked into each of 64 x 70-L acrylic aquarium and then each of the 16 diets was randomly allocated to four replicate aquaria. Fish were fed restrictively, twice/d, based initially on 3.5% body weight/d with 40% of the ration given at 0830 and 60% given at 1500h. Quadratic functions were fitted to each energy series to describe the relationship between digestible protein content of diets and protein retention efficiency (PRE and the asymptote of these functions were used to predict maximum PRE. For low DE (13 MJ kg-1), mid DE (15 MJ kg-1) and high DE (17 MJ kg-1), the dietary digestible protein contents to give maximum PRE were 24.7, 26.1 and 30.1% respectively. Carcass fat decreased with increasing digestible protein and increasing digestible protein:DE ratio. Carcass fat and carcass moisture were negatively correlated. Varying dietary protein and DE also influences other indices of fish performance. “Optimum” dietary protein therefore depends on the most important factors. For fish fed restrictively, the protein content that will maximise PRE is lower than the content that will maximise weight gain or minimise carcass fat. For fish fed to satiation, the lowest protein content for maximum weight gain will be lower than for fish fed restrictively.
Introduction
Aquaculture of the freshwater omnivore silver perch (Bidyanus bidyanus) is increasing in Australia, where the species is native, and is also occurring in Israel (Harpez, Sklan, Karplus, Barki & No 1999) and Taiwan (Yang, Liou & Liu 2002, in press). In Australia, farmers use a number of commercially-available diets and fish are predominantly cultured in static earthen ponds (Rowland, Allan, Hollis & Pontifex 1995). Most grow-out diets are based on estimations of nutritional requirements and ingredient evaluations (Allan & Rowland 2002) with protein contents around 35% or less. Digestible energy contents are generally low (eg 14-15 MJ kg-1; Allan, Johnson, Booth & Stone 2001) because of the tendency for this species to deposit excess fat, especially in the visceral cavity (Allan & Rowland 2002). Estimation of “optimal” protein contents in practical diets is of high importance to farmers and feed manufacturers because of the high cost of protein and also because protein content is the major factor affecting nitrogenous waste excretion (Cho & Bureau 2001). Allan et al. (2001) estimated “optimum” digestible protein requirements for juvenile silver perch based on the minimum content
FRDC Project No. 96/392 Smith et al.
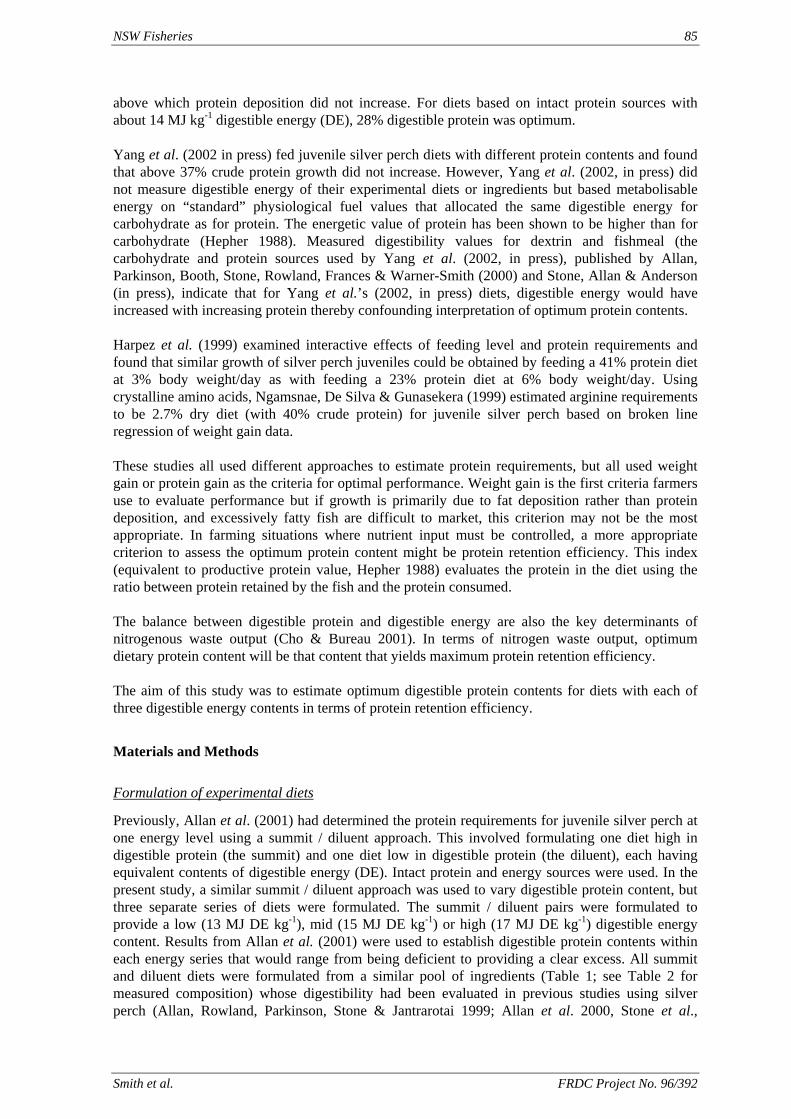
NSW Fisheries 85
above which protein deposition did not increase. For diets based on intact protein sources with about 14 MJ kg-1 digestible energy (DE), 28% digestible protein was optimum. Yang et al. (2002 in press) fed juvenile silver perch diets with different protein contents and found that above 37% crude protein growth did not increase. However, Yang et al. (2002, in press) did not measure digestible energy of their experimental diets or ingredients but based metabolisable energy on “standard” physiological fuel values that allocated the same digestible energy for carbohydrate as for protein. The energetic value of protein has been shown to be higher than for carbohydrate (Hepher 1988). Measured digestibility values for dextrin and fishmeal (the carbohydrate and protein sources used by Yang et al. (2002, in press), published by Allan, Parkinson, Booth, Stone, Rowland, Frances & Warner-Smith (2000) and Stone, Allan & Anderson (in press), indicate that for Yang et al.’s (2002, in press) diets, digestible energy would have increased with increasing protein thereby confounding interpretation of optimum protein contents. Harpez et al. (1999) examined interactive effects of feeding level and protein requirements and found that similar growth of silver perch juveniles could be obtained by feeding a 41% protein diet at 3% body weight/day as with feeding a 23% protein diet at 6% body weight/day. Using crystalline amino acids, Ngamsnae, De Silva & Gunasekera (1999) estimated arginine requirements to be 2.7% dry diet (with 40% crude protein) for juvenile silver perch based on broken line regression of weight gain data. These studies all used different approaches to estimate protein requirements, but all used weight gain or protein gain as the criteria for optimal performance. Weight gain is the first criteria farmers use to evaluate performance but if growth is primarily due to fat deposition rather than protein deposition, and excessively fatty fish are difficult to market, this criterion may not be the most appropriate. In farming situations where nutrient input must be controlled, a more appropriate criterion to assess the optimum protein content might be protein retention efficiency. This index (equivalent to productive protein value, Hepher 1988) evaluates the protein in the diet using the ratio between protein retained by the fish and the protein consumed. The balance between digestible protein and digestible energy are also the key determinants of nitrogenous waste output (Cho & Bureau 2001). In terms of nitrogen waste output, optimum dietary protein content will be that content that yields maximum protein retention efficiency. The aim of this study was to estimate optimum digestible protein contents for diets with each of three digestible energy contents in terms of protein retention efficiency.
Materials and Methods
Formulation of experimental diets
Previously, Allan et al. (2001) had determined the protein requirements for juvenile silver perch at one energy level using a summit / diluent approach. This involved formulating one diet high in digestible protein (the summit) and one diet low in digestible protein (the diluent), each having equivalent contents of digestible energy (DE). Intact protein and energy sources were used. In the present study, a similar summit / diluent approach was used to vary digestible protein content, but three separate series of diets were formulated. The summit / diluent pairs were formulated to provide a low (13 MJ DE kg-1), mid (15 MJ DE kg-1) or high (17 MJ DE kg-1) digestible energy content. Results from Allan et al. (2001) were used to establish digestible protein contents within each energy series that would range from being deficient to providing a clear excess. All summit and diluent diets were formulated from a similar pool of ingredients (Table 1; see Table 2 for measured composition) whose digestibility had been evaluated in previous studies using silver perch (Allan, Rowland, Parkinson, Stone & Jantrarotai 1999; Allan et al. 2000, Stone et al.,
Smith et al. FRDC Project No. 96/392
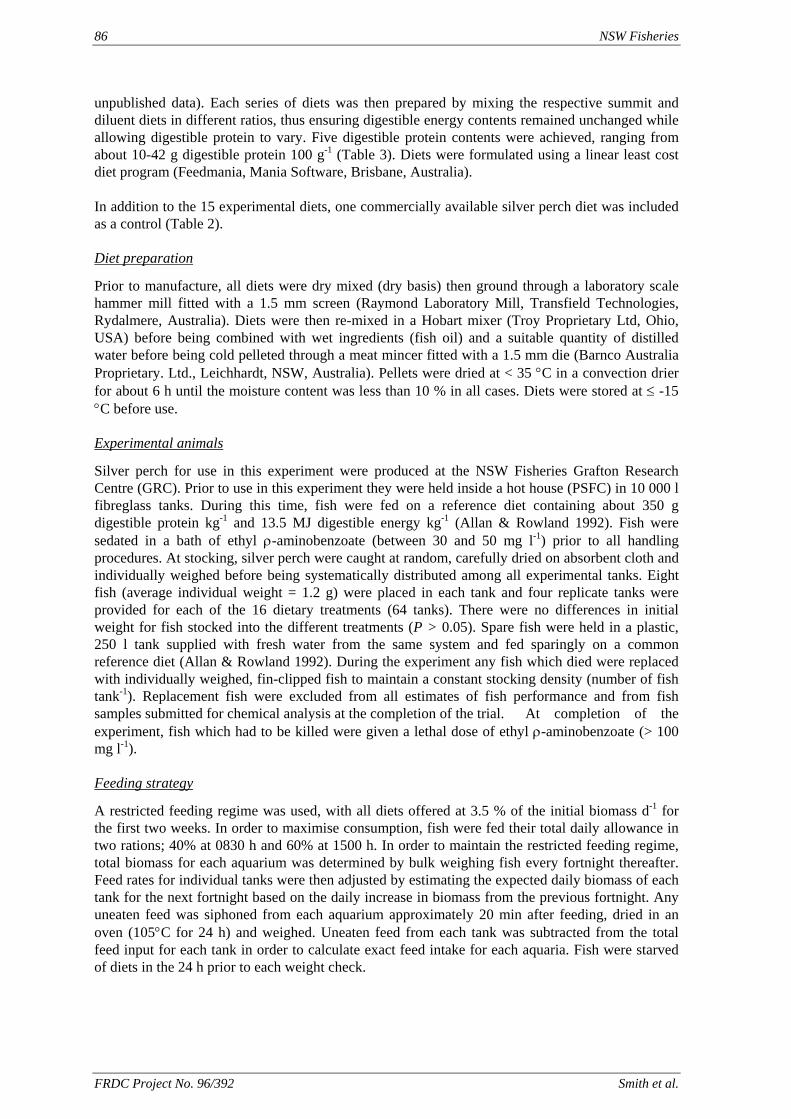
86 NSW Fisheries
unpublished data). Each series of diets was then prepared by mixing the respective summit and diluent diets in different ratios, thus ensuring digestible energy contents remained unchanged while allowing digestible protein to vary. Five digestible protein contents were achieved, ranging from about 10-42 g digestible protein 100 g-1 (Table 3). Diets were formulated using a linear least cost diet program (Feedmania, Mania Software, Brisbane, Australia). In addition to the 15 experimental diets, one commercially available silver perch diet was included as a control (Table 2). Diet preparation
Prior to manufacture, all diets were dry mixed (dry basis) then ground through a laboratory scale hammer mill fitted with a 1.5 mm screen (Raymond Laboratory Mill, Transfield Technologies, Rydalmere, Australia). Diets were then re-mixed in a Hobart mixer (Troy Proprietary Ltd, Ohio, USA) before being combined with wet ingredients (fish oil) and a suitable quantity of distilled water before being cold pelleted through a meat mincer fitted with a 1.5 mm die (Barnco Australia Proprietary. Ltd., Leichhardt, NSW, Australia). Pellets were dried at < 35 °C in a convection drier for about 6 h until the moisture content was less than 10 % in all cases. Diets were stored at ≤ -15 °C before use. Experimental animals
Silver perch for use in this experiment were produced at the NSW Fisheries Grafton Research Centre (GRC). Prior to use in this experiment they were held inside a hot house (PSFC) in 10 000 l fibreglass tanks. During this time, fish were fed on a reference diet containing about 350 g digestible protein kg-1 and 13.5 MJ digestible energy kg-1 (Allan & Rowland 1992). Fish were sedated in a bath of ethyl ρ-aminobenzoate (between 30 and 50 mg l-1) prior to all handling procedures. At stocking, silver perch were caught at random, carefully dried on absorbent cloth and individually weighed before being systematically distributed among all experimental tanks. Eight fish (average individual weight = 1.2 g) were placed in each tank and four replicate tanks were provided for each of the 16 dietary treatments (64 tanks). There were no differences in initial weight for fish stocked into the different treatments (P > 0.05). Spare fish were held in a plastic, 250 l tank supplied with fresh water from the same system and fed sparingly on a common reference diet (Allan & Rowland 1992). During the experiment any fish which died were replaced with individually weighed, fin-clipped fish to maintain a constant stocking density (number of fish tank-1). Replacement fish were excluded from all estimates of fish performance and from fish samples submitted for chemical analysis at the completion of the trial. At completion of the experiment, fish which had to be killed were given a lethal dose of ethyl ρ-aminobenzoate (> 100 mg l-1). Feeding strategy
A restricted feeding regime was used, with all diets offered at 3.5 % of the initial biomass d-1 for the first two weeks. In order to maximise consumption, fish were fed their total daily allowance in two rations; 40% at 0830 h and 60% at 1500 h. In order to maintain the restricted feeding regime, total biomass for each aquarium was determined by bulk weighing fish every fortnight thereafter. Feed rates for individual tanks were then adjusted by estimating the expected daily biomass of each tank for the next fortnight based on the daily increase in biomass from the previous fortnight. Any uneaten feed was siphoned from each aquarium approximately 20 min after feeding, dried in an oven (105°C for 24 h) and weighed. Uneaten feed from each tank was subtracted from the total feed input for each tank in order to calculate exact feed intake for each aquaria. Fish were starved of diets in the 24 h prior to each weight check.
FRDC Project No. 96/392 Smith et al.
NSW Fisheries 87
Laboratory facilities
Experimental units were rectangular, 70-L acrylic aquaria. Each aquarium was supplied with continuously-flowing (500 ml min-1), preheated water, filtered through a sand filter and a cartridge filter (nominal pore size 10 µm), before passing through a 2 m3 biological filter and ultra-violet steriliser (Vf-9 Big Blue, Australian Ultra-Violet Products Proprietary. Limited., Seven Hills, NSW, Australia). Effluent from each aquarium flowed out the side of the tank, of which approximately 25 % flowed to waste. The remainder was collected and recirculated. Each tank was covered with a clear perspex lid and aerated with two air-stone diffusers. Fluorescent lighting was automatically controlled to provide a 12 h light:12 h dark photoperiod. During the experiment, water temperature (range 25.4 to 26.5 °C), dissolved oxygen (range 6.3 to 9.1 mg l-1), salinity (1.34 to 4.82 g NaCl kg-1) and pH (between 7.9 and 8.2) were monitored with a Model 611-Intelligent Water Quality Analyser (Yeo-Kal Electronics Proprietary Ltd, Brookvale, NSW, Australia). Colourimetric methods were used to measure total ammonia nitrogen (Dal Pont, Hogan & Newell 1973) and nitrite (Major, Dal Pont, Kyle & Newell 1972) on a regular basis and over the course of the experiment total ammonia-N ranged between 10-20 µg l-1 and N02-N remained < 10 µg l-1. Chemical analyses
Chemical analyses (excluding gross energy) of experimental diets and whole fish taken at the beginning and end of the experiment (homogenate of 3 or 4 randomly selected fish per tank) were performed by the State Chemistry Laboratory (SCL) (Victoria Agriculture, Werribee, Australia). Crude protein was determined from an adaptation of the standard Kjeldahl method (AOAC 1995) using automated Tecator distillation apparatus. Fat was extracted from samples with diethyl ether in a continuous extraction procedure using an automated Soxtherm apparatus (Gerhardt) after which oven dried residue was weighed to calculate “crude fat” (AOAC 1995). Moisture (oven dried @ 105°C for 16 h) and ash (muffle furnace @ 550°C for 2 h) of diet and carcass samples were determined following standard AOAC procedures (AOAC 1995). Total amino acids (excluding methionine, cystine and tryptophan) were determined after samples were hydrolysed in 6N HCl. HCl was removed by rotary evaporation and the amino acids taken up in sodium citrate buffer (pH 2.2). Amino acids (HPLC apparatus) were separated by ion-exchange column and detected by UV after a post column ninhydrin reaction (Rayner 1985). Gross energy analysis (bomb calorimetry) was performed by the South Australian Research and Development Institute (SARDI) on sub-samples drawn from those prepared by SCL. Performance indices
At the completion of the experiment and following chemical analyses of diet and carcass samples, the following performance indices were calculated for silver perch;
Weight gain (g fish-1) = (harvest weight -stocking weight) Specific growth rate (SGR) % d-1 = 100 X [(ln (harvest weight) – ln (stocking weight)] / 59
days Protein gain (g protein fish-1) = (dry basis protein content of carcass at harvest ) - (dry basis
protein content of carcass at stocking) Energy gain (kJ energy fish-1) = (dry basis energy content of carcass at harvest) – (dry basis
energy content of carcass at stocking) Lipid gain (g lipid fish-1) = (dry basis lipid content of carcass at harvest) – (dry basis lipid
content of carcass at stocking) Feed conversion ratio = dry basis total feed intake per aquarium / weight gain per aquarium Protein retention efficiency (PRE) % = 100 X (dry basis protein gain / dry basis digestible
protein intake)
Smith et al. FRDC Project No. 96/392
88 NSW Fisheries
Statistical Analyses
The protein retention efficiency response of silver perch was regressed against dietary digestible protein content in order to estimate the digestible protein requirement of silver perch for each of the individual energy levels selected. The appropriate order of the polynomial for each energy series was determined by conducting ANOVA on each regression model; once a parameter became non-significant at the 99% confidence limit, the regression model was considered complete. The relationship between carcass fat and carcass moisture was examined using linear regression analysis. Multifactor ANOVA was used to evaluate effects of dietary digestible protein and DE on carcass composition (protein, fat, ash and moisture), weight gain, protein deposition, energy deposition and fat deposition, and FCR. Because fish size affects carcass composition (Shearer 1994; Lupatsch, Kissil, Sklan & Pfeffer 2001), final fish weight was included as a covariate for analysis of fish composition data. Homogeneity of variance was assessed using Cochran’s test (Winer 1991). Variances associated with data for FCR and carcass moisture were heterogeneous. ANOVA results for these indices should be interpreted with caution as departure from homogeneity increases the probability of Type I errors. For data on carcass fat, two outliers, assumed to be the result of analytical errors, were removed prior to ANOVA. Once this was done, variances were homogeneous. Variances for all other indices were homogeneous. Both ANOVA and regression models were fitted using statistical software (Statgraphics, Version 4.1, Manugistics, Rockville, USA).
Results
Composition of fish was affected by diet. Final weight was not a significant co-variant (P > 0.05) for carcass fat or carcass moisture (possibly because of the relatively small size range of fish analysed in this experiment) but both were significantly affected by dietary digestible protein, DE and their interaction (P < 0.001). The interaction occurred because of an unexpected low (for fat) or high (for moisture) value for fish fed the diet with the lowest digestible protein content in the high DE series. Apart from this result, carcass fat decreased and carcass moisture increased with both dietary digestible protein and DE (Figures 1 & 2). There was a highly significant relationship between carcass fat and carcass moisture (R2 = 0.90; Figure 3). For carcass protein (values ranged from 13.5-18.3%, as received), final weight was not a significant co-variant and values were not affected by dietary digestible protein, DE or their interaction (P > 0.05). For carcass ash (values ranged from 3.6-5.7%, as received), final weight was a significant co-variant (P < 0.05) but values were not affected by dietary digestible protein, DE or their interaction (P > 0.05). For weight gain and protein gain, values increased with dietary digestible protein and DE (P < 0.001) and the interaction between dietary digestible protein and DE was significant (P < 0.05) (Table 4). The interaction arose because the magnitude of increase of these values with increasing digestible protein was greater for the high DE diet series than for the mid or low DE diet series. Energy and lipid gain were significantly affected by dietary digestible protein, DE and their interaction (P < 0.05) (Table 4). The response of both these indices was greater for the high DE diet series than the mid or low DE diet series. Lipid gain reached a plateau for diets with about 25% digestible protein (for all DE contents) but although energy gain also reached a plateau for low and
FRDC Project No. 96/392 Smith et al.
NSW Fisheries 89
mid DE diets at about 25% digestible protein, it continued to increase with digestible protein for the high DE diet series. For protein retention efficiency, the response to dietary digestible protein for each DE series is presented in Figure 4. Quadratic functions describing each energy series were: Low DE series, PRE = -0.0203*DP2 + 0.0034*DP + 20.581, R2 = 0.76; Mid DE series, PRE = -0.418*DP2 + 2.1784*DP + 6.2853, R2 = 0.79; High DE series, PRE = -0.0612*DP2 + 3.6828*DP – 14.637, R2 = 0.77. The asymptote of each curve was calculated to estimate optimum dietary digestible protein contents for maximum protein retention efficiency for each DE content. These estimates were: Low DE series = 24.7% digestible protein; Mid DE series = 26.1% digestible protein; High DE series = 30.1% digestible protein.
Discussion
Juvenile silver perch responded to both increasing digestible protein and DE content of diets under a restricted feeding regime. Quadratic functions were fitted to each energy series to describe the relationship between digestible protein content of diets and protein retention efficiency. Using the asymptote of the quadratic function to predict maximum protein retention efficiency, the optimum digestible protein requirements for silver perch diets with low (~13MJ kg-1), mid (~15MJ kg-1) and high (~17MJ kg-1) DE were 24.7, 26.1 and 30.1% respectively. The values for the mid DE was similar to the optimum digestible protein content estimated by Allan et al. (2001) for diets with a DE of 13-14MJ/kg of 28%. However, the two studies used different criteria to estimate protein requirement. In the earlier study, weight gain was the criterion and fish were fed to apparent satiation (see Figure 5; deposition is presented on a g kg-1 mean body weight (MBW) basis to account for differences in starting weight [the fish used in the current experiment were 1.2 g while in Allan et al. (2001) they were 2.3 g]). Fish weight gain and protein deposition increased with digestible protein but reached a plateau. Using broken-stick regression analysis, the optimum digestible protein content above which weight gain did not increase significantly, was 28%. In the current study, using much the same experimental approach (diet formulation and facilities), but with fish fed restrictively, weight gain increased with increasing digestible protein content and did not reach a plateau. This was the pattern for each DE series. The magnitude of gain was much less in the current experiment than that of Allan et al. (2001) (Figure 5). One explanation for this difference can be found in the approach to feeding. Allan et al. (2001) fed their fish to apparent satiation, while in the current study we fed the fish on restricted rations. Li & Lovell (1992) found a significant interaction between feeding regime (satiate versus restricted) and dietary protein content for weight gain of channel catfish. Under restricted feeding, weight gain increased with dietary protein while under satiation feeding, weight gain actually decreased with increasing protein content. Li (1989) (reported in Li & Lovell 1992) fed channel catfish to satiation with diets of different protein contents and reported that fish did not benefit from increasing protein above 24%. In contrast, Reis, Reutebuch & Lovell (1989) fed similar diets at below satiation (i.e. restrictively) and found maximum growth at 39% protein. When restrictive feeding regimes are used, the relative proportion of the protein consumed needed for maintenance is higher than when diets are fed to satiation, thus limiting the “scope for growth” (Hepher 1988). Li & Lovell (1992) concluded that channel catfish could obtain sufficient nutrients for maximum growth from diets with 24-26% protein if the diets are fed to satiation but not if they are fed restrictively. On the basis of results from the current experiment, and the one run by Allan et al. (2001), silver perch farmers wishing to maximise body weight gain are advised to feed to satiation if using low protein diets. If satiation feeding is not possible, or if feeding must be restricted (e.g. to prevent water quality deterioration), then a higher protein diet is advised. When feed intake is unrestricted, intake is determined by energy requirements (NRC 1993; Lupatsch et al.
Smith et al. FRDC Project No. 96/392
90 NSW Fisheries
2001) and protein retention efficiency will decrease with increasing dietary protein content (Hepher 1988). This pattern is consistent with data in Allan et al. (2001). During the current study, however, the protein retention efficiencies of fish fed the lowest digestible protein content diets (Figure 4) were the lowest recorded. Because the fish in this experiment were fed restrictively, it is likely that either the intake of energy or some indispensable amino acids (or both) limited protein utilisation. Hepher (1988) has reported poor protein utilisation at very low protein intakes. By far the majority of silver perch culture in Australia takes place in static earthen ponds. In NSW, farmers are only permitted to extract water from natural waterways and no discharge back into waterways is permitted (O’Connor, Ogburn & Lyall 1995). All farms must include an effluent pond and when water from ponds is exchanged it must either be retained in the effluent pond or used to irrigate crops or pastures. Water management is therefore important. Some farmers report difficulties with managing algal blooms and all try to reduce unwanted inputs of nutrients. Nitrogen is one of the four key inputs that facilitate algal blooms (along with phosphorus, carbon and light) and must be managed to control algal growth (Knud-Hansen 1998). Feeding diets that provide maximum protein retention efficiency lower the potential for unwanted nitrogen input. The relevance of estimates of nutritional requirements, based on studies with small fish in aquaria, has been questioned, especially by fish farmers. One of the concerns expressed about earlier research with silver perch was that under practical farming situations, requirements for protein might be higher than the relatively low values estimated (e.g. by Allan et al. 2001). The current study was also done with small fish (1.2 g mean initial weight), partly because using small fish is convenient from a logistical perspective. However, as protein requirements decrease with increasing fish size (Shiau 2002; Kaushik & Luquet 1984; Lupatsch et al. 2001; Robinson & Li 2002), it is likely that if anything, estimates of protein requirements based on small fish will tend to be higher and thus err on the conservative side. Where relatively low stocking densities are employed, fish will obtain a substantial proportion of their nutrition from natural foods, particularly in the early part of the culture cycle. Current stocking densities favoured by silver perch farmers are generally less than 20 000 fish /ha with final harvest biomass less than 10 t/ha. As natural food items in freshwater ponds typically contain much higher protein than is found in formulated foods (Hepher 1988; De Silva 1993), the protein required from supplementary formulated is lower than when formulated diets provide all the nutritional requirements (Hepher 1988). In addition to effects on weight gain and protein retention efficiency, altering DE and digestible protein affect carcass composition. This can have implications for market value. Silver perch farmers report that excess deposits of fat, especially in the visceral cavity, can reduce market acceptance of the fish and, in general, diets have been formulated to minimise DE and keep digestible protein:DE ratio as high as possible (Allan et al. 2001; Allan & Rowland 2002). In the current study, carcass fat and carcass moisture were negatively correlated (as reported for other species [Shearer 1994]) and carcass fat decreased with increasing digestible protein and increasing digestible protein:DE ratio. This pattern has been widely reported for other species (Lupatsch et al. 2001; reviewed by Shearer 1994). Robinson & Li (2002) concluded that although a diet with 24-26% protein supported maximum growth of pond raised channel catfish when fed to satiation, it increased body fat when compared with a diet of 28 or 32% protein, mainly because of the decrease in the protein:DE ratio. Choosing “optimum” dietary protein contents depends on which criteria are considered most important. If weight gain is the primary consideration, farmers would be advised to feed lower protein diets to satiation (see Allan et al. 2001). If water quality is critical, diets that will deliver maximum protein retention efficiency should be used (diets with 13-15 or 17 MJ DE kg-1 should contain between 25-26 or 30% digestible protein respectively). However, if fish are fed
FRDC Project No. 96/392 Smith et al.
NSW Fisheries 91
restrictively, then weight gain will be improved by feeding diets with more dietary protein. If carcass composition is the primary criterion, then feeding diets with low DE and high digestible protein (i.e. with high digestible protein:DE ratio) will reduce carcass fat (this will be balanced by increased carcass moisture).
Acknowledgments
We would like to thank David Stone, Rebecca Warner-Smith and Luke Cheviot for help with running the experiment. Dr Stuart Rowland from the Grafton Aquaculture Centre bred the fish used in the experiment. Mr Carl Rayner (State Chemistry Laboratories, Victoria) analysed the diets and ingredient for proximate and amino acid composition. Ms Helena Heasman prepared the manuscript for publication and it was critically reviewed by Dr Wayne O’Connor and Dr Stuart Rowland. Financial support was provided by the Australian Fisheries Research and Development Corporation under the Aquaculture Diet Development Subprogram.
References
Allan G.L. & Rowland S.J. (1992) Development of an experimental diet for silver perch (Bidyanus bidyanus). Austasia Aquaculture 6, 39-40.
Allan G.L. & Rowland S.J. (2002) Silver perch Bidyanus bidyanus. In: C.D. Webster, C. Lim (Eds.), Nutrient Requirements and Feeding of Finfish for Aquaculture. CABI Publishing, Oxford, U.K., pp. 358-373.
Allan G.L., Parkinson S., Booth M.A., Stone D.A.J., Rowland S.J., Frances J. & Warner-Smith R. (2000) Replacement of fish meal in diets for Australian silver perch Bidyanus bidyanus: I. Digestibility of alternative ingredients. Aquaculture 186, 293-310.
Allan G.L., Rowland S.J., Parkinson S., Stone D.A.J. & Jantrarotai W. (1999) Nutrient digestibility for juvenile silver perch Bidyanus bidyanus (Mitchell): development of methods. Aquaculture 170, 131-145.
Allan G.L, Johnson R.J., Booth M.A. & Stone D.A.J. (2001) Estimating digestible protein requirements of silver perch, Bidyanus bidyanus Mitchell. Aquaculture Research 32, 337-347.
AOAC (1995) Official methods of analysis of the association of official chemists15th ed., Published by the Association of the Official Analytical Chemists, Inc., Arlington, Virginia, USA.
Cho C.Y. & Bureau D.P. (2001) A review of diet formulation strategies and feeding systems to reduce excretory and feed wastes in aquaculture. Aquaculture Research 32, 349-360.
Dal Pont G., Hogan M. & Newell B. (1973) Laboratory Techniques in Marine Chemistry. 2. Determination of ammonia in seawater and the preservation of samples for nitrate analysis. Aust. C.S.I.R.O. Div. Fish. Oceanogr. Rep., C.S.I.R.O., Sydney, 11 pp.
De Silva S.S. (1993) Supplementary feeding in semi-intensive aquaculture systems. In: M.B. New, A.G.J. Tacon & Im. Csavas (Eds.), Farm-Made Aquafeeds. Proceedings FAO/AADCP Regional Expert Consultation on Farm-Made Aquafeeds, 14-18 December 1992, Bangkok, Thailand. RAPA Publication 1993/18 AADCP/PROC/5, 24-60.
Harpez S., Sklan D., Karplus I., Barki A. & Noy Y. (1999) Evaluation of juvenile silver perch (Bidyanus bidyanus) nutritional needs using high and low protein diets at two feeding levels. Aquaculture Research 30, 603-610.
Hepher B. (1988) Nutrition of Pond Fishes. Cambridge University Press. Cambridge, U.K. 387 pp. Kaushik S.J & Luquet P. (1984) Relationship between protein intake and voluntary energy intake
as affected by body weight with an estimation of maintenance needs in rainbow trout. Zeitschrift fur Tierphysiologie Tierernahrung und Futtermittelkunde 51, 57-69.
Smith et al. FRDC Project No. 96/392
92 NSW Fisheries
Knud-Hansen C.F. (1998) Pond Fertilization: Ecological Approach and Practical Application. Pond Dynamics/Aquaculture Collaborative Research Support Program, Oregon State University, Corvallis, Oregon, USA, 125 pp.
Li M. (1989) Effects of dietary protein content on weight gain of channel catfish stocked intensively in earthen ponds. M.S. Thesis, Auburn University, Auburn, AL, USA, 61 pp.
Li M. & Lovell R.T. (1992) Comparison of satiate feeding and restricted feeding of channel catfish with various concentrations of dietary protein in production ponds. Aquaculture 103, 165-175.
Lupatsch I., Kissil G.W.M., Sklan D. & Pfeffer E. (2001) Effects of varying dietary protein and energy supply on growth, body composition and protein utilisation in gilthead seabream (Sparus auratus L). Aquaculture Nutrition 7, 71-80.
Major G.A., Dal Pont J., Kyle J. & Newell B. (1972) Laboratory Techniques in Marine Chemistry. A Manual. Aust. C.S.I.R.O. Div. Fish. Oceanogr. Rep. No. 51, C.S.I.R.O., Sydney, 55 pp.
Ngamsnae P., De Silva S.S. & Gunasekera R.M. (1999) Arginine and phenylalanine requirement of juvenile silver perch Bidyanus bidyanus and validation of the use of body amino acid composition for estimating individual amino acid requirements. Aquaculture Nutrition 5, 173-180.
NRC (National Research Council) (1993) Nutrient requirements of fish. National Academy Press, Washington DC.
O’Connor P.F., Ogburn D.M. & Lyall I.R. (1995) Aquaculture policy and management in NSW. In: S.J. Rowland & C. Bryant (Eds.) Silver Perch Culture. Proceedings of Silver Perch Aquaculture Workshop, Grafton & Narrandera, April 1994. Austasia Aquaculture for NSW Fisheries, Sandy Bay, Tasmania, Australia, 117-122.
Rayner C. (1985) Protein hydrolysis of animal feeds for amino acid content. Journal of Agricultural and Food Chemistry 33, 722.
Reis L.M., Reutebuch E.M. & Lovell R.T. (1989) Protein-to-energy ratios in production diets and growth, feed conversion and body composition of channel catfish. Aquaculture 76, 1-7
Robinson E.H. & Li M.H. (2002) Channel Catfish, Ictalurus punctatus. In: C.D. Webster, C. Lim (Eds.), Nutrient Requirements and Feeding of Finfish for Aquaculture. CABI Publishing, Oxford, U.K., pp. 293-318.
Rowland S.J., Allan G.L., Hollis M. & Pontifex T. (1995) Production of silver perch, Bidyanus bidyanus, at two densities in earthen ponds. Aquaculture 130, 317-328.
Shearer K.D. (1994) Factors affecting the proximate composition of cultured fishes with emphasis on salmonids. Aquaculture 119, 63-88.
Shiau S.Y. (2002) Tilapia, Oreochromis spp. In: C.D. Webster, C. Lim (Eds.), Nutrient Requirements and Feeding of Finfish for Aquaculture. CABI Publishing, Oxford, U.K., pp. 273-292.
Stone D.A.J., Allan G.L. & Anderson A.J. (2003) Carbohydrate utilisation by juvenile silver perch Bidyanus bidyanus (Mitchell): II. Digestibility and utilisation of starch and its breakdown products. Aquaculture Research 34, 195-204.
Winer B.J., Brown D.R. & Michels K.M. (1991) Statistical Principles in Experimental Design. 3rd Ed. McGraw-Hill, New York, NY, USA, 1057 pp.
Yang S.D., Liou C.H. & Liu F.G. (2002, in press) Effects of dietary protein level on growth performance, carcass composition and ammonia excretion in juvenile silver perch (Bidyanus bidyanus). Aquaculture.
FRDC Project No. 96/392 Smith et al.
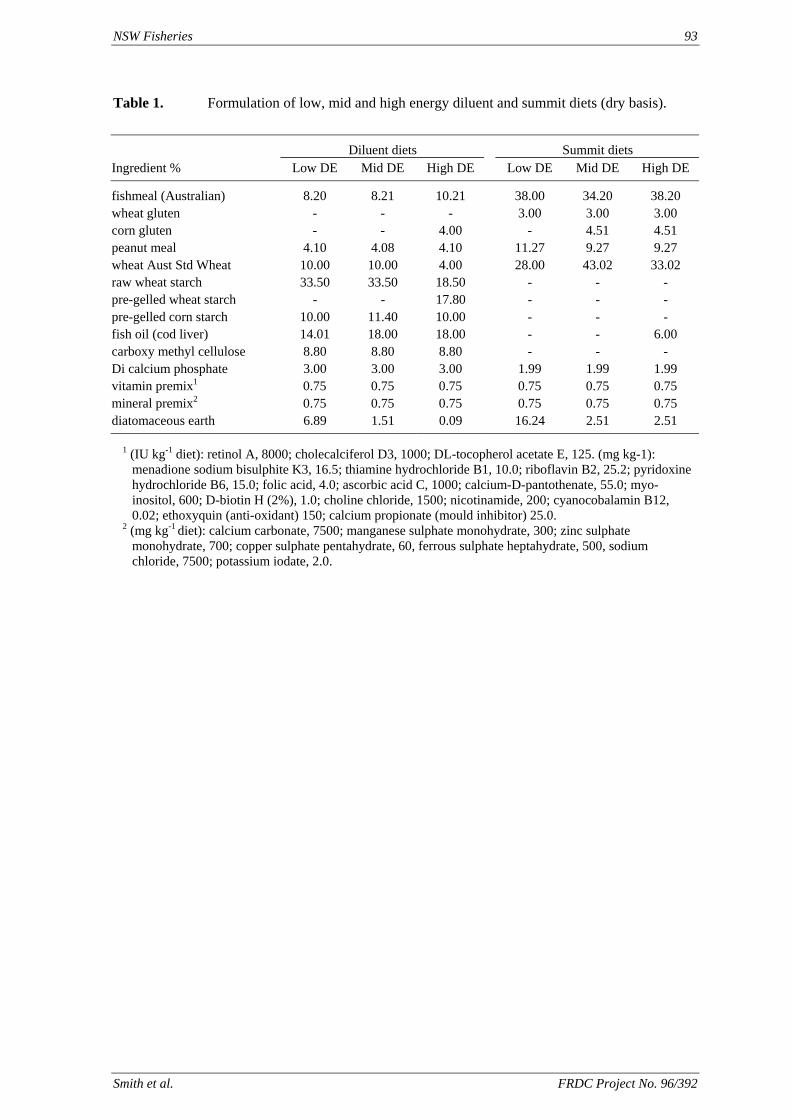
NSW Fisheries 93
Table 1. Formulation of low, mid and high energy diluent and summit diets (dry basis). Diluent diets Summit diets Ingredient % Low DE Mid DE High DE Low DE Mid DE High DE
fishmeal (Australian) 8.20 8.21 10.21 38.00 34.20 38.20 wheat gluten - - - 3.00 3.00 3.00 corn gluten - - 4.00 - 4.51 4.51 peanut meal 4.10 4.08 4.10 11.27 9.27 9.27 wheat Aust Std Wheat 10.00 10.00 4.00 28.00 43.02 33.02 raw wheat starch 33.50 33.50 18.50 - - - pre-gelled wheat starch - - 17.80 - - - pre-gelled corn starch 10.00 11.40 10.00 - - - fish oil (cod liver) 14.01 -
- 3.00 1.99
vitamin premix1 0.75 0.75 0.75
diatomaceous earth 16.24 2.51 2.51
18.00 18.00 - 6.00 carboxy methyl cellulose 8.80 8.80 8.80 - - Di calcium phosphate 3.00 3.00 1.99 1.99
0.75 0.75 0.75 0.75 0.75 0.75 mineral premix2 0.75 0.75 0.75
6.89 1.51 0.09 1 (IU kg-1 diet): retinol A, 8000; cholecalciferol D3, 1000; DL-tocopherol acetate E, 125. (mg kg-1):
menadione sodium bisulphite K3, 16.5; thiamine hydrochloride B1, 10.0; riboflavin B2, 25.2; pyridoxine hydrochloride B6, 15.0; folic acid, 4.0; ascorbic acid C, 1000; calcium-D-pantothenate, 55.0; myo-inositol, 600; D-biotin H (2%), 1.0; choline chloride, 1500; nicotinamide, 200; cyanocobalamin B12, 0.02; ethoxyquin (anti-oxidant) 150; calcium propionate (mould inhibitor) 25.0.
2 (mg kg-1 diet): calcium carbonate, 7500; manganese sulphate monohydrate, 300; zinc sulphate monohydrate, 700; copper sulphate pentahydrate, 60, ferrous sulphate heptahydrate, 500, sodium chloride, 7500; potassium iodate, 2.0.
Smith et al. FRDC Project No. 96/392
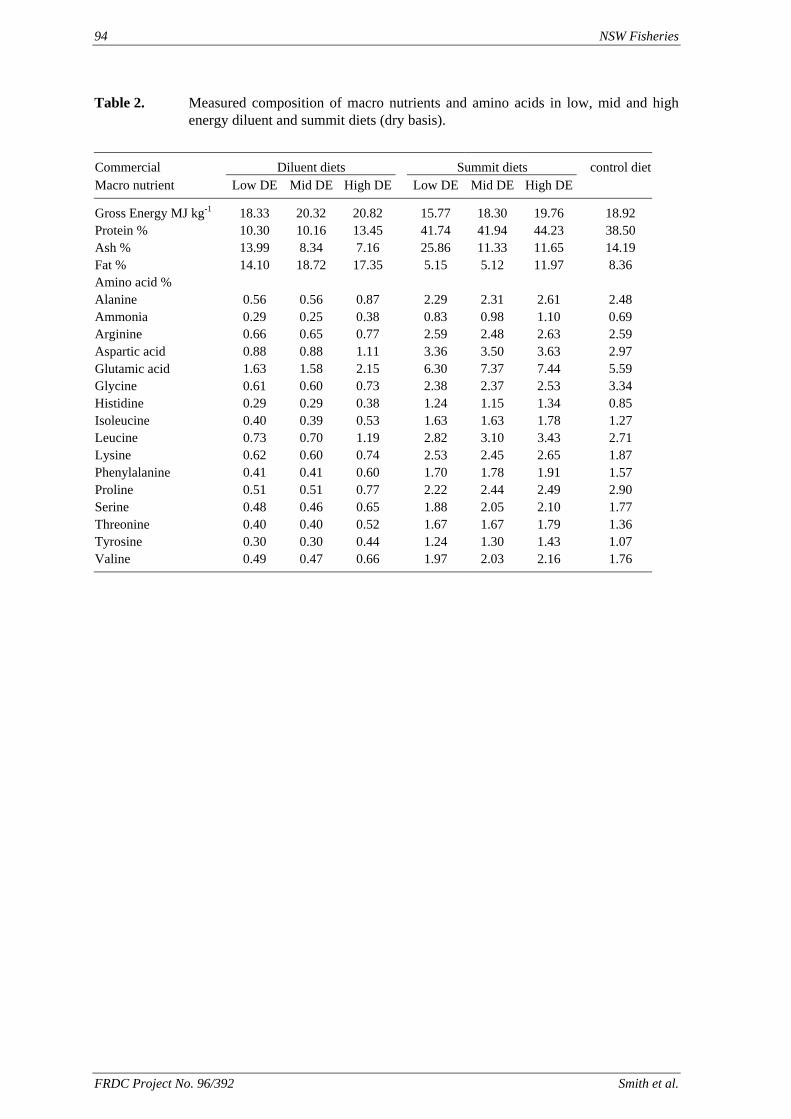
94 NSW Fisheries
Table 2. Measured composition of macro nutrients and amino acids in low, mid and high energy diluent and summit diets (dry basis).
Commercial Diluent diets Summit diets control diet Macro nutrient Low DE Mid DE High DE Low DE Mid DE High DE
Gross Energy MJ kg-1 18.33 20.32 20.82 15.77 18.30 19.76 18.92 Protein % 10.30 10.16 13.45 41.74 41.94 44.23 38.50 Ash % 13.99 8.34 7.16 25.86
5.12
Glutamic acid 0.61
0.29
2.53 1.78
2.49 2.90 Serine 0.65 1.88 2.10 1.77
0.40 1.67 1.36 Tyrosine 0.30 Valine 0.49 0.47 0.66 1.97 2.03 2.16 1.76
11.33 11.65 14.19 Fat % 14.10 18.72 17.35 5.15 11.97 8.36 Amino acid % Alanine 0.56 0.56 0.87 2.29 2.31 2.61 2.48 Ammonia 0.29 0.25 0.38 0.83 0.98 1.10 0.69 Arginine 0.66 0.65 0.77 2.59 2.48 2.63 2.59 Aspartic acid 0.88 0.88 1.11 3.36 3.50 3.63 2.97
1.63 1.58 2.15 6.30 7.37 7.44 5.59 Glycine 0.60 0.73 2.38 2.37 2.53 3.34 Histidine 0.29 0.38 1.24 1.15 1.34 0.85 Isoleucine 0.40 0.39 0.53 1.63 1.63 1.78 1.27 Leucine 0.73 0.70 1.19 2.82 3.10 3.43 2.71 Lysine 0.62 0.60 0.74 2.45 2.65 1.87 Phenylalanine 0.41 0.41 0.60 1.70 1.91 1.57 Proline 0.51 0.51 0.77 2.22 2.44
0.48 0.46 2.05 Threonine 0.40 0.52 1.67 1.79
0.30 0.44 1.24 1.30 1.43 1.07
FRDC Project No. 96/392 Smith et al.
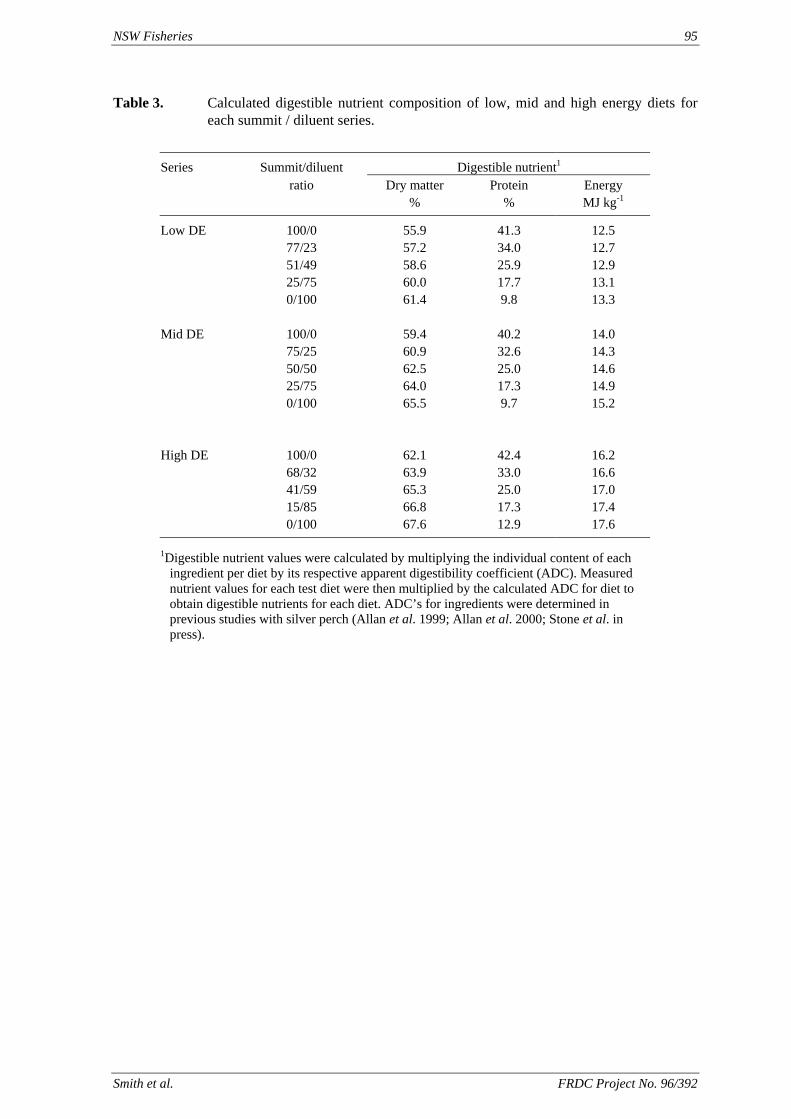
NSW Fisheries 95
Table 3. Calculated digestible nutrient composition of low, mid and high energy diets for each summit / diluent series.
Series Summit/diluent Digestible nutrient1 ratio Dry matter Protein Energy % % MJ kg-1
Low DE 100/0 55.9 41.3 12.5 77/23 57.2 34.0 12.7
51/49 58.6 25.9 12.9 25/75 60.0 17.7 13.1 0/100 61.4 9.8 13.3 Mid DE 100/0 59.4 40.2 14.0 75/25 60.9 32.6 14.3 50/50 62.5 25.0 14.6 25/75 64.0 17.3 14.9 0/100 65.5 9.7 15.2 High DE 100/0 62.1 42.4 16.2 68/32 63.9 33.0 16.6 41/59 65.3 25.0 17.0 15/85 66.8 17.3 17.4 0/100 67.6 12.9 17.6 1Digestible nutrient values were calculated by multiplying the individual content of each
ingredient per diet by its respective apparent digestibility coefficient (ADC). Measured nutrient values for each test diet were then multiplied by the calculated ADC for diet to obtain digestible nutrients for each diet. ADC’s for ingredients were determined in previous studies with silver perch (Allan et al. 1999; Allan et al. 2000; Stone et al. in press).
Smith et al. FRDC Project No. 96/392
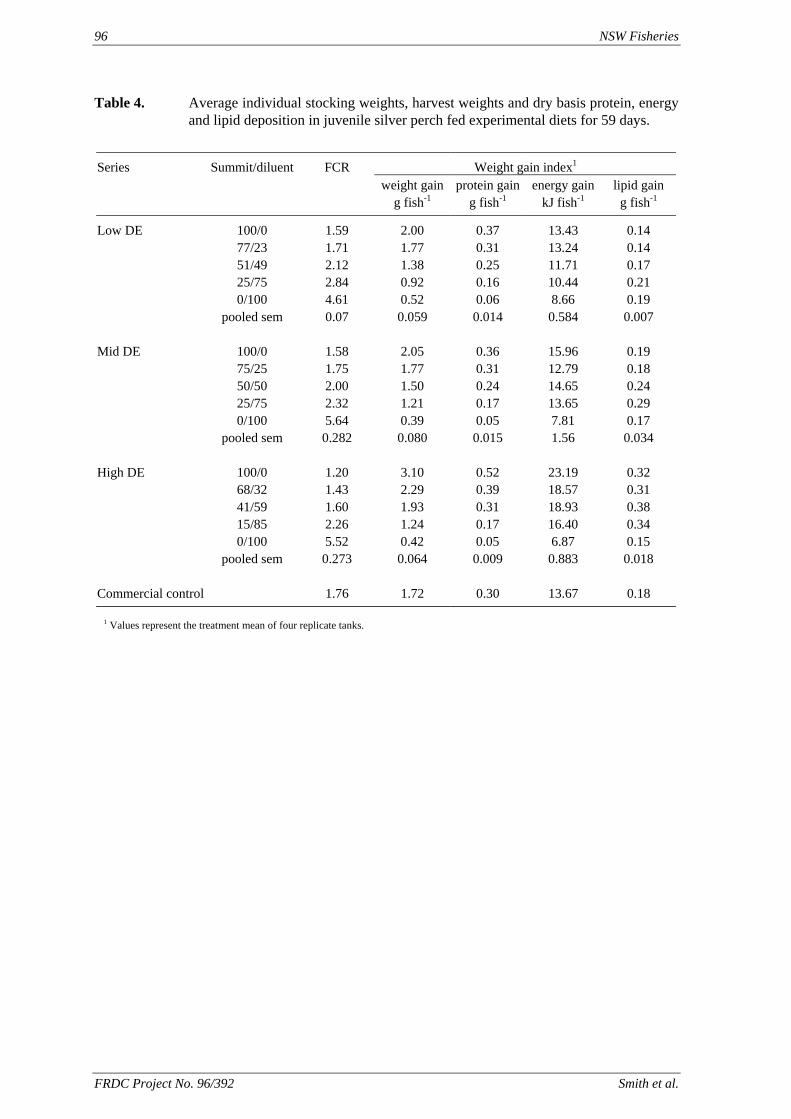
96 NSW Fisheries
Table 4. Average individual stocking weights, harvest weights and dry basis protein, energy and lipid deposition in juvenile silver perch fed experimental diets for 59 days.
Series Summit/diluent FCR Weight gain index1 weight gain
g fish-1 protein gain
g fish-1 energy gain
kJ fish-1 lipid gain
g fish-1
100/0 1.59 2.00 13.43 0.14 1.77 0.31 13.24 0.14 1.38 0.25 0.17
25/75 0.92 0.16 10.44 0.21 0/100 4.61 0.52 0.06 8.66 0.19
0.584 0.007
75/25 1.75 1.77 0.31 12.79 0.18 50/50 2.00 1.50 0.24 14.65 0.24 25/75 2.32 1.21 0.17 13.65 0.29 0/100 5.64 0.39 0.05 7.81 0.17 pooled sem 0.282 0.080 0.015 1.56 0.034 High DE 100/0 1.20 3.10 0.52 23.19 0.32 68/32 1.43 0.39 18.57 0.31 41/59 1.60 1.93 0.31 18.93 0.38 15/85 2.26 1.24 0.17 16.40 0.34 0/100 5.52 0.42 0.05 6.87 0.15 pooled sem 0.273 0.064 0.009 0.883 0.018 Commercial control 1.76 1.72 0.30 13.67 0.18
Low DE 0.37 77/23 1.71 51/49 2.12 11.71
2.84
pooled sem 0.07 0.059 0.014
Mid DE 100/0 1.58 2.05 0.36 15.96 0.19
2.29
1 Values represent the treatment mean of four replicate tanks.
FRDC Project No. 96/392 Smith et al.
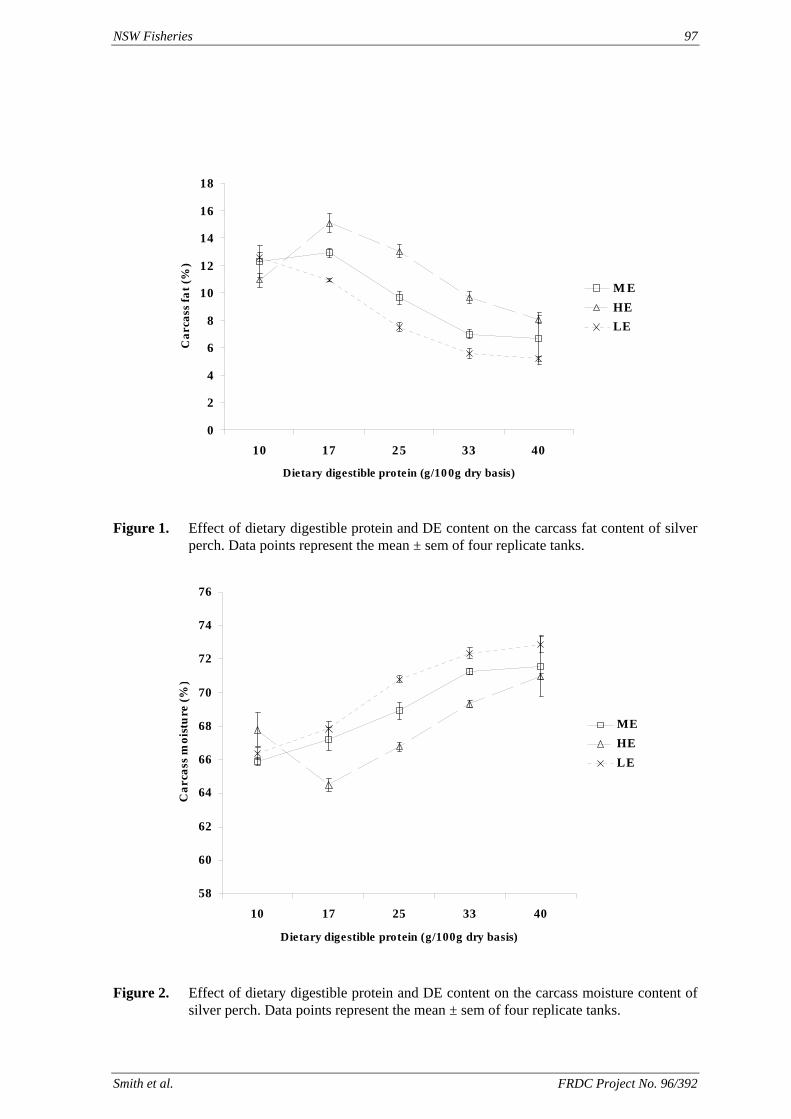
NSW Fisheries 97
0
2
4
6
8
10
12
14
16
18
10 17 25 33 40
Dietary digestible protein (g/100g dry basis)
Car
cass
fat (
%)
M EHELE
Figure 1. Effect of dietary digestible protein and DE content on the carcass fat content of silver
perch. Data points represent the mean ± sem of four replicate tanks.
58
60
62
64
66
68
70
72
74
76
10 17 25 33 40
Dietary digestible protein (g/100g dry basis)
Car
cass
moi
stu
re (%
)
MEHELE
Figure 2. Effect of dietary digestible protein and DE content on the carcass moisture content of silver perch. Data points represent the mean ± sem of four replicate tanks.
Smith et al. FRDC Project No. 96/392
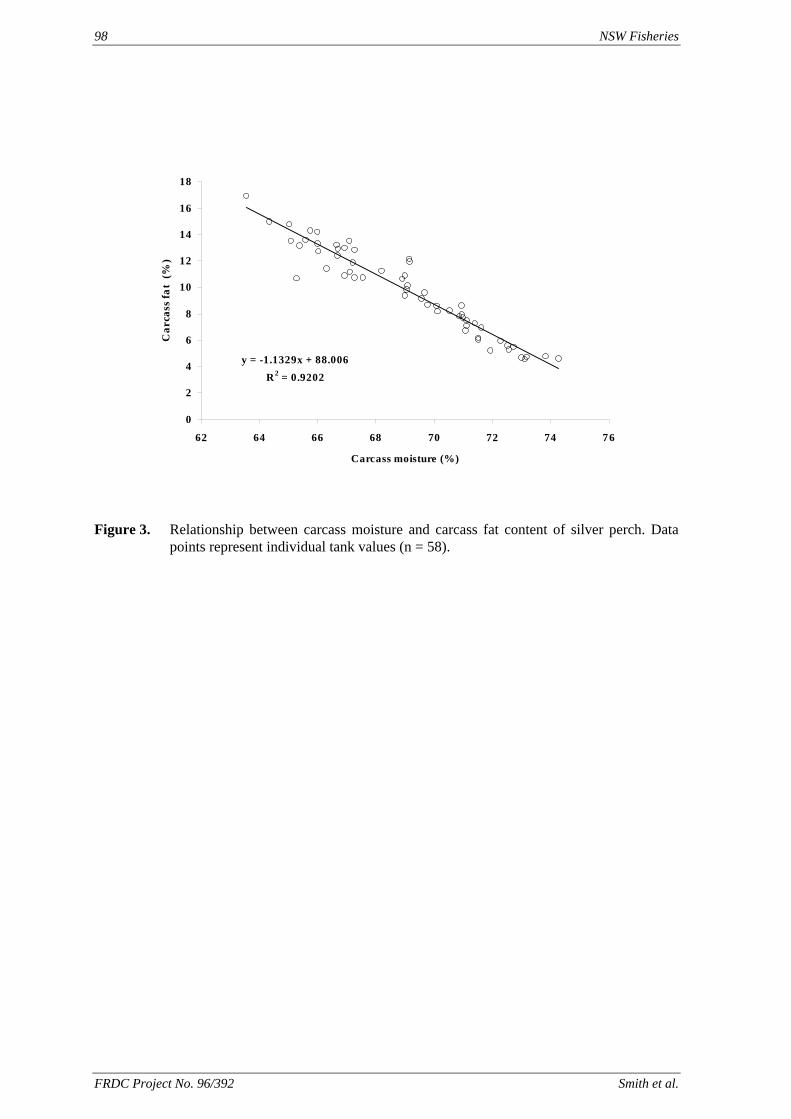
98 NSW Fisheries
y = -1.1329x + 88.006R2 = 0.9202
0
2
4
6
8
10
12
14
16
18
62 64 66 68 70 72 74 76
Carcass moisture (%)
Car
cass
fat
(%)
Figure 3. Relationship between carcass moisture and carcass fat content of silver perch. Data points represent individual tank values (n = 58).
FRDC Project No. 96/392 Smith et al.
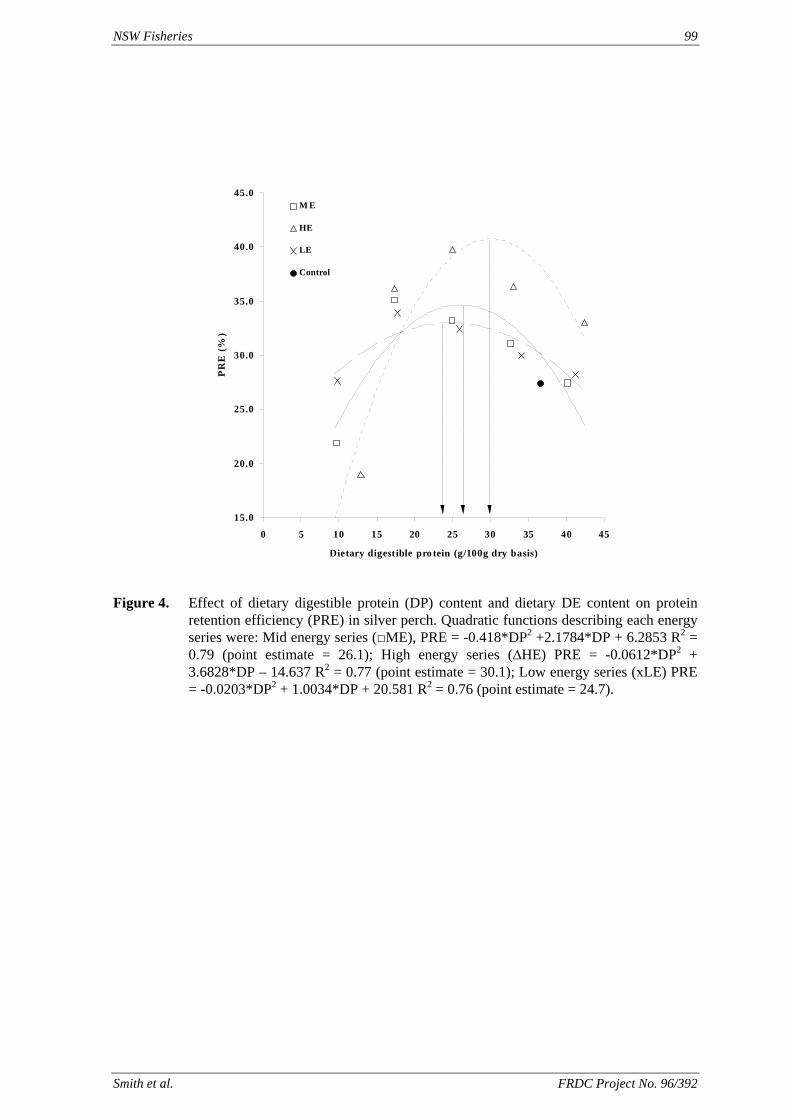
NSW Fisheries 99
15.0
20.0
25.0
30.0
35.0
40.0
45.0
0 5 10 15 20 25 30 35 40 45
Dietary digestible pro tein (g/100g dry basis)
PR
E (
%)
M E
HE
LE
Control
Figure 4. Effect of dietary digestible protein (DP) content and dietary DE content on protein
retention efficiency (PRE) in silver perch. Quadratic functions describing each energy series were: Mid energy series (□ME), PRE = -0.418*DP2 +2.1784*DP + 6.2853 R2 = 0.79 (point estimate = 26.1); High energy series (∆HE) PRE = -0.0612*DP2 + 3.6828*DP – 14.637 R2 = 0.77 (point estimate = 30.1); Low energy series (хLE) PRE = -0.0203*DP2 + 1.0034*DP + 20.581 R2 = 0.76 (point estimate = 24.7).
Smith et al. FRDC Project No. 96/392
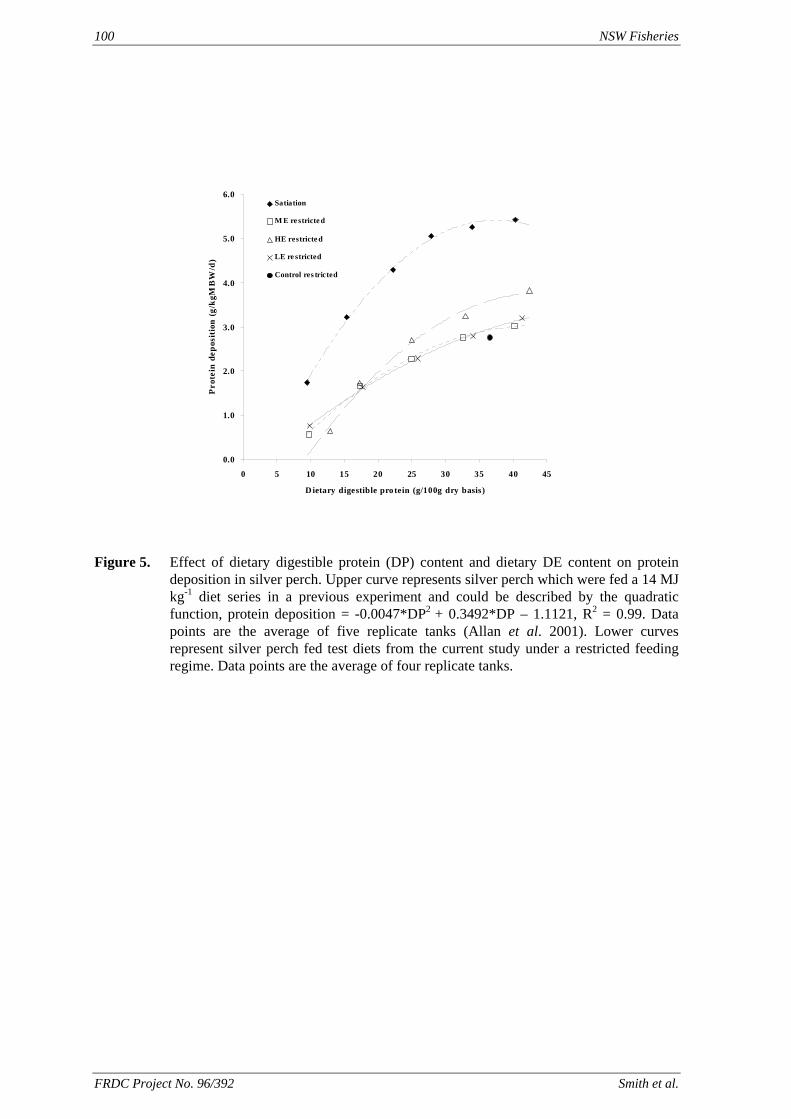
100 NSW Fisheries
0.0
1.0
2.0
3.0
4.0
5.0
6.0
0 5 10 15 20 25 30 35 40 45
D ietary digestible pro tein (g/100g dry basis)
Pro
tein
dep
osit
ion
(g/k
gMB
W/d
)Satiation
M E re stricte d
HE restricte d
LE re stricted
Control res tricted
Figure 5. Effect of dietary digestible protein (DP) content and dietary DE content on protein deposition in silver perch. Upper curve represents silver perch which were fed a 14 MJ kg-1 diet series in a previous experiment and could be described by the quadratic function, protein deposition = -0.0047*DP2 + 0.3492*DP – 1.1121, R2 = 0.99. Data points are the average of five replicate tanks (Allan et al. 2001). Lower curves represent silver perch fed test diets from the current study under a restricted feeding regime. Data points are the average of four replicate tanks.
FRDC Project No. 96/392 Smith et al.
NSW Fisheries 101
4.8. Dietary protein to energy relationships in barramundi
Kevin C. Williams1, Christopher G. Barlow2, Les J. Rodgers2, Ian Hockings2, C. Agcopra2 &
Ian Ruscoe2
1 CSIRO Marine Laboratories, P.O. Box 120, Cleveland Qld 4163
2 Queensland Department of Primary Industries, Walkamin Freshwater Fisheries & Aquaculture Centre, Walkamin Qld 4834
Summary
Two nutrient retention growth assay experiments were carried out to examine the interactive effects of dietary protein and lipid/energy in barramundi held under controlled (28ºC and 12:12 photoperiod) freshwater recirculation laboratory conditions. In the first 48 tank experiment, 12 diets were formulated in which four protein levels – 38, 42.5, 47.3 and 52% air-dry CP) were factorially arranged on three rates of oil addition – 4.0, 10 and 16% (total air-dry dietary lipid concentrations of 7.0, 12.8 and 18.3%, respectively). In the second 48 tank experiment, 12 diets were formulated in which the oil inclusion rate was increased from 9 to 14.5 and 20% (total air-dry dietary lipid concentrations of 13, 18 and 21%, respectively) and combined with four CP levels: serially incremented for each oil addition between 50 and 65%, 47.5 and 61% and 44 and 60%, respectively. In both experiments, changes in dietary CP concentration and oil addition were achieved by serial alteration of casein (for CP) and a 3:1 blend of fish oil and soybean oil (for oil) at the expense of gelled starch and diatomaceous earth. These diets were fed once daily to satiety to fish of initial weights of 230 and 80 g for either 8 or 6 weeks, respectively. FCR and daily growth rate improved markedly as both the CP and the lipid/energy content of the diet increased, showing a clear protein sparing effect of oil addition. In the experiment with the plate-size fish, there was no suggestion of an asymptotic response having been achieved at the highest dietary protein and lipid/energy concentrations examined, viz 52% CP and 18.3% lipid (gross energy, 21.0 kJ/g). In Experiment 2 with fingerling fish where higher dietary protein and energy concentrations were investigated, growth rate increased linearly with dietary CP for the highest oil addition series but was curvilinear for each of the two lower oil series; FCR response showed a curvilinear improvement with CP for each oil series. The asymptotic response for growth rate occurred at dietary CP contents of 61.5 and 59.8% for the 13 and 18% lipid series; for FCR, the asymptote occurred at 66.0, 59.7 and 62.4% for the 13, 18 and 21% lipid series, respectively. In both experiments, increasing the lipid/energy concentration of the diet resulted in an enhanced retention of gross energy with fat deposition appearing to be a major component of this improved energy conservation (total DM body lipid content increasing from 24.0 to 29.1% in Experiment 1 and from 20.3 to 32.7% in Experiment 2). The proportion of dietary N retained by the fish was not affected by the amount of protein in the diet other than for the lowest oil series in Experiment 1 (7% dietary lipid) where N retention increased linearly with dietary CP. These results indicate that the growth of both small and large barramundi can be markedly improved by the feeding of nutrient-dense diets. Although the protein requirement of barramundi can be spared to some extent by increasing the dietary lipid/energy content, the results clearly indicate the need for dietary protein specifications to be held to at least 55% CP and 18 to 20% lipid if the potential growth of barramundi is not to be unduly restricted.
Smith et al. FRDC Project No. 96/392
102 NSW Fisheries
The potential of nutrient dense diets (55% CP; 20% lipid) to further improve fish productivity and to minimise environmental impacts of the feed over that of standard diets (45% CP; 10% lipid) has given encouraging results under both laboratory and commercial cage culture conditions. Discount cash-flow modelling has showed the internal rate of return on investment to increase from 8 to 23% by feeding the nutrient dense diet compared to the standard diet.
Introduction
The optimum dietary protein content for juvenile barramundi was shown in earlier studies (FRDC 92/63) to be about 44% (≈40% digestible CP) in semi-purified diets containing a reference source of high quality protein and 16 MJ digestible energy (DE)/kg. That work indicated that the optimum dietary protein to energy ratio was 27.5 g CP:MJ DE or equivalent to ≈25 g Dig CP:MJ DE. Work from SEAFDEC in the Philippines (Catacutan & Coloso, 1995) similarly showed that growth and food conversion of juvenile barramundi was optimised at calculated dietary CP:DE values of 28.4 to 30.6 g.MJ in diets varying in DE from ≈11 to 17 MJ/kg. There is strong barramundi industry interest to follow the experience of the salmonid farmers of using very high energy diets both as a means of improving fish performance and also to spare for dietary protein. However, very preliminary work with a high energy (18 MJ DE/kg), low protein (32% CP; 26% Dig CP) diet gave very disappointing results in barramundi and may have made the fish more susceptible to disease. What is not known is whether barramundi can effectively use high energy diets when protein is adequate (i.e. maintaining or increasing the dietary protein to energy ratio) or whether they have a ceiling limit on dietary energy content. Two experiments were carried out to examine the interactive effects of dietary protein and lipid/energy in barramundi held under controlled (28ºC and 12:12 photoperiod) laboratory conditions.
General Methods
Experimental design and diets
The effect of altering the protein and energy concentration of the diet on growth and nutrient retention efficiency of barramundi was examined using a 4 (protein) x 3 (energy) factorial experiment with four block replicates. Nutrient retention was determined using comparative slaughter procedures. Feed ingredients were finely ground and mixed before forwarding to CSIRO's Division of Food Science & Technology at North Ryde where they were extruded through a twin-screw Instapro extruder. All diets were extruded at a common lipid content with additional oil added post-extrusion to satisfy the intended specification. The pelleted diets were held at -20°C until required and then thawed just prior to feeding. Fish management
Each experiment was carried out at QDPI's Freshwater Fisheries and Aquaculture Centre, Walkamin. Fish were held in tanks situated within an environment-controlled laboratory, which was supplied with underground fresh (<0.05 ‰) water. The experimental system comprised 48 fibreglass tanks (180 L; 0.3m2 surface area), which were arranged as four independent recirculation systems, each consisting of an up-flowing biological filter (120 L of fine gravel), reservoir (2 000 L) and 12 replicate tanks. Flows through the system were maintained using air lifts and pumps, with turn-over rate in the tanks being once every 0.5 h. Filters were back-washed every second day and water exchange was less than 10% per day (to replace water discarded during cleaning and filter back-flushing). Control over water temperature was maintained by lowering ambient temperature in the laboratory and heating the water in the reservoirs to 28°C; diurnal variation in water temperature in each recirculation system was no more than ± 0.5°C. The water in each recirculation system was monitored daily for temperature and pH and periodically (2-3/week)
FRDC Project No. 96/392 Smith et al.
NSW Fisheries 103
for ammonia and nitrite. Photoperiod was held to a constant 12:12 h cycle. Fish of a single spawning cohort and numbering several thousand were sorted according to weight and freedom of physical abnormalities into like-weight groups (blocks). Within these block groups, fish were equally distributed to the 12 tanks in each recirculation system and the diet treatments randomly allocated to tanks. Lighting was standardised to a 12-12 cycle. Fish were weighed fortnightly and fed to appetite once daily. Fish were acclimatised to the experimental conditions for 2 to 3 weeks prior to the start of the experiment. In the week preceding the start, fish were given a prophylactic salt bath (1.2% NaCl for 2 h) against ectoparasites. Fish were weighed fortnightly using 2-phenoxyethanol for sedation purposes. Chemical and statistical analyses
Samples of finely ground and homogenized constituents were analysed in duplicate by standard laboratory methods essentially in accordance with AOAC (1990) recommendations at QDPI's Animal Research Institute, Yeerongpilly. Dry matter (DM) was determined by oven drying at 105°C to constant weight, ash by ignition at 600°C for 2 h, N by a macro-Kjeldahl technique on a Kjel Foss automatic analyser using mercury in the digestion and crude fat (C-fat) by soxhlet extraction with petroleum ether (bp 40 to 60°C) for 16 h. Crude protein (CP) was calculated by using the conversion factor of 6.25 irrespective of the nature of the N. Total lipid was determined after a Bligh and Dyer (1959) extraction as modified by Christie (1982) and fatty acids as the methyl ester by capillary gas chromatography. A hydrochloric acid extract of the ash was used to determine calcium by atomic absorption spectroscopy, and phosphorus by colorimetric procedures (AOAC 1990). Gross energy (GE) was determined by isothermal bomb calorimeter using a microprocessor-controlled Lecco AC 200 automatic bomb calorimeter. Amino acid composition was determined by ion-exchange chromatography using Waters' HPLC following hydrolysis of samples with 6 M HCl at 110°C under an atmosphere of N2 for 18 h. Cystine (Cysh) was measured as cysteic acid, and Met as methionine sulfone after performic acid oxidation. Tryptophan (Tryp) was determined by the method of Allred & MacDonald (1988) with 4.2 M NaOH at 110°C under an atmosphere of N2 for 20 h. For determination of the chemical composition of the fish, weighed whole fish were placed into a 2 L wide-mouth glass jar (either 4 fish from each experimental tank per jar or individual fish for the pre-experimental group) and autoclaved at 126°C for 4 h as described by Williams et al. (1995). The autoclaved sample was homogenised in situ using a high-speed laboratory blender and the contents transferred to trays for freeze-drying. All changes in weight of the sample during autoclaving were attributed to water exchange and the chemical composition expressed relative to the original weight of the fish. Fish response data were subjected to an analysis of variance in accordance with the design of the experiment using prepared statistical programs (Siegel 1992). Growth rate was determined as the difference between end (We) and start (Ws) weights divided by the number of days on experiment; specific growth rate (SGR, % per d) was calculated as: 100 x (ln We - ln Ws)/d. Due to inevitable weight changes of the fish during the acclimatisation period, response data were adjusted by covariance analysis to isolate any effect of initial weight disparity on treatment response. Differences between treatment effects were examined a-posteriorly using Fischer's protected 't' test (Snedecor and Cochran, 1967) wherein differences between means were examined only where the 'F' test of the ANOVA was significant (P < 0.05).
Smith et al. FRDC Project No. 96/392
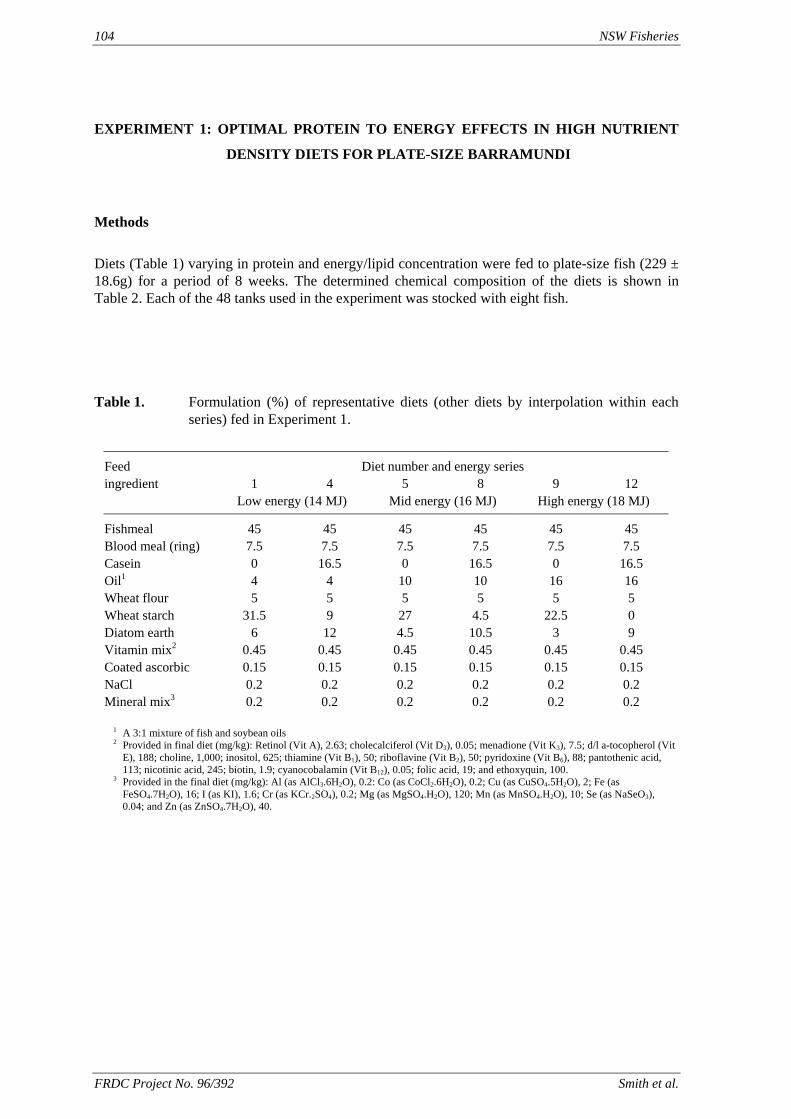
104 NSW Fisheries
EXPERIMENT 1: OPTIMAL PROTEIN TO ENERGY EFFECTS IN HIGH NUTRIENT
DENSITY DIETS FOR PLATE-SIZE BARRAMUNDI
Methods
Diets (Table 1) varying in protein and energy/lipid concentration were fed to plate-size fish (229 ± 18.6g) for a period of 8 weeks. The determined chemical composition of the diets is shown in Table 2. Each of the 48 tanks used in the experiment was stocked with eight fish. Table 1. Formulation (%) of representative diets (other diets by interpolation within each
series) fed in Experiment 1.
Feed Diet number and energy series ingredient 1 4 5 8 9 12 Low energy (14 MJ) Mid energy (16 MJ) High energy (18 MJ)
Fishmeal 45 45 45 45 45 45 Blood meal (ring) 7.5 7.5 7.5 7.5 7.5 7.5
16.5 4 16
0 Diatom earth 6 12 4.5 9 Vitamin mix2 0.45 0.45 0.45
Casein 0 16.5 0 16.5 0 Oil1 4 10 10 16 Wheat flour 5 5 5 5 5 5 Wheat starch 31.5 9 27 4.5 22.5
10.5 3 0.45 0.45 0.45
Coated ascorbic 0.15 0.15 0.15 0.15 0.15 0.15 NaCl 0.2 0.2 0.2 0.2 0.2 0.2 Mineral mix3 0.2 0.2 0.2 0.2 0.2 0.2
1 A 3:1 mixture of fish and soybean oils 2 Provided in final diet (mg/kg): Retinol (Vit A), 2.63; cholecalciferol (Vit D3), 0.05; menadione (Vit K3), 7.5; d/l a-tocopherol (Vit
E), 188; choline, 1,000; inositol, 625; thiamine (Vit B1), 50; riboflavine (Vit B2), 50; pyridoxine (Vit B6), 88; pantothenic acid, 113; nicotinic acid, 245; biotin, 1.9; cyanocobalamin (Vit B12), 0.05; folic acid, 19; and ethoxyquin, 100.
3 Provided in the final diet (mg/kg): Al (as AlCl3.6H2O), 0.2: Co (as CoCl2.6H2O), 0.2; Cu (as CuSO4.5H2O), 2; Fe (as FeSO4.7H2O), 16; I (as KI), 1.6; Cr (as KCr.2SO4), 0.2; Mg (as MgSO4.H2O), 120; Mn (as MnSO4.H2O), 10; Se (as NaSeO3), 0.04; and Zn (as ZnSO4.7H2O), 40.
FRDC Project No. 96/392 Smith et al.
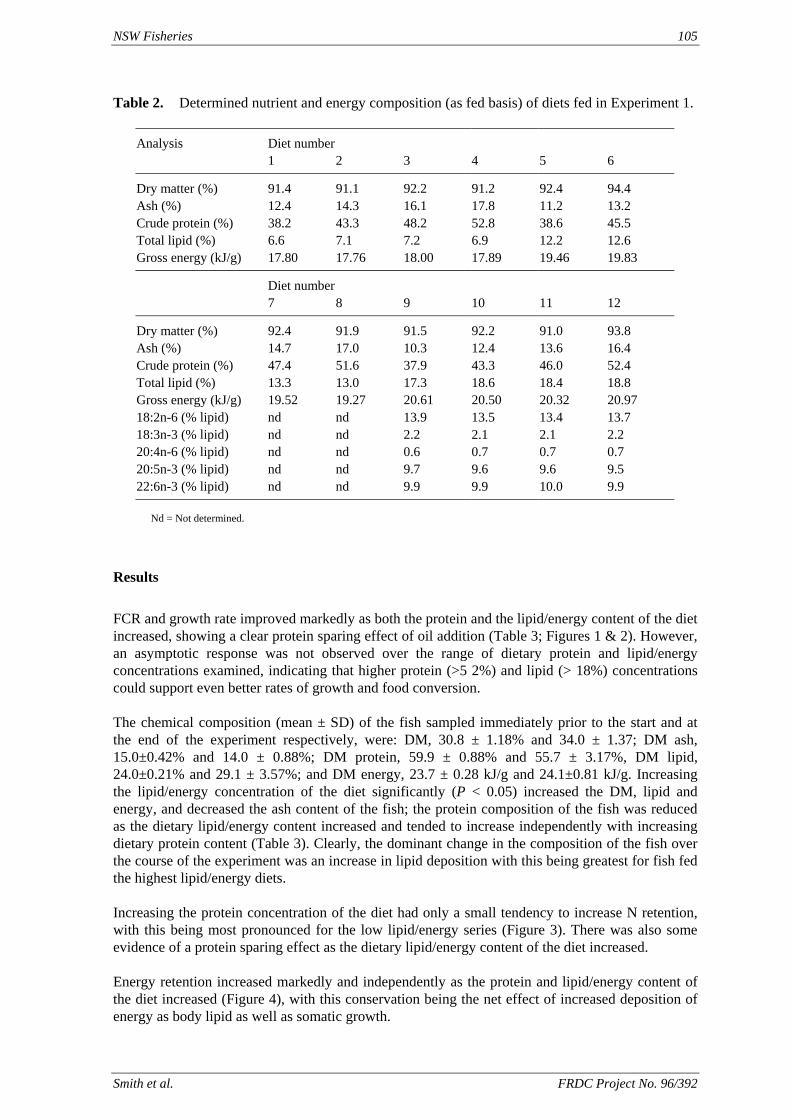
NSW Fisheries 105
Table 2. Determined nutrient and energy composition (as fed basis) of diets fed in Experiment 1.
Analysis Diet number 1 2 3 4 5 6
Dry matter (%) 91.4 91.1 92.2 91.2 92.4 94.4 Ash (%) 12.4 14.3 16.1 17.8 11.2 13.2 Crude protein (%) 38.2 43.3 48.2 52.8 38.6 45.5 Total lipid (%) 6.6 7.1 7.2 6.9 12.2 12.6
7
91.0 16.4
Gross energy (kJ/g) nd
nd 0.7
9.6
Gross energy (kJ/g) 17.80 17.76 18.00 17.89 19.46 19.83
Diet number 8 9 11 12
Dry matter (%) 92.4 91.9 91.5 92.2 93.8 Ash (%) 14.7 17.0 10.3 12.4 13.6
47.4 51.6 37.9 43.3 46.0 52.4 Total lipid (%) 13.3 13.0 17.3 18.4 18.8
19.52 19.27 20.61 20.50 20.32 20.97 nd 13.9 13.5 13.4 13.7
18:3n-3 (% lipid) nd 2.2 2.1 2.2 20:4n-6 (% lipid) nd nd 0.6 0.7 0.7
nd nd 9.7 9.6 9.5 22:6n-3 (% lipid) nd nd 9.9
Nd = Not determined.
Results
FCR and growth rate improved markedly as both the protein and the lipid/energy content of the diet increased, showing a clear protein sparing effect of oil addition (Table 3; Figures 1 & 2). However, an asymptotic response was not observed over the range of dietary protein and lipid/energy concentrations examined, indicating that higher protein (>5 2%) and lipid (> 18%) concentrations could support even better rates of growth and food conversion. The chemical composition (mean ± SD) of the fish sampled immediately prior to the start and at the end of the experiment respectively, were: DM, 30.8 ± 1.18% and 34.0 ± 1.37; DM ash, 15.0±0.42% and 14.0 ± 0.88%; DM protein, 59.9 ± 0.88% and 55.7 ± 3.17%, DM lipid, 24.0±0.21% and 29.1 ± 3.57%; and DM energy, 23.7 ± 0.28 kJ/g and 24.1±0.81 kJ/g. Increasing the lipid/energy concentration of the diet significantly (P < 0.05) increased the DM, lipid and energy, and decreased the ash content of the fish; the protein composition of the fish was reduced as the dietary lipid/energy content increased and tended to increase independently with increasing dietary protein content (Table 3). Clearly, the dominant change in the composition of the fish over the course of the experiment was an increase in lipid deposition with this being greatest for fish fed the highest lipid/energy diets.
Energy retention increased markedly and independently as the protein and lipid/energy content of the diet increased (Figure 4), with this conservation being the net effect of increased deposition of energy as body lipid as well as somatic growth.
10
Crude protein (%) 18.6
18:2n-6 (% lipid) 2.1
20:5n-3 (% lipid) 9.9 10.0 9.9
Increasing the protein concentration of the diet had only a small tendency to increase N retention, with this being most pronounced for the low lipid/energy series (Figure 3). There was also some evidence of a protein sparing effect as the dietary lipid/energy content of the diet increased.
Smith et al. FRDC Project No. 96/392
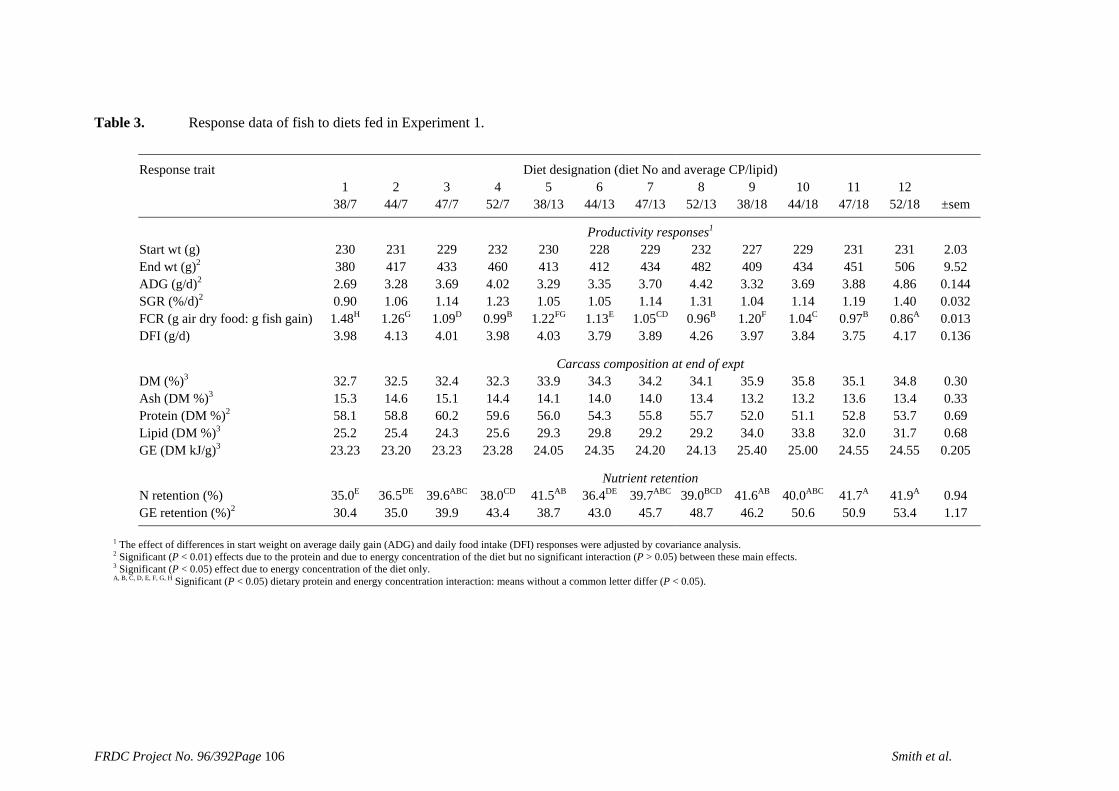
Table 3. Response data of fish to diets fed in Experiment 1.
Response trait Diet designation (diet No and average CP/lipid) 1 5 7 10 12
2 3 4 6 8 9 1138/7 44/7 47/7 52/7 38/13 44/13 47/13 52/13 38/18 44/18 47/18 52/18 ±sem
Productivity responses1 Start wt (g)
.8 .7 3 25.00 24.55
Nutrient retention N retention (%) 35.0E 36.5DE 39.6ABC 38.0CD 41.5AB 36.4DE 39.7ABC
230 231 229433
232 230 228 229 232 227 229 231 231 2.03End wt (g)2 380 417 460 413 412 434 482 409 434 451 506 9.52ADG (g/d)2 2.69 3.28 3.69 4.02 3.29 3.35 3.70 4.42 3.32 3.69 3.88 4.86 0.144SGR (%/d)2 0.90 1.06 1.14 1.23 1.05 1.05 1.14 1.31 1.04 1.14 1.19 1.40 0.032FCR (g air dry food: g fish gain)
1.48H 1.26G 1.09D 0.99B 1.22FG 1.13E 1.05CD 0.96B 1.20F 1.04C 0.97B 0.86A 0.013
DFI (g/d) 3.98 4.13 4.01 3.98 4.03 3.79 3.89 4.26 3.97 3.84 3.75 4.17 0.136
Carcass composition at end of expt DM (%)3 32.7 32.5 32.4 32.3 33.9 34.3 34.2 34.1 35.9 35.8 35.1 34.8 0.30
Ash (DM %)3 15.3 14.6 15.1 14.4 14.1 14.0 14.0 13.4 13.2 13.2 13.6 13.4 0.33Protein (DM %)2 58.1 58.8 60.2 59.6 56.0
29.354.3 55.8 55.7 52.0 51.1
3352.8 53.7
310.69
Lipid (DM %)3 25.2 25.4 24.3 25.6 29.8 29.2 29.224.1
34.0 32.0 0.68GE (DM kJ/g)3 23.23 23.20 23.23 23.28 24.05 24.35 24.20 25.40 24.55 0.205
39.0BCD 41.6AB 40.0ABC 41.7A 41.9A 0.94GE retention (%)2 30.4 35.0 39.9 43.4 38.7 43.0 45.7 48.7 46.2 50.6 50.9 53.4 1.17
1 The effect of differences in start weight on average daily gain (ADG) and daily food intake (DFI) responses were adjusted by covariance analysis. 2 Significant (P < 0.01) effects due to the protein and due to energy concentration of the diet but no significant interaction (P > 0.05) between these main effects. 3 Significant (P < 0.05) effect due to energy concentration of the diet only. A, B, C, D, E, F, G, H Significant (P < 0.05) dietary protein and energy concentration interaction: means without a common letter differ (P < 0.05).
FRDC Project No. 96/392Page 106 Smith et al.
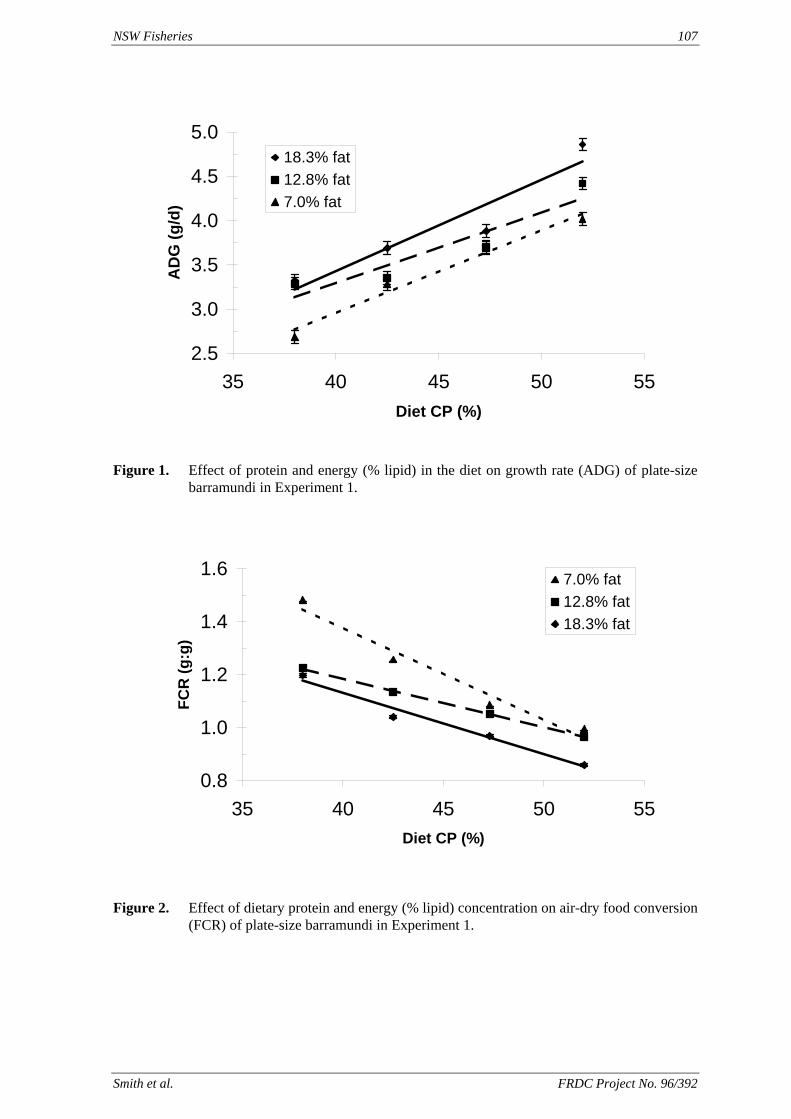
NSW Fisheries 107
2.5
3.0
3.5
4.0
4.5
5.0
35 40 45 50 55Diet CP (%)
AD
G (g
/d)
18.3% fat12.8% fat7.0% fat
Figure 1. Effect of protein and energy (% lipid) in the diet on growth rate (ADG) of plate-size
barramundi in Experiment 1.
0.8
1.0
1.2
1.4
1.6
35 40 45 50 55Diet CP (%)
FCR
(g:g
)
7.0% fat12.8% fat18.3% fat
Figure 2. Effect of dietary protein and energy (% lipid) concentration on air-dry food conversion (FCR) of plate-size barramundi in Experiment 1.
Smith et al. FRDC Project No. 96/392
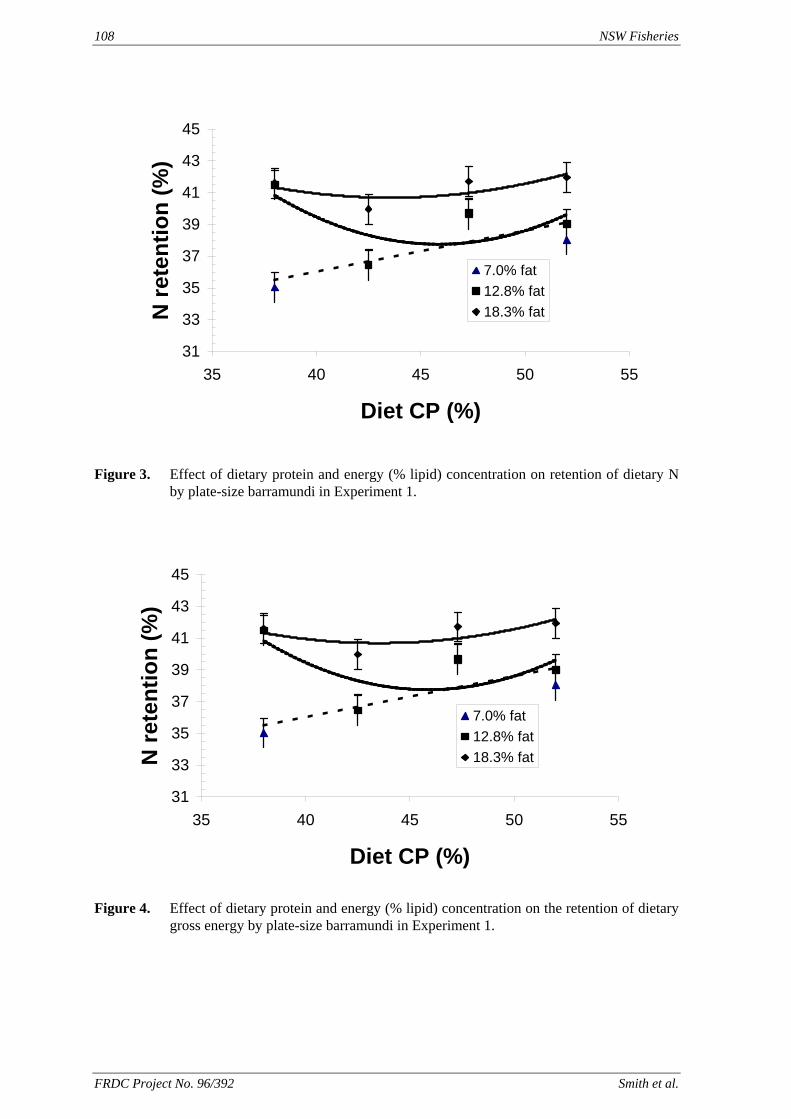
108 NSW Fisheries
31
33
35
37
39
41
43
45
35 40 45 50 55
Diet CP (%)
N re
tent
ion
(%)
7.0% fat12.8% fat18.3% fat
Figure 3. Effect of dietary protein and energy (% lipid) concentration on retention of dietary N
by plate-size barramundi in Experiment 1.
31
33
35
37
39
41
43
45
35 40 45 50 55
Diet CP (%)
N re
tent
ion
(%)
7.0% fat12.8% fat18.3% fat
Figure 4. Effect of dietary protein and energy (% lipid) concentration on the retention of dietary gross energy by plate-size barramundi in Experiment 1.
FRDC Project No. 96/392 Smith et al.
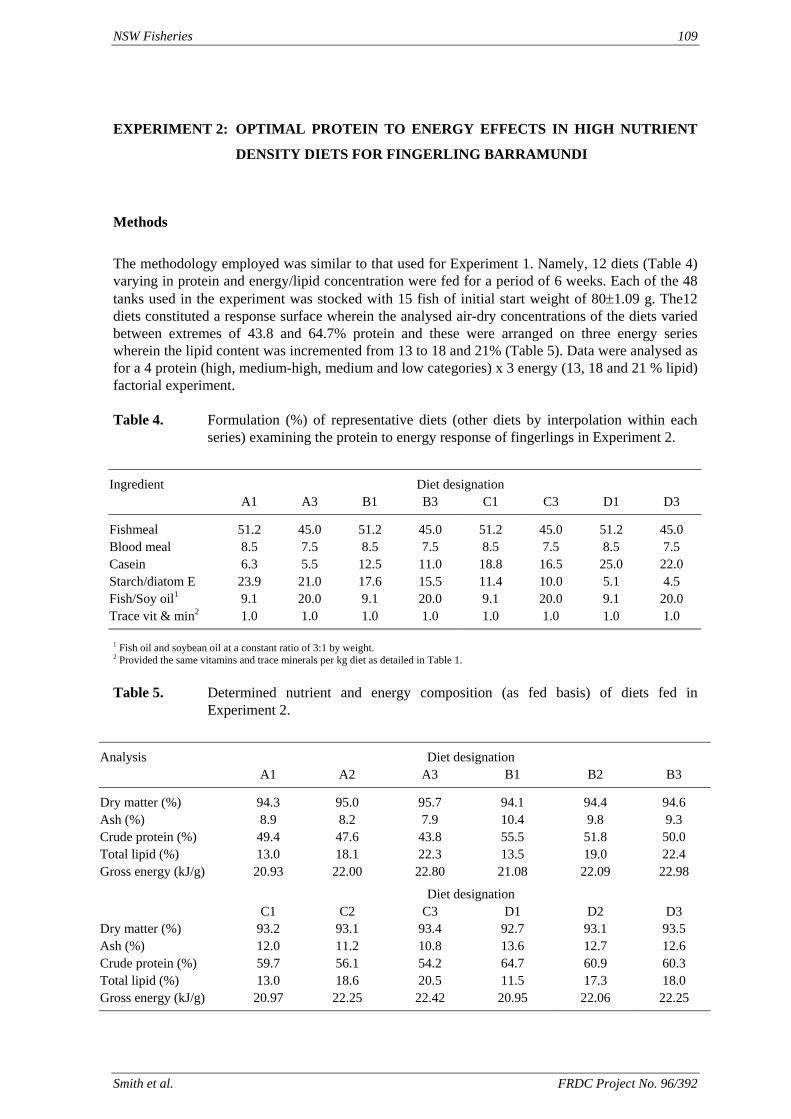
NSW Fisheries 109
EXPERIMENT 2: OPTIMAL PROTEIN TO ENERGY EFFECTS IN HIGH NUTRIENT
DENSITY DIETS FOR FINGERLING BARRAMUNDI
Methods
The methodology employed was similar to that used for Experiment 1. Namely, 12 diets (Table 4) varying in protein and energy/lipid concentration were fed for a period of 6 weeks. Each of the 48 tanks used in the experiment was stocked with 15 fish of initial start weight of 80±1.09 g. The12 diets constituted a response surface wherein the analysed air-dry concentrations of the diets varied between extremes of 43.8 and 64.7% protein and these were arranged on three energy series wherein the lipid content was incremented from 13 to 18 and 21% (Table 5). Data were analysed as for a 4 protein (high, medium-high, medium and low categories) x 3 energy (13, 18 and 21 % lipid) factorial experiment. Table 4. Formulation (%) of representative diets (other diets by interpolation within each
series) examining the protein to energy response of fingerlings in Experiment 2.
Ingredient Diet designation A1 A3 B1 B3 C1 C3 D1 D3
Fishmeal 51.2 45.0 51.2 45.0 51.2 45.0 51.2 45.0 Blood meal 8.5 7.5 8.5 7.5 8.5 7.5 8.5 7.5 Casein 6.3 5.5 12.5 11.0 18.8 16.5 25.0 22.0 Starch/diatom E 23.9 21.0 17.6 15.5 11.4 10.0 5.1 4.5 Fish/Soy oil1 9.1 20.0 9.1 20.0 9.1 20.0 9.1 20.0 Trace vit & min2 1.0 1.0 1.0 1.0 1.0 1.0 1.0 1.0 1 Fish oil and soybean oil at a constant ratio of 3:1 by weight. 2 Provided the same vitamins and trace minerals per kg diet as detailed in Table 1. Table 5. Determined nutrient and energy composition (as fed basis) of diets fed in
Experiment 2.
Analysis Diet designation A1 A2 A3 B1 B2 B3
Dry matter (%) 94.3 95.0 95.7 94.1 94.4 94.6 Ash (%) 8.9 8.2 7.9 10.4 9.8 9.3 Crude protein (%) 49.4 47.6 43.8 55.5 51.8 50.0 Total lipid (%) 13.0 18.1 22.3 13.5 19.0 22.4 Gross energy (kJ/g) 20.93 22.00 22.80 21.08 22.09 22.98
Diet designation C1 C2 C3 D1 D2 D3 Dry matter (%)
Total lipid (%) 22.06
93.2 93.1 93.4 92.7 93.1 93.5 Ash (%) 12.0 11.2 10.8 13.6 12.7 12.6 Crude protein (%) 59.7 56.1 54.2 64.7 60.9 60.3
13.0 18.6 20.5 11.5 17.3 18.0 Gross energy (kJ/g) 20.97 22.25 22.42 20.95 22.25
Smith et al. FRDC Project No. 96/392
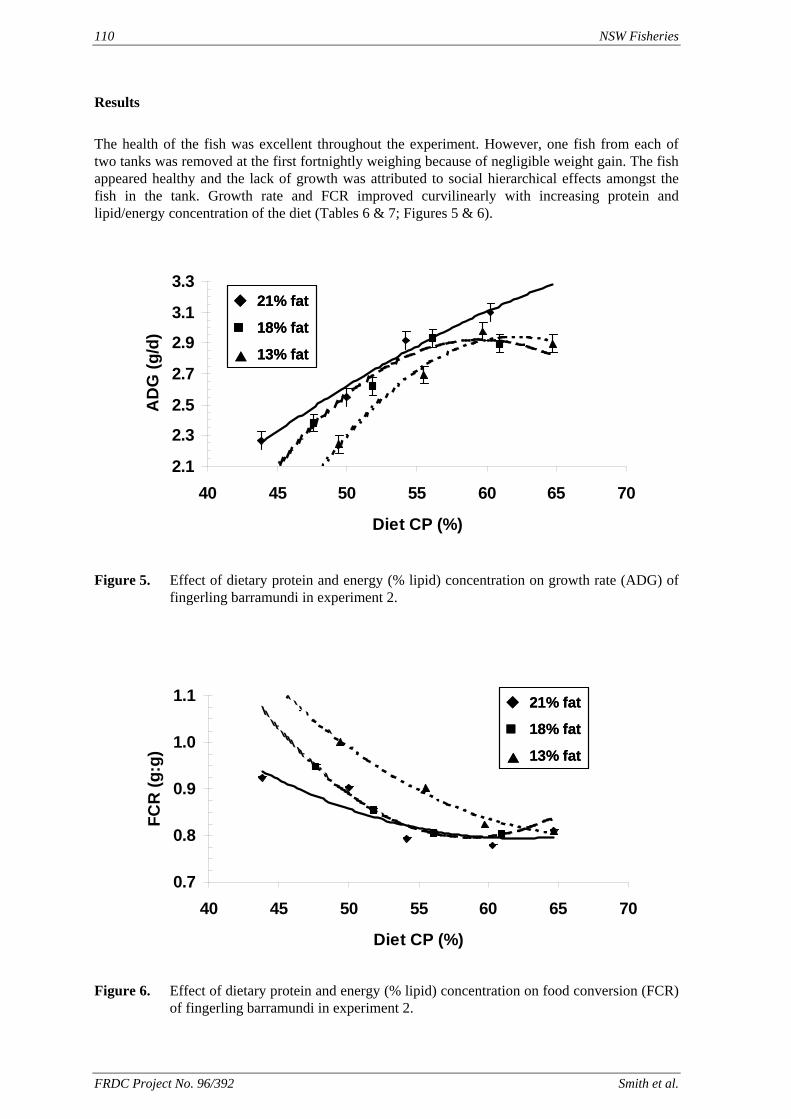
110 NSW Fisheries
Results
The health of the fish was excellent throughout the experiment. However, one fish from each of two tanks was removed at the first fortnightly weighing because of negligible weight gain. The fish appeared healthy and the lack of growth was attributed to social hierarchical effects amongst the fish in the tank. Growth rate and FCR improved curvilinearly with increasing protein and lipid/energy concentration of the diet (Tables 6 & 7; Figures 5 & 6).
2.1
2.3
2.5
2.7
2.9
3.1
3.3
40 45 50 55 60 65 70
Diet CP (%)
AD
G (g
/d)
21% fat
18% fat
13% fat
2.1
2.3
2.5
2.7
2.9
3.1
3.3
40 45 50 55 60 65 70
Diet CP (%)
AD
G (g
/d)
21% fat
18% fat
13% fat
21% fat
18% fat
13% fat
Figure 5. Effect of dietary protein and energy (% lipid) concentration on growth rate (ADG) of fingerling barramundi in experiment 2.
0.7
0.8
0.9
1.0
1.1
40 45 50 55 60 65 70
Diet CP (%)
FCR
(g:g
)
21% fat
18% fat
13% fat
0.7
0.8
0.9
1.0
1.1
40 45 50 55 60 65 70
Diet CP (%)
FCR
(g:g
)
21% fat
18% fat
13% fat
21% fat
18% fat
13% fat
Figure 6. Effect of dietary protein and energy (% lipid) concentration on food conversion (FCR)
of fingerling barramundi in experiment 2.
FRDC Project No. 96/392 Smith et al.
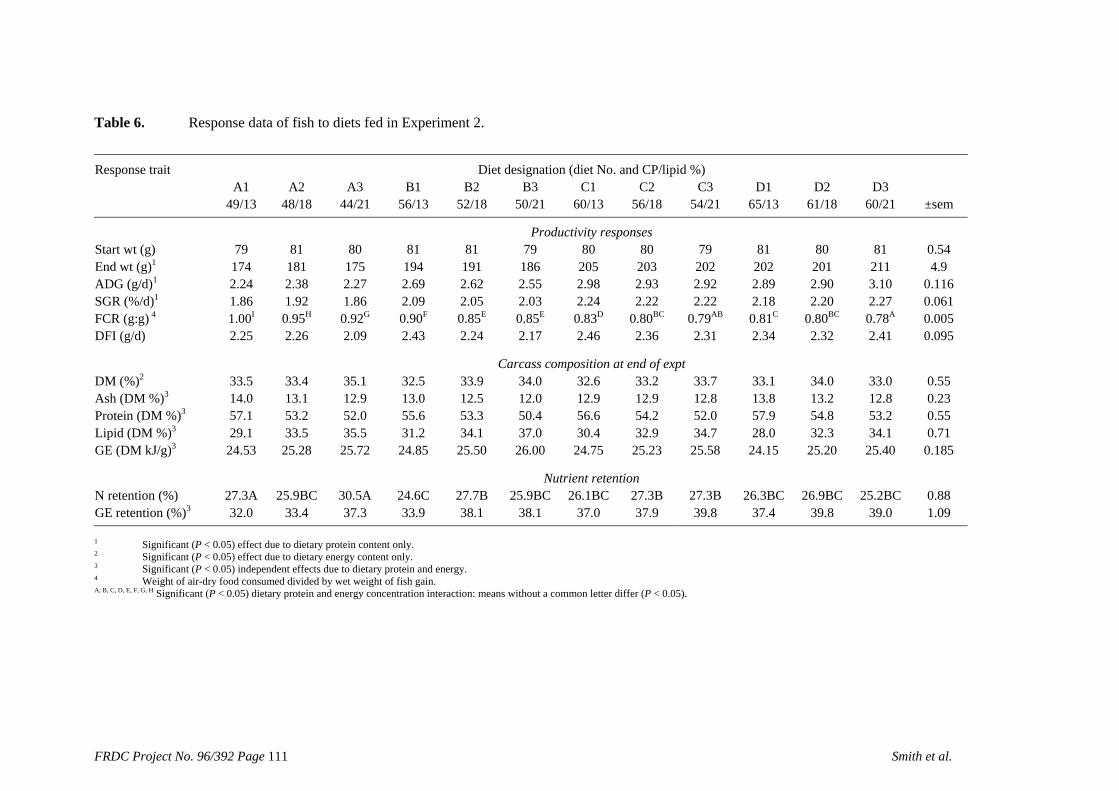
Table 6. Response data of fish to diets fed in Experiment 2. Response trait
Diet designation (diet No. and CP/lipid %) A1
A2 A3 B1 B2 B3 C1 C2 C3 D1 D2 D3
49/13 48/18 44/21 56/13 52/18 50/21 60/13 56/18 54/21 65/13 61/18 60/21 ±sem
Productivity responses Start wt (g)
8 5
27.3B
79 81 80 81 81 79 80 80 79 81 80 81 0.54End wt (g)1 174 181 175 194 191 186 205 203 202 202 201 211 4.9ADG (g/d)1 2.24 2.38 2.27 2.69 2.62 2.55 2.98 2.93 2.92 2.89 2.90 3.10 0.116SGR (%/d)1 1.86 1.92 1.86 2.09 2.05 2.03 2.24 2.22 2.22 2.18 2.20 2.27 0.061FCR (g:g) 4 1.00I 0.95H 0.92G 0.90F 0.85E 0.85E 0.83D 0.80BC 0.79AB 0.81C 0.80BC 0.78A 0.005DFI (g/d) 2.25 2.26 2.09 2.43 2.24 2.17 2.46 2.36 2.31 2.34 2.32 2.41 0.095
Carcass composition at end of expt DM (%)2 33.5 33.4 35.1 32.5 33.9 34.0 32.6 33.2 33.7 33.1 34.0 33.0 0.55
Ash (DM %)3 14.0 13.153.2
12.9 13.0 12.5 12.0 12.9 12.9 12.8 13.8 13.2 12.8 0.23Protein (DM %)3 57.1 52.0 55.6 53.3 50.4 56.6 54.2 52.0 57.9 54.8 53.2 0.55Lipid (DM %)3 29.1 33.5 35.5 31.2 34.1 37.0 30.4 32.9 34.7
25.528.0 32.3 34.1 0.71
0.18GE (DM kJ/g)3 24.53 25.28 25.72 24.85 25.50 26.00 24.75 25.23 24.15 25.20 25.40
Nutrient retention N retention (%) 27.3A 25.9BC 30.5A 24.6C 27.7B 25.9BC
38.1 26.1BC 27.3B 26.3BC
37.426.9BC 25.2BC 0.88
GE retention (%)3 32.0 33.4 37.3 33.9 38.1 37.0 37.9 39.8 39.8 39.0 1.09
4
1 Significant (P < 0.05) effect due to dietary protein content only. 2 Significant (P < 0.05) effect due to dietary energy content only. 3 Significant (P < 0.05) independent effects due to dietary protein and energy. Weight of air-dry food consumed divided by wet weight of fish gain.
A, B, C, D, E, F, G, H Significant (P < 0.05) dietary protein and energy concentration interaction: means without a common letter differ (P < 0.05).
FRDC Project No. 96/392 Page 111 Smith et al.
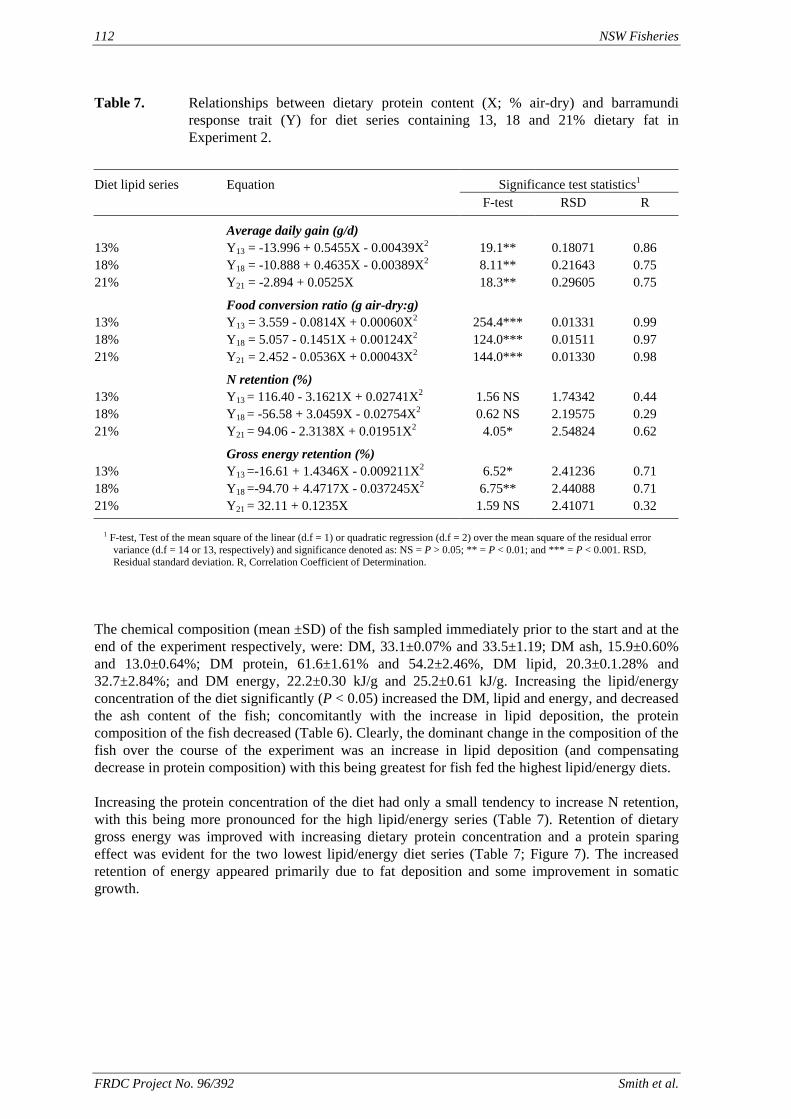
112 NSW Fisheries
Table 7. Relationships between dietary protein content (X; % air-dry) and barramundi response trait (Y) for diet series containing 13, 18 and 21% dietary fat in Experiment 2.
Diet lipid series Equation Significance test statistics1 F-test RSD R
Average daily gain (g/d) 13% Y13 = -13.996 + 0.5455X - 0.00439X2 19.1** 0.18071 0.86 18% Y18 = -10.888 + 0.4635X - 0.00389X2 8.11** 21% 0.75
13% Y13 = 3.559 - 0.0814X + 0.00060X2 0.99 18% 124.0***
N retention (%) 0.44
18% Y18 = -56.58 + 3.0459X - 0.02754X2 0.62 NS 2.19575 0.29 21% Y21 = 94.06 - 2.3138X + 0.01951X2 4.05*
13%
0.21643 0.75 Y21 = -2.894 + 0.0525X 18.3** 0.29605
Food conversion ratio (g air-dry:g) 254.4*** 0.01331
Y18 = 5.057 - 0.1451X + 0.00124X2 0.01511 0.97 21% Y21 = 2.452 - 0.0536X + 0.00043X2 144.0*** 0.01330 0.98
13% Y13 = 116.40 - 3.1621X + 0.02741X2 1.56 NS 1.74342
2.54824 0.62
Gross energy retention (%) Y13 =-16.61 + 1.4346X - 0.009211X2 6.52* 2.41236 0.71
18% Y18 =-94.70 + 4.4717X - 0.037245X2 6.75** 2.44088 0.71 21% Y21 = 32.11 + 0.1235X 1.59 NS 2.41071 0.32
1 F-test, Test of the mean square of the linear (d.f = 1) or quadratic regression (d.f = 2) over the mean square of the residual error
variance (d.f = 14 or 13, respectively) and significance denoted as: NS = P > 0.05; ** = P < 0.01; and *** = P < 0.001. RSD, Residual standard deviation. R, Correlation Coefficient of Determination.
The chemical composition (mean ±SD) of the fish sampled immediately prior to the start and at the end of the experiment respectively, were: DM, 33.1±0.07% and 33.5±1.19; DM ash, 15.9±0.60% and 13.0±0.64%; DM protein, 61.6±1.61% and 54.2±2.46%, DM lipid, 20.3±0.1.28% and 32.7±2.84%; and DM energy, 22.2±0.30 kJ/g and 25.2±0.61 kJ/g. Increasing the lipid/energy concentration of the diet significantly (P < 0.05) increased the DM, lipid and energy, and decreased the ash content of the fish; concomitantly with the increase in lipid deposition, the protein composition of the fish decreased (Table 6). Clearly, the dominant change in the composition of the fish over the course of the experiment was an increase in lipid deposition (and compensating decrease in protein composition) with this being greatest for fish fed the highest lipid/energy diets. Increasing the protein concentration of the diet had only a small tendency to increase N retention, with this being more pronounced for the high lipid/energy series (Table 7). Retention of dietary gross energy was improved with increasing dietary protein concentration and a protein sparing effect was evident for the two lowest lipid/energy diet series (Table 7; Figure 7). The increased retention of energy appeared primarily due to fat deposition and some improvement in somatic growth.
FRDC Project No. 96/392 Smith et al.
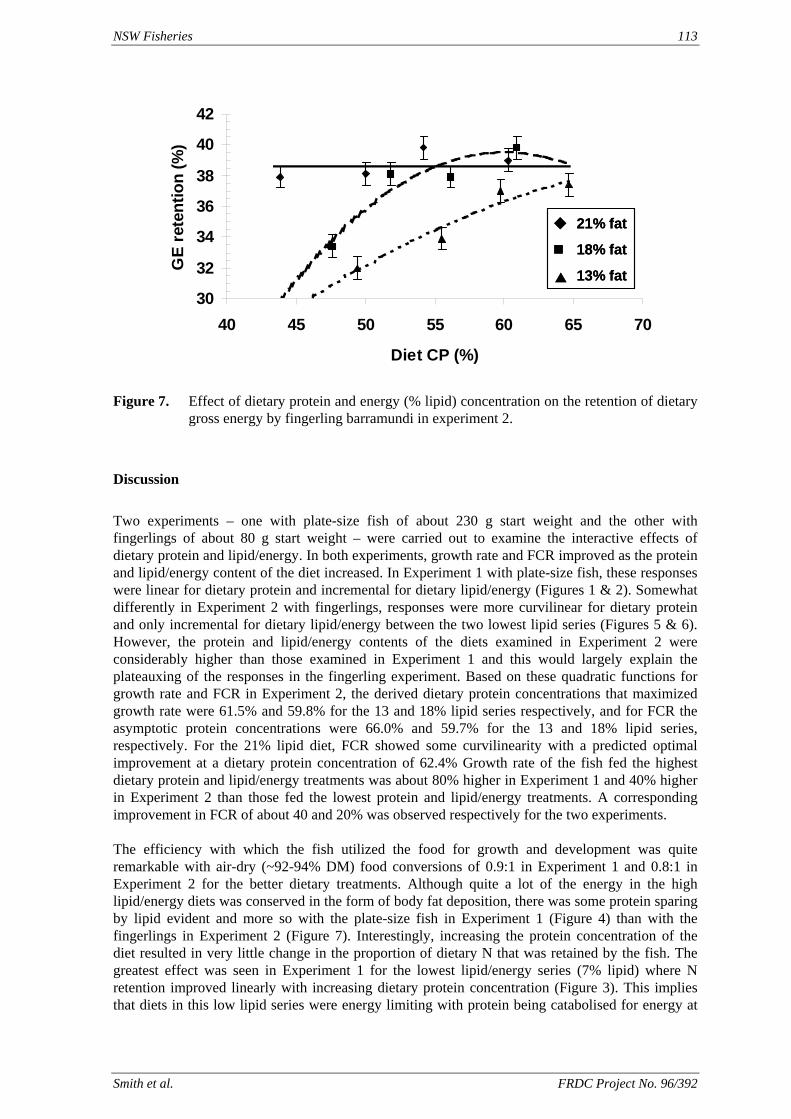
NSW Fisheries 113
30
32
34
36
38
40
42
40 45 50 55 60 65 70
Diet CP (%)
GE
rete
ntio
n (%
)
21% fat
18% fat
13% fat30
32
34
36
38
40
42
40 45 50 55 60 65 70
Diet CP (%)
GE
rete
ntio
n (%
)
21% fat
18% fat
13% fat
21% fat
18% fat
13% fat
Figure 7. Effect of dietary protein and energy (% lipid) concentration on the retention of dietary gross energy by fingerling barramundi in experiment 2.
Discussion
Two experiments – one with plate-size fish of about 230 g start weight and the other with fingerlings of about 80 g start weight – were carried out to examine the interactive effects of dietary protein and lipid/energy. In both experiments, growth rate and FCR improved as the protein and lipid/energy content of the diet increased. In Experiment 1 with plate-size fish, these responses were linear for dietary protein and incremental for dietary lipid/energy (Figures 1 & 2). Somewhat differently in Experiment 2 with fingerlings, responses were more curvilinear for dietary protein and only incremental for dietary lipid/energy between the two lowest lipid series (Figures 5 & 6). However, the protein and lipid/energy contents of the diets examined in Experiment 2 were considerably higher than those examined in Experiment 1 and this would largely explain the plateauxing of the responses in the fingerling experiment. Based on these quadratic functions for growth rate and FCR in Experiment 2, the derived dietary protein concentrations that maximized growth rate were 61.5% and 59.8% for the 13 and 18% lipid series respectively, and for FCR the asymptotic protein concentrations were 66.0% and 59.7% for the 13 and 18% lipid series, respectively. For the 21% lipid diet, FCR showed some curvilinearity with a predicted optimal improvement at a dietary protein concentration of 62.4% Growth rate of the fish fed the highest dietary protein and lipid/energy treatments was about 80% higher in Experiment 1 and 40% higher in Experiment 2 than those fed the lowest protein and lipid/energy treatments. A corresponding improvement in FCR of about 40 and 20% was observed respectively for the two experiments. The efficiency with which the fish utilized the food for growth and development was quite remarkable with air-dry (~92-94% DM) food conversions of 0.9:1 in Experiment 1 and 0.8:1 in Experiment 2 for the better dietary treatments. Although quite a lot of the energy in the high lipid/energy diets was conserved in the form of body fat deposition, there was some protein sparing by lipid evident and more so with the plate-size fish in Experiment 1 (Figure 4) than with the fingerlings in Experiment 2 (Figure 7). Interestingly, increasing the protein concentration of the diet resulted in very little change in the proportion of dietary N that was retained by the fish. The greatest effect was seen in Experiment 1 for the lowest lipid/energy series (7% lipid) where N retention improved linearly with increasing dietary protein concentration (Figure 3). This implies that diets in this low lipid series were energy limiting with protein being catabolised for energy at
Smith et al. FRDC Project No. 96/392
114 NSW Fisheries
the expense of being used for somatic growth. As the protein concentration of the diet increased, such that the additional protein provided a more utilizable form of metabolic energy, proportionally more of the dietary protein was available to be used for protein synthesis and hence, for somatic growth. However, where there was a sufficient source of metabolic energy, derived from lipid or protein sources, the somatic growth of the fish was maximized and associated improvements in growth rate due to increased lipid deposition. These results show that productivity of barramundi can be markedly improved by increasing the protein and energy concentrations of the diet. However, as shown in these experiments and previously observed, barramundi have only a limited ability to use lipid as a primary energy source unless diets are also adequately supplied with protein. That is, they have only a limited capacity to use lipid to spare for dietary protein. In this regard they differ from salmonids where enhanced productivity has been achieved by using lipid at high dietary concentrations (above 30%) to substantially spare for protein (Arzel et al. 1998; Rasmussen et al. 2000). The results of these experiments with barramundi indicate that even higher rates of growth may be possible if even more nutrient dense diets are fed. However, any such increase in growth rate would almost certainly be expressed in the form of as increased lipid deposition rather than as somatic growth. Whether or not it is desirable to produce ‘fatty’ fish is questionable and market dependent. If fish are sold whole rather than gill and gutted as is the present situation, the greater weight of fish produced could benefit the farmer. Conversely, if fish are sold gill and gutted, dress-out percentage of fatty fish will be lower than for lean fish since abdominal fat constitutes a large proportion of stored fat. Very fatty fish may also have less appeal in the market place since it can impart an undesirable greyish colouration of the fillet (C. Phillips, pers. comm.) and the keeping qualities of the fish are worse. On a plus side, the human health benefits of an increased intake of omega-3 lipids could have positive marketing advantages. From practical considerations, it will be difficult to formulate diets with nutrient concentrations much higher than about 50-55% CP and 20-25% lipid without using much more expensive protein feed ingredients such as casein and protein isolates. These experiments have clearly shown that barramundi need to be fed on diets containing at least 50-55% protein and 18-20% lipid if the potential growth of the fish is not to be unduly restricted. In order to assess the economic implications of using high nutrient dense diets in barramundi farming, data from three laboratory studies were pooled (Figure 8) to provide growth curves for fish reared on either a nutrient dense (ND) diet (55% protein and 20% lipid) or a standard barramundi (SB) diet (45% protein and ~10% lipid) from about 100 g to a market weight exceeding 500 g. This showed that fish fed the SB diet took an extra 45 days to attain a weight of 500 g as compared to those fed the ND diet. Alternatively, after a feed-out period of 120 days, fish fed the ND diet would have been about 650 g and 290 g heavier than those fed the SB diet. The economic impact of differences in growth rate of this magnitude were modelled using a cash-flow barramundi farm model – BARRAPROFIT - developed by QDPI ( Johnston 1998). The model was based on a farm size producing 50 t of barramundi per year.
FRDC Project No. 96/392 Smith et al.
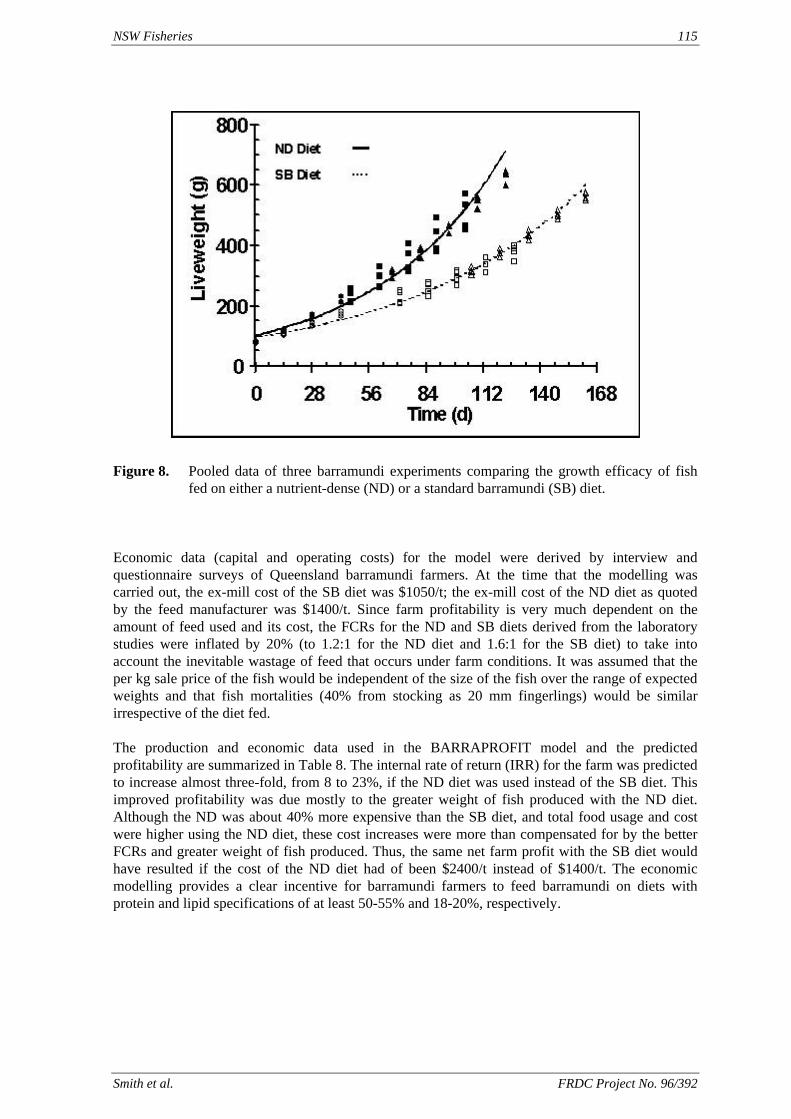
NSW Fisheries 115
Figure 8. Pooled data of three barramundi experiments comparing the growth efficacy of fish
fed on either a nutrient-dense (ND) or a standard barramundi (SB) diet. Economic data (capital and operating costs) for the model were derived by interview and questionnaire surveys of Queensland barramundi farmers. At the time that the modelling was carried out, the ex-mill cost of the SB diet was $1050/t; the ex-mill cost of the ND diet as quoted by the feed manufacturer was $1400/t. Since farm profitability is very much dependent on the amount of feed used and its cost, the FCRs for the ND and SB diets derived from the laboratory studies were inflated by 20% (to 1.2:1 for the ND diet and 1.6:1 for the SB diet) to take into account the inevitable wastage of feed that occurs under farm conditions. It was assumed that the per kg sale price of the fish would be independent of the size of the fish over the range of expected weights and that fish mortalities (40% from stocking as 20 mm fingerlings) would be similar irrespective of the diet fed. The production and economic data used in the BARRAPROFIT model and the predicted profitability are summarized in Table 8. The internal rate of return (IRR) for the farm was predicted to increase almost three-fold, from 8 to 23%, if the ND diet was used instead of the SB diet. This improved profitability was due mostly to the greater weight of fish produced with the ND diet. Although the ND was about 40% more expensive than the SB diet, and total food usage and cost were higher using the ND diet, these cost increases were more than compensated for by the better FCRs and greater weight of fish produced. Thus, the same net farm profit with the SB diet would have resulted if the cost of the ND diet had of been $2400/t instead of $1400/t. The economic modelling provides a clear incentive for barramundi farmers to feed barramundi on diets with protein and lipid specifications of at least 50-55% and 18-20%, respectively.
Smith et al. FRDC Project No. 96/392
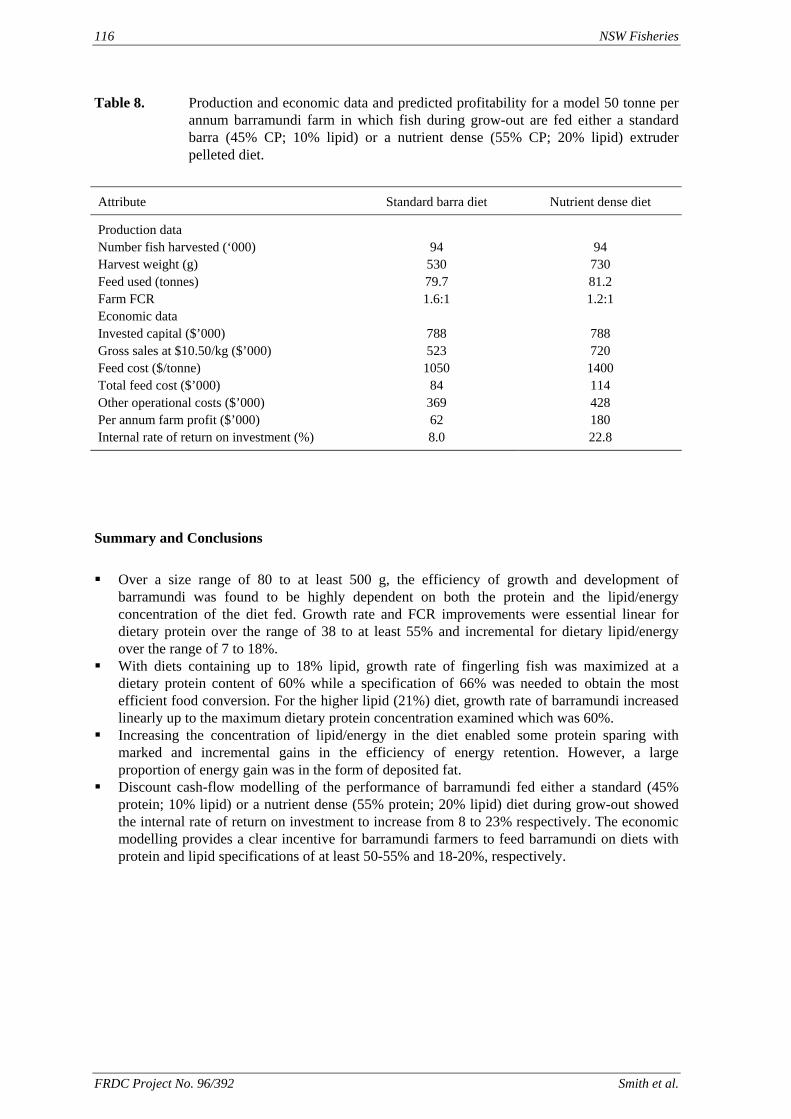
116 NSW Fisheries
Table 8. Production and economic data and predicted profitability for a model 50 tonne per annum barramundi farm in which fish during grow-out are fed either a standard barra (45% CP; 10% lipid) or a nutrient dense (55% CP; 20% lipid) extruder pelleted diet.
Attribute Standard barra diet Nutrient dense diet
Production data Number fish harvested (‘000) 94 94 Harvest weight (g) 530
62
730 Feed used (tonnes) 79.7 81.2 Farm FCR 1.6:1 1.2:1 Economic data Invested capital ($’000) 788 788 Gross sales at $10.50/kg ($’000) 523 720 Feed cost ($/tonne) 1050 1400 Total feed cost ($’000) 84 114 Other operational costs ($’000) 369 428 Per annum farm profit ($’000) 180 Internal rate of return on investment (%) 8.0 22.8
Summary and Conclusions
Over a size range of 80 to at least 500 g, the efficiency of growth and development of barramundi was found to be highly dependent on both the protein and the lipid/energy concentration of the diet fed. Growth rate and FCR improvements were essential linear for dietary protein over the range of 38 to at least 55% and incremental for dietary lipid/energy over the range of 7 to 18%.
With diets containing up to 18% lipid, growth rate of fingerling fish was maximized at a dietary protein content of 60% while a specification of 66% was needed to obtain the most efficient food conversion. For the higher lipid (21%) diet, growth rate of barramundi increased linearly up to the maximum dietary protein concentration examined which was 60%.
Increasing the concentration of lipid/energy in the diet enabled some protein sparing with marked and incremental gains in the efficiency of energy retention. However, a large proportion of energy gain was in the form of deposited fat.
Discount cash-flow modelling of the performance of barramundi fed either a standard (45% protein; 10% lipid) or a nutrient dense (55% protein; 20% lipid) diet during grow-out showed the internal rate of return on investment to increase from 8 to 23% respectively. The economic modelling provides a clear incentive for barramundi farmers to feed barramundi on diets with protein and lipid specifications of at least 50-55% and 18-20%, respectively.
FRDC Project No. 96/392 Smith et al.
NSW Fisheries 117
References
Allred M.C. & MacDonald J.L. (1988) Vitamins and other nutrients – Determination of sulphur amino acids and tryptophan in foods and food and feed ingredients: Collaborative study. J. Assoc. Off. Anal. Chem., 71: 603-606.
AOAC (1990) In: Official Methods of Analysis, 15th edition. Association of Official Analytical Chemists, Washington, DC, USA.1094 pp.
Arzel J., Metailler R., Kerleguer C., Le Delliou H. & Guillaume J. (1995) The protein requirement of brown trout (Salmo trutta) fry. Aquaculture 130:67-78.
Bligh E.G., & Dyer W.J. (1959) A rapid method of total lipid extraction and purification. Can. J. Biochem. Physiol., 37: 911-917.
Catacutan M.R. & Coloso R.M. (1995) Effect of dietary protein to energy ratios on growth, survival, and body composition of juvenile Asian seabass, Lates calcarifer. Aquaculture, 131: 125-133.
Christie W.W. (1982) In: Lipid Analysis, 2nd edition. Pergamon Books, Oxford, UK. pp. 22. Johnston W. (1998) The “Barraprofit” economic model. Use and application. In: Proceedings of the
Australian Barramundi Farming Workshop 1998 (M.J. Wingfield Editor), pp. 33-35. Queensland Department of Primary Industries, Walkamin, Australia.
Rasmussen R.S., Ostenfeld T.H., Ronsholdt B. & McLean E. (2000) Manipulation of end-product quality of rainbow trout with finishing diets. Aquacult. Nutr., 6: 17-23.
Siegel J. (1992) In: Statistix, Ver 4.0. Analytical Software, St. Paul, MN, USA. 320 pp. Snedecor G.W. & Cochran W.G. (1967) In: Statistical Methods, 6th edition. Iowa State University
Press, Iowa, USA. Williams K.C., Barlow C.G., Brock I. & Rodgers L.J. (1995) Use of autoclaving in the preparation
of homogenates for determining the proximate chemical and fatty acid composition of fish. J. Sci. Food Agric., 69: 451-456.
Smith et al. FRDC Project No. 96/392
118 NSW Fisheries
5. BENEFITS
Feed manufacturers and the prawn, silver perch and barramundi farming industries in Australia will be the direct beneficiaries of this research. The prawn farming industry will benefit from the potential to reduced feed costs. These could be brought about by the reduction or exclusion of supplementary cholesterol from Peneaus monodon feeds. This could lead to a reduction of 10% in the ingredient cost of a diet containing 0.2% inclusion of purified cholesterol. The research has demonstrated that attractant compounds or ingredients are not cost-effective when added to feeds that contain adequate inclusions of ingredients of marine origin such as fish meal, squid meal and/or shrimp meal. The research has also demonstrated that a large proportion of crystalline amino acids used to supplement feeds is lost to the environment before the prawns consume the feed. This result suggest that there is little benefit to be gained from supplementing feeds with these compounds. The two major aquaculture feed manufacturers have responded to the results of the research into nutrient dense diets for barramundi. They are manufacturing nutrient dense diets for barramundi that are currently being used widely for on-growing juvenile fish. As a consequence, the barramundi farming industry is a beneficiary in that they have access to feeds that are more cost-effective that those used previously.
FRDC Project No. 96/392 Smith et al.
NSW Fisheries 119
6. FURTHER DEVELOPMENT
The research to optimise the protein and energy content of black tiger prawn (Penaeus monodon) diets has not progressed as far as was anticipated when the proposal for this research was written. Prawns tend to use protein as an energy source and grow rapidly on high protein diets, which provide well in excess of their synthetic requirements for essential amino acids. There is a need to understand the requirement for essential amino acids, particularly lysine or methionine that would appear to be limiting when alternative protein sources are used in the diets. However, possibly the greatest challenge remaining in defining prawn nutrition requirements is to understand the relative contribution to the cost of production of the protein, lipid and carbohydrate content of the diet. Changes to the content of these nutrients in the diet will affect the cost of the diet, the growth rate of the prawns, the efficiency of utilization of the diet and the amount of nitrogenous waste produced by the prawns. There is a need to develop a model that can an be used to predict growth rate, feed conversion rate and nitrogenous waste production using the digestible protein and digestible energy, and carbohydrate and lipid content of the diet, and temperature as input parameters. This model could be used as a tool to adjust diet specifications to optimise the cost of production of farmed prawns. The research with silver perch has demonstrated that the growth of the fish is limited if the essential fatty acids in the diet are limited to poly unsaturated fatty acids (PUFA) available in vegetable oil sources, predominantly linoleic acid and linolenic acid. The performance of the fish is significantly enhanced with the addition of highly unsaturated fatty acids (HUFAs) found in marine oils. The research carried out so far has addressed the requirement for linoleic acid and linolenic acid with 18 carbon chain, rather than the requirement for the HUFAs such as eicosapentaenoic acid (EPA), docosahexaenoic acid (DHA) and arachidonic acid (AA). Due to the high cost of marine oils and the positive response of silver perch to the inclusion of these HUFAs in their diet, further research into the requirements for them is clearly warranted. The nutritional research carried out in this project with barramundi has clearly demonstrated the productivity and economic benefits of using nutrient dense diets (viz. diets containing 50% or more high quality protein and 20 to 22% lipid) to grow fish up to a harvest size of around 500 g. Attendant with the feeding of these nutrient dense diets has been the finding that much of the dietary lipid is being stored as body fat rather than being used as a primary source of energy for growth. Thus, much of the higher rate of growth seen when high-energy diets are fed to barramundi has been due to fat deposition rather than to an increased rate of somatic tissue growth. The additional fattiness of the fish is unlikely to be a problem for fish of a size of up to 500 g. However, using high-energy diets to grow fish to harvest weights of 3 kg or more - an increasing trend in the barramundi industry - may result in excessive body fat deposition, which could have very adverse marketing consequences. Additionally, excess body fat is likely to lead to reduced food intake and an overall lowering of the efficiency with which dietary energy is utilized by the fish. Further research on the feeding of high-energy diets to large barramundi (> 500 g) is clearly warranted. If feeding high-energy diets to large barramundi is found to be not compatible because of excessive fat deposition, ways of ameliorating fat deposition without sacrificing growth rate (e.g. varying protein to lipid ratio, varying the type of lipid in the diet etc) could be investigated. Another aspect of barramundi nutrition that has not been addressed in the present project or in previous barramundi nutrition projects (FRDC 93/120-04; FRDC 92/63) is how the discharge of nutrients from barramundi farms - particularly phosphorus and nitrogen - might be reduced through appropriate manipulation of the diet. Such research is a priority for multiple-use water catchments (e.g. Lake Argyle in Western Australia) where aquaculture production will be determined according to the amount of nutrient discharge emanating from the production system.
Smith et al. FRDC Project No. 96/392
120 NSW Fisheries
7. CONCLUSION
In this project set out to determine the requirement silver perch, barramundi and black tiger prawns for key nutrients that would have a significant effect on the cost effectiveness and nutritional efficiency of the diets of the respective species. By working in a collaborative environment and sharing points of view, experience and expertise we sought to maximise the effectiveness of the research. During the project there were changes to Milestones as new information became available and difficulties with the supply of experimental animals were encountered. However, despite these difficulties and changes, the Research Outcomes envisaged in the original proposal have to a great extent been achieved. The research has demonstrated the methods of microencapsulation reported in the recent aquaculture literature and the methods developed during the course of this project have not been effective in reducing to an acceptable level, the leaching loss of crystalline amino acids that are added to balance the amino acid profile of prawn diets. The problem of balancing the essential amino acid profile of diets of slow feeding marine animals such as prawn and lobsters that contain high inclusion levels of plant protein sources will be an issue in low protein diets, but is much less of an issue in diets with a protein content of > 400 g.kg-1. The difficulty with the microencapsulation techniques used is that the particles need to be very finely ground to ensure even distribution through the feed and to not have a negative effect on pellet stability. However, by grinding to a fine size (< 300 µm), the manufactured particles are broken, exposing the encapsulated material to the environment, and, at the same time, the surface area to volume ratio is increased substantially. This is an area where future research is warranted, particularly to complement the use of plant protein sources in low protein aquaculture feeds. Studies to gain an understanding of the essential amino acid requirements of the black tiger prawn have not progressed as well as expected. The progress has been hampered by disease outbreaks in the experimental prawns and, more significantly, by the lack of an effective method of delivering to the prawn the crystalline essential amino acids added to the diet to provide the levels required for the experiment. There is a need for the development a method that allows the manipulation of the essential amino composition of prawn diets, but which results in minimal changes in the dietary amino acid composition when the diet is immersed in water. The response of the black tiger prawn, Penaeus monodon, to different levels of dietary digestible protein and energy has been studied. The protocol adopted was designed to eliminate the confounding factors seen in previous protein/energy studies with this species. The results of the study have suggested that with a low energy diet (13.5 MJ.kg-1) the optimum Protein:Energy ratio is about 22.2 mg.kJ-1 which corresponds to a dietary DCP content of 300 g .kg-1. However, with the higher energy diets (15.0 and 16.5 MJ.kg-1), energy did not appear to become limiting even with diets containing in excess of 45 g kg-1 DCP. It is possible that the use of carbohydrate to adjust dietary energy and its use as the dietary component that was replaced by protein as the protein content of the diets increased, has added an additional variable that has confounded the interpretation of the results. Because of the importance of defining the protein to energy relationship in prawns, this work should continue. An alternative approach would be to look at the protein to energy requirements based on a single essential amino acid such as lysine and to vary the energy content of the diets using a lysine deficient protein. At the start of this project, there had been a great deal of interest in the use of attractants (or feeding effectors) to increase feed intake by prawns when fed diets containing significant amounts of plant protein meals. A range of commercially available feeding effectors was tested in a screening experiment to determine their effectiveness in eliciting feed intake. From the results of the
FRDC Project No. 96/392 Smith et al.
NSW Fisheries 121
screening experiment, four of the feeding effectors at specific inclusion levels, were selected: crustacean meal, krill meal, fish hydrolysate and krill hydrolysate. These were evaluated in growth assay to assess the cost-effectiveness of including them in a basal diet. In the growth assay no significant difference (P > 0.05) was found between the intake of the basal diet and any of the diets containing the selected attractants. However, growth was greater with the diets containing crustacean meal (50 g/kg) and krill meal (50 g/kg). These results suggest that it is more cost effective to include a relatively small proportion of a high quality marine product such as crustacean meal in a P. monodon diet than it is to include specific attractants or hydrolysates. The high cost of cholesterol used in aquaculture diets for prawns makes it important to precisely define their requirement for this essential nutrient in order to avoid excess supplementation of the diet. The growth response and survival of sub-adult (about 3 g) Penaeus monodon prawns were compared following feeding for up to 8 weeks with diets in which the cholesterol content varied between 0.7 and 8.5 g kg-1. The cholesterol requirement of these prawns was found to be about 75 mg kg-1 body weight d-1. The optimum dietary cholesterol content was approximately 1.7 g kg-1 (dry matter), which is appreciably lower than the current recommendation of 2.5 to 4 g kg-1 of diet. In most practical prawn diets, the endogenous cholesterol in the ingredients provides more than 1.7 g kg-1 of cholesterol. Hence, our research suggests that it may be unnecessary to add expensive, supplementary cholesterol to commercial prawn diets. A study was carried out to determine the dietary requirements of silver perch for the essential fatty acids (EFA) linoleic (LA) and linolenic (LNA) acid, when the diets contained negligible levels of the longer chain highly unsaturated n-3 and n-6 fatty acids that are found in marine oils. A 4x4 factorial experiment was designed with diets containing incrementally increasing proportions of LA (10, 20, 30, 40% of total fatty acids (TFA)) and LNA (0, 10, 20, 30% of TFA). Two diets were designed to include the longer chain n-3 and n-6 fatty acids, a reference diet and a defatted reference diet with its lipid composition reconstituted to mimic the reference diet. A defatted diet was also fed. Dietary lipid content was kept constant across all diets (8.7 ± 0.05%), except for the defatted diet (1.7 ± 0.05%). After feeding the experimental diets to silver perch fingerlings for 57 days, weight gain was highest in fish fed the reference diet (12.0 ± 1.13 g). Fingerlings fed the defatted diet had the poorest weight gain (7.0 ± 0.96 g) and also had an accumulation of eicosadienoic acid (EDA) (1.8 ± 0.05%) in the lipid. At low levels of dietary LA and LNA, weight gain was poor, while with the combination of LA at 30% of TFA and LNA at 20% of TFA weight gain was the greatest (10.7 ± 0.40 g). This suggests that silver perch have a requirement for both LA and LNA, but that weight gain may be further enhanced with the inclusion of the longer chain n-3 and n-6 fatty acids, as seen from the response to the reference diet. The results support the hypothesis that LA and LNA compete for the ∆6-desaturase enzyme system affecting the production of eicosapentaenoic acid and docosahexaenoic acid in the fish. The data also indicate that silver perch have the ability to chain elongate and desaturate LA and LNA to their respective longer chain polyunsaturated fatty acids. The higher weight gain with the additional inclusion of longer chain n-3 fatty acids in the diet (fish oil) indicated that the conversion process in silver perch is inadequate to meet their requirements. A comparative slaughter, growth assay was conducted using juvenile silver perch to evaluate different inclusion contents of peanut meal, canola meal, meat meal and dehulled field peas. Each ingredient was combined with a nutritionally balanced basal diet composed mainly of fishmeal (27%), soybean meal (21%), wheat (28%) and sorghum (11%) such that between 15 and 75% of the basal diet was wholly replaced by the test ingredient. In addition, the basal diet was replaced with 15, 30 or 45% of an inert filler (diatomaceous earth) in order to compare diets containing test ingredients and the inert filler. Weight gain of silver perch decreased steadily as the basal diet was systematically replaced with diatomaceous earth, confirming the limiting contribution to weight gain from the basal diet under a restricted feeding regime. Silver perch fed diets containing a mixture of the basal diet and either peanut meal, meat meal, canola meal or up to 60% field peas
Smith et al. FRDC Project No. 96/392
122 NSW Fisheries
gained more weight than fish fed diets containing similar contents of the inert filler, indicating silver perch were able to utilise these ingredients to support growth. Regression analysis was applied to investigate protein and energy retention. According to the fitted models, the partial efficiency of digestible protein for growth above maintenance was constant at 0.45 so long as diets did not contain more than 45% or 75% by weight of peanut meal or field peas respectively. The partial efficiency of digestible energy for growth above maintenance was constant at 0.68 so long as diets did not contain more than 75% by weight of either field peas or canola meal. Adherence of other diets containing test ingredients to the slope of each regression suggests that silver perch are capable of utilising any of the protein sources tested at all but the inclusion contents described above. Confirmation of the current approach under different feeding regimes is required. Juvenile silver perch responded to both increasing digestible protein and DE content of diets under a restricted feeding regime. Quadratic functions were fitted to each energy series to describe the relationship between digestible protein content of diets and protein retention efficiency. Using the asymptote of the quadratic function to predict maximum protein retention efficiency, the optimum digestible protein requirements for silver perch diets with low (~13MJ/kg), mid (~15MJ/kg) and high (~17MJ/kg) DE were 24.7, 26.1 and 30.1% respectively. Choosing “optimum” dietary protein contents depends on which criteria are considered most important. If weight gain is the primary consideration, farmers would be advised to feed lower protein diets to satiation (see Allan et al. 2001). If water quality is critical, diets that will deliver maximum protein retention efficiency should be used (diets with 13-15 or 17 MJ/kg DE should contain between 25-26 or 30% digestible protein respectively). However, if fish are fed restrictively, then weight gain will be improved by feeding diets with more dietary protein. If carcass composition is the primary criterion, then feeding diets with low DE and high digestible protein (i.e. with high digestible protein:DE ratio) will reduce carcass fat (this will be balanced by increased carcass moisture). The efficiency of growth and development of barramundi (80 g to > 500 g) was found to be highly dependent on both the protein and the lipid/energy concentration of the diet fed. Growth rate and FCR improvements were essentially linear for dietary protein over the range of 38 to at least 55% and incremental for dietary lipid/energy over the range of 7 to 18%. With diets containing up to 18% lipid, growth rate of fingerling fish was maximized at a dietary protein content of 60% while a specification of 66% was needed to obtain the most efficient food conversion. For the higher lipid (21%) diet, growth rate of barramundi increased linearly up to the maximum dietary protein concentration examined which was 60%. Increasing the concentration of lipid/energy in the diet enabled some protein sparing with marked and incremental gains in the efficiency of energy retention. However, a large proportion of energy gain was in the form of deposited fat. Discount cash-flow modelling of the performance of barramundi fed either a standard (45% protein; 10% lipid) or a nutrient dense (55% protein; 20% lipid) diet during grow-out showed the internal rate of return on investment to increase from 8 to 23% respectively. The economic modelling provides a clear incentive for barramundi farmers to feed barramundi on diets with protein and lipid specifications of at least 50-55% and 18-20%, respectively. However, Further research on the feeding of high-energy diets to large barramundi (> 500 g) is clearly warranted. If feeding high-energy diets to large barramundi is found to be not compatible because of excessive fat deposition, ways of ameliorating fat deposition without sacrificing growth rate could be investigated.
FRDC Project No. 96/392 Smith et al.
NSW Fisheries 123
8. STAFF
CSIRO Marine Research (Cleveland) Mr. D.M. Smith Nutrit. Physiologist BAppSci 50% to 30% Ms L.E. Whitlock Technical Officer BSc 50% to 30% Dr. K. Williams Principal Nutritionist BVSc (Hons), PhD 5% to 15% Mr S.J. Tabrett Aquaculture Technician MSc 75% Mr S.J. Irvin Aquaculture Technician Dip. Aq. Res. Mgmt 10% Ms M.C. Barclay Analytical chemist BSc (Hons) 10% QDPI (WFFAC) Mr C. Barlow Senior Biologist
50% Mr Ian Ruscoe Dip Lab Tech NSWF (PSRC)
Mr Mark Booth Scientific Officer BSc (Hons) 30% Fisheries Technician Fisheries Technician BSc (Hons) 50%
BSc (Hons), MSc 15% Ms C. Agcopra Fisheries Technician BSc
Fisheries Technician 50%
Dr. G. Allan Principal Scientist BSc (Hons) PhD 20%
Mr David Stone BSc (Hons) 15% Ms R Warner-Smith
Smith et al. FRDC Project No. 96/392
124 NSW Fisheries
9. PUBLICATIONS
These publications flow from the Aquaculture Diet Development Subprogram as well as the earlier Replacement of Fishmeal in Aquaculture Diets Subprogram and appear in all three ADD final reports. Refereed Journals
Allan G.L. (1997) Alternative feed ingredients for intensive aquaculture. Recent Advances in Animal Nutrition in Australia. University of New England, Armidale, 30 June to 1 July, 1997. pp. 98-109.
Allan G.L. & Booth M.A. (submitted) The effects of dietary digestible protein and digestible energy content on protein retention efficiency of juvenile silver perch Bidyanus bidyanus. Aquaculture Research.
Allan G.L & Smith D.M. (1998) Recent nutrition research with Australian penaeids. Reviews in Fisheries Science 6: 113-127.
Allan G.L., Johnson R.J., Booth M.A. & Stone D.A.J. (2001). Estimating digestible protein requirements of silver perch, Bidyanus bidyanus Mitchell. Aquaculture Research 32, 337-347.
Allan G.L., Parkinson S., Booth M.A., Stone D.A.J., Rowland S.J., Frances J., & Warner-Smith R. (2000) Replacement of fish meal in diets for Australian silver perch, Bidyanus bidyanus: I. Digestibility of alternative ingredients. Aquaculture 186, 293-310.
Allan G.L., Rowland S.J., Mifsud C., Glendenning D., Stone D.A.J. & Ford A. (2000) Replacement of fish meal in diets for Australian silver perch, Bidyanus bidyanus V. Least-cost formulation of practical diets. Aquaculture 186, 327-340.
Allan G.L., Rowland S.J., Parkinson S., Stone D.A.J. & Jantrarotai W. (1999). Nutrient digestibility for juvenile silver perch Bidyanus bidyanus: development of methods. Aquaculture 170, 131-145.
Barlow C. (1998). Barramundi. In: Hyde, K. (Ed.) The New Rural Industries – A Handbook for Farmers and Investors, 93-100. RIRDC, Canberra.
Barlow C., Williams K. & Rimmer M. (1996). Seabass culture in Australia. Infofish Intl. 2/96: 26-33.
Booth M.A. & Allan G.L. (submitted) Utilisation of digestible nitrogen and energy from four agricultural ingredients by juvenile silver perch Bidyanus bidyanus. Aquaculture Nutrition.
Booth M.A., Allan G.L., Evans A.J. & Gleeson V.P. (In press) Effects of steam pelleting or extrusion on digestibility and performance of silver perch Bidyanus bidyanus. Aquaculture Research.
Booth M.A., Allan G.L. & Warner-Smith R. (2000) Effects of grinding, steam conditioning and extrusion of a practical diet on digestibility and weight gain of silver perch, Bidyanus bidyanus. Aquaculture 182, 287-299.
Booth M.A., Allan G.L., Frances J. & Parkinson S. (2001) Replacement of fish meal in diets for Australian silver perch, Bidyanus bidyanus IV. Effects of dehulling and protein concentration on digestibility of grain legumes. Aquaculture 196, 67-85.
Hunter B., Allan G., & Roberts D. (2000) Meat meal replacement in diets for silver perch: effect on growth, protein, and lipid composition. Journal of Applied Aquaculture 10(3), 51-67
Smith D.M, Tabrett S.J. & Barclay M.C. (2001) Cholesterol requirement of sub-adult Black tiger prawns, Penaeus monodon (Fabricius). Aquaculture Research. 32, 399-405
Stone D.A.J., Allan G.L., Parkinson S. & Rowland S.J. (2000) Replacement of fish meal in diets for Australian silver perch, Bidyanus bidyanus III. Digestibility and growth using meat meal products. Aquaculture 186, 311-326.
Stone D.A.J., Allan G.L., Parkinson S., Frances J. (2003) Replacement of fish meal in diets for Australian silver perch, Bidyanus bidyanus (Mitchell) II: effects of cooking on
FRDC Project No. 96/392 Smith et al.
NSW Fisheries 125
digestibility of a practical diet containing different starch products. Aquaculture Research 34, 195-204.
Stone D.A.J., Allan G.L. & Anderson A.J. (2003) Carbohydrate utilisation by juvenile silver perch Bidyanus bidyanus (Mitchell): I. Uptake and clearance of monosaccharides following intra-peritoneal injection. Aquaculture Research 34, 97-107.
Stone D.A.J., Allan G.L. & Anderson A.J. (2003) Carbohydrate utilisation by juvenile silver perch Bidyanus bidyanus (Mitchell): II. Digestibility and utilisation of starch and its breakdown products. Aquaculture Research 34, 109-121.
Stone D.A.J., Allan G.L. & Anderson A.J. (2003) Carbohydrate utilisation by juvenile silver perch Bidyanus bidyanus (Mitchell): III. The protein sparing effect of wheat starch based carbohydrates. Aquaculture Research 34, 123-134.
Stone D.A.J., Allan G.L. & Anderson A.J. (2003) Carbohydrate utilisation by juvenile silver perch Bidyanus bidyanus (Mitchell): IV. Can dietary enzymes increase digestible energy from wheat starch, wheat and dehulled lupin? Aquaculture Research 34, 135-147
Williams K.C., Barlow C.G., Brock I. & Rodgers L. (1995) Use of autoclaving in the preparation of homogenates for determining the proximate chemical and fatty acid composition of fish. J. Sci. Food Agric., 69, 451-456.
Williams K., Barlow C., Rodgers L. (2000) Efficacy of crystalline and protein-bound amino acids for amino acid enrichment of diets for Asian seabass/Asian seabass (Lates calcarifer Bloch). Aquaculture Research 32, 415-429.
Williams K.C., Barlow C.G., Rodgers L., Hockings I., Agcopra C. & Ruscoe I. (2003) Asian seabass Lates calcarifer (Bloch) perform well when fed pelleted diets high in protein and lipid. Aquaculture (in press).
Williams K.C., Barlow C., Rodgers L.J. & Ruscoe I. (2003) Potential of meat meal to replace fishmeal in extruded dry diets for barramundi Lates calcarifer (Bloch): 1 – effect on growth performance. Aquaculture Research 34, 23-32.
Williams K.C., Barlow C., Rodgers L.J. & Ruscoe I. (in press) Potential of meat meal to replace fishmeal in extruded dry diets for barramundi Lates calcarifer (Bloch): 2 – effect on organoleptic characteristics of flesh. Aquaculture Research (submitted).
Williams K.C., Barlow C.G. & Ford A. (2003) Potential of meatmeal to replace fishmeal in extruded dry diets for barramundi Lates calcarifer (Bloch). II Organoleptic characteristics and fatty acid composition. Aquaculture Research 34, 33-42.
Refereed Conference Proceedings
Allan G.L. (1995) Development of artificial diets for silver perch. In: S.J. Rowland, C. Bryant (Eds.), Silver Perch Culture, Proc. of Silver Perch Aquaculture Workshops, Grafton and Narrandera, April 1994. Austasia Aquaculture for NSW Fisheries, Sydney, pp. 77-87.
Allan G.L. (1996) Potential for replacement of marine ingredients in Asian aquafeeds. In: Feed production on the threshold of the next age. Proc. Victam-Asia Conference. Bangkok, Thailand, 14-15 November. pp. 125-152.
Allan G.L. (1997) Diet development; past successes and future challenges. In: Proc. International Tasmanian Aquaculture Exchange, Hobart, 25-28 July, 1997.
Allan G.L. (1998) Aquaculture development - a state perspective from New South Wales. Outlook ‘98 Conference, Canberra, 3-5 February, 1998. ABARE. pp. 284-292.
Allan G.L. (2000) Potential for Pulses in Aquaculture Systems. In: Linking Research and Marketing Opportunities for Pulses in the 21st Century: Proceedings of the Third International Food Legumes Research Conference (edited by R. Knight). Kluwer Academic Publishers, pp. 507-516.
Allan G.L. & Rowland S.J. (1994) The use of Australian oilseeds and grain legumes in aquaculture diets. In: L.M. Chou et al (Eds.), Proc. Third Asian Fisheries Forum, October 26-30, 1992, Singapore. Asian Fisheries Society, Manila, Philippines, pp. 667-669.
Allan G.L., Williams K.C., Smith D.M. & Barlow C.G. (2000) Recent developments in the use of rendered products in aquafeeds. In: Fifth International Symposium: World Rendering
Smith et al. FRDC Project No. 96/392
126 NSW Fisheries
Beyond 2000: Tools, techniques and the environment. 21-23 July 1999, Surfers Paradise. Australian Renderers’ Association, Sydney, Australia. pp. 67-74.
Barlow C., Williams K.C., Rodgers L., Agcopra C. & Hockings I. (1993) Effects of water temperature and feeding frequency on food intake and growth of juvenile barramundi, Lates calcarifer. In: Proceedings of the 6th International Symposium on Fish Nutrition and Feeding, 4-7 October 1993, Hobart.
Molvig L., Tabe L.M., Hamblin J., Ravindran V., Bryden W.L., Smith D.M., Kissel G. & Higgins T.J.V. (1999) Increased nutritional quality of seeds of transgenic lupins (Lupinus angustifolius) expressing a sunflower seed albumin gene. Proceedings of 6th meeting of the International Association of Plant Tissue Culture and Biotechnology, Sydney, July 1999.
Williams K.C., Allan G.L., Smith D.M. & Barlow C.G. (1998) Fishmeal replacement in aquaculture diets using rendered protein meals. In: Proc. Fourth International Symposium on Animal Nutrition, Protein, Fats and the Environment, Melbourne, 24-26 September, 1997, Australian Renderers’ Association, Sydney, Australia, pp 13-26.
Williams K., Barlow C. & D’Souza F. (1998) Larval penaeid and grow-out finfish nutritional research in Australia. In: M.A. Rimmer, K.C. Williams and M.J. Phillips (Editors), Proceedings Grouper Aquaculture Research, pp. 26-35. Australian Centre for International Agricultural Research & Network Aquaculture Centres of Asia-Pacific, Craftsman Press, Bangkok, Thailand.
Williams K.C., Barlow C., Brock I. & Rodgers L. (in press) Comparison of autoclaving and conventional processing for determining the proximate and fatty acid composition of barramundi, Lates calcarifer. In: Proceedings of the 6th International Symposium on Fish Nutrition and Feeding, 4-7 October 1993, Hobart.
Williams K.C., Smith D.M. & Burford M. (2000) Recent innovations in feeds development for Asian seabass (Lates calcarifer) and giant tiger shrimp (Penaeus monodon) in Australia. In B. Hunter (Editor), The 6th Roche Aquaculture Conference Asia Pacific, pp.7-25. Roche and Rovithai, Bangkok, Thailand.
Book Chapters & Theses
Allan G.L. & Rowland S.J. (2002) Silver perch Bidyanus bidyanus. In: C.D. Webster, C. Lim (Eds.), Nutrient Requirements and Feeding of Finfish for Aquaculture. CABI Publishing, Oxford, U.K., pp. 358-373.
Boonyaratpalin M. & Williams K.C. (2001) Asian seabass. In: C.D. Webster and C. Lim, (Editors), Nutrient Requirements and Feeding of Aquaculture Fish. CABI International Publishers, Wallingford, UK, 40-50.
Hunter B.J. (2000) Dietary influences on the lipid composition of silver perch. Thesis accepted for the degree of Doctor of Philosophy, University of Newcastle, NSW, Australia, March 2000.
Smith D.M, Allan G.L, Williams K.C. & Barlow CG (2001) Fishmeal replacement research for shrimp feed in Australia. In: C. Browdy and D. Jory (Eds), The New Wave, World Aquaculture Society, Baton Rouge, Louisiana, USA. pp. 97-103.
Stone D.A.J. (2002) Dietary carbohydrate utilisation by juvenile silver perch Bidyanus bidyanus (Mitchell 1838). Thesis submitted in fulfilment of the degree of Doctor of Philosophy, Queensland University of Technology, Qld, Australia.
Williams K.C. & Barlow C. (1999) Nutritional research in Australia to improve pelleted diets for grow-out barramundi Lates calcarifer (Bloch). In: Cabanban, A.S. & Phillips, M. (Eds.) Aquaculture of Coral Reef Fishes, 163-172. Institute for Development Studies (Sabah), Kota Kinabulu, Malaysia.
Williams K.C., Barlow C.G., Rodgers L., McMeniman N. & Johnston W. (2000) High performance grow-out pelleted diets for cage culture of barramundi (Asian seabass) Lates calcarifer. In: I. Chiu Liao and C. Kwei Lin (Editors), Cage Aquaculture in Asia, 175-191. Asian Fisheries Society, Manila and World Aquaculture Society, Bangkok.
FRDC Project No. 96/392 Smith et al.
NSW Fisheries 127
Unrefereed Conference Proceedings
Allan G.L. & Rowland S.J. (1991) Growth of silver perch Bidyanus bidyanus on diets with different levels and sources of protein. Proc. Nutri. Soc. Aust. 16, 211.
Allan G.L., Rowland S.J. & Parkinson S.A. (1994) Replacement of fishmeal with soybean, peanut meal, canola meal or lupins in diets for silver perch Bidyanus bidyanus (Mitchell). In: R. Wilson (Ed.), Proc. Sixth Intl. Symp. Fish Nutrition and Feeding, 4-7 October 1993. (Abstract).
Allan G.L., Warner-Smith R. & Frances J. (1994) The effects of varying protein and energy concentrations on the growth, protein efficiency ratio and food conversion ratio for silver perch, Bidyanus bidyanus (Mitchell). Proc. Nutr. Soc. Aust. 18, 53.
Allan G.L., Williams K.C., Smith D.M. & Barlow C.G. (2000) Recent developments in the use of rendered products in aquafeeds. In: G. Banks (Ed.), Fifth International Symposium: World Rendering Beyond 2000: Tools, techniques and the environment, 21-23 July, 1999, Surfers Paradise. Australian Renderers' Association, Sydney, NSW, Australia, pp. 67-74.
Barlow C. (1996) The Australian barramundi farming industry. In: Proceedings of the Snapper Farming Workshop, Cronulla, September 1995, 109-118. NSW Fisheries.
Barlow C., Williams K.C. Rodgers L., Hockings I. & Agcopra C. (1993) Effects of water temperature and feeding frequency on food intake and growth of juvenile barramundi. In: Proceedings Australian Barramundi Farming Workshop 23-24 September 1992, Walkamin.
Barlow C.G., Williams J., Rodgers L., Agcopra C. & Hockings I. (1996) Effect of water temperature and dietary w-3 to w-6 fatty acid ratio on growth of juvenile Asian sea bass Lates calcarifer (Bloch). In: Proceedings of World Aquaculture 96, Bangkok, 29-30.
Hunter B.J., Roberts D.C.K. & Allan G.L. (1994) The effects of varying dietary protein/energy ratios in the fat content and fatty acid composition of silver perch (Bidyanus bidyanus), Proc. Nutr. Soc. Aust. 18, 54.
Smith D.M. (2001) Meat meal in aquaculture diets. In: G. Banks (Ed.), Sixth International Symposium of the Australian Renderers Association, 25-27 July, 2001, Surfers Paradise. Australian Renderers' Association, Sydney, NSW, Australia, pp. 73-78.
Williams K.C. (1994) Preparation and storage of samples. In: Allan, G.L. & Francis, J. (Eds.). Analytical Techniques Workshop, pp 8-13. NSW Fisheries.
Williams K.C., Barlow C. & Rodgers L. (1996) Improved grow-out diets for farmed barramundi Lates calcarifer (Bloch). In: 2nd World Fisheries Congress.
Williams K.C., Barlow C., Rodgers L., Hockings I. & Agcopra C. (1993) Effect of dietary restriction and water temperature on the growth and body composition of grow-out barramundi. In: Australian Barramundi Farming Workshop 1993, 23-24 September 1993, QDPI, Walkamin.
Williams K.C., Barlow C., Rodgers L., Hockings I. & Agcopra C. (1994) Barramundi nutrition research. In: Australian Barramundi Farming Workshop 17-18 August 1994, pp. 13-15. QDPI, Walkamin.
Williams K.C., Barlow C., Rodgers L., Hockings I. & Agcopra C. (1995) Barramundi nutrition research. In: Australian Barramundi Farming Workshop 1995, 12-13 June 1995. QDPI, Walkamin.
Williams K.C., Barlow C., Rose J. & Kelly B. (1996) Effect of faecal collection method on the apparent digestibility of diets for Asian sea bass Lates calcarifer (Bloch). In: Proceedings of World Aquaculture 96, Bangkok, 438-439.
Williams K.C., Barlow C., Brock I. & Rodgers L. (1993) The proximate and fatty acid composition of barramundi (Lates calcarifer) following autoclaving or conventional processing. In: Wilson, R. (Ed.) Proceedings of 6th Int. Symp. Fish Nutrition & Feeding. IUNS.
Williams K.C., Smith D.M. & Burford M. (2000) Recent innovations in feeds development for Asian seabass (Lates calcarifer) and giant tiger shrimp (Penaeus monodon) in Australia. In: Hunter, B. (Ed.) The 6th Roche Aquaculture Conference Asia Pacific, 7-25. Roche & Rovithai, Bangkok, Thailand.
Smith et al. FRDC Project No. 96/392
128 NSW Fisheries
Other Unrefereed Publications
Allan G.L. (1998) Potential for pulses. International Aqua Feed 2, 17-20. Allan G.L. (2000) No fishmeal needed for new high performance silver perch diets. Fisheries NSW
Magazine Summer 2000, pp. 44-45. Allan G.L. & Frances J. (Eds.) (1994) Proceedings of the Analytical Techniques Workshop
Brisbane 13 April, 1994. NSW Fisheries, Sydney, NSW, Australia. 102 pp. Allan G.L. & Rowland S.J. (1992) The development of an experimental silver perch (Bidyanus
bidyanus) diet. Austasia Aquaculture 6(3), 39-40. Allan G.L., Williams K., Smith D., Barlow C. & Rowland S.J. (1999) Fishmeal replacement
research for shrimp and fish feeds in Australia. International Aqua Feed 4, 10-16. Allan G., Booth M., Stone D., Williams K. & Smith D. (2000) Alternative protein sources to
fishmeal in aquafeeds: plant proteins. International Aqua Feed. Directory and Buyers’ Guide 2000, pp. 12-18.
Allan G., Williams K., Smith D., Barlow C. & Rowland S. (1999) Fishmeal Replacement Research for Shrimp and Fish Feeds in Australia. International Aqua Feed. 4: 10-16.
Barlow C., Williams K. & Rimmer M. (1996) Asian sea bass culture in Australia. Infofish International 2/96, 26-33.
Williams K.C. & Barlow C. (1996) Nutritional research in Australia to improve pelleted diets for grow-out barramundi Lates calcarifer (Bloch). In: Kongkeo, H. & Cabanban, A.S. (Eds.) Workshop on Aquaculture of Coral Fishes and Sustainable Reef Fisheries, Ruaran, Sabah, Malaysia, December 1996.
Williams K., Barlow C. & D’Souza F. (1999) Larval penaeid and grow-out finfish nutritional research in Australia. Aquaculture Asia IV(1), 40-44.
Williams K.C., Barlow C.G., Rodgers L., McMeniman N. & Johnston W. (in press) High performance grow-out pelleted diets for cage culture of barramundi (Asian seabass) Lates calcarifer. Asian Fisheries Science (submitted).
Final Reports
Smith D.M. (1999) Survey of the nutrient composition of meat meals and meat co-products with respect to their use as ingredients in aquaculture feeds. Final Report of Project No. PRCOP.008 to Meat & Livestock Australia, Sydney, Australia, 20 pp.
Williams K.C. (1995) Improved feeding & feeds for barramundi (Lates calcarifer). In: Proceedings Freshwater Aquaculture Association, 1 April 1995, Brisbane. University of Queensland.
Williams K.C. & Barlow C. (1996) Potential of meat meal to replace fishmeal in commercial diets for barramundi (Lates calcarifer). Final Report to Meat Research Council, Project no. M783, 25 pp.
Williams K. & Barlow C. (1999) Dietary requirements and optimal feeding practices for barramundi (Lates calcarifer). Final Report to Fisheries Research and Development Corporation Project No. 92/63, 97 pp.
Williams K. & Barlow C. (1999) Fishmeal replacement in aquaculture feeds for barramundi: (i) Nutritive value of crystalline amino acids: (ii) Potential of meat meal to replace fishmeal. Final Report to Fisheries Research and Development Corporation Project No. 93/120, 76 pp.
Williams K.C., McMeniman N., Barlow C. & Anderson A. (1998) Fishmeal replacement in aquaculture feeds for barramundi. Final Report to Fisheries Research and Development Corporation Project No. 93/120-04. 91 pp.
FRDC Project No. 96/392 Smith et al.
NSW Fisheries 129
Abstracts
Abstracts of papers presented at Nutrition Society of Australia, 21st Annual Scientific Meeting, Brisbane, 30 November to 2 December, 1997:
Allan G.L., Johnson R.J., Frances J. & Stone, D.A.J. (1997) Estimating optimum lysine requirements of silver perch (Bidyanus bidyanus). Proc. Nutr. Soc. Aust., 21st Annual Scientific Meeting, Brisbane, Queensland, 30 November to 2 December 1997. Vol. 21:67.
Booth M. & Allan G.L. (1997) Evaluation of four grain legumes in diets for silver perch (Bidyanus bidyanus). Proc. Nutr. Soc. Aust., 21st Annual Scientific Meeting, Brisbane, Queensland, 30 November to 2 December 1997. Vol. 21:66.
Hunter B.J., Allan G.L. & Roberts D.C.K. (1997) Tissue lipid relationships in silver perch fingerlings fed different diets. Proc. Nutr. Soc. Aust., 21st Annual Scientific Meeting, Brisbane, Queensland, 30 November to 2 December 1997. Vol. 21:62.
Stone D.A.J. & Allan G.L. (1997) The effects of cooking on the digestibility of a practical diet containing starch products fed to juvenile silver perch (Bidyanus bidyanus). Proc. Nutr. Soc. Aust., 21st Annual Scientific Meeting, Brisbane, Queensland, 30 November to 2 December 1997. Vol. 21:65.
Abstracts of papers presented at World Aquaculture Society Annual Conference, Las Vegas, 15-19 February, 1998:
Allan G.L., Evans A., Gleeson V. & Stone, D.A.J. (1998) Digestibility of lupins by Australian silver perch, Bidyanus bidyanus.
Allan G.L., Rowland S.R., Mifsud C. & Stone D.A.J. (1998) Least-cost formulation and evaluation of low fishmeal diets for Australian silver perch.
Booth M.A., Allan G.L. & Stone, D.A.J. (2000) Maintenance requirements of juvenile silver perch.
Stone D.A.J., Allan G.L. & Anderson A.J. (1998) Digestibility of wheat starch for Australian silver perch, Bidyanus bidyanus.
Abstracts of papers presented at Australian Marine Sciences Association, National Conference, Adelaide, 8-11 July, 1998:
Stone D.A.J., Allan G.L. & Anderson, A.J. (1998) Digestibility and utilisation of carbohydrate by Australian silver perch, Bidyanus bidyanus.
Abstracts of papers presented at the World Aquaculture Society ‘99 Conference, 26 April to 2 May 1999, Sydney, Australia:
Allan G.L., Stone D.A.J. & Booth M.A. (1999) Alternative protein sources: plant proteins. Allan G.L., Rowland S.J., Booth M.A. & Stone D.A.J. (1999) Diet development for a new
omnivorous species. Allan G.L., Jantrarotai W. & Kostutark P. (1999) Extension of aquaculture diet development
research. Booth M.A., Allan G.L. & Stone D.A.J. (1999) Utilisation of four agricultural ingredients by silver
perch. Stone D.A.J., Tostin N., Allan G.L. & Booth M.A. (1999) Benzocaine, Aqui-S and clove oil as
anaesthetics for silver perch.
Abstracts of papers presented at the AQUA 2000 (World Aquaculture Society Conference) 2-6 May, 2000, Nice, France:
Allan G.L., Booth M.A. & Stone D.A.J. (2000) Effects of extrusion on digestibility of field peas, lupins, soybean meal and canola meal fed to silver perch.
Smith et al. FRDC Project No. 96/392
130 NSW Fisheries
10. APPENDICES
10.1. Microencapsulation of prawn feed using chitin by Roderick Bain
10.2. Maintenance requirements of juvenile silver perch (abstract only)
10.3. Asian seabass Lates calcarifer (Bloch) perform well when fed pelleted diets high in protein and lipid
FRDC Project No. 96/392 Smith et al.
Appendices
APPENDIX 10.1
MICROENCAPSULATION OF PRAWN FEED USING CHITIN
Roderick Bain
Department of Chemical Engineering, University of Queensland
E1445 Undergraduate Thesis
Smith et al. FRDC Project No. 96/392
Department of Chemical Engineering
University of Queensland
MICROENCAPSULATION OF PRAWN
FEED USING CHITIN
by
Roderick Bain
E1445 Undergraduate Thesis
Supervisor: Tony Howes
October 1998
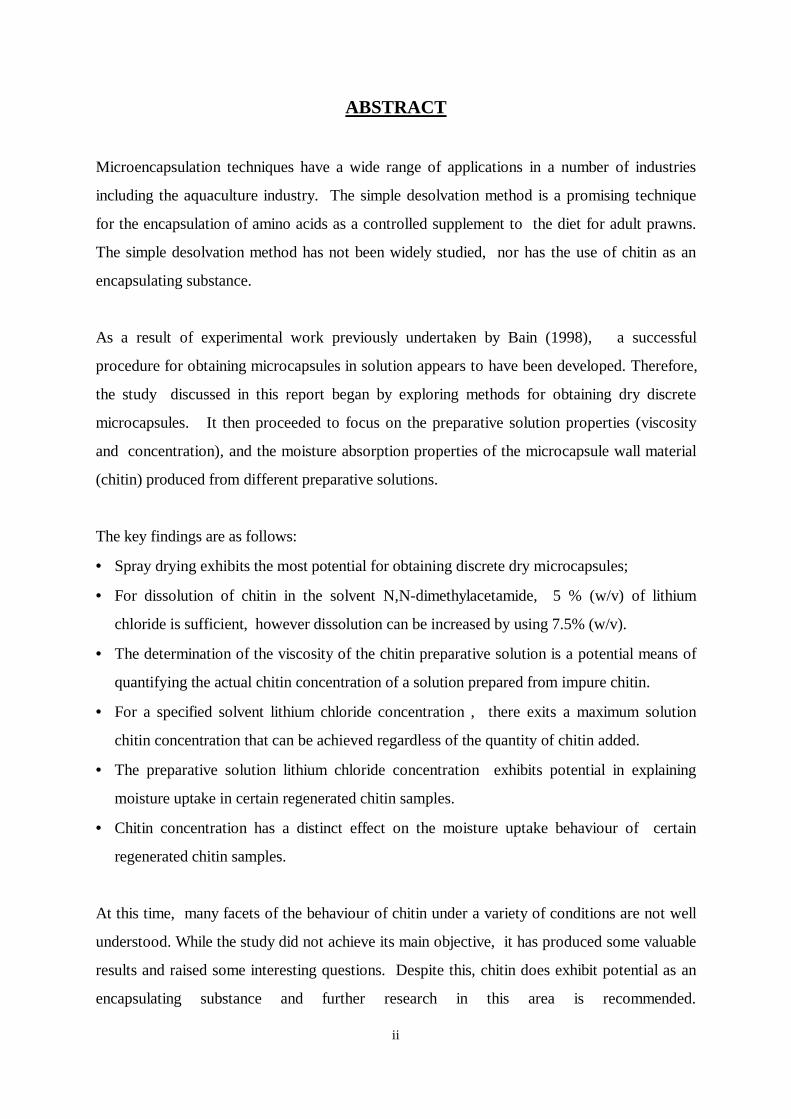
ii
ABSTRACT
Microencapsulation techniques have a wide range of applications in a number of industries
including the aquaculture industry. The simple desolvation method is a promising technique
for the encapsulation of amino acids as a controlled supplement to the diet for adult prawns.
The simple desolvation method has not been widely studied, nor has the use of chitin as an
encapsulating substance.
As a result of experimental work previously undertaken by Bain (1998), a successful
procedure for obtaining microcapsules in solution appears to have been developed. Therefore,
the study discussed in this report began by exploring methods for obtaining dry discrete
microcapsules. It then proceeded to focus on the preparative solution properties (viscosity
and concentration), and the moisture absorption properties of the microcapsule wall material
(chitin) produced from different preparative solutions.
The key findings are as follows:
• Spray drying exhibits the most potential for obtaining discrete dry microcapsules;
• For dissolution of chitin in the solvent N,N-dimethylacetamide, 5 % (w/v) of lithium
chloride is sufficient, however dissolution can be increased by using 7.5% (w/v).
• The determination of the viscosity of the chitin preparative solution is a potential means of
quantifying the actual chitin concentration of a solution prepared from impure chitin.
• For a specified solvent lithium chloride concentration , there exits a maximum solution
chitin concentration that can be achieved regardless of the quantity of chitin added.
• The preparative solution lithium chloride concentration exhibits potential in explaining
moisture uptake in certain regenerated chitin samples.
• Chitin concentration has a distinct effect on the moisture uptake behaviour of certain
regenerated chitin samples.
At this time, many facets of the behaviour of chitin under a variety of conditions are not well
understood. While the study did not achieve its main objective, it has produced some valuable
results and raised some interesting questions. Despite this, chitin does exhibit potential as an
encapsulating substance and further research in this area is recommended.

iii
ACKNOWLEDGMENTS
Firstly I would like to thank my family and friends for their understanding and support during
my period at university. I would also like to thank Tony Howes for his advice and support
over the year. In addition I must thank David Smith of CSIRO for his assistance and the
opportunity to research such an exciting topic. Finally a special thanks goes to all of my fellow
students, as without each other the majority of the year would not have been possible.
iv
TABLE OF CONTENTS
Abstract
Acknowledgments
List of Figures
List of Tables
1.0 Introduction 1
2.0 Review of Literature 3
2.1 General Overview of Microencapsulation 3
2.2 Microencapsulation Techniques 5
2.3 Simple Desolvation Phase Separation Method 5
2.4 Chitin Membranes and Chitosan Studies 8
2.5 Conclusions 11
3.0 Overview of Project 12
4.0 Experimental 13
4.1 Materials 13
4.2 Apparatus 13
4.3 Experimental Procedures 16
4.3.1 Preparation of Chitin Solution, Microencapsulation of Lysine
and Preparation of Regenerated Chitin 16
4.3.2 Freeze Drying/Drying Under Nitrogen Gas 17
4.3.3 Spray Drying 17
4.4 Measurements and Accuracy of Measurements 18
4.4.1 Viscosity of Chitin Solution 18
4.4.2 Errors in Viscosity 19
4.4.3 Water Absorption of Chitin and Lithium Chloride 20
4.4.4 Errors in Water Absorption 20
4.4.5 Density of Chitin Solutions 21
4.4.6 Errors in Density 21
4.4.7 Actual Concentration of Chitin Solutions 21
4.4.8 Errors in Actual Concentration of Chitin Solutions 22
v
5.0 Results and Discussion 23
5.1 Freeze Drying/Drying Under Nitrogen Gas 23
5.2 Spray Drying 24
5.3 Concentration and Viscosity of Chitin Solutions 25
5.4 Moisture Absorption of Regenerated Chitin 28
6.0 Conclusions 33
7.0 Recommendations 34
8.0 References 35
Appendices 38
Appendix 1 - Experimental Procedures
Appendix 2 - Error Analysis
Appendix 3 - Data and Analysis
vi
LIST OF FIGURES
Figure 2-1a Single microcapsule system 3
Figure 2-1b Multiple microcapsule system 4
Figure 2-2 Scanning electron micrographs of various chitin microcapsules
prepared by the simple desolvation method 7
Figure 2-3 Release profiles of 6-MP in pH 7.2 medium from chitin microcapsules
prepared by simple desolvation method 8
Figure 4-1 Schematic diagram of chitin dissolution equipment 14
Figure 4-2 Picture of the actual chitin dissolution equipment 15
Figure 4-3 Preparative schedule for chitin microcapsules in solution 16
Figure 4-4 Schematic diagram of spray drying equipment 17
Figure 4-5 U-tube viscometer 18
Figure 4-6 Effect of concentration on the viscosity of chitin solutions dissolved
in dimethylacetamide containing 8.2 w/w % LiCl. 22
Figure 5-1 Effect of LiCl, chitin source and quantity of impure chitin added
to solution on the actual quantity of chitin in solution 26
Figure 5-2 Effect of concentration on the viscosity of chitin solutions 28
Figure 5-3 Moisture absorption of LiCl and regenerated chitin produced from
a variety of different solutions 29
Figure 5-4 Moisture absorption of regenerated chitin produced from a variety
of different solutions 30
vii
LIST OF TABLES
Table 2.1 The solubility parameter of various nonsolvents and the solubility
parameter differences between nonsolvent and DMAc 6
Table 2.2 Drug contents of various chitin microcapsules containing 6-MP
prepared by the simple desolvation method with a core to shell ratio
of 1:1 (particle size 840 ~ 1000 µm) 6
Table 2.3 Size distributions of various chitin microcapsules containing 6-MP
prepared by the simple desolvation method with a core to shell ratio
of 1:1 7
Table 2.4 Water absorption and tensile properties of annealed chitin membranes 9
Table 5.1 Symbolism and characteristics of chitin solutions prepared 23
Table 5.2 Properties of a variety of chitin solutions 25
Microencapsulation of Prawn Feed Using Chitin Introduction
Roderick Bain 1
1.0 Introduction
For further advances in the study of crustacean (prawns, crayfish, crabs) nutrition to be made,
it is necessary to have a consistent means of controlling various components in the feed. The
aim of this project was to develop such a means by using chitin1 to microencapsulate2 amino
acids to be used as feed supplements for prawns. The particular feed supplements this
research attempted to produce are required so that growth rates of prawns can be studied by
the Marine Research Division of CSIRO, located at Cleveland.
The constraints that need to be satisfied in the development of the microcapsules are a mean
capsule diameter of 50 µm (maximum 200 µm) and essentially zero leaching from the
capsules during the first 2 hours in sea water. This is necessary to allow the prawns time to
uptake the amino acids before they leach through the capsule and dissolve in the sea water.
Chitin is a potentially useful material for encapsulating feed supplements as it is present in
significant quantities in the prawns natural diet and is non toxic. Chitin films and membranes
have potentially a wide range of applications including dialysis membranes, contact lens,
wound dressing, encapsulation of mammalian cells, and a vehicle for the sustained release of
drugs. However, because of its poor solubility in water and common organic solvents, the
utilisation of chitin in microencapsulation has been limited.
The development of a successful method of controlling the combinations and quantities of
amino acids in prawn feed will enable the optimum combinations and quantities of these
substances to be established. It is envisaged that such a combination be incorporated into a
commercial feed for farmed prawns which would have significant benefits for the aquaculture
industry. Furthermore, research and development in aquaculture is of significant benefit for
the preservation of natural seafood stocks.
1 Chitin [poly-(N-acetyl-1,4-β-D-glucopyranosamine)] is the second most abundant natural polymer.2 Microencapsulation is the packaging of small droplets of liquids or particles within a thin film.
Microencapsulation of Prawn Feed Using Chitin Introduction
Roderick Bain 2
Most importantly, the benefits of the development of a successful chitin microencapsulating
technique are not restricted to the aquaculture industry. Benefits could also be realised in the
food, biomedicine, environmental, and agricultural industries and many other fields.
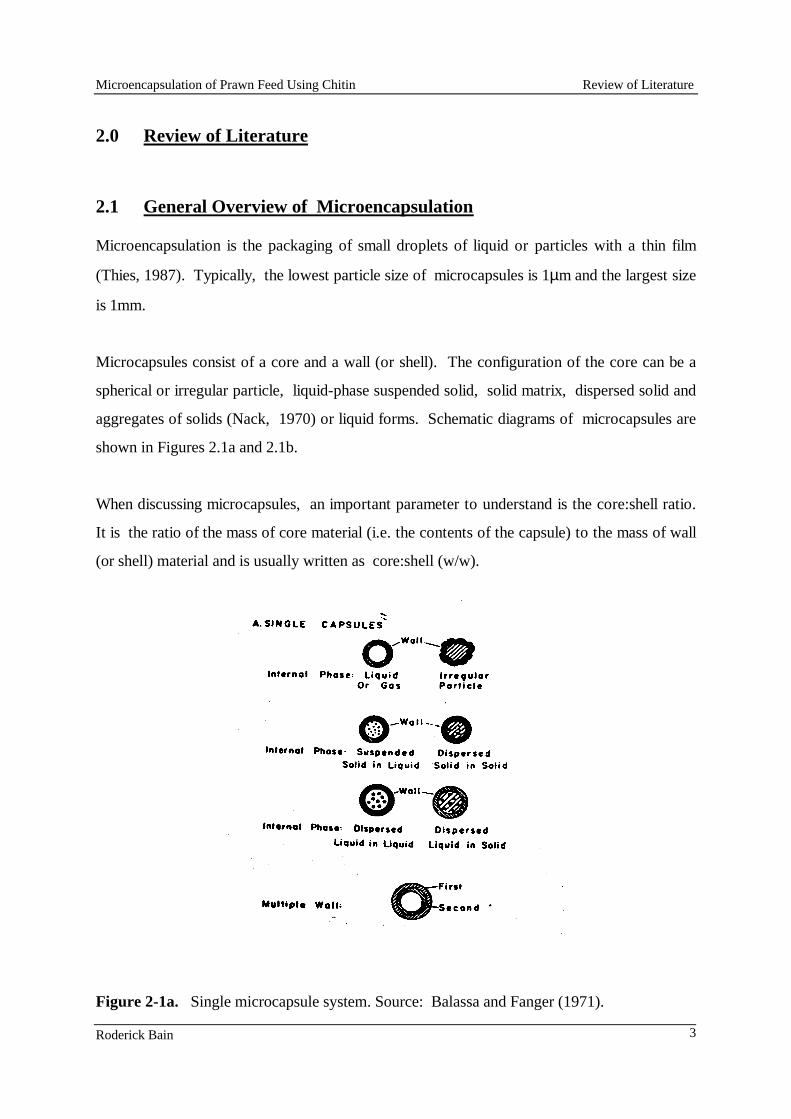
Microencapsulation of Prawn Feed Using Chitin Review of Literature
Roderick Bain 3
2.0 Review of Literature
2.1 General Overview of Microencapsulation
Microencapsulation is the packaging of small droplets of liquid or particles with a thin film
(Thies, 1987). Typically, the lowest particle size of microcapsules is 1µm and the largest size
is 1mm.
Microcapsules consist of a core and a wall (or shell). The configuration of the core can be a
spherical or irregular particle, liquid-phase suspended solid, solid matrix, dispersed solid and
aggregates of solids (Nack, 1970) or liquid forms. Schematic diagrams of microcapsules are
shown in Figures 2.1a and 2.1b.
When discussing microcapsules, an important parameter to understand is the core:shell ratio.
It is the ratio of the mass of core material (i.e. the contents of the capsule) to the mass of wall
(or shell) material and is usually written as core:shell (w/w).
Figure 2-1a. Single microcapsule system. Source: Balassa and Fanger (1971).
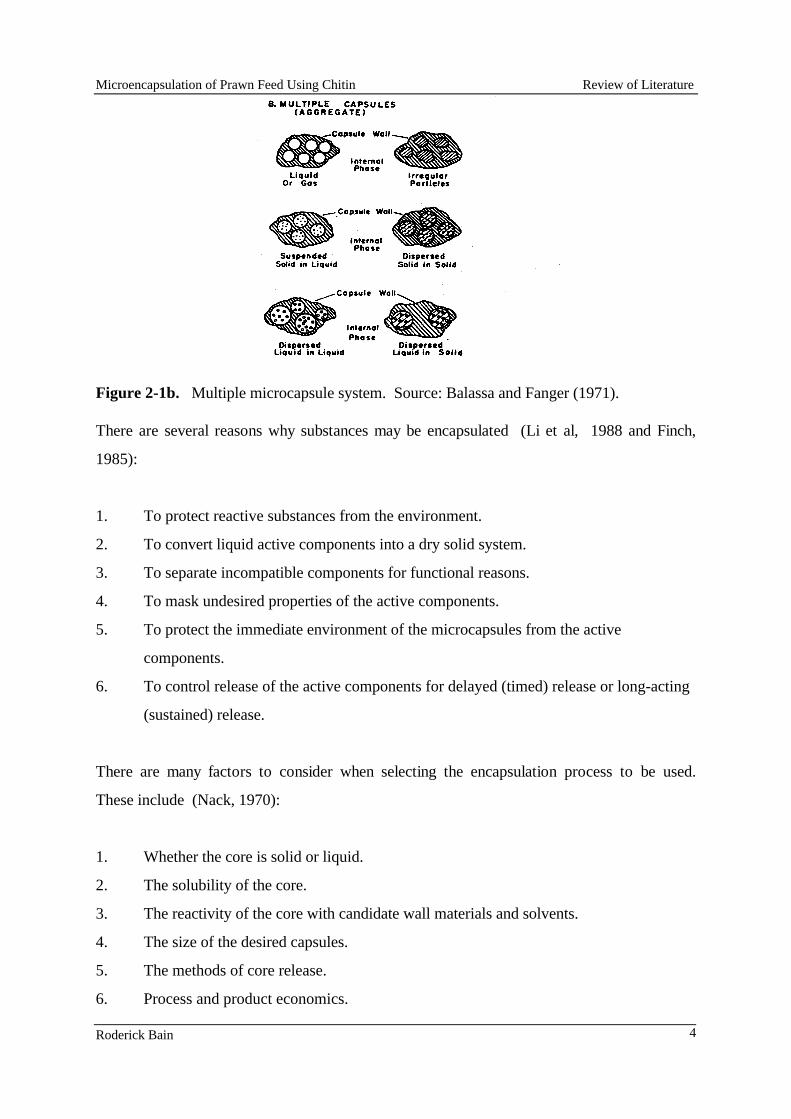
Microencapsulation of Prawn Feed Using Chitin Review of Literature
Roderick Bain 4
Figure 2-1b. Multiple microcapsule system. Source: Balassa and Fanger (1971).
There are several reasons why substances may be encapsulated (Li et al, 1988 and Finch,
1985):
1. To protect reactive substances from the environment.
2. To convert liquid active components into a dry solid system.
3. To separate incompatible components for functional reasons.
4. To mask undesired properties of the active components.
5. To protect the immediate environment of the microcapsules from the active
components.
6. To control release of the active components for delayed (timed) release or long-acting
(sustained) release.
There are many factors to consider when selecting the encapsulation process to be used.
These include (Nack, 1970):
1. Whether the core is solid or liquid.
2. The solubility of the core.
3. The reactivity of the core with candidate wall materials and solvents.
4. The size of the desired capsules.
5. The methods of core release.
6. Process and product economics.
Microencapsulation of Prawn Feed Using Chitin Review of Literature
Roderick Bain 5
Today microencapsulation has a wide range of applications in biotechnology, biomedical
engineering, food technology, agriculture, chemical engineering and feed for aquaculture.
2.2 Microencapsulation Techniques
Physical microencapsulation techniques to encapsulate soluble nutrients for inclusion in feed
pellets for adult prawns were studied by Lister et al. (1995). However, the successful
technique developed was for lipid based microcapsules which if used for the proposed study
by CSIRO would result in the co-addition of 6% hydrogenated vegetable oil to the prawns diet
which is unacceptable. Therefore it is necessary to develop a new technique. A technique
which exhibits promise is the simple desolvation phase separation method.
2.3 Simple Desolvation Phase Separation Method
The simple desolvation method is important for its easy preparation process and reduced
variable factors. A simplified explanation of the method is as follows. The capsule wall and
core materials are both placed in one solution in which the wall material is soluble and the core
material may be soluble or insoluble. This solution is then added to an excess of a liquid in
which the wall material is insoluble. Phase separation and encapsulation then occurs as a
result of the solubility difference.
To the best of my knowledge (obtained via extensive literature searching), the preparation
and release properties of chitin microcapsules prepared by this method have been described in
only two papers.
Mi et al. (1997a and 1997b) studied the preparation of microcapsules by the simple
desolvation and the non-solvent addition phase separation methods. The effects of different
solvent-nonsolvent pairs on microcapsule formation and release properties were studied. Only
acetone, ethanol and water were used as non-solvents for the simple desolvation method.
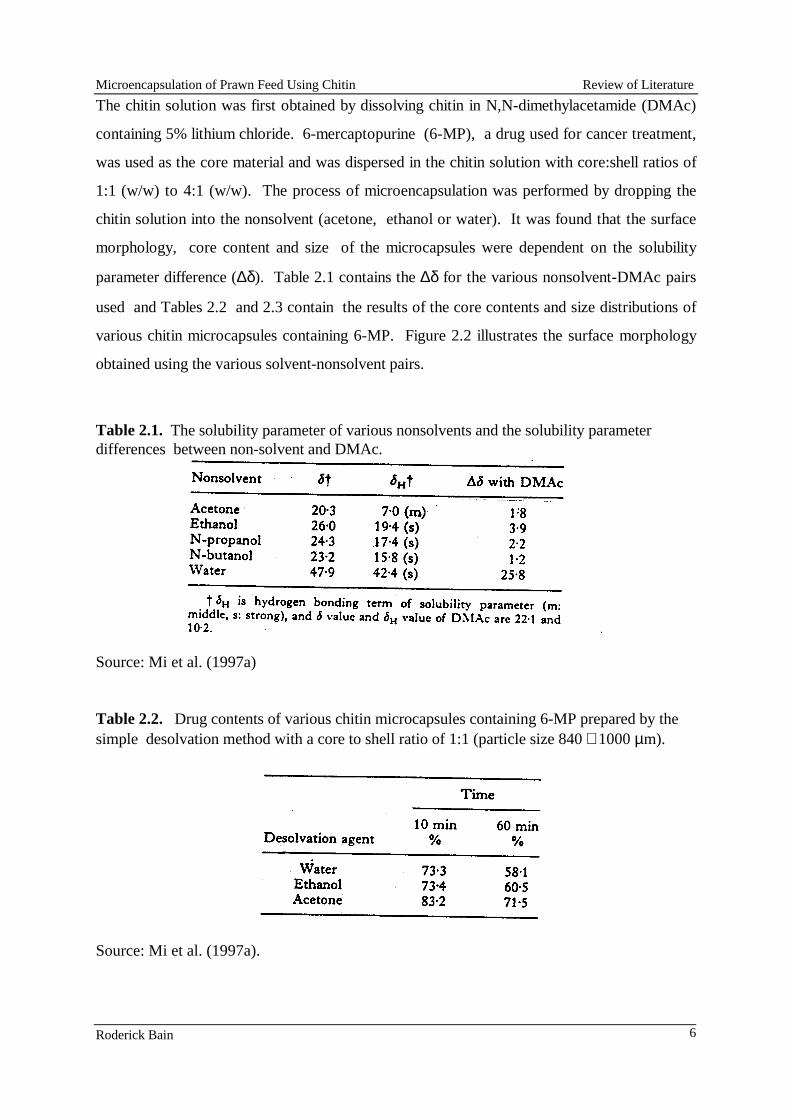
Microencapsulation of Prawn Feed Using Chitin Review of Literature
Roderick Bain 6
The chitin solution was first obtained by dissolving chitin in N,N-dimethylacetamide (DMAc)
containing 5% lithium chloride. 6-mercaptopurine (6-MP), a drug used for cancer treatment,
was used as the core material and was dispersed in the chitin solution with core:shell ratios of
1:1 (w/w) to 4:1 (w/w). The process of microencapsulation was performed by dropping the
chitin solution into the nonsolvent (acetone, ethanol or water). It was found that the surface
morphology, core content and size of the microcapsules were dependent on the solubility
parameter difference (∆δ). Table 2.1 contains the ∆δ for the various nonsolvent-DMAc pairs
used and Tables 2.2 and 2.3 contain the results of the core contents and size distributions of
various chitin microcapsules containing 6-MP. Figure 2.2 illustrates the surface morphology
obtained using the various solvent-nonsolvent pairs.
Table 2.1. The solubility parameter of various nonsolvents and the solubility parameterdifferences between non-solvent and DMAc.
Source: Mi et al. (1997a)
Table 2.2. Drug contents of various chitin microcapsules containing 6-MP prepared by thesimple desolvation method with a core to shell ratio of 1:1 (particle size 840 ∼ 1000 µm).
Source: Mi et al. (1997a).
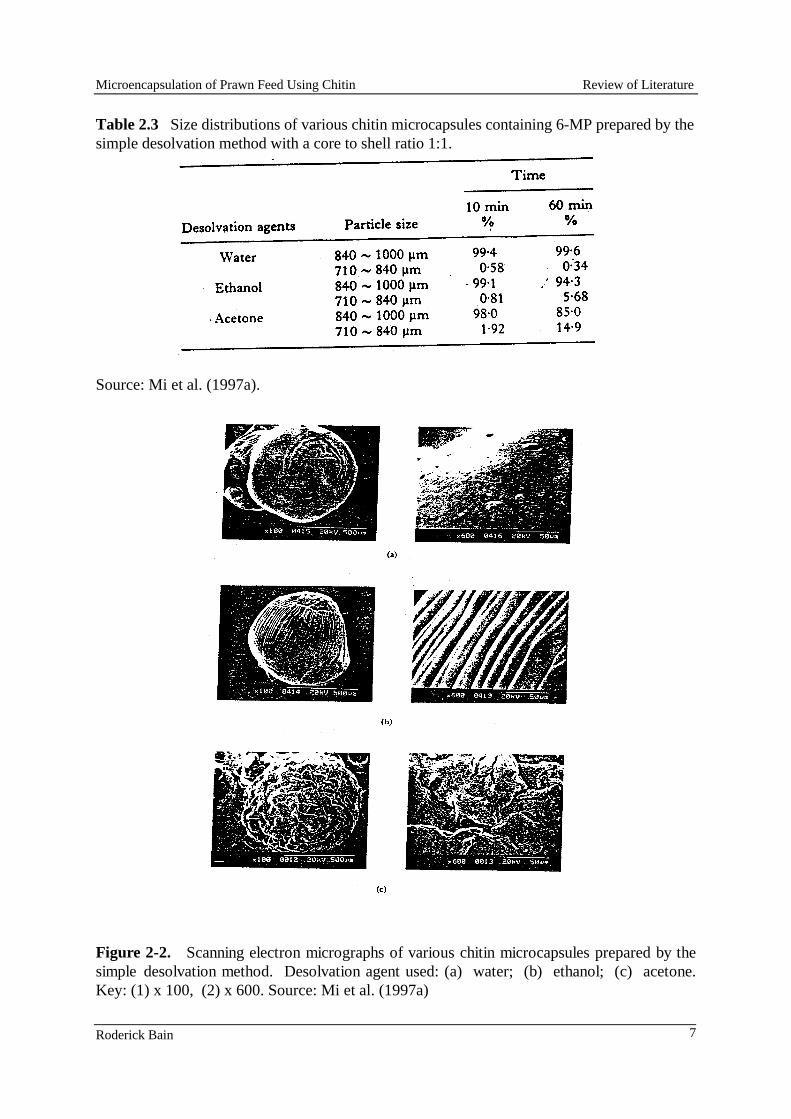
Microencapsulation of Prawn Feed Using Chitin Review of Literature
Roderick Bain 7
Table 2.3 Size distributions of various chitin microcapsules containing 6-MP prepared by thesimple desolvation method with a core to shell ratio 1:1.
Source: Mi et al. (1997a).
Figure 2-2. Scanning electron micrographs of various chitin microcapsules prepared by thesimple desolvation method. Desolvation agent used: (a) water; (b) ethanol; (c) acetone.Key: (1) x 100, (2) x 600. Source: Mi et al. (1997a)
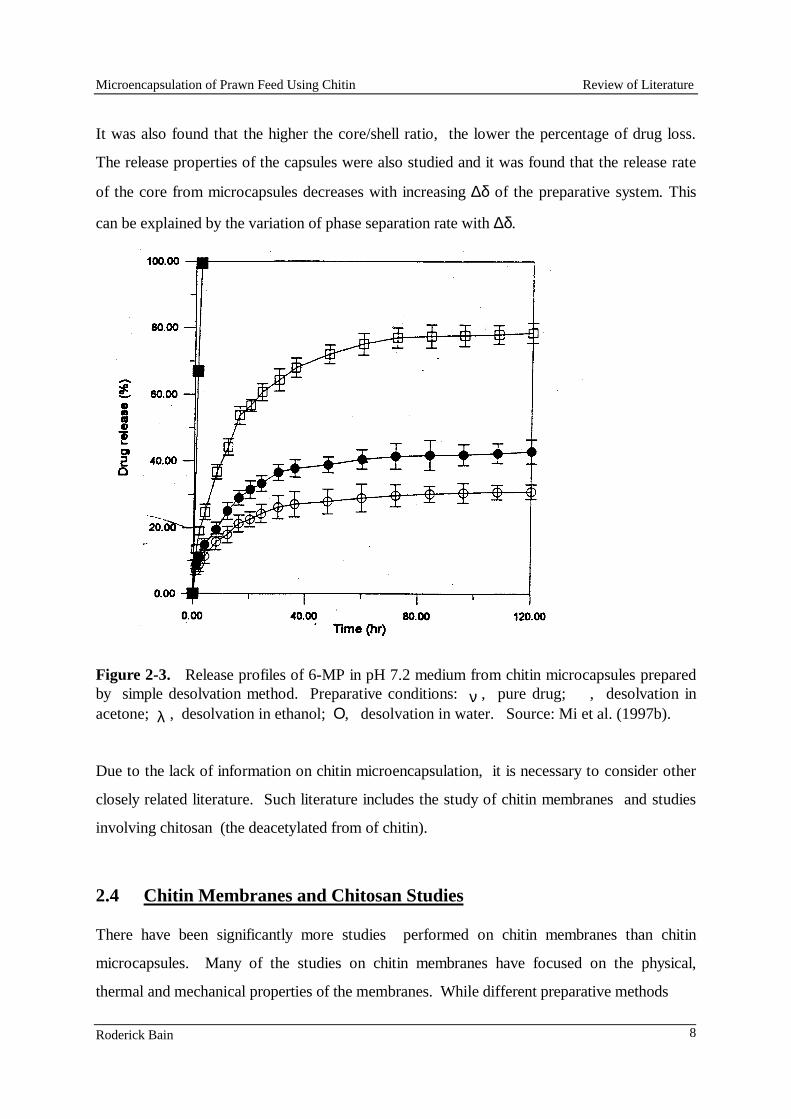
Microencapsulation of Prawn Feed Using Chitin Review of Literature
Roderick Bain 8
It was also found that the higher the core/shell ratio, the lower the percentage of drug loss.
The release properties of the capsules were also studied and it was found that the release rate
of the core from microcapsules decreases with increasing ∆δ of the preparative system. This
can be explained by the variation of phase separation rate with ∆δ.
Figure 2-3. Release profiles of 6-MP in pH 7.2 medium from chitin microcapsules preparedby simple desolvation method. Preparative conditions: ν , pure drug; , desolvation inacetone; λ , desolvation in ethanol; Ο, desolvation in water. Source: Mi et al. (1997b).
Due to the lack of information on chitin microencapsulation, it is necessary to consider other
closely related literature. Such literature includes the study of chitin membranes and studies
involving chitosan (the deacetylated from of chitin).
2.4 Chitin Membranes and Chitosan Studies
There have been significantly more studies performed on chitin membranes than chitin
microcapsules. Many of the studies on chitin membranes have focused on the physical,
thermal and mechanical properties of the membranes. While different preparative methods
Microencapsulation of Prawn Feed Using Chitin Review of Literature
Roderick Bain 9
have been used to obtain the membranes, the results obtained in all cases are consistent. One
significant result of this work is related to the water absorption properties of the membranes.
Aiba et al (1985a and 1985b) found that chitin membranes can absorb several hundred percent
water (see Table 2.4). This was put down to the membrane being highly amorphous.
Kataoka and Ando (1979) also reported that the water content of a chitin membrane was
higher than that of the original chitin powder and showed that this was due to the differences
in crystallinity.
Kataoka and Ando (1979) reported that heating a chitin membrane caused the loss of water
absorbed in the membrane, implying that the crystallinity of the chitin membrane may increase
with heating thereby increasing the strength of the membrane. The effect of annealing on the
chitin membranes was also studied by Aiba et al (1985b). It was found that annealing made
the membranes dense and strong and that the water absorption of the membranes decreased
and tensile strength increased with an increase in annealing time and temperature (Aiba et al,
1985a). It was found that the crystallinity of the membranes was increased by annealing,
while the decrease in water absorption and solute permeability seem to be due to the increase
in crystallinity of the membranes.
Table 2.4. Water absorption and tensile propertiesa of annealed chitin membranes.
Source: Aiba et al. (1985b)
Similar results to those of Aiba et al (1985a and 1985b) were reported by Blair et al (1987),
Qurashi et al (1992), and Urbanczyk and Lipp-Symonowicz (1994) who studied chitosan
membranes. As chitosan is deacetylated chitin, it is to be expected that the degree of
deacetylation would have some influence on the properties of the membranes formed. This
Microencapsulation of Prawn Feed Using Chitin Review of Literature
Roderick Bain 10
was proven to be correct by Urbanczyk and Lipp-Symonowicz (1994) who showed that the
type of crystalline structure of the chitosan membranes is determined by the degree of
deacetylation of chitin utilized on manufacturing of the membrane. In the case of lower
deacetylation (60%), the degree of crystallinity is larger than in membranes characterised by a
higher degree of deacetylation. Blair et al (1987) showed that moisture absorption decreases
with increase in deacetylation and postulated that this may be related to the relative chain-
packing properties of the acetylated and deacetylated materials.
Another significant finding of Urbanczyk and Lipp-Symonowicz (1994) was that the kind of
chitosan solvent did not influence the type of crystal structure obtained. It may be the
phrasing of the literature, however if it is not I do not believe it is reasonable to assume this
from these studies as only two solvents were used which were similar (HCOOH and
CH3COOH).
Uragami et al (1981) and Aiba et al (1985b) investigated the solubility of chitin in N,N-
dimethylacetamide, N-methyl-2-pyrrolidone (NMP) and lithium chloride. Uragami et al
(1981) found that the concentration of LiCl necessary for complete dissolution of chitin was
greater than 5%. The dissolution mechanism of chitin molecules can be found in Uragami et al
(1981). Aiba et al (1985b) used a different source of chitin and obtained almost identical
results to Uragami et al (1981). In addition Uragami et al (1981) studied the effect of the
composition of DMAc and NMP on the solubility and found that chitin would not completely
dissolve in DMAc-rich solvents. This explains the use of DMAc-NMP-LiCl by Aiba et al
(1985b).
Uragami et al (1981) reports that when chitin powder was added to mixtures of NMP, DMAc,
and LiCl, no chitin was dissolved completely. However, they reported that when the chitin
powder was dispersed in a mixed solvent of NMP and DMAc, then a desired amount of LiCl
was added, and this solution was stirred at 25oC for 24 hours, chitin was dissolved easily.
Microencapsulation of Prawn Feed Using Chitin Review of Literature
Roderick Bain 11
These results suggest that the method used by Mi et al (1997a and 1997b) would not result in
complete dissolution of chitin as LiCl was first dissolved in DMAc and then chitin added.
However , the fact that the solution was prepared by heating at 120oC may result in complete
dissolution but this has not been investigated.
2.5 Conclusions
The simple desolvation method used by Mi et al (1997a and 1997b) is the basis of this thesis.
Therefore the studies of Mi et al (1997a and 1997b) are crucial to this thesis. Their findings
have led to the selection of acetone as the nonsolvent as it results in the most crevassed
microcapsule surface which will provide the prawns digestive enzymes with the greatest
surface area for attack. It was also shown by Mi et al (1997a) that the higher the core:shell
ratio, the lower the drug loss and the higher the drug payload obtained. This provides
excellent information for this study.
Unfortunately Mi et al (1997a and 1997b) do not provide information regarding the physical,
thermal and mechanical properties of the microcapsules produced and therefore it has been
necessary to seek such information from other sources. This information has been detailed
above and while it is not for chitin microcapsules but rather membranes and chitosan
membranes and capsules, it still has significant applicability. Already it has provided an
insight into a moisture absorption problem previously encountered by Bain (1998) and also
provided an explanation as to why lithium chloride is required in the chitin dissolution process.
While the work by Mi et al (1997a and 1997b) has provided a general method, and will be
useful for comparison, the system I am using is slightly different and requires unique
consideration. The amino acids I am using are not soluble in DMAc whereas the drug used by
Mi et al (1997a and 1997b) was. Therefore it is reasonable to expect a better drug payload
and a lower drug loss than Mi et al (1997a). In addition Mi et al (1997a) were obtaining
particles of a much larger size than those this study is attempting to obtain.
Microencapsulation of Prawn Feed Using Chitin Overview of Project
Roderick Bain 12
3.0 Overview of Project
This project was particularly difficult to plan, as which subsequent experiments would be
performed depended on the success or failure of the previous experiment(s). The primary
objective of the project was to develop discrete chitin microcapsules. In previous work
undertaken by Bain (1998), it appeared that this had already been achieved to the extent that a
preparative method had been developed to obtain microcapsules in solution. This method is
illustrated schematically in Figure 4-3 and is the basis of the experimental procedure detailed in
section Appendix 1.
Hence, the challenge was to obtain dry discrete microcapsules. A number of methods were
under consideration for achieving this. These were:
• Vacuum drying
• A freeze drying technique
• Drying under nitrogen gas; and
• Spray drying
Vacuum drying was considered first as this was the method used by Mi et al (1997a and
1997b). The other methods were to be considered in turn, depending on the success of the
previous trials. Unfortunately, vacuum drying was unable to be trialled due the explosive
hazard arising from drying the microcapsules which were in the nonsolvent acetone.
In addition to attempting to obtain dry discrete microcapsules, it was planned to prepare a
variety of different chitin solutions. This would provide information on the actual amount of
chitin in solution (pure chitin was not available) via the solution viscosity and hence provide
valuable information should pure chitin be available for future experiments. The different
solutions would also provide valuable information regarding the moisture uptake properties of
the microcapsules prepared from these solutions.
Microencapsulation of Prawn Feed Using Chitin Experimental
Roderick Bain 13
4.0 Experimental
4.1 Materials
Chitin (Sigma practical grade from crab shells, and prawn exuviae from CSIRO)
N,N-dimethylacetamide (Sigma, Merck)
Lithium Chloride (anhydrous, Sigma)
Acetone (spectrophotometric grade, Sigma)
Lysine (BDH)
Liquid nitrogen (BOC)
Compressed Air (Instrument Grade, BOC)
Compressed Nitrogen (Instrument Grade, BOC)
Water
4.2 Apparatus
The major apparatus required is listed below.
• Jacket heater
• Mixer
• Impeller
• Glass bowl and lid
• Condenser
• Mercury thermometer
• Spray nozzle
• Vacuum oven
• Magnetic stirrer
• U-tube viscometer
• Humidity Cabinet
• Balance
• Spirit level
A schematic diagram of the equipment for the dissolution of chitin can be seen in Figure 4-1.
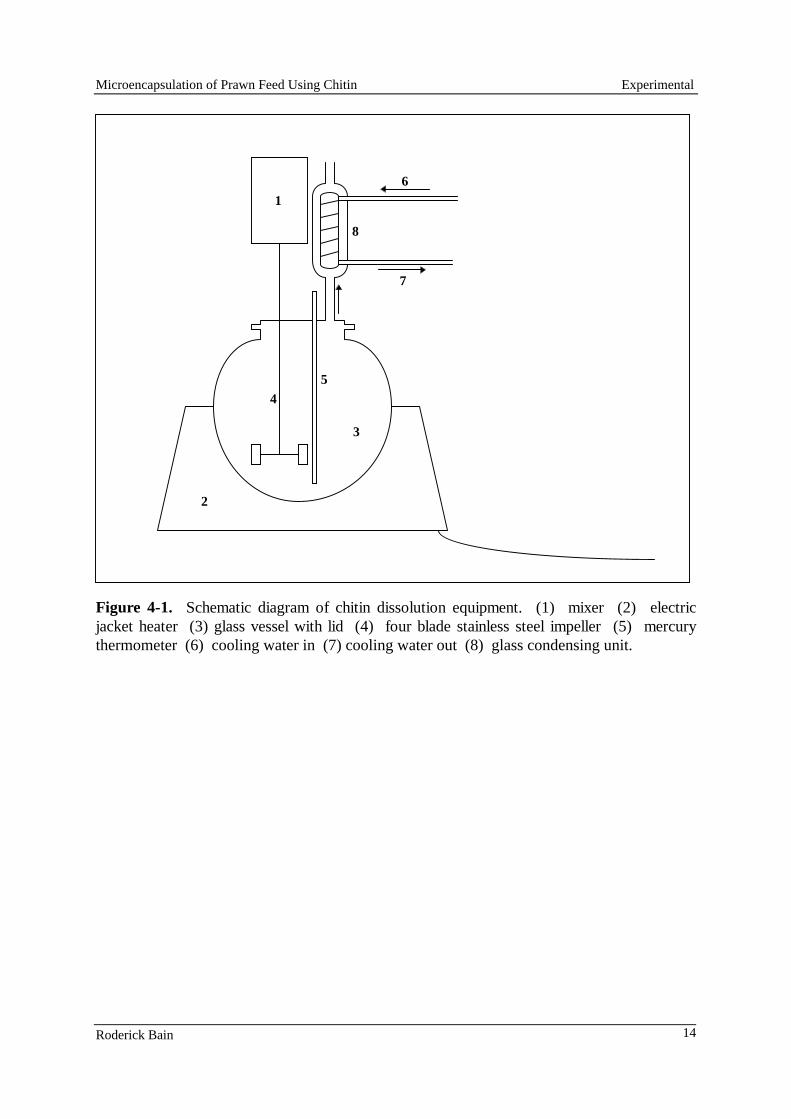
Microencapsulation of Prawn Feed Using Chitin Experimental
Roderick Bain 14
Figure 4-1. Schematic diagram of chitin dissolution equipment. (1) mixer (2) electricjacket heater (3) glass vessel with lid (4) four blade stainless steel impeller (5) mercurythermometer (6) cooling water in (7) cooling water out (8) glass condensing unit.
1
2
3
4
5
6
7
8
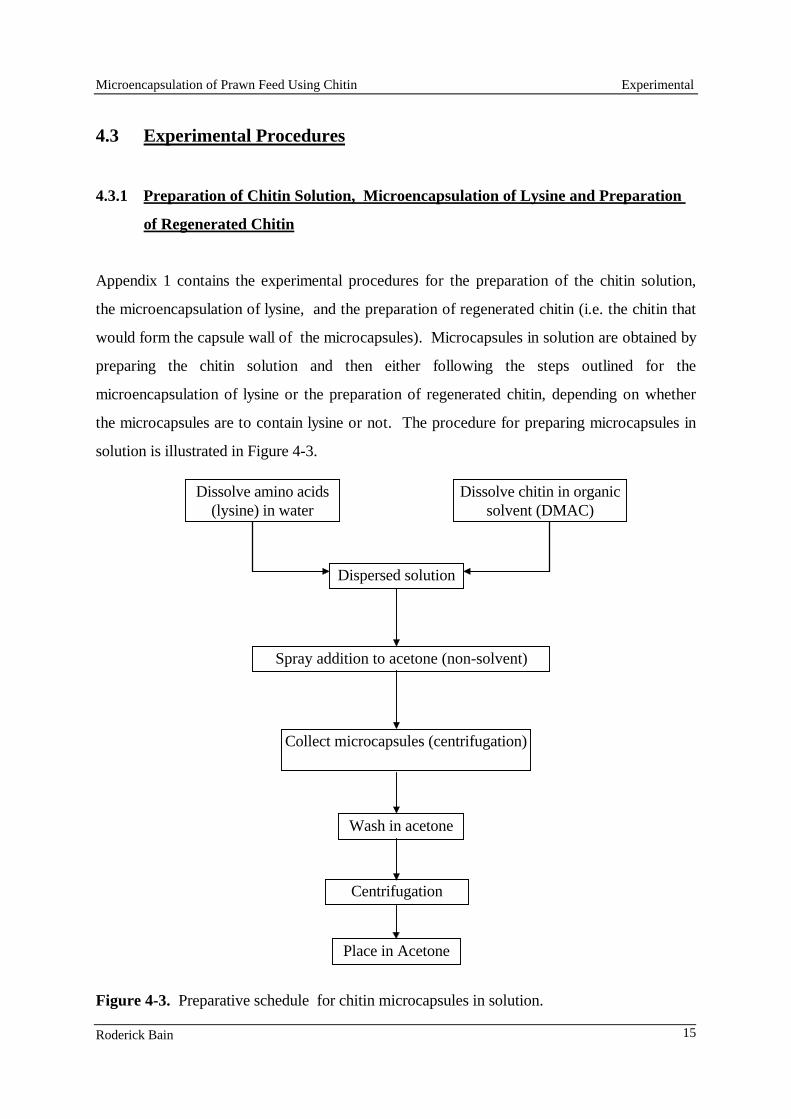
Microencapsulation of Prawn Feed Using Chitin Experimental
Roderick Bain 15
4.3 Experimental Procedures
4.3.1 Preparation of Chitin Solution, Microencapsulation of Lysine and Preparation
of Regenerated Chitin
Appendix 1 contains the experimental procedures for the preparation of the chitin solution,
the microencapsulation of lysine, and the preparation of regenerated chitin (i.e. the chitin that
would form the capsule wall of the microcapsules). Microcapsules in solution are obtained by
preparing the chitin solution and then either following the steps outlined for the
microencapsulation of lysine or the preparation of regenerated chitin, depending on whether
the microcapsules are to contain lysine or not. The procedure for preparing microcapsules in
solution is illustrated in Figure 4-3.
Figure 4-3. Preparative schedule for chitin microcapsules in solution.
Centrifugation
Place in Acetone
Dissolve amino acids(lysine) in water
Dissolve chitin in organicsolvent (DMAC)
Spray addition to acetone (non-solvent)
Collect microcapsules (centrifugation)
Wash in acetone
Dispersed solution
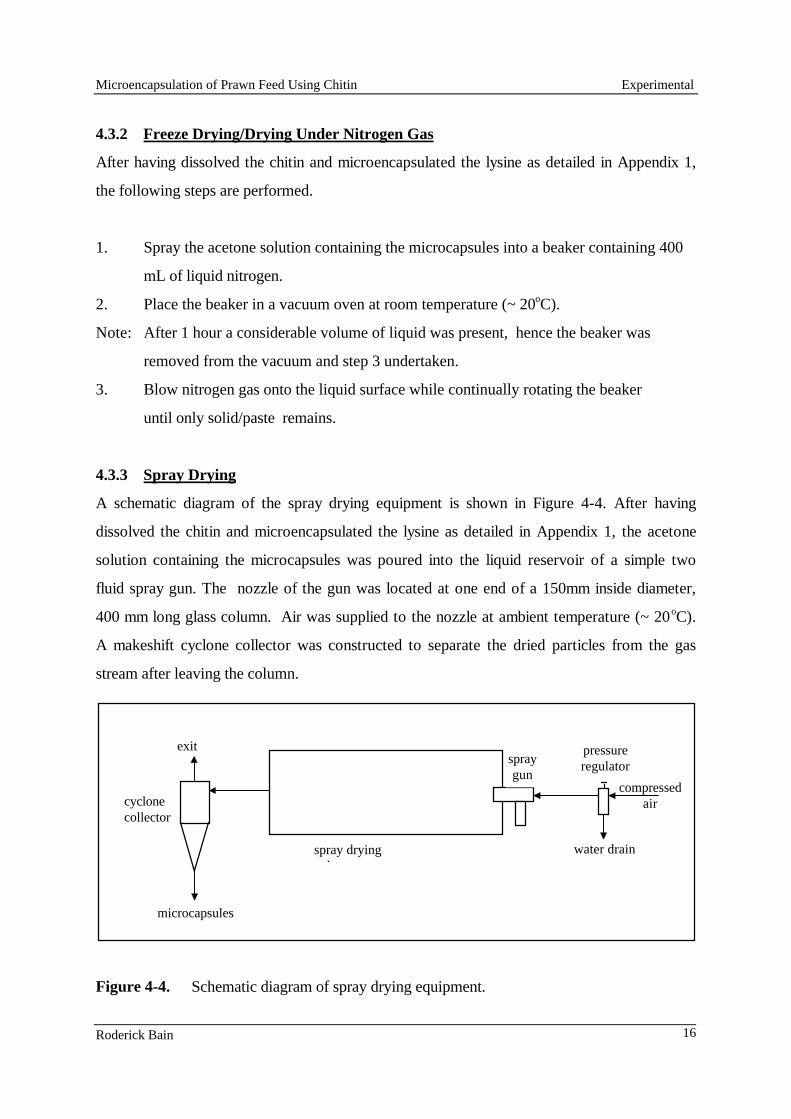
Microencapsulation of Prawn Feed Using Chitin Experimental
Roderick Bain 16
4.3.2 Freeze Drying/Drying Under Nitrogen Gas
After having dissolved the chitin and microencapsulated the lysine as detailed in Appendix 1,
the following steps are performed.
1. Spray the acetone solution containing the microcapsules into a beaker containing 400
mL of liquid nitrogen.
2. Place the beaker in a vacuum oven at room temperature (~ 20oC).
Note: After 1 hour a considerable volume of liquid was present, hence the beaker was
removed from the vacuum and step 3 undertaken.
3. Blow nitrogen gas onto the liquid surface while continually rotating the beaker
until only solid/paste remains.
4.3.3 Spray Drying
A schematic diagram of the spray drying equipment is shown in Figure 4-4. After having
dissolved the chitin and microencapsulated the lysine as detailed in Appendix 1, the acetone
solution containing the microcapsules was poured into the liquid reservoir of a simple two
fluid spray gun. The nozzle of the gun was located at one end of a 150mm inside diameter,
400 mm long glass column. Air was supplied to the nozzle at ambient temperature (~ 20oC).
A makeshift cyclone collector was constructed to separate the dried particles from the gas
stream after leaving the column.
Figure 4-4. Schematic diagram of spray drying equipment.
compressedair
microcapsules
cyclonecollector
exit
spray dryingl
water drain
pressureregulatorspray
gun
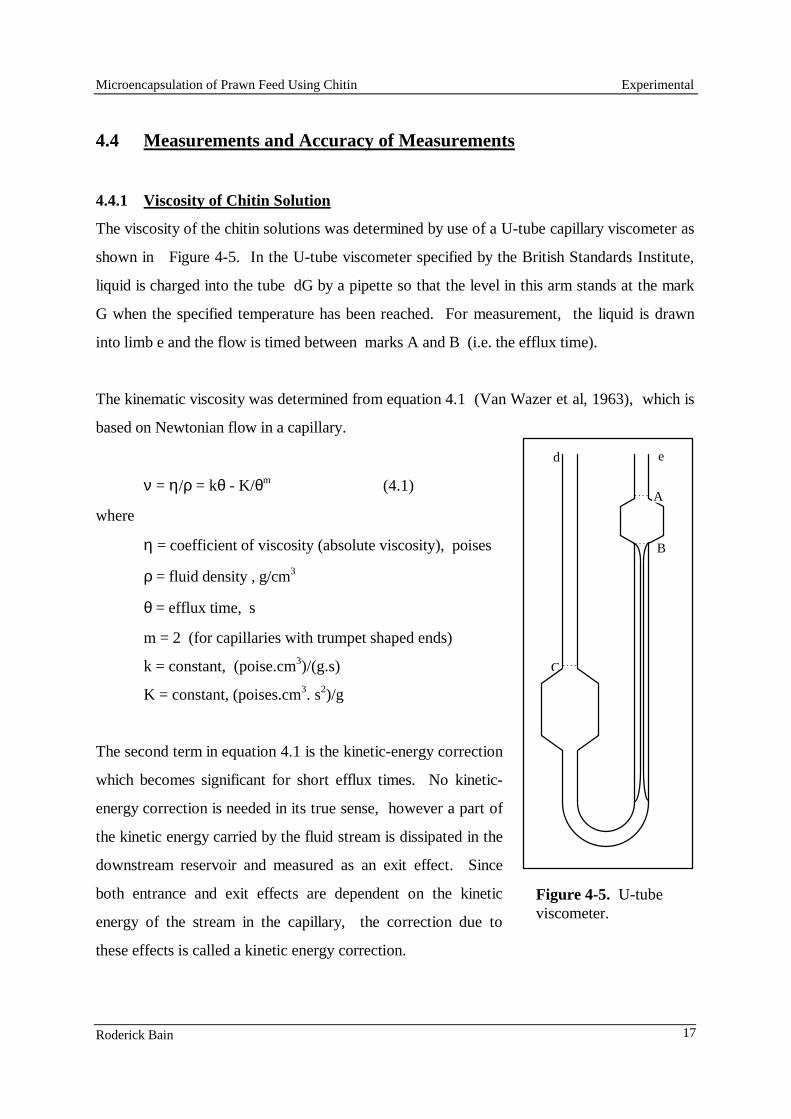
Microencapsulation of Prawn Feed Using Chitin Experimental
Roderick Bain 17
4.4 Measurements and Accuracy of Measurements
4.4.1 Viscosity of Chitin Solution
The viscosity of the chitin solutions was determined by use of a U-tube capillary viscometer as
shown in Figure 4-5. In the U-tube viscometer specified by the British Standards Institute,
liquid is charged into the tube dG by a pipette so that the level in this arm stands at the mark
G when the specified temperature has been reached. For measurement, the liquid is drawn
into limb e and the flow is timed between marks A and B (i.e. the efflux time).
The kinematic viscosity was determined from equation 4.1 (Van Wazer et al, 1963), which is
based on Newtonian flow in a capillary.
ν = η/ρ = kθ - K/θm (4.1)
where
η = coefficient of viscosity (absolute viscosity), poises
ρ = fluid density , g/cm3
θ = efflux time, s
m = 2 (for capillaries with trumpet shaped ends)
k = constant, (poise.cm3)/(g.s)
K = constant, (poises.cm3. s2)/g
The second term in equation 4.1 is the kinetic-energy correction
which becomes significant for short efflux times. No kinetic-
energy correction is needed in its true sense, however a part of
the kinetic energy carried by the fluid stream is dissipated in the
downstream reservoir and measured as an exit effect. Since
both entrance and exit effects are dependent on the kinetic
energy of the stream in the capillary, the correction due to
these effects is called a kinetic energy correction.
Figure 4-5. U-tubeviscometer.
d
C
A
B
e
Microencapsulation of Prawn Feed Using Chitin Experimental
Roderick Bain 18
The viscometer was calibrated by measuring the efflux time of standard fluids. In order to
determine the two coefficients in equation 4.1, two measurements were made at 24 oC with
water (ν = 0.8765 centistokes) and silicon oil (ν = 50 centistokes)3. The coefficients k and K
were calculated by solving simultaneous equations obtained by substituting viscosities and
efflux times of the reference materials into equation 4.1.
The absolute viscosity is determined from the kinematic viscosity and the solution density:
η = νρ (4.2)
Determination of solution density is discussed in section 4.4.5
4.4.2 Errors in Viscosity
For capillary viscometers there are numerous sources of error. These include:
• Entrance and exit effects;
• Surface-tension effects;
• Turbulence ;
• Deviation of the viscometer from the vertical;
• Drainage errors;
• Timing errors; and
• Temperature
The error arising from entrance and exit effects has been corrected for by use of the kinetic
energy correction. Errors arising from surface tension effects, turbulence, and drainage
effects are not considered here as they are small (Van Wazer, 1963 and Dinsdale, 1962). The
error resulting from deviation of the viscometer from the vertical was restricted by using a
spirit level to align the viscometer to the vertical. As a result of this, the error can be
considered to be negligible for the purpose of this project (Dinsdale, 1962).
The constants in equation 4.1 were determined from viscosities at 24 oC (room temp.).
Viscosities of the chitin solutions were determined from efflux times measured at temperatures
between 24oC and 28oC. The errors arising from these variations are extremely
3 This viscosity actually corresponds to 20oC not 24oC.
Microencapsulation of Prawn Feed Using Chitin Experimental
Roderick Bain 19
difficult to quantify and would require further experimental work. An indication of the likely
magnitude of the error can be obtained from information for cellulose which is similar in
structure to chitin. Most solutions of cellulose show a change in viscosity of 5-10% per
degree Centigrade (Ott et al., 1955). While the temperature during the determination of the
efflux time for each solution was constant, the variation in temperature between the solutions
restricts the comparisons that can be made between solutions.
One other major source of error is the error associated with measuring efflux times. Error
analysis from this source was performed and a sample calculation is contained in Appendix 2.
4.4.3 Water Absorption of Chitin and Lithium Chloride
Water absorption was determined by placing samples in open sample bottles inside a glass
desiccator containing silica gel for 20 hours. The samples were then placed in a humidity
chamber with a relative humidity of 65% ± 2. A fully enclosed digital balance was used to
weigh the bottles containing the samples on numerous occasions over an extended period of
time. Percentage moisture uptake is given by:
Moisture Uptake (%) =(m - m )
(m - m )sb b t
sb b to
× 100 (4.3)
where
msb = mass of sample + bottle
mb = mass of bottle;
and the subscripts t and to refer to the masses at time t and t = 0 respectively.
4.4.4 Errors in Water Absorption
The major error associated with the moisture absorption of the samples is due to the variation
of exposed sample surface between samples. This error is impossible to quantify as the
exposed sample surface is unknown. Another source of error is in the initial mass of the
samples. It has been assumed that 20 hours is sufficient time for the samples to reach their
steady-state dry mass.
Microencapsulation of Prawn Feed Using Chitin Experimental
Roderick Bain 20
The only other major source of error is the error associated with weighing the samples. Error
analysis from this source was performed and a sample calculation is contained in Appendix 2.
4.4.5 Density of Chitin Solutions
The density of the chitin solutions was determined by measuring 10 mL of solution in a pipette
and weighing this quantity of solution using a fully enclosed digital balance. Density was then
determined by dividing the solution mass by the solution volume.
4.4.6 Errors in Density
The error in density arises from the error in measuring the volume of solution and the error in
determining the mass of the solution. Error analysis from these sources was performed and a
sample calculation is contained in Appendix 2.
4.4.7 Actual Concentration of Chitin Solutions
Agboh (1986) found that for chitin solutions in DMAc-LiCl, the solution viscosity correlates
to the concentration, C in the form of :
η = KC4.0-4.5 (4.4)
Manipulation of this correlation provides a means of determining the actual concentration of
the chitin solutions from the viscosity, i.e.
C =K
η
−1
4 0 4 5. .(4.5)
As the exponent of C in equation 4.4 varies between 4.0 and 4.5, it was decided to
determine the constant, K, and the concentration using both of these values. The constant, K
was determined from Figure 4-6 using a concentration of 9.8% corresponding to a viscosity of
100 Pa.s.
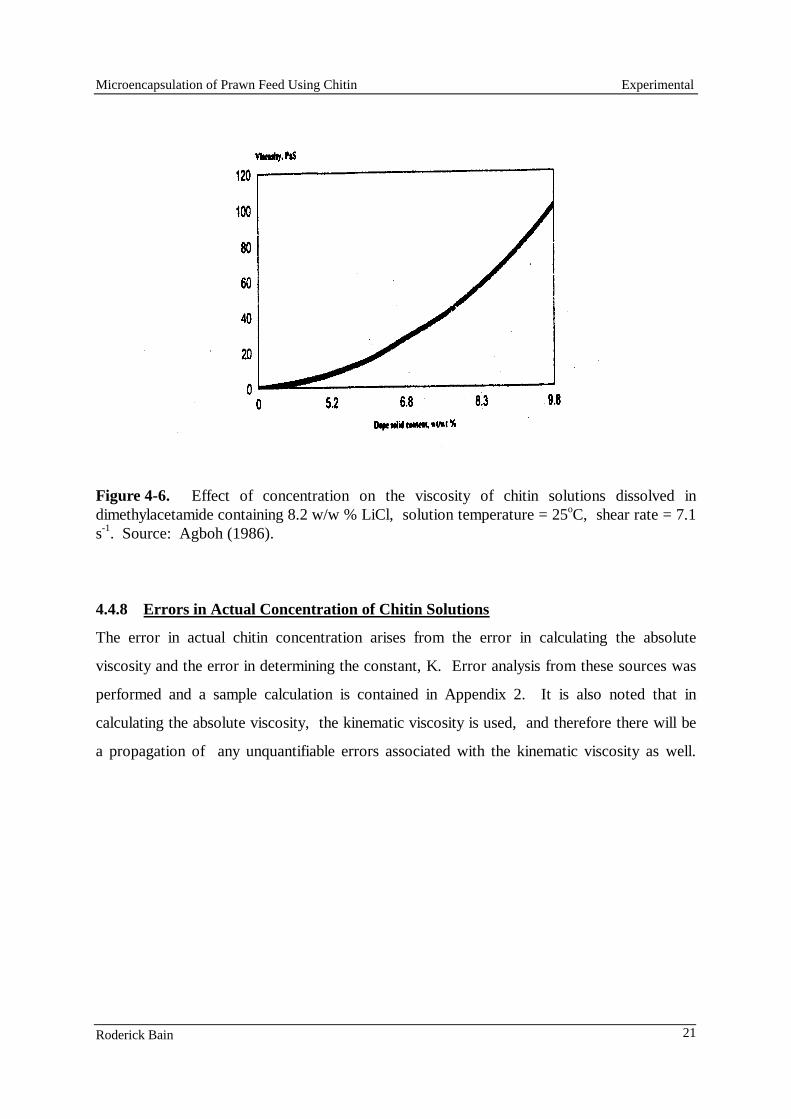
Microencapsulation of Prawn Feed Using Chitin Experimental
Roderick Bain 21
Figure 4-6. Effect of concentration on the viscosity of chitin solutions dissolved indimethylacetamide containing 8.2 w/w % LiCl, solution temperature = 25oC, shear rate = 7.1s-1. Source: Agboh (1986).
4.4.8 Errors in Actual Concentration of Chitin Solutions
The error in actual chitin concentration arises from the error in calculating the absolute
viscosity and the error in determining the constant, K. Error analysis from these sources was
performed and a sample calculation is contained in Appendix 2. It is also noted that in
calculating the absolute viscosity, the kinematic viscosity is used, and therefore there will be
a propagation of any unquantifiable errors associated with the kinematic viscosity as well.
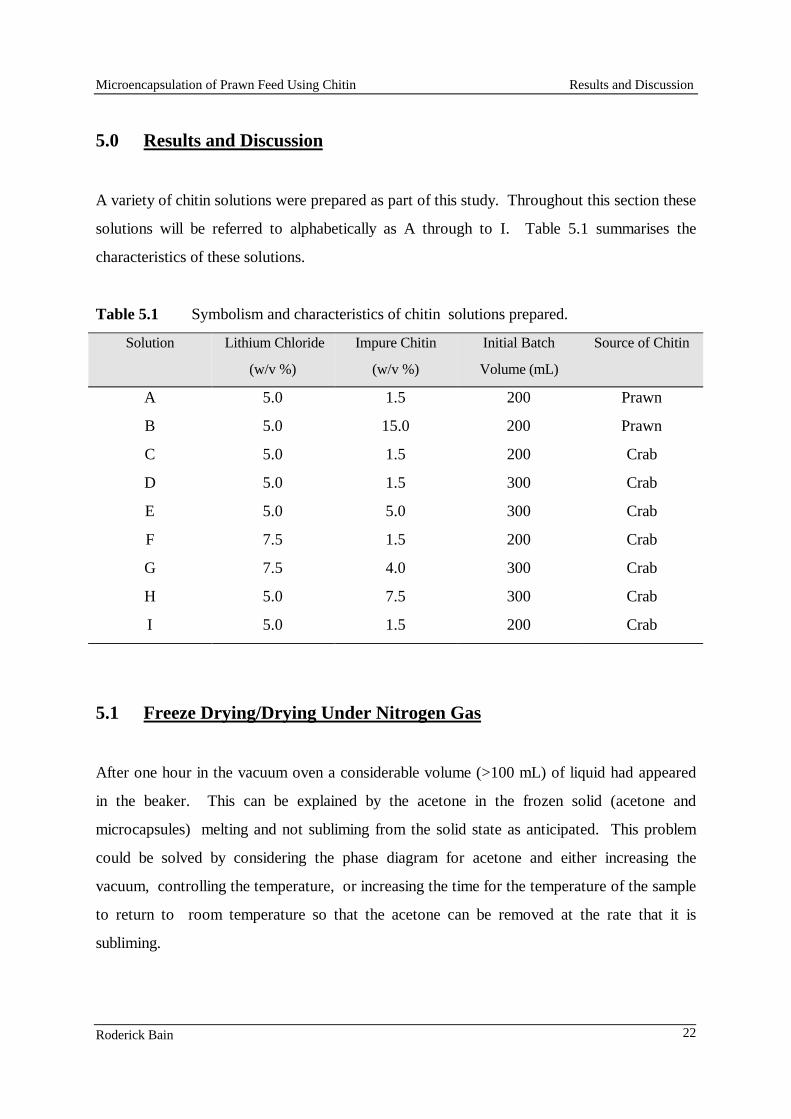
Microencapsulation of Prawn Feed Using Chitin Results and Discussion
Roderick Bain 22
5.0 Results and Discussion
A variety of chitin solutions were prepared as part of this study. Throughout this section these
solutions will be referred to alphabetically as A through to I. Table 5.1 summarises the
characteristics of these solutions.
Table 5.1 Symbolism and characteristics of chitin solutions prepared.
Solution Lithium Chloride
(w/v %)
Impure Chitin
(w/v %)
Initial Batch
Volume (mL)
Source of Chitin
A 5.0 1.5 200 Prawn
B 5.0 15.0 200 Prawn
C 5.0 1.5 200 Crab
D 5.0 1.5 300 Crab
E 5.0 5.0 300 Crab
F 7.5 1.5 200 Crab
G 7.5 4.0 300 Crab
H 5.0 7.5 300 Crab
I 5.0 1.5 200 Crab
5.1 Freeze Drying/Drying Under Nitrogen Gas
After one hour in the vacuum oven a considerable volume (>100 mL) of liquid had appeared
in the beaker. This can be explained by the acetone in the frozen solid (acetone and
microcapsules) melting and not subliming from the solid state as anticipated. This problem
could be solved by considering the phase diagram for acetone and either increasing the
vacuum, controlling the temperature, or increasing the time for the temperature of the sample
to return to room temperature so that the acetone can be removed at the rate that it is
subliming.
Microencapsulation of Prawn Feed Using Chitin Results and Discussion
Roderick Bain 23
The effect of blowing nitrogen gas onto the liquid solution that resulted was to vaporise the
acetone. This occurred in approximately 30 minutes with a small flow of nitrogen. The solid
left behind was in the form of a paste that had an moist oily-feel when touched. Despite
leaving this paste in a desiccator for 24 hours, the moist oily-feel persisted but was not quite
as severe. Upon exposure to ambient conditions for several days, the paste became
increasingly moist and after a week had developed into a viscous liquid (at least 100
centistokes). This can only be explained by some form of moisture uptake phenomenon. The
two most likely explanations for this behaviour are the presence of the highly hydrophilic salt,
lithium chloride used in the chitin dissolution process , or moisture uptake of the chitin itself.
Moisture uptake of chitin membranes has been noted by Aiba et al (1985a and 1985b) and
Kataoka and Ando (1979).
5.2 Spray Drying
Despite using a variety of air flow rates by means of adjusting the pressure regulator (10psi -
100psi), liquid accumulated in the glass column. This can be explained by the fact that the
flow of liquid through the nozzle was too high and resulted in the vapour in the glass column
becoming saturated with acetone. Unfortunately with the equipment available, the only
means of controlling the liquid flow was pressure regulation of the air stream. Increasing the
temperature of the air stream may increase the amount of acetone vaporised, however, the air
stream could not be hotter than 60oC otherwise the lysine in the microcapsules would be
denatured. Also, increasing the temperature significantly increases the explosion/flammability
hazard associated with the acetone. Therefore I believe that increasing the temperature is not
the best option.
With the appropriate spray drying equipment (i.e. equipment that has the ability to restrict the
flow of the liquid phase to very low flows) spray drying exhibits excellent potential for
obtaining discrete dry microcapsules.
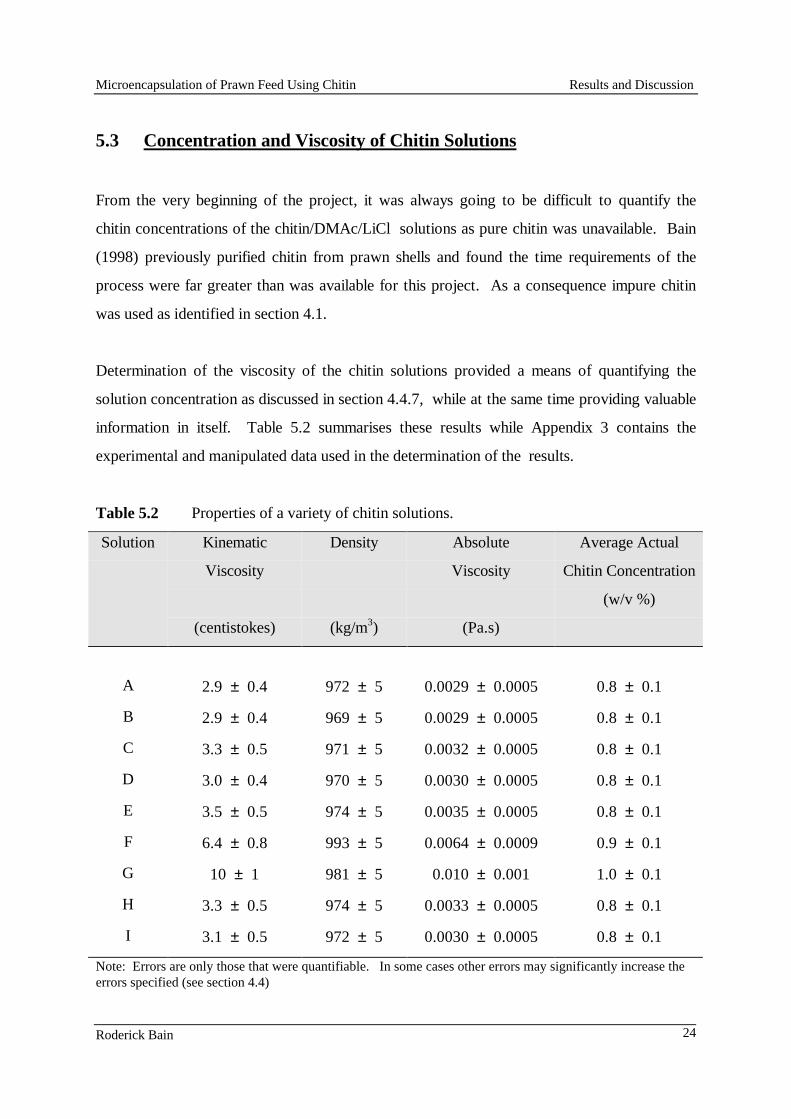
Microencapsulation of Prawn Feed Using Chitin Results and Discussion
Roderick Bain 24
5.3 Concentration and Viscosity of Chitin Solutions
From the very beginning of the project, it was always going to be difficult to quantify the
chitin concentrations of the chitin/DMAc/LiCl solutions as pure chitin was unavailable. Bain
(1998) previously purified chitin from prawn shells and found the time requirements of the
process were far greater than was available for this project. As a consequence impure chitin
was used as identified in section 4.1.
Determination of the viscosity of the chitin solutions provided a means of quantifying the
solution concentration as discussed in section 4.4.7, while at the same time providing valuable
information in itself. Table 5.2 summarises these results while Appendix 3 contains the
experimental and manipulated data used in the determination of the results.
Table 5.2 Properties of a variety of chitin solutions.
Solution Kinematic
Viscosity
(centistokes)
Density
(kg/m3)
Absolute
Viscosity
(Pa.s)
Average Actual
Chitin Concentration
(w/v %)
A 2.9 ± 0.4 972 ± 5 0.0029 ± 0.0005 0.8 ± 0.1
B 2.9 ± 0.4 969 ± 5 0.0029 ± 0.0005 0.8 ± 0.1
C 3.3 ± 0.5 971 ± 5 0.0032 ± 0.0005 0.8 ± 0.1
D 3.0 ± 0.4 970 ± 5 0.0030 ± 0.0005 0.8 ± 0.1
E 3.5 ± 0.5 974 ± 5 0.0035 ± 0.0005 0.8 ± 0.1
F 6.4 ± 0.8 993 ± 5 0.0064 ± 0.0009 0.9 ± 0.1
G 10 ± 1 981 ± 5 0.010 ± 0.001 1.0 ± 0.1
H 3.3 ± 0.5 974 ± 5 0.0033 ± 0.0005 0.8 ± 0.1
I 3.1 ± 0.5 972 ± 5 0.0030 ± 0.0005 0.8 ± 0.1
Note: Errors are only those that were quantifiable. In some cases other errors may significantly increase theerrors specified (see section 4.4)
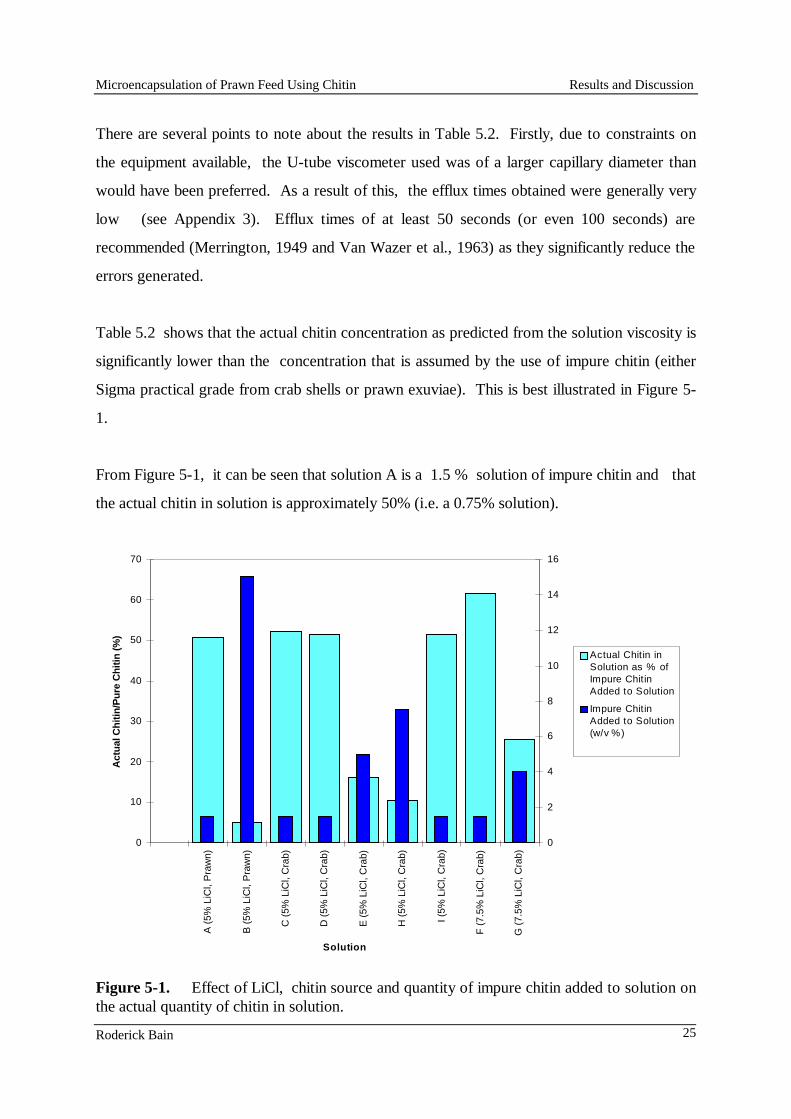
Microencapsulation of Prawn Feed Using Chitin Results and Discussion
Roderick Bain 25
There are several points to note about the results in Table 5.2. Firstly, due to constraints on
the equipment available, the U-tube viscometer used was of a larger capillary diameter than
would have been preferred. As a result of this, the efflux times obtained were generally very
low (see Appendix 3). Efflux times of at least 50 seconds (or even 100 seconds) are
recommended (Merrington, 1949 and Van Wazer et al., 1963) as they significantly reduce the
errors generated.
Table 5.2 shows that the actual chitin concentration as predicted from the solution viscosity is
significantly lower than the concentration that is assumed by the use of impure chitin (either
Sigma practical grade from crab shells or prawn exuviae). This is best illustrated in Figure 5-
1.
From Figure 5-1, it can be seen that solution A is a 1.5 % solution of impure chitin and that
the actual chitin in solution is approximately 50% (i.e. a 0.75% solution).
0
10
20
30
40
50
60
70
A (
5% L
iCl,
Pra
wn)
B (
5% L
iCl,
Pra
wn)
C (
5% L
iCl,
Cra
b)
D (
5% L
iCl,
Cra
b)
E (
5% L
iCl,
Cra
b)
H (
5% L
iCl,
Cra
b)
I (5%
LiC
l, C
rab)
F (
7.5%
LiC
l, C
rab)
G (
7.5%
LiC
l, C
rab)
Solution
Act
ual C
hitin
/Pur
e C
hitin
(%)
0
2
4
6
8
10
12
14
16
Actual Chitin inSolution as % ofImpure ChitinAdded to Solution
Impure ChitinAdded to Solution(w/v %)
Figure 5-1. Effect of LiCl, chitin source and quantity of impure chitin added to solution onthe actual quantity of chitin in solution.
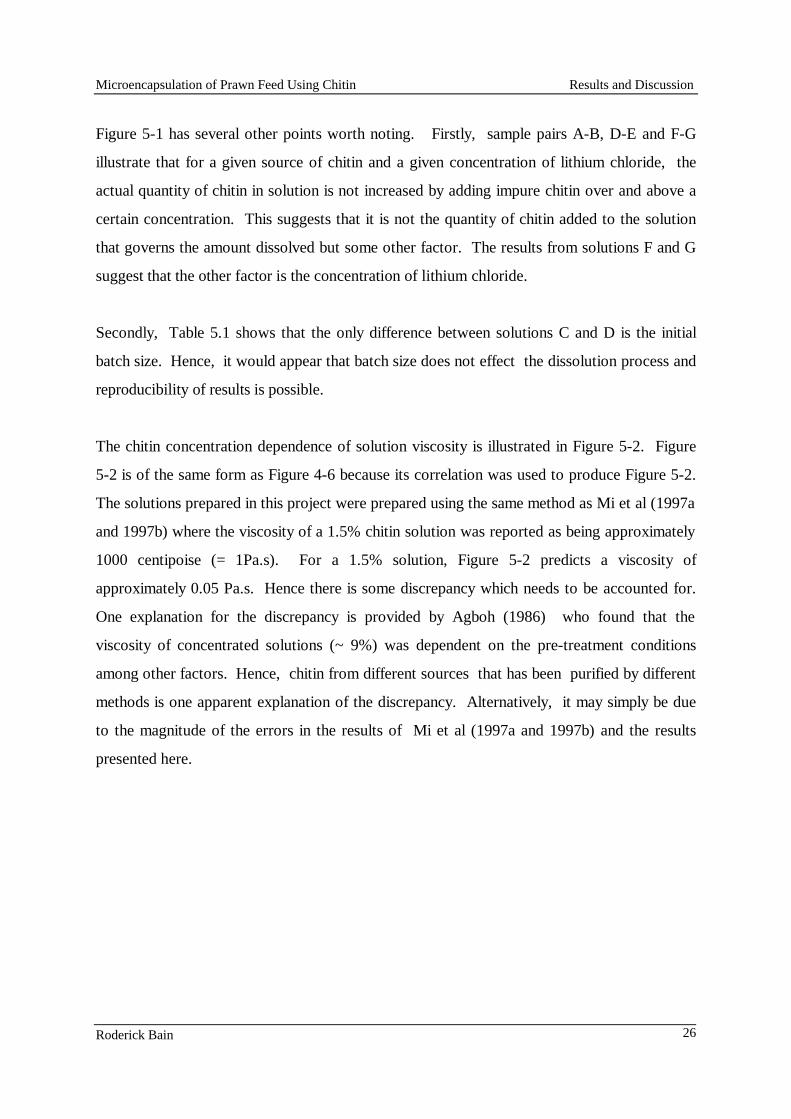
Microencapsulation of Prawn Feed Using Chitin Results and Discussion
Roderick Bain 26
Figure 5-1 has several other points worth noting. Firstly, sample pairs A-B, D-E and F-G
illustrate that for a given source of chitin and a given concentration of lithium chloride, the
actual quantity of chitin in solution is not increased by adding impure chitin over and above a
certain concentration. This suggests that it is not the quantity of chitin added to the solution
that governs the amount dissolved but some other factor. The results from solutions F and G
suggest that the other factor is the concentration of lithium chloride.
Secondly, Table 5.1 shows that the only difference between solutions C and D is the initial
batch size. Hence, it would appear that batch size does not effect the dissolution process and
reproducibility of results is possible.
The chitin concentration dependence of solution viscosity is illustrated in Figure 5-2. Figure
5-2 is of the same form as Figure 4-6 because its correlation was used to produce Figure 5-2.
The solutions prepared in this project were prepared using the same method as Mi et al (1997a
and 1997b) where the viscosity of a 1.5% chitin solution was reported as being approximately
1000 centipoise (= 1Pa.s). For a 1.5% solution, Figure 5-2 predicts a viscosity of
approximately 0.05 Pa.s. Hence there is some discrepancy which needs to be accounted for.
One explanation for the discrepancy is provided by Agboh (1986) who found that the
viscosity of concentrated solutions (~ 9%) was dependent on the pre-treatment conditions
among other factors. Hence, chitin from different sources that has been purified by different
methods is one apparent explanation of the discrepancy. Alternatively, it may simply be due
to the magnitude of the errors in the results of Mi et al (1997a and 1997b) and the results
presented here.
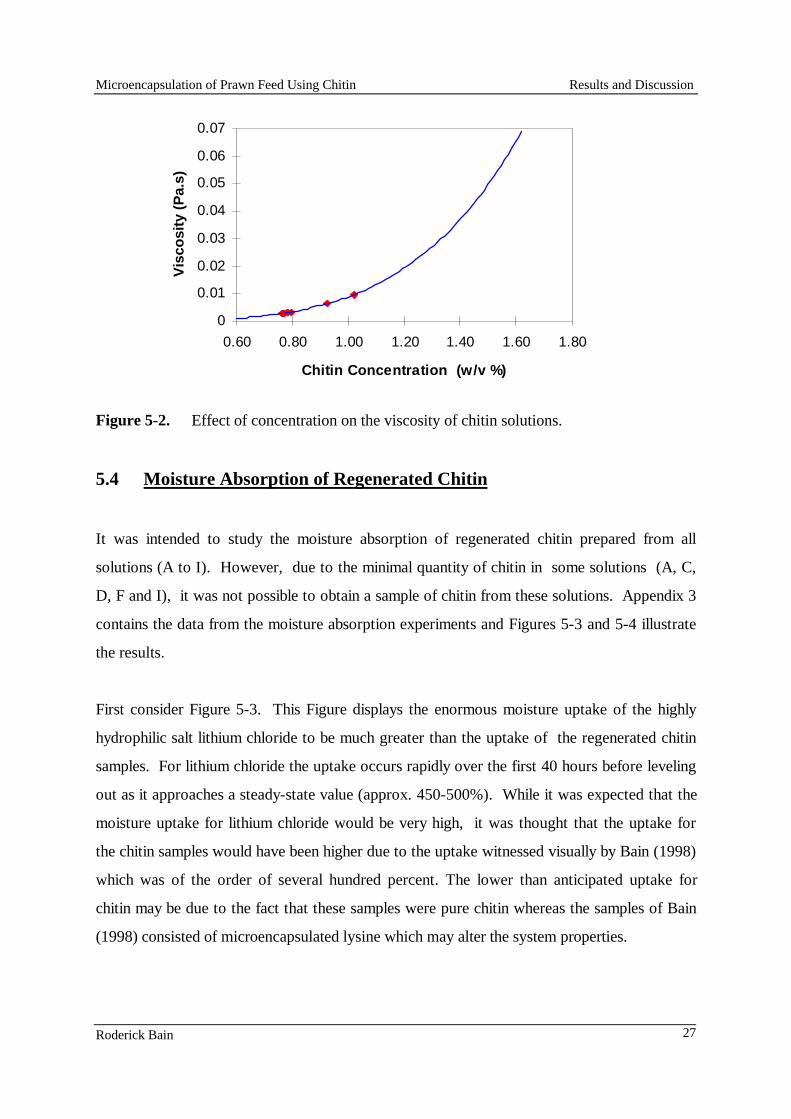
Microencapsulation of Prawn Feed Using Chitin Results and Discussion
Roderick Bain 27
0
0.01
0.02
0.03
0.04
0.05
0.06
0.07
0.60 0.80 1.00 1.20 1.40 1.60 1.80
Chitin Concentration (w/v %)
Vis
cosi
ty (
Pa.
s)
Figure 5-2. Effect of concentration on the viscosity of chitin solutions.
5.4 Moisture Absorption of Regenerated Chitin
It was intended to study the moisture absorption of regenerated chitin prepared from all
solutions (A to I). However, due to the minimal quantity of chitin in some solutions (A, C,
D, F and I), it was not possible to obtain a sample of chitin from these solutions. Appendix 3
contains the data from the moisture absorption experiments and Figures 5-3 and 5-4 illustrate
the results.
First consider Figure 5-3. This Figure displays the enormous moisture uptake of the highly
hydrophilic salt lithium chloride to be much greater than the uptake of the regenerated chitin
samples. For lithium chloride the uptake occurs rapidly over the first 40 hours before leveling
out as it approaches a steady-state value (approx. 450-500%). While it was expected that the
moisture uptake for lithium chloride would be very high, it was thought that the uptake for
the chitin samples would have been higher due to the uptake witnessed visually by Bain (1998)
which was of the order of several hundred percent. The lower than anticipated uptake for
chitin may be due to the fact that these samples were pure chitin whereas the samples of Bain
(1998) consisted of microencapsulated lysine which may alter the system properties.
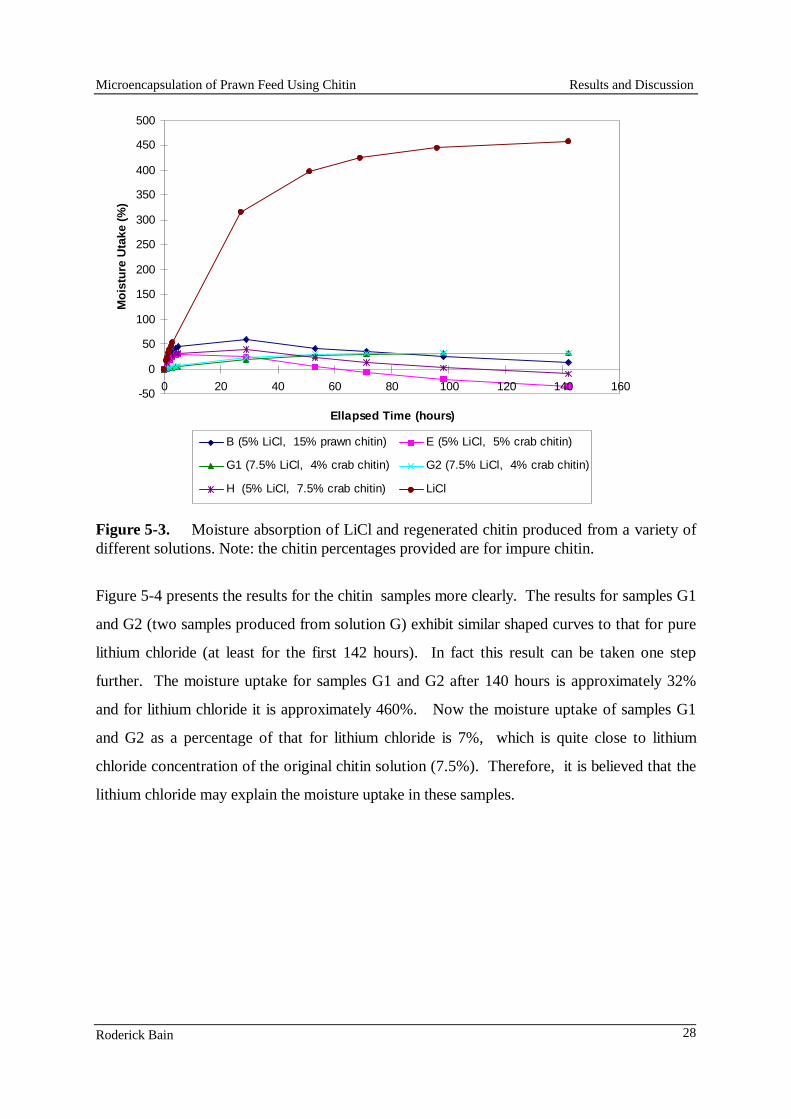
Microencapsulation of Prawn Feed Using Chitin Results and Discussion
Roderick Bain 28
-50
0
50
100
150
200
250
300
350
400
450
500
0 20 40 60 80 100 120 140 160
Ellapsed Time (hours)
Moi
stur
e U
take
(%
)
B (5% LiCl, 15% prawn chitin) E (5% LiCl, 5% crab chitin)
G1 (7.5% LiCl, 4% crab chitin) G2 (7.5% LiCl, 4% crab chitin)
H (5% LiCl, 7.5% crab chitin) LiCl
Figure 5-3. Moisture absorption of LiCl and regenerated chitin produced from a variety ofdifferent solutions. Note: the chitin percentages provided are for impure chitin.
Figure 5-4 presents the results for the chitin samples more clearly. The results for samples G1
and G2 (two samples produced from solution G) exhibit similar shaped curves to that for pure
lithium chloride (at least for the first 142 hours). In fact this result can be taken one step
further. The moisture uptake for samples G1 and G2 after 140 hours is approximately 32%
and for lithium chloride it is approximately 460%. Now the moisture uptake of samples G1
and G2 as a percentage of that for lithium chloride is 7%, which is quite close to lithium
chloride concentration of the original chitin solution (7.5%). Therefore, it is believed that the
lithium chloride may explain the moisture uptake in these samples.
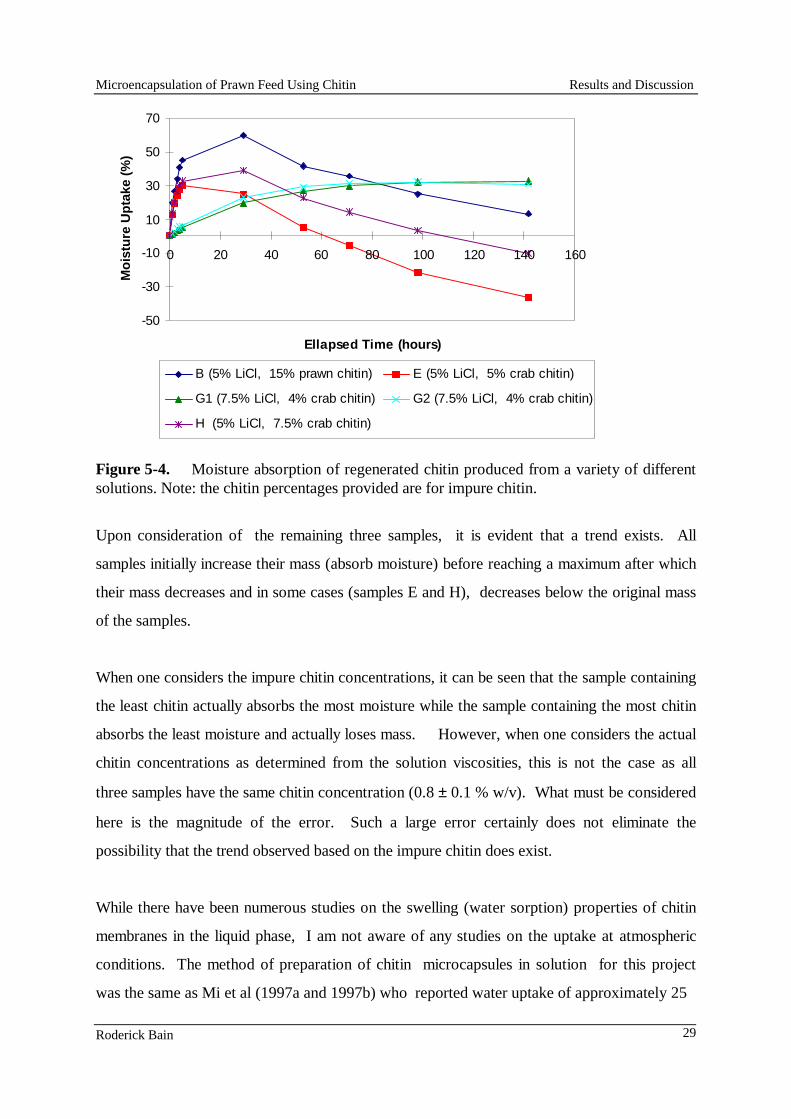
Microencapsulation of Prawn Feed Using Chitin Results and Discussion
Roderick Bain 29
-50
-30
-10
10
30
50
70
0 20 40 60 80 100 120 140 160
Ellapsed Time (hours)
Moi
stur
e U
ptak
e (%
)
B (5% LiCl, 15% prawn chitin) E (5% LiCl, 5% crab chitin)
G1 (7.5% LiCl, 4% crab chitin) G2 (7.5% LiCl, 4% crab chitin)
H (5% LiCl, 7.5% crab chitin)
Figure 5-4. Moisture absorption of regenerated chitin produced from a variety of differentsolutions. Note: the chitin percentages provided are for impure chitin.
Upon consideration of the remaining three samples, it is evident that a trend exists. All
samples initially increase their mass (absorb moisture) before reaching a maximum after which
their mass decreases and in some cases (samples E and H), decreases below the original mass
of the samples.
When one considers the impure chitin concentrations, it can be seen that the sample containing
the least chitin actually absorbs the most moisture while the sample containing the most chitin
absorbs the least moisture and actually loses mass. However, when one considers the actual
chitin concentrations as determined from the solution viscosities, this is not the case as all
three samples have the same chitin concentration (0.8 ± 0.1 % w/v). What must be considered
here is the magnitude of the error. Such a large error certainly does not eliminate the
possibility that the trend observed based on the impure chitin does exist.
While there have been numerous studies on the swelling (water sorption) properties of chitin
membranes in the liquid phase, I am not aware of any studies on the uptake at atmospheric
conditions. The method of preparation of chitin microcapsules in solution for this project
was the same as Mi et al (1997a and 1997b) who reported water uptake of approximately 25
Microencapsulation of Prawn Feed Using Chitin Results and Discussion
Roderick Bain 30
% after 4 hours in water. From Figure 5-4 , it can be seen that data obtained in air (65%
relative humidity) is consistent with this. Mi et al (1997a and 1997b) also noted that there
was a slight decrease in uptake at the end of the 4 hour period but did not study the uptake
beyond 4 hours. This is consistent with the results of Figure 5-4 which also show a decrease.
The solutions Mi et al (1997a and 1997b) used were 1.5% chitin solutions and based on the
trend exhibited in Figure 5-4 for increases in the preparative solution concentration, a 25 %
uptake is consistent.
The fact that there is a decrease in moisture uptake, and in some cases a decrease from the
initial sample mass following an initial uptake, indicates that there are some complex
chemical/physical processes occurring. While the chemistry of chitin, its dissolution in the
DMAc-LiCL solvent system, and the membranes/films produced from these systems have
been studied for some years, they are only just beginning to be well understood. Valuable
work was performed by Vincendon (1985) and Terbojevich et al. (1988) who have studied
the chitin dissolution mechanism in the DMAc-LiCl system. In addition Dawsey and
McCormick (1990) provided a literature review of the DMAc-LiCl system for cellulose which
is of significant value due to the structural similarity between chitin and cellulose.
As a result of studying this above literature and other literature referred to in this thesis, it is
my opinion that this peculiar moisture uptake behaviour is most likely attributed to the
structure of the chitin produced (i.e the crystallinity) and/or the dissolution chemistry of chitin
in the solvent system and the nonsolvent (ie acetone). In particular , the main concern with
regard to the solvent and nonsolvent chemistry is exactly what role the lithium chloride plays
and whether it remains a part of the chitin samples produced from addition of the chitin
solution to the nonsolvent.
The final aspect of the results illustrated by Figure 5-4 that needs to be considered is why there
is such a distinct difference in the behaviour of samples G1 and G2 from the other samples. A
difference between these solutions was first noticed when the chitin/DMAc/LiCl solution G
was added to the acetone. This resulted in the formation of a gel rather than the
agglomerations produced from all other solutions. This may be due to the fact that at an
Microencapsulation of Prawn Feed Using Chitin Results and Discussion
Roderick Bain 31
actual chitin concentration of between 0.80 (solution E) and 1.02 (solution G) the solution can
be considered to be “concentrated” . This theory is supported by Ott et al. (1955) where it is
reported that for moderately or highly concentrated solutions of long chain molecules in
solvents with small molecules the phase richer in the higher molecular weight component
usually has the properties of a gel. It is difficult to give an exact definition of the terms
“dilute” and “concentrated”, however, as a rule of thumb, a polymer solution may be called
concentrated if the solute concentration exceed 5% by weight (Van Krevelen, 1990). Hence
a 1% solution could be considered to be moderately concentrated and thus explain this
phenomenon.
Microencapsulation of Prawn Feed Using Chitin Conclusions
Roderick Bain 32
6.0 Conclusions
This study has investigated the microencapsulation of lysine by the simple desolvation phase
separation method for use as a feed supplement for prawns. A key focus of the work was to
study methods for obtaining discrete dry microcapsules. Associated with this was the study of
the preparative solution properties (viscosity and concentration) and the moisture absorption
properties of the microcapsule wall material (chitin) produced from different preparative
solutions.
The key findings are listed below:
• Spray drying exhibits the most potential for obtaining discrete dry microcapsules;
• For dissolution of chitin in the solvent N,N-dimethylacetamide, 5 % (w/v) of lithium
chloride is sufficient, however dissolution can be increased by using 7.5% (w/v);
• The determination of the viscosity of the chitin preparative solution is a potential means of
quantifying the actual chitin concentration of a solution prepared from impure chitin;
• For a specified solvent lithium chloride concentration , there exits a maximum solution
chitin concentration that can be achieved regardless of the quantity of chitin added;
• The preparative solution lithium chloride concentration exhibits potential in explaining
moisture uptake in certain regenerated chitin samples; and
• Chitin concentration has a distinct effect on the moisture uptake behaviour of certain
regenerated chitin samples.
While the main objective of the study (i.e. to develop discrete chitin microcapsules) was not
achieved, extremely valuable results were obtained. The findings of this study have allowed
comparison/confirmation of other researchers’ work, as well as adding to the studies of
previous workers. In addition, new questions have been raised and in some cases possible
explanations given. The production of chitin microcapsules exhibits a great deal of promise,
however, greater understanding of the chemical and physical processes occurring in the
production of such capsules is required.
Microencapsulation of Prawn Feed Using Chitin Recommendations
Roderick Bain 33
7.0 Recommendations
The experimental studies undertaken in this project shed light on the following:
• potential methods for obtaining dry discrete microcapsules;
• the use of viscosity in determining the concentration of chitin solutions;
• the effect of lithium chloride concentration on the actual chitin concentration in the
preparative solution; and
• the effect of lithium chloride concentration and chitin concentration on the moisture
uptake/loss behaviour of regenerated chitin samples.
However, they fall short of being able to quantify and ascertain to an appropriate degree of
certainty these methods and behaviours. Hence, these areas should be pursued.
In particular the following is recommended:
• Spray drying should be attempted using the appropriate equipment;
• The viscosity of an extensive concentration range of chitin solutions should be determined,
and the effect of temperature, chitin source (e.g. prawn and crab), lithium chloride
concentration, and method of chitin purification on the viscosity should be investigated;
and
• The moisture uptake/loss behaviour of regenerated chitin samples (i.e. microcapsules) in
the atmosphere at a variety of relative humidities should be investigated. The samples
should be produced from a variety of different preparative solutions and some
microcapsules should contain lysine.
Microencapsulation of Prawn Feed Using Chitin References
Roderick Bain 34
8.0 References
Aiba, S., Izume, M., Minoura, N. and Fujiwara, Y. (1985a) Studies on chitin. 2. Preparation and properties of chitin membranes., Carbohydrate Polymers., 5, 285-295.
Aiba, S., Izume, M., Minoura, N. and Fujiwara, Y. (1985b) Studies on chitin. 3-Effect of coagulants and annealing on the preparation and the properties of chitin membrane., British Polymer Journal., 17(1), 38-40.
Agboh, O. C., (1986) In Agboh, O. C. and Qin, Y. (1997) Chitin and Chitosan Fibres, Polymers for Advanced Technologies, 8, 355-365.
Bain, R.A (1998) Encapsulation of Prawn Feed Using Chitin, Chemical Engineering Undergraduate Thesis Design Report, University of Queensland.
Balassa, L. L. and Fanger, G.O (1971) In Komari (1993) Microencapsulation of Fish Oil by Complex Coacervation for Aquaculture., PhD Thesis, Department of Chemical Engineering, University of Queensland.
Blair, H.S., Guthrie, J., Law, T. and Turkington, P. (1987) Chitosan and modified chitosan membranes I. Preparation and characterisation., J. App. Poly. Sci., 33, 641-656.
Dawsey, T.R and McCormick, C.L (1990) The Lithium Chloride/Dimethylacetamide Solvent for Cellulose: A literature Review., JMS-Rev. Macromol. Chem. Phys., C30(3&4), 405-440.
Dinsdale, A. and Moore, F., Viscosity and Its Measurement, The Institute of Physics and the Physical Society, 1962.
Finch, C.A., (1985) Polymers for microcapsule walls., Chem. Ind., 22, 752-756.
Kataoka, S. and Ando, T. (1979) In Aiba, S., Izume, M., Minoura, N. and Fujiwara, Y. (1985b) Studies on chitin. 3-Effect of coagulants and annealing on the preparation and the properties of chitin membrane., British Polymer Journal., 17(1), 38-40.
Komari (1993) Microencapsulation of Fish Oil by Complex Coacervation for Aquaculture., Department of Chemical Engineering, University of Queensland, Australia.
Li, S.P., Kowarski, C.R., Feld, K.M. and Grim, W.M. (1988) Recent advances in microencapsulation technology and equipment., Drug Dev. Ind. Pharm., 14(2&3) , 353-376.
Microencapsulation of Prawn Feed Using Chitin References
Roderick Bain 35
Lister, J.D., Smith, D. and Vijaya Bhashkar, H.P. (1995) Microencapsulation Techniques for Prawn Feed Formulation., Fishing Industry Research Council Final Report, FIRC Project 17 (FIRC ref. 90/65).
Merrington, A.C., Viscometry, Edward Arnold & Co., London, 1949.
Mi, F.-L., Tseng, Y.-C., Chen, C.-T. and Shyu, S.-S. (1997a) Preparation and release properties of biodegradable chitin microcapsules: I. Preparation of 6-mercaptopurine microcapsules by phase separation methods., J. Microencapsulation., 14(1), 15-25.
Mi, F.-L., Tseng, Y.-C., Chen, C.-T. and Shyu, S.-S. (1997b) Preparation and release properties of biodegradable chitin microcapsules: II. Sustained release of 6-mercaptopurine from chitin microcapsules., J. Microencapsulation., 14(2), 211-233.
Nack, H. (1970) Microencapsulation techniques, application and problems., J. Soc. Cosmetic Chemists., 21, 85-98.
Ott, E., Spurlin, H. M., and Grafflin, M.W (editors), Cellulose and Cellulose Derivatives Part III, Interscience Publishers, New York, 1955.
Qurashi, M.T., Blair, H.S. and Allen, S.J. (1992) Studies on modified chitosan membranes. I. Preparation and characterisation., J. App. Poly. Sci., 46, 255-261.
Roberson, J.A. and Crowe, C.T., Engineering Fluid Mechanics, 5th Ed., Houghton Mifflin, Boston, 1993.
Skujins, J. J., Potgieter, H. J. and Alexander, M. (1965) Dissolution of fungal cell walls by a streptomycete chitinase and β-(1→3) glucanase. Archives of Biochemistry and Biophysics, 111, 358-364.
Terbojevich, M., Carraro, C., Cosani, A. , and Marsano, E. (1988) Solution Studies of the Chitin-Lithium Chloride-N,N-dimethylacetamide System., Carbohydrate Research, 180, 73-86.
Thies, C. (1987) Microencapsulation., In Encyclopedia of Polymer Science and Engineering, 2nd. ed., Vol. 9, John Wiley and Son, New York, 724-745.
Uragami, T., Ohsumi, Y. and Sugihara, M. (1981) Studies on syntheses and permeabilities of special polymer membranes: 35. Preparation and permeation characteristics of chitin membranes., Polymer., 22, 1155-1156.
Urbanczyk, G.W. and Lipp-Symonowicz, B. (1994) The influence of processing terms of chitosan membranes made of differently deacetylated chitin on the crystalline structure of membranes., J. App. Poly. Sci., 51, 2191-2194.
Microencapsulation of Prawn Feed Using Chitin References
Roderick Bain 36
Van Krevelen, D.W. (editor), Properties of Polymers: Their Correlation With Chemical Structure; Their Numerical Estimation and Prediction From Additive Group Contributions, Elsevier Science Publishers, Amsterdam, 1990.
Van Wazer, J.R. , Lyons, J.W., Kim, K.Y., and Colwell, R.E., Viscosity and Flow Measurement, Interscience Publishers, New York, 1963.
Vincendon, M. (1985) 1H NMR study of the chitin dissolution mechanism, Makromol.
Chem., 186, 1787-1795.
Microencapsulation of Prawn Feed Using Chitin Appendices
Roderick Bain 37
APPENDICES
Microencapsulation of Prawn Feed Using Chitin Appendix 1
Roderick Bain 38
APPENDIX 1 - EXPERIMENTAL PROCEDURES
Preparation of Chitin Solution
1. Add X g of lithium chloride to Y mL of DMAC (ie. X/Y% w/v) in glass bowl.
2. Begin heating of DMAc-LiCl to 120oC.
Place glass lid, impeller, thermometer and condenser in the appropriate positions.
Commence mechanical stirring at an appropriate speed so that there is no formation
of a vortex but all of the contents of the vessel are well mixed.
Turn on cooling water and adjust to the desired flow.
3. Adjust heater as required to obtain 120oC ± 2oC.
4. Once desired temperature has been attained and all LiCl is dissolved, add Z g of
chitin to DMAC-LiCl solution (ie. Z/Y% w/v).
5. Leave for 4 hours with continued monitoring of the temperature and cooling water
flow (approx. every 30 min).
6. Turn of mixer and heater.
7. Allow to cool to approx. 50oC.
Turn off cooling water.
8. Transfer chitin solution to glass bottles.

Microencapsulation of Prawn Feed Using Chitin Appendix 1
Roderick Bain 39
Procedure for the Microencapsulation of Lysine
1. Dissolve the required amount of lysine in the quantity of water required to produce
approximately a 66% w/v solution by placing in a plastic sample bottle and shaking
until all lysine has dissolved. Note: 66% was roughly determined to be the
saturation limit of lysine in water, and is used as it is desirable to add the least
amount of water possible to the chitin solution.
2. Add 100 mL of chitin solution to a 250 mL glass beaker and magnetically stir at a
speed that just prevents a vortex from forming.
3. Slowly add the lysine-water solution to the chitin solution while being stirred.
4. Transfer the resulting solution to a glass bottle.
5. Place 100 mL of acetone into each of 2 beakers.
6. Using the standard spray nozzle from a water spray bottle, spray approximately 50
mL of the chitin-lysine solution into each beaker.
7. Transfer the solution to appropriate tubes for centrifugation and balance the tubes
appropriately.
8. Place the tubes in the centrifuge at 2500 rpm for 5 minutes (longer if required).
9. Decant the solution from each tube and rinse the solidified spheres left in the tube
with approx. 50 mL of acetone.
10. Depending on the method of drying to be used either leave the microcapsules in the
acetone or centrifuge and decant again.
Note: Steps 6-10 should not result in the microcapsules remaining in acetone for more than
1.5 hours

Microencapsulation of Prawn Feed Using Chitin Appendix 1
Roderick Bain 40
Preparation of Regenerated Chitin from Chitin/DMAc/LiCl Solutions
Regenerated chitin (i.e. the chitin that would form the capsule wall of the microcapsules) can
be obtained as follows:
1. To 100 mL of acetone add 50 mL of chitin solution via a standard needle.
2. Transfer the solution to appropriate tubes for centrifugation and balance the tubes
appropriately.
3. Place the tubes in the centrifuge at 2500 rpm for 5 minutes (longer if required).
4. Decant the solution from each tube and rinse the solids left in the tube with
approx. 50 mL of acetone.
5. Centrifuge and decant again.
6. Dry further by blowing dry compressed air over the solids.
7. Place in glass desiccator containing silica gel.
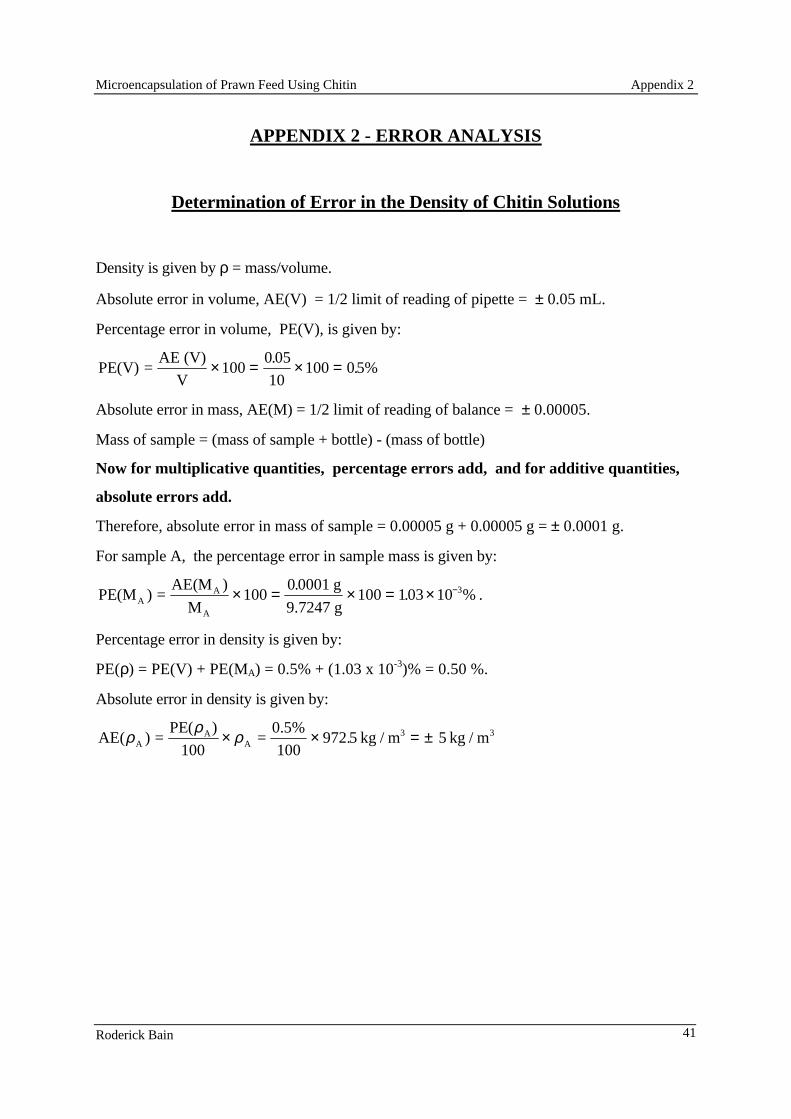
Microencapsulation of Prawn Feed Using Chitin Appendix 2
Roderick Bain 41
APPENDIX 2 - ERROR ANALYSIS
Determination of Error in the Density of Chitin Solutions
Density is given by ρ = mass/volume.
Absolute error in volume, AE(V) = 1/2 limit of reading of pipette = ± 0.05 mL.
Percentage error in volume, PE(V), is given by:
PE(V) =AE (V)
V× = × =100
0 05
10100 05%
..
Absolute error in mass, AE(M) = 1/2 limit of reading of balance = ± 0.00005.
Mass of sample = (mass of sample + bottle) - (mass of bottle)
Now for multiplicative quantities, percentage errors add, and for additive quantities,
absolute errors add.
Therefore, absolute error in mass of sample = 0.00005 g + 0.00005 g = ± 0.0001 g.
For sample A, the percentage error in sample mass is given by:
PE(M ) =AE(M )
M
g
9.7247 gAA
A
× = × = × −1000 0001
100 103 103.. % .
Percentage error in density is given by:
PE(ρ) = PE(V) + PE(MA) = 0.5% + (1.03 x 10⁻³)% = 0.50 %.
Absolute error in density is given by:
AE( ) =PE( )
100=
0.5%
100 kg / m kg / mA
AA
3 3ρ ρ ρ× × = ±972 5 5.
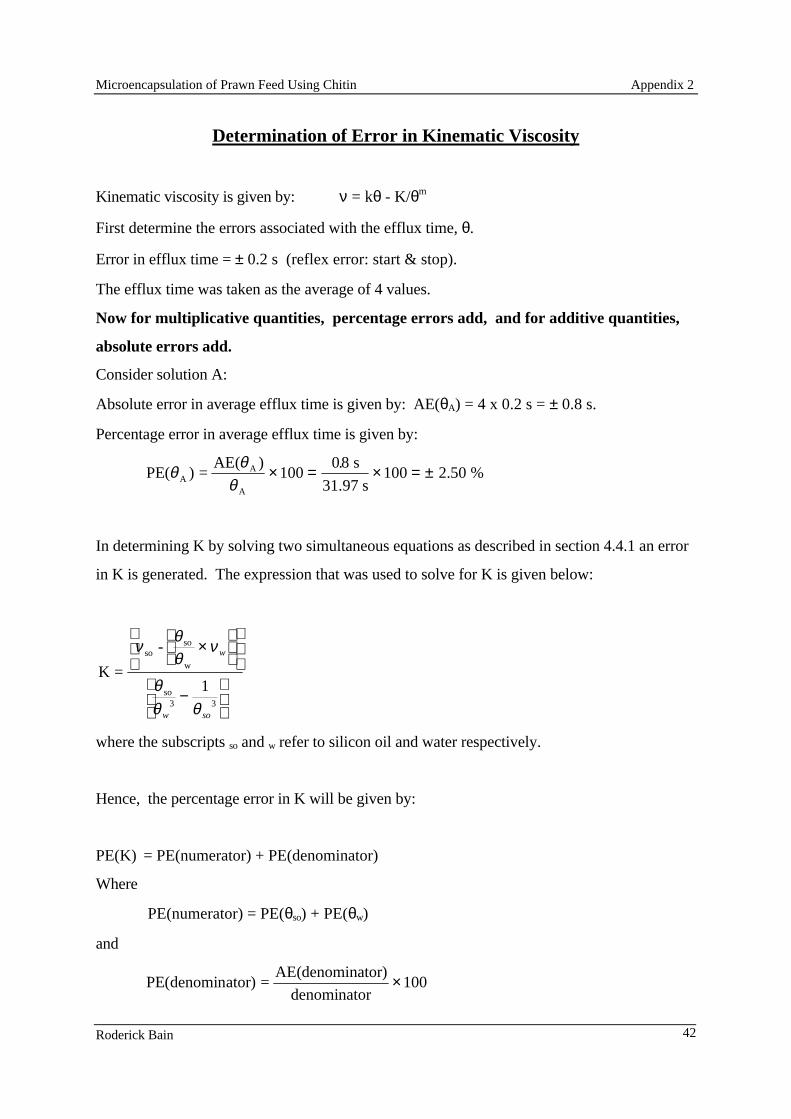
Microencapsulation of Prawn Feed Using Chitin Appendix 2
Roderick Bain 42
Determination of Error in Kinematic Viscosity
Kinematic viscosity is given by: ν = kθ - K/θm
First determine the errors associated with the efflux time, θ.
Error in efflux time = ± 0.2 s (reflex error: start & stop).
The efflux time was taken as the average of 4 values.
Now for multiplicative quantities, percentage errors add, and for additive quantities,
absolute errors add.
Consider solution A:
Absolute error in average efflux time is given by: AE(θA) = 4 x 0.2 s = ± 0.8 s.
Percentage error in average efflux time is given by:
PE( ) =AE( ) s
31.97 s 2.50 %A
A
A
θ θθ
× = × = ±10008
100.
In determining K by solving two simultaneous equations as described in section 4.4.1 an error
in K is generated. The expression that was used to solve for K is given below:
K =
-soso
w
so
ν θθ
ν
θθ θ
×
−
w
w so3 3
1
where the subscripts so and w refer to silicon oil and water respectively.
Hence, the percentage error in K will be given by:
PE(K) = PE(numerator) + PE(denominator)
Where
PE(numerator) = PE(θso) + PE(θw)
and
PE(denominator) =AE(denominator)
denominator× 100
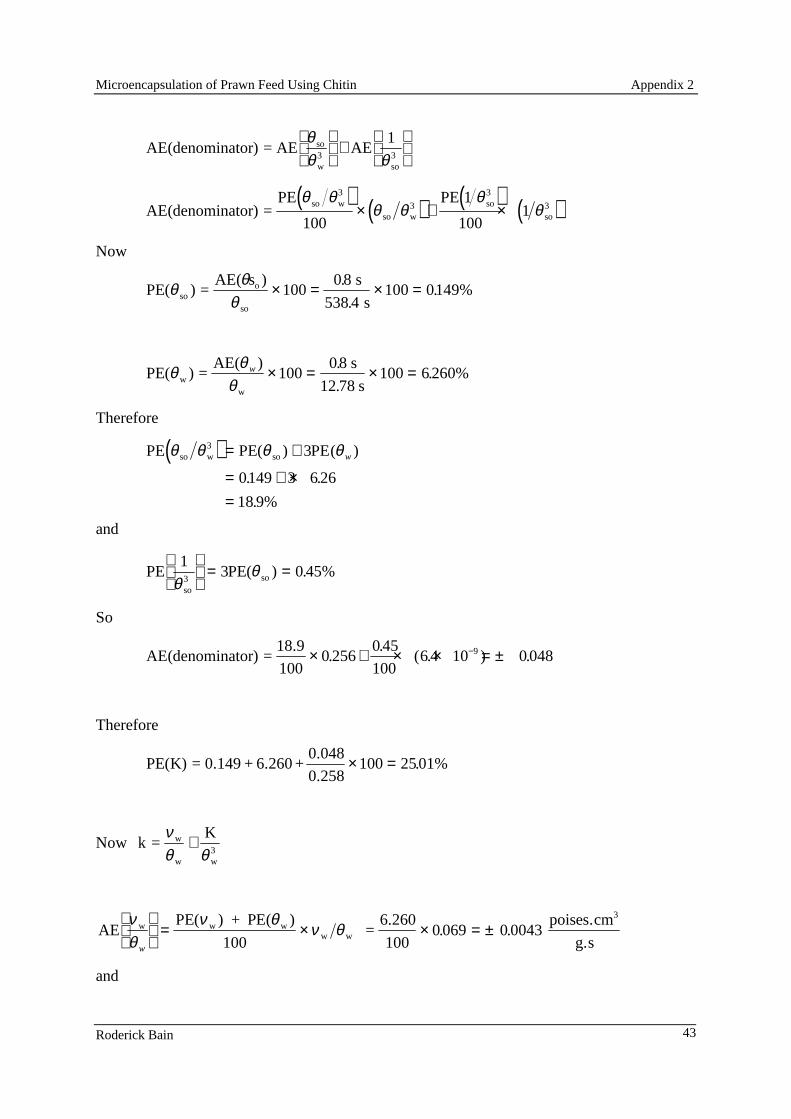
Microencapsulation of Prawn Feed Using Chitin Appendix 2
Roderick Bain 43
AE(denominator) = AE AE1so
w3
so3
θθ θ
+
( ) ( ) ( ) ( )AE(denominator) =PE
100
PE 11
so w3
so w3 so
3
so3
θ θθ θ
θθ× + ×
100
Now
PE( ) =AE( s ) s
ssoo
so
θ θθ
× = × =10008
538 4100 0149%
.
..
PE( ) =AE( ) s
sww
θ θθ
w × = × =10008
12 78100 6 260%
.
..
Therefore
( )PE PE( PEso w3
soθ θ θ θ= +
= + ×=
) ( )
. .
.
3
0149 3 6 26
18 9%
w
and
PE1
PE(so3 soθ
θ
= =3 0 45%) .
So
AE(denominator) =18.9
100 × + × × = ±−0 256
0 45
1006 4 10 0 0489.
.( . ) .
Therefore
PE(K) = 0.149 + 6.260 +0.048
0.258× =100 2501%.
Now k =Kw
w w3
νθ θ
+
AEPE( ) + PE( )
=6.260
100
poises.cm
g.sw w w
w w
3νθ
ν θ ν θw
= × × = ±
1000 069 0 0043. .
and
Microencapsulation of Prawn Feed Using Chitin Appendix 2
Roderick Bain 44
AEK
=PE(K) + 3PE( )
K poises.cm
g.sw
ww3
3
θθ θ
3 100
258
1000 024 0 0062
× = × = ±.
. .
and AE(k) = AE + AEK
0.011poises.cm
g.sw
w w3
3νθ θ
= ±
For solution A:
AE(νA) = AE(kθA) + AE(K/θA2)
and
AE( ) =(PE(k) + PE( ))
100 k +
(PE(K) + 2PE( ))
100K
poises.cm
g
AA
AA
A2
3
ν θ θ θ θ× ×
=+
× ++
×
= ±
1184 2 50
1002 97
2501 500
1000 05
05
. ..
. ..
.
Microencapsulation of Prawn Feed Using Chitin Appendix 2
Roderick Bain 45
Determination of Error in Absolute Viscosity
Absolute viscosity is given by η = ρν.
For multiplicative quantities, percentage errors add.
Consider solution A:
PE(η) = PE(ρ) + PE(ν)
where
PE( ) =AE( )
AA
A
ν νν
×
= ×
=
100
05
2 919100
171%
.
..
and
PE(ρA) = 0.5% (calculated previously)
Therefore
PE(ηA) = 17.6%
So
AE( ) =PE( )
100 Pa.sA
AAη η η× = × × = ± ×− −17 6
1002 89 10 50 103 4.
( . ) .

Microencapsulation of Prawn Feed Using Chitin Appendix 2
Roderick Bain 46
Determination of Error in Average Concentration
Concentration is given as the average of the following two expressions:
C =K
η
14
and C =K
η
14 5.
For multiplicative quantities, percentage errors add.
Consider the first expression applied to solution A:
PE(C ) =1
4PE( ) +
1
4PE(K)
=1
4
AE( ) 1
4PE(K)
A A
A
A
η
ηη
×
+100
Now K was obtained by reading C and η from Figure 4-6. The error in reading C was
eliminated by using the highest value of C (i.e.9.8%) which lay on the end line of the graph.
Hence the only error is from reading η.
Absolute error in η = 1/2 limit of reading on the axis = 10 Pa.s
Therefore,
PE( ) =AE( )η η
η× = × =100
10
100100 10%
Now PE(K) = PE(η) + PE(C) = 10 + 0 = 10%.
So
PE(CA) =1
4
( . )
( . ).
50 10
2 89 10100
1
410 683%
4
3
××
×
+ × =
−
−
and
AE(C ) =PE(C )
100 C =
6.83
100 0.055 A
AA× × = ±081.
Applying the same procedure to the expression with an exponent of 1/4.5 yields
AE(CA) = ± 0.049
Microencapsulation of Prawn Feed Using Chitin Appendix 2
Roderick Bain 47
The final error is obtained due to the averaging of the values for CA calculated using the
different exponents (i.e 1/4 and 1/4.5).
When averaging, the quantities for which errors exist are being added. So absolute
errors add.
AE(CA) = 0.055 + 0.049 = 0.10 w/w%
Microencapsulation of Prawn Feed Using Chitin Appendix 2
Roderick Bain 48
Determination of Error in Moisture Uptake
Moisture uptake is given by: MU (%) =(m - m )
(m - m )sb b t
sb b to
× 100
Now for multiplicative quantities, percentage errors add, and for additive quantities,
absolute errors add.
Absolute error in Msb and Mb = 1/2 limit of reading of balance = ± 0.00005 g
Therefore,
absolute error in the numerator = absolute error in the denominator = ± 0.0001 g
Consider sample B after 1 hour:
PE(MU) = PE(M - M ) + PE(M - M )
=AE(M - M )
(M - M )
AE(M - M )
(M - M )
sb b t sb b to
sb b t
sb b t
sb b to
sb b to
× + ×
= × + ×
=
100 100
0 0001
0 0138100
0 0001
0 0115100
159%
.
.
.
..
AE(MU) =PE(MU)
100MU
=1.59
100
×
×
=
20%
0 32%.
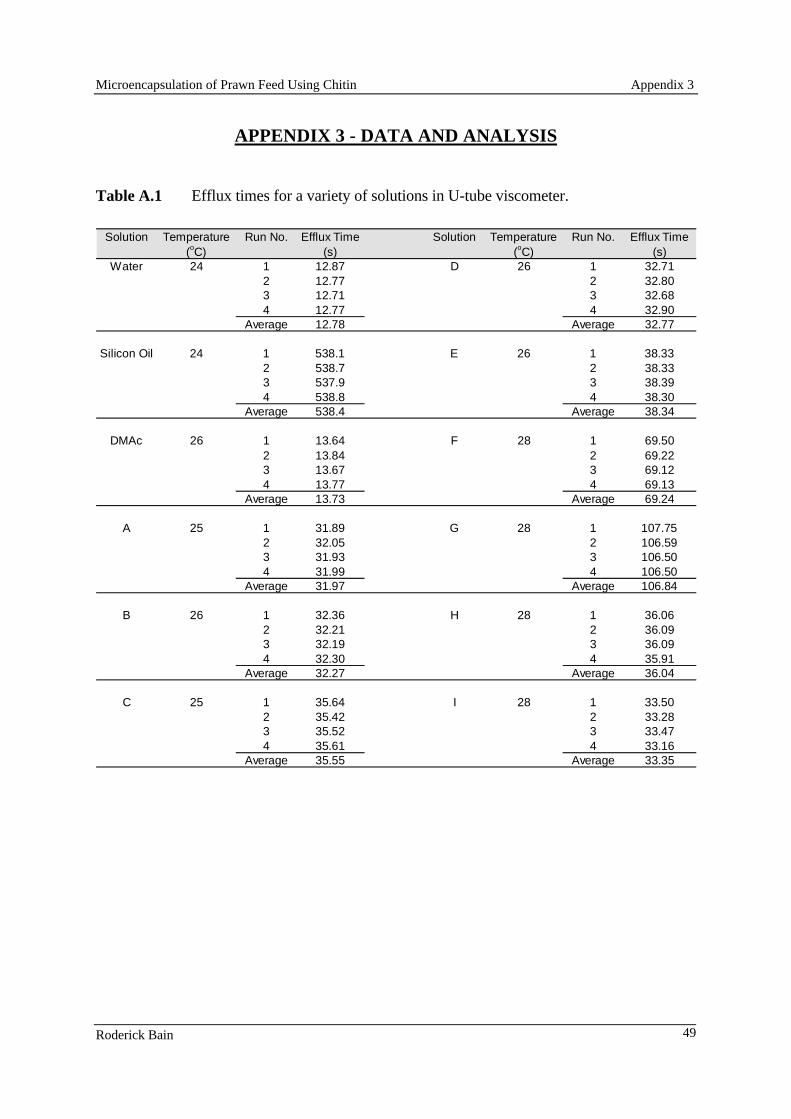
Microencapsulation of Prawn Feed Using Chitin Appendix 3
Roderick Bain 49
APPENDIX 3 - DATA AND ANALYSIS
Table A.1 Efflux times for a variety of solutions in U-tube viscometer.
Solution Temperature Run No. Efflux Time Solution Temperature Run No. Efflux Time(oC) (s) (oC) (s)
Water 24 1 12.87 D 26 1 32.712 12.77 2 32.803 12.71 3 32.684 12.77 4 32.90
Average 12.78 Average 32.77
Silicon Oil 24 1 538.1 E 26 1 38.332 538.7 2 38.333 537.9 3 38.394 538.8 4 38.30
Average 538.4 Average 38.34
DMAc 26 1 13.64 F 28 1 69.502 13.84 2 69.223 13.67 3 69.124 13.77 4 69.13
Average 13.73 Average 69.24
A 25 1 31.89 G 28 1 107.752 32.05 2 106.593 31.93 3 106.504 31.99 4 106.50
Average 31.97 Average 106.84
B 26 1 32.36 H 28 1 36.062 32.21 2 36.093 32.19 3 36.094 32.30 4 35.91
Average 32.27 Average 36.04
C 25 1 35.64 I 28 1 33.502 35.42 2 33.283 35.52 3 33.474 35.61 4 33.16
Average 35.55 Average 33.35
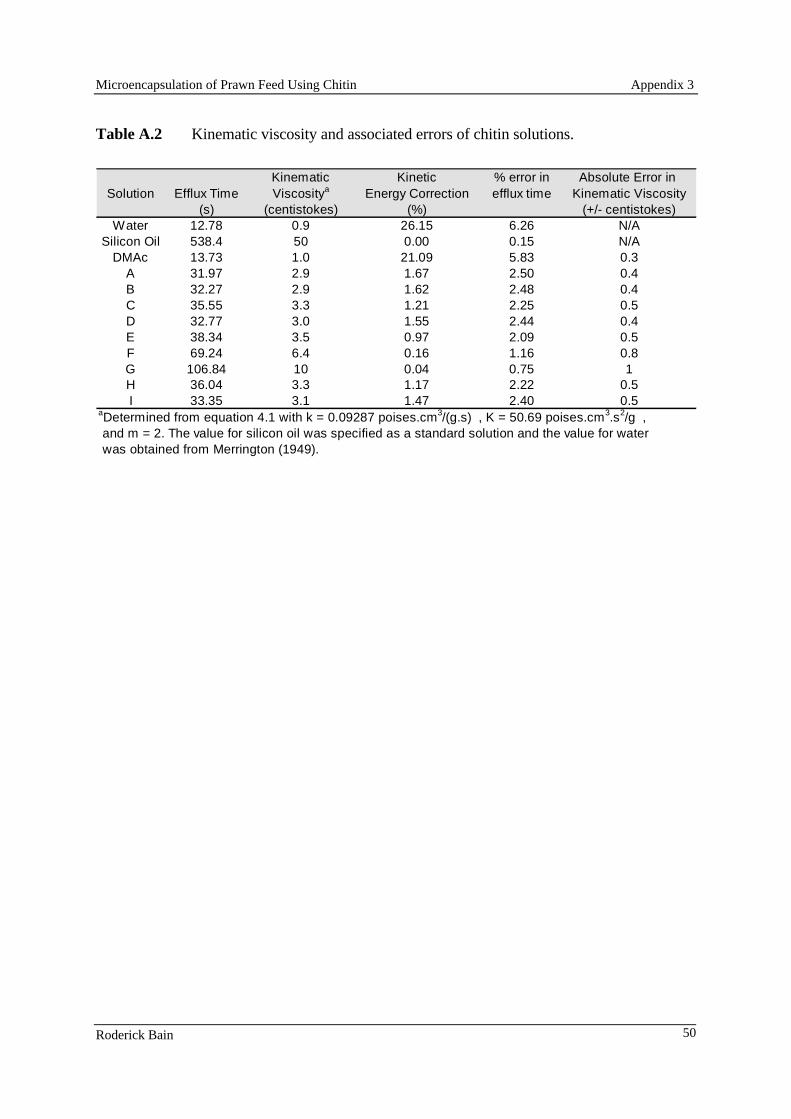
Microencapsulation of Prawn Feed Using Chitin Appendix 3
Roderick Bain 50
Table A.2 Kinematic viscosity and associated errors of chitin solutions.
Kinematic Kinetic % error in Absolute Error in Solution Efflux Time Viscositya Energy Correction efflux time Kinematic Viscosity
(s) (centistokes) (%) (+/- centistokes)Water 12.78 0.9 26.15 6.26 N/A
Silicon Oil 538.4 50 0.00 0.15 N/ADMAc 13.73 1.0 21.09 5.83 0.3
A 31.97 2.9 1.67 2.50 0.4B 32.27 2.9 1.62 2.48 0.4C 35.55 3.3 1.21 2.25 0.5D 32.77 3.0 1.55 2.44 0.4E 38.34 3.5 0.97 2.09 0.5F 69.24 6.4 0.16 1.16 0.8G 106.84 10 0.04 0.75 1H 36.04 3.3 1.17 2.22 0.5I 33.35 3.1 1.47 2.40 0.5
aDetermined from equation 4.1 with k = 0.09287 poises.cm3/(g.s) , K = 50.69 poises.cm3.s2/g , and m = 2. The value for silicon oil was specified as a standard solution and the value for water was obtained from Merrington (1949).
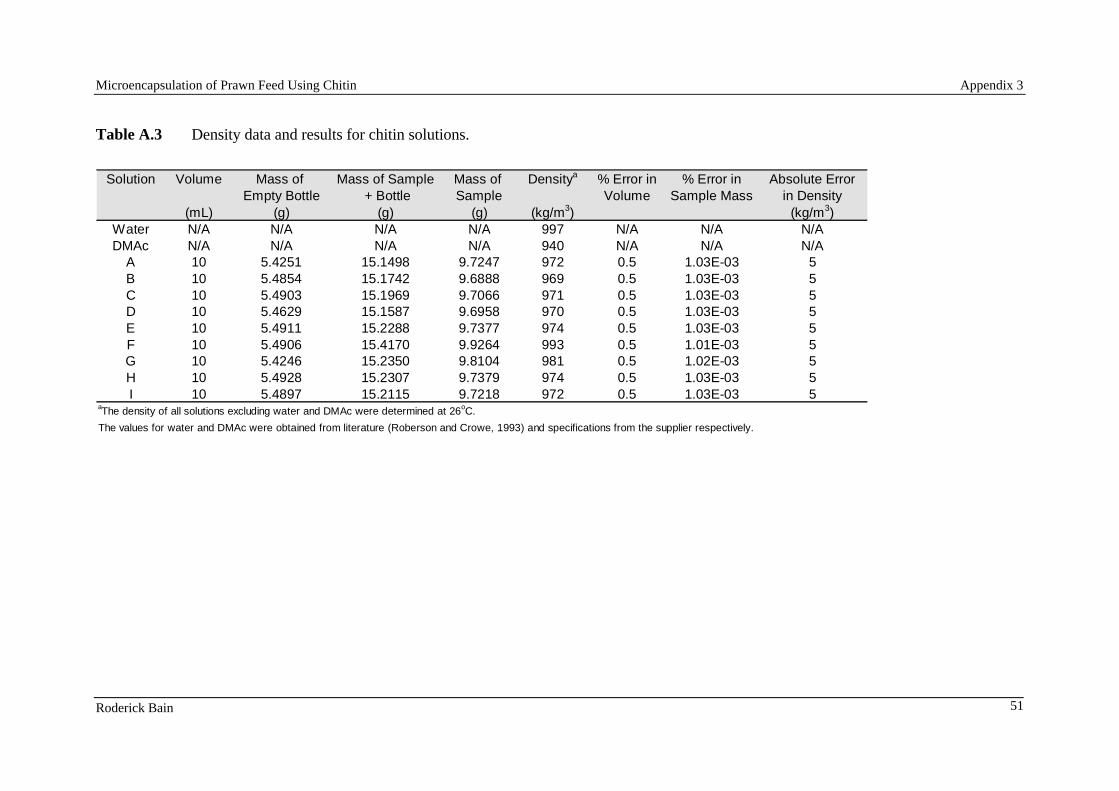
Microencapsulation of Prawn Feed Using Chitin Appendix 3
Roderick Bain 51
Table A.3 Density data and results for chitin solutions.
Solution Volume Mass of Mass of Sample Mass of Densitya % Error in % Error in Absolute ErrorEmpty Bottle + Bottle Sample Volume Sample Mass in Density
(mL) (g) (g) (g) (kg/m3) (kg/m3)Water N/A N/A N/A N/A 997 N/A N/A N/ADMAc N/A N/A N/A N/A 940 N/A N/A N/A
A 10 5.4251 15.1498 9.7247 972 0.5 1.03E-03 5B 10 5.4854 15.1742 9.6888 969 0.5 1.03E-03 5C 10 5.4903 15.1969 9.7066 971 0.5 1.03E-03 5D 10 5.4629 15.1587 9.6958 970 0.5 1.03E-03 5E 10 5.4911 15.2288 9.7377 974 0.5 1.03E-03 5F 10 5.4906 15.4170 9.9264 993 0.5 1.01E-03 5G 10 5.4246 15.2350 9.8104 981 0.5 1.02E-03 5H 10 5.4928 15.2307 9.7379 974 0.5 1.03E-03 5I 10 5.4897 15.2115 9.7218 972 0.5 1.03E-03 5
aThe density of all solutions excluding water and DMAc were determined at 26oC.
The values for water and DMAc were obtained from literature (Roberson and Crowe, 1993) and specifications from the supplier respectively.
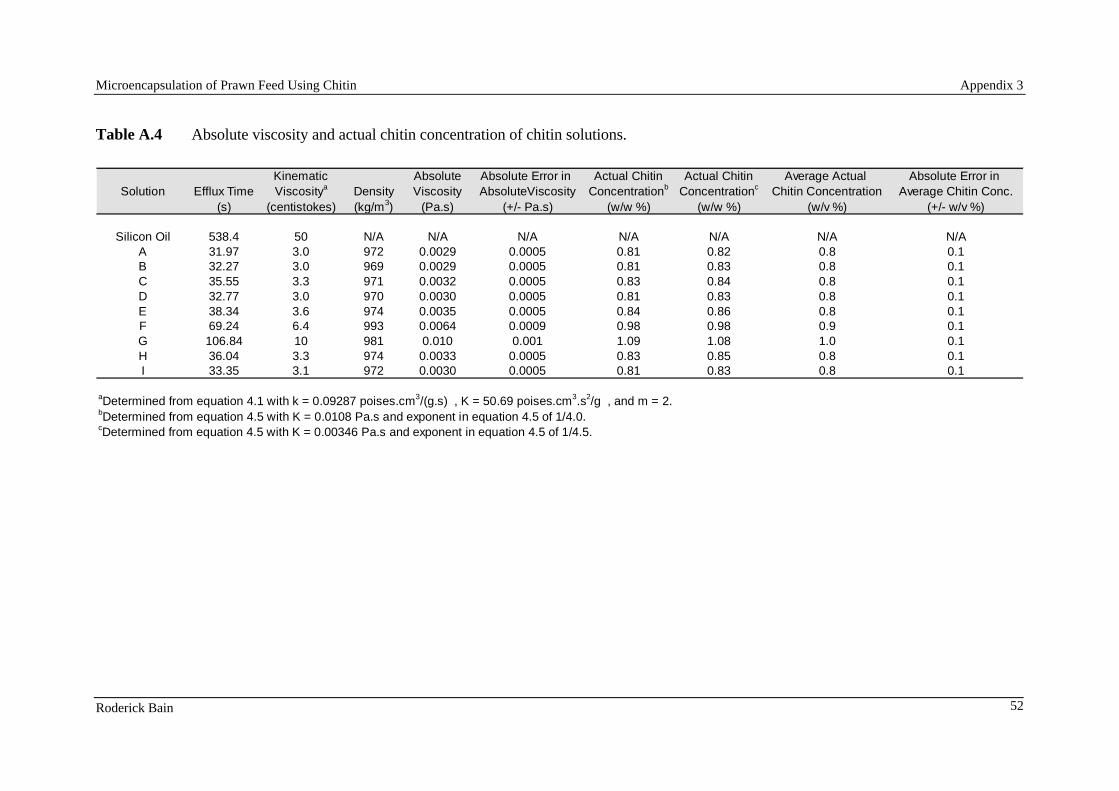
Microencapsulation of Prawn Feed Using Chitin Appendix 3
Roderick Bain 52
Table A.4 Absolute viscosity and actual chitin concentration of chitin solutions.
Kinematic Absolute Absolute Error in Actual Chitin Actual Chitin Average Actual Absolute Error in Solution Efflux Time Viscositya Density Viscosity AbsoluteViscosity Concentrationb Concentrationc Chitin Concentration Average Chitin Conc.
(s) (centistokes) (kg/m3) (Pa.s) (+/- Pa.s) (w/w %) (w/w %) (w/v %) (+/- w/v %)
Silicon Oil 538.4 50 N/A N/A N/A N/A N/A N/A N/AA 31.97 3.0 972 0.0029 0.0005 0.81 0.82 0.8 0.1B 32.27 3.0 969 0.0029 0.0005 0.81 0.83 0.8 0.1C 35.55 3.3 971 0.0032 0.0005 0.83 0.84 0.8 0.1D 32.77 3.0 970 0.0030 0.0005 0.81 0.83 0.8 0.1E 38.34 3.6 974 0.0035 0.0005 0.84 0.86 0.8 0.1F 69.24 6.4 993 0.0064 0.0009 0.98 0.98 0.9 0.1G 106.84 10 981 0.010 0.001 1.09 1.08 1.0 0.1H 36.04 3.3 974 0.0033 0.0005 0.83 0.85 0.8 0.1I 33.35 3.1 972 0.0030 0.0005 0.81 0.83 0.8 0.1
aDetermined from equation 4.1 with k = 0.09287 poises.cm3/(g.s) , K = 50.69 poises.cm3.s2/g , and m = 2.bDetermined from equation 4.5 with K = 0.0108 Pa.s and exponent in equation 4.5 of 1/4.0.cDetermined from equation 4.5 with K = 0.00346 Pa.s and exponent in equation 4.5 of 1/4.5.
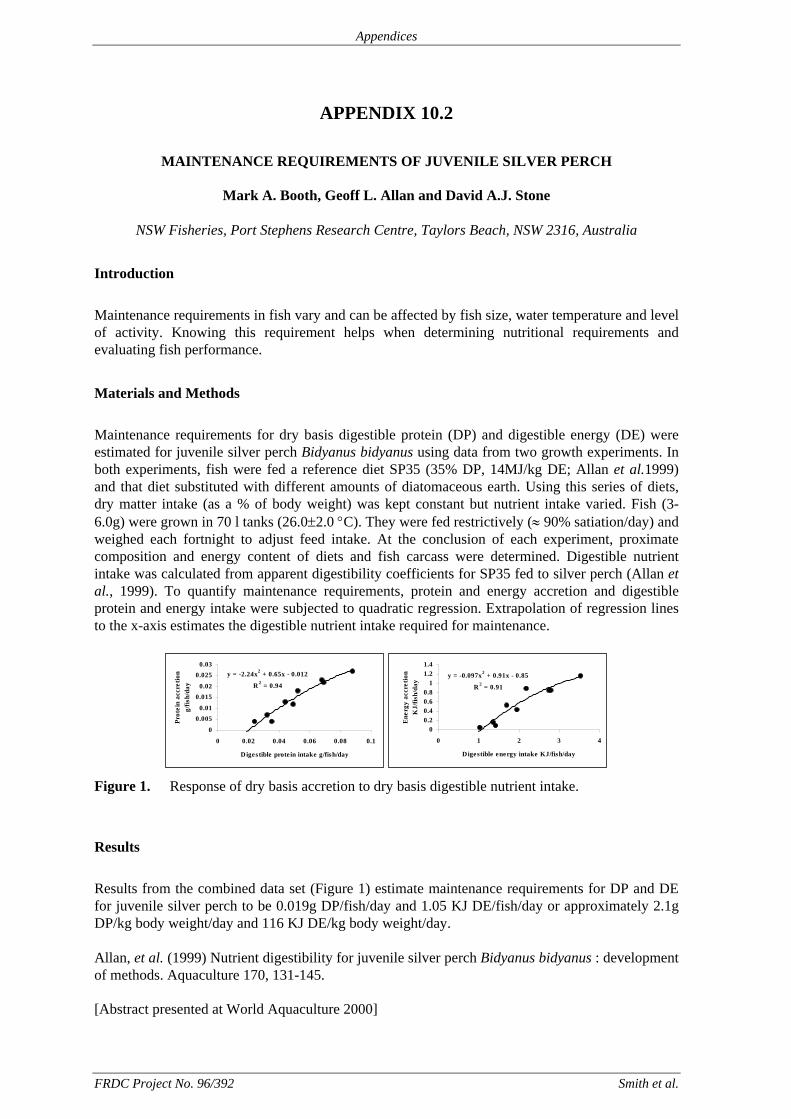
Appendices
APPENDIX 10.2
MAINTENANCE REQUIREMENTS OF JUVENILE SILVER PERCH
Mark A. Booth, Geoff L. Allan and David A.J. Stone
NSW Fisheries, Port Stephens Research Centre, Taylors Beach, NSW 2316, Australia
Introduction
Maintenance requirements in fish vary and can be affected by fish size, water temperature and level of activity. Knowing this requirement helps when determining nutritional requirements and evaluating fish performance.
Materials and Methods
Maintenance requirements for dry basis digestible protein (DP) and digestible energy (DE) were estimated for juvenile silver perch Bidyanus bidyanus using data from two growth experiments. In both experiments, fish were fed a reference diet SP35 (35% DP, 14MJ/kg DE; Allan et al.1999) and that diet substituted with different amounts of diatomaceous earth. Using this series of diets, dry matter intake (as a % of body weight) was kept constant but nutrient intake varied. Fish (3-6.0g) were grown in 70 l tanks (26.0±2.0 °C). They were fed restrictively (≈ 90% satiation/day) and weighed each fortnight to adjust feed intake. At the conclusion of each experiment, proximate composition and energy content of diets and fish carcass were determined. Digestible nutrient intake was calculated from apparent digestibility coefficients for SP35 fed to silver perch (Allan et al., 1999). To quantify maintenance requirements, protein and energy accretion and digestible protein and energy intake were subjected to quadratic regression. Extrapolation of regression lines to the x-axis estimates the digestible nutrient intake required for maintenance.
y = -2.24x2 + 0.65x - 0.012
R 2 = 0.94
0
0.0050.01
0.0150.02
0.0250.03
0 0.02 0.04 0.06 0.08 0.1
Digestible protein intake g/fish/day
Prot
ein
accr
etio
n g/
fish/
day
y = -0.097x2 + 0.91x - 0.85
R 2 = 0.91
00.20.40.60.8
11.21.4
0 1 2 3
Digestible energy intake KJ/fish/day
Ene
rgy
accr
etio
n K
J/fis
h/da
y
4
Figure 1. Response of dry basis accretion to dry basis digestible nutrient intake.
Results
Results from the combined data set (Figure 1) estimate maintenance requirements for DP and DE for juvenile silver perch to be 0.019g DP/fish/day and 1.05 KJ DE/fish/day or approximately 2.1g DP/kg body weight/day and 116 KJ DE/kg body weight/day. Allan, et al. (1999) Nutrient digestibility for juvenile silver perch Bidyanus bidyanus : development of methods. Aquaculture 170, 131-145. [Abstract presented at World Aquaculture 2000]
FRDC Project No. 96/392 Smith et al.
Appendices
APPENDIX 10.3
ASIAN SEABASS LATES CALCARIFER PERFORM WELL WHEN FEED PELLETED DIETS HIGH IN PROTEIN AND LIPID
Kevin C. Williams, Christopher G. Barlow, Les Rodgers, Ian Hockings, Clarita Agcopra, Ian Ruscoe Aquaculture 225 (2003) 191-206.
Smith et al. FRDC Project No. 96/392
www.elsevier.com/locate/aqua-online
Aquaculture 225 (2003) 191–206
Asian seabass Lates calcarifer perform
well when fed pelleted diets high in
protein and lipid
Kevin C. Williamsa,*, Christopher G. Barlowb,1, Les Rodgersb,Ian Hockingsb, Clarita Agcoprab, Ian Ruscoeb
aCSIRO Division of Marine Research, PO Box 120, Cleveland, Qld. 4163, AustraliabQueensland Department of Primary Industries, Walkamin Research Station, Walkamin, Qld. 4872, Australia
Abstract
Under controlled (28 jC and 12:12 photoperiod) freshwater recirculation conditions, two 48-tank
(180 l) experiments tested the hypothesis that the dietary crude protein (CP) specification for Asian
seabass could be reduced by increasing the dietary concentration of lipid. In Experiment 1, 384 fish
(230 g initial bodyweight) were fed air-dry extruded diets of 38%, 42.5%, 47.3% and 52% CP in
combination with lipid concentrations of 7.0%, 12.8% and 18.3% (12 diets) for 8 weeks. In
Experiment 2, 720 juvenile fish (80 g initial bodyweight) were fed for 6 weeks one of 12 air-dry diets
that varied in lipid between 11.5% and 22.4% and in protein between 43.8% and 64.7%. Air-dry feed
conversion ratio (FCR) and growth rate improved linearly with increasing dietary CP and improved
step-wise with increasing dietary lipid from 1.48 to 0.86 g/g and 2.69 to 4.86 g/day, respectively, in
Experiment 1 and similarly from 1.00 to 0.78 g/g and 2.27 to 3.10 g/day, respectively, in Experiment
2. In terms of growth rate and FCR, a small protein sparing effect of lipid was observed which was
more pronounced for the smaller fish (Experiment 2). Increasing dietary CP resulted in very little
change in the proportion of dietary N that was retained by the fish (35% to 42% in Experiment 1 and
25% to 31% in Experiment 2). In both experiments, retention of dietary gross energy improved as
dietary lipid increased, with fat deposition appearing to be a major component of this energy
conservation (total DM body lipid content increasing from 24.0% to 29.1% in Experiment 1 and
from 20.3% to 32.7% in Experiment 2). However, DM lean gain increased linearly with increasing
dietary CP over the range examined and was not influenced by the amount of lipid in the diet,
indicating that any protein sparing by lipid was due to increased body fat deposition. The results
show that productivity of Asian seabass can be markedly improved by increasing dietary protein and
0044-8486/03/$ - see front matter. Crown CopyrightD 2003 Published by Elsevier Science B.V. All rights reserved.
doi:10.1016/S0044-8486(03)00278-3
* Corresponding author. Tel.: +61-7-3826-7284; fax: +61-7-3826-7222.
E-mail address: [email protected] (K.C. Williams).1 Present address: Mekong River Commission, PO Box 1112, Phnom Penh, Cambodia.
K.C. Williams et al. / Aquaculture 225 (2003) 191–206192
lipid concentrations. However, Asian seabass appear to have only a limited capacity to use lipid as a
primary energy source. In this aspect, they differ markedly from salmonids.
Crown CopyrightD 2003 Published by Elsevier Science B.V. All rights reserved.
Keywords: Barramundi; Energy; Protein to energy; Fat; Body composition
1. Introduction
The nutrient requirements of Asian seabass are becoming more clearly defined but
considerable uncertainty still exists. For example, the optimal crude protein (CP)
specification of dry pelleted diets for juvenile Asian seabass has been reported to be
between 40% and 55% (Cuzon et al., 1990; Catacutan and Coloso, 1995; Boonyaratpalin,
1997) while the essential amino acid balance of the protein is less important when dietary
protein is used as the major source of energy for the fish (Williams et al., 2001). A similar
wide range in the dietary lipid concentration of 6% to 18% has been advocated (see
Boonyaratpalin, 1997). Some of this apparent variability in protein requirement may be
due to the sparing of protein by dietary lipid, a finding that has been well demonstrated
and universally adopted for the farming of salmonids (Cho and Kaushik, 1990; Einen and
Roem, 1997; Refstie et al., 2001).
As Asian seabass is also a strictly carnivorous fish, it could be expected to have a
similar propensity to ingest and utilise high lipid diets, thereby reducing the amount of
dietary protein required to be oxidised as a source of energy, while enabling higher growth
rates to be achieved. However, pilot studies with Asian seabass fed low-protein, high-
energy diets (32% CP; 23% lipid) gave disappointing results and may have made the fish
more susceptible to disease (Williams and Barlow, unpublished data). What is not known
is whether Asian seabass can effectively use high-energy diets when CP is adequate (i.e.
maintaining or increasing the dietary protein to energy ratio) or whether they have a limit
on dietary energy content. Two experiments, one with plate-size fish and the other with
fingerlings, were carried out under controlled laboratory conditions to test the hypothesis
that the CP specification for Asian seabass can be reduced by increasing the dietary
concentration of lipid.
2. Materials and methods
2.1. Experimental design and diets
The effect of varying the dietary CP and lipid concentrations on the productivity and
nutrient retention responses of Asian seabass was examined in two growth experiments
with fish of two different sizes. It was anticipated that smaller fish would require higher
protein diets than larger fish (Steffens, 1989). A factorial comparison of three dietary lipid
(7%, 12.5% and 18%) and four CP (38%, 43%, 48% and 53%) concentrations was
examined in Experiment 1. Four replicate tanks of plate-size (230 g start weight) fish were
assigned to each dietary treatment. The experiment continued for 8 weeks. Changes in the
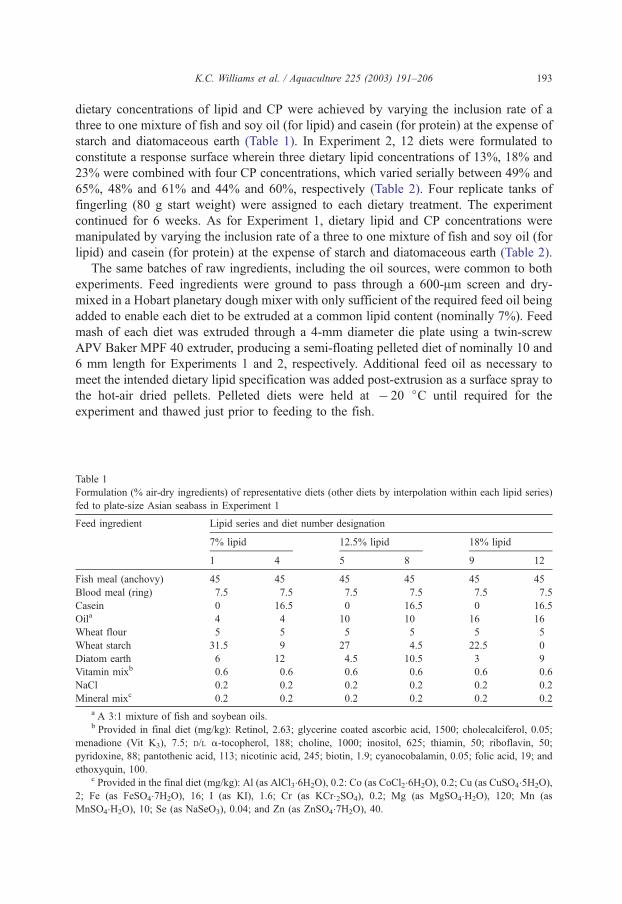
K.C. Williams et al. / Aquaculture 225 (2003) 191–206 193
dietary concentrations of lipid and CP were achieved by varying the inclusion rate of a
three to one mixture of fish and soy oil (for lipid) and casein (for protein) at the expense of
starch and diatomaceous earth (Table 1). In Experiment 2, 12 diets were formulated to
constitute a response surface wherein three dietary lipid concentrations of 13%, 18% and
23% were combined with four CP concentrations, which varied serially between 49% and
65%, 48% and 61% and 44% and 60%, respectively (Table 2). Four replicate tanks of
fingerling (80 g start weight) were assigned to each dietary treatment. The experiment
continued for 6 weeks. As for Experiment 1, dietary lipid and CP concentrations were
manipulated by varying the inclusion rate of a three to one mixture of fish and soy oil (for
lipid) and casein (for protein) at the expense of starch and diatomaceous earth (Table 2).
The same batches of raw ingredients, including the oil sources, were common to both
experiments. Feed ingredients were ground to pass through a 600-Am screen and dry-
mixed in a Hobart planetary dough mixer with only sufficient of the required feed oil being
added to enable each diet to be extruded at a common lipid content (nominally 7%). Feed
mash of each diet was extruded through a 4-mm diameter die plate using a twin-screw
APV Baker MPF 40 extruder, producing a semi-floating pelleted diet of nominally 10 and
6 mm length for Experiments 1 and 2, respectively. Additional feed oil as necessary to
meet the intended dietary lipid specification was added post-extrusion as a surface spray to
the hot-air dried pellets. Pelleted diets were held at � 20 jC until required for the
experiment and thawed just prior to feeding to the fish.
Table 1
Formulation (% air-dry ingredients) of representative diets (other diets by interpolation within each lipid series)
fed to plate-size Asian seabass in Experiment 1
Feed ingredient Lipid series and diet number designation
7% lipid 12.5% lipid 18% lipid
1 4 5 8 9 12
Fish meal (anchovy) 45 45 45 45 45 45
Blood meal (ring) 7.5 7.5 7.5 7.5 7.5 7.5
Casein 0 16.5 0 16.5 0 16.5
Oila 4 4 10 10 16 16
Wheat flour 5 5 5 5 5 5
Wheat starch 31.5 9 27 4.5 22.5 0
Diatom earth 6 12 4.5 10.5 3 9
Vitamin mixb 0.6 0.6 0.6 0.6 0.6 0.6
NaCl 0.2 0.2 0.2 0.2 0.2 0.2
Mineral mixc 0.2 0.2 0.2 0.2 0.2 0.2
a A 3:1 mixture of fish and soybean oils.b Provided in final diet (mg/kg): Retinol, 2.63; glycerine coated ascorbic acid, 1500; cholecalciferol, 0.05;
menadione (Vit K3), 7.5; D/L a-tocopherol, 188; choline, 1000; inositol, 625; thiamin, 50; riboflavin, 50;
pyridoxine, 88; pantothenic acid, 113; nicotinic acid, 245; biotin, 1.9; cyanocobalamin, 0.05; folic acid, 19; and
ethoxyquin, 100.c Provided in the final diet (mg/kg): Al (as AlCl3�6H2O), 0.2: Co (as CoCl2�6H2O), 0.2; Cu (as CuSO4�5H2O),
2; Fe (as FeSO4�7H2O), 16; I (as KI), 1.6; Cr (as KCr�2SO4), 0.2; Mg (as MgSO4�H2O), 120; Mn (as
MnSO4�H2O), 10; Se (as NaSeO3), 0.04; and Zn (as ZnSO4�7H2O), 40.
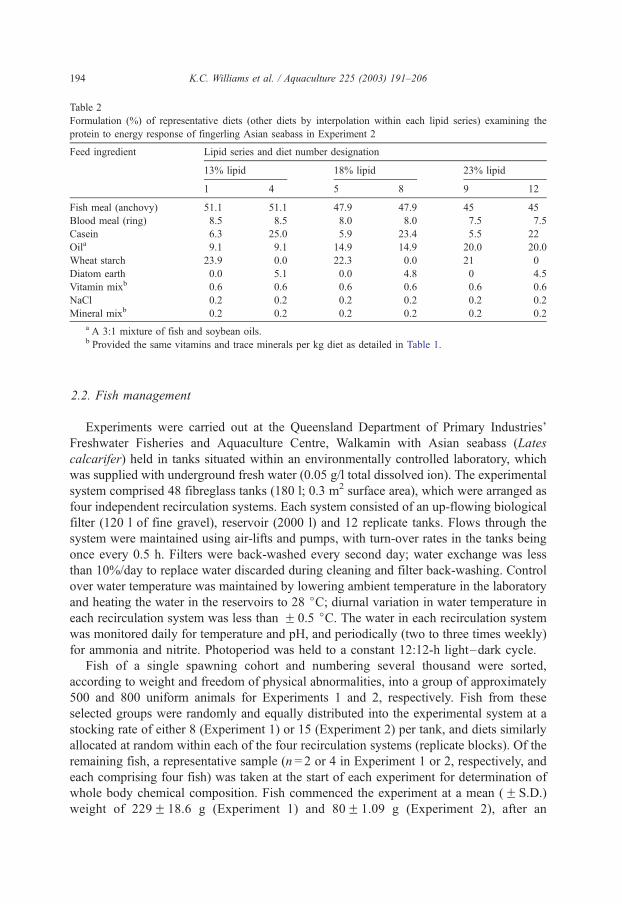
Table 2
Formulation (%) of representative diets (other diets by interpolation within each lipid series) examining the
protein to energy response of fingerling Asian seabass in Experiment 2
Feed ingredient Lipid series and diet number designation
13% lipid 18% lipid 23% lipid
1 4 5 8 9 12
Fish meal (anchovy) 51.1 51.1 47.9 47.9 45 45
Blood meal (ring) 8.5 8.5 8.0 8.0 7.5 7.5
Casein 6.3 25.0 5.9 23.4 5.5 22
Oila 9.1 9.1 14.9 14.9 20.0 20.0
Wheat starch 23.9 0.0 22.3 0.0 21 0
Diatom earth 0.0 5.1 0.0 4.8 0 4.5
Vitamin mixb 0.6 0.6 0.6 0.6 0.6 0.6
NaCl 0.2 0.2 0.2 0.2 0.2 0.2
Mineral mixb 0.2 0.2 0.2 0.2 0.2 0.2
a A 3:1 mixture of fish and soybean oils.b Provided the same vitamins and trace minerals per kg diet as detailed in Table 1.
K.C. Williams et al. / Aquaculture 225 (2003) 191–206194
2.2. Fish management
Experiments were carried out at the Queensland Department of Primary Industries’
Freshwater Fisheries and Aquaculture Centre, Walkamin with Asian seabass (Lates
calcarifer) held in tanks situated within an environmentally controlled laboratory, which
was supplied with underground fresh water (0.05 g/l total dissolved ion). The experimental
system comprised 48 fibreglass tanks (180 l; 0.3 m2 surface area), which were arranged as
four independent recirculation systems. Each system consisted of an up-flowing biological
filter (120 l of fine gravel), reservoir (2000 l) and 12 replicate tanks. Flows through the
system were maintained using air-lifts and pumps, with turn-over rates in the tanks being
once every 0.5 h. Filters were back-washed every second day; water exchange was less
than 10%/day to replace water discarded during cleaning and filter back-washing. Control
over water temperature was maintained by lowering ambient temperature in the laboratory
and heating the water in the reservoirs to 28 jC; diurnal variation in water temperature in
each recirculation system was less than F 0.5 jC. The water in each recirculation system
was monitored daily for temperature and pH, and periodically (two to three times weekly)
for ammonia and nitrite. Photoperiod was held to a constant 12:12-h light–dark cycle.
Fish of a single spawning cohort and numbering several thousand were sorted,
according to weight and freedom of physical abnormalities, into a group of approximately
500 and 800 uniform animals for Experiments 1 and 2, respectively. Fish from these
selected groups were randomly and equally distributed into the experimental system at a
stocking rate of either 8 (Experiment 1) or 15 (Experiment 2) per tank, and diets similarly
allocated at random within each of the four recirculation systems (replicate blocks). Of the
remaining fish, a representative sample (n = 2 or 4 in Experiment 1 or 2, respectively, and
each comprising four fish) was taken at the start of each experiment for determination of
whole body chemical composition. Fish commenced the experiment at a mean (F S.D.)
weight of 229F 18.6 g (Experiment 1) and 80F 1.09 g (Experiment 2), after an
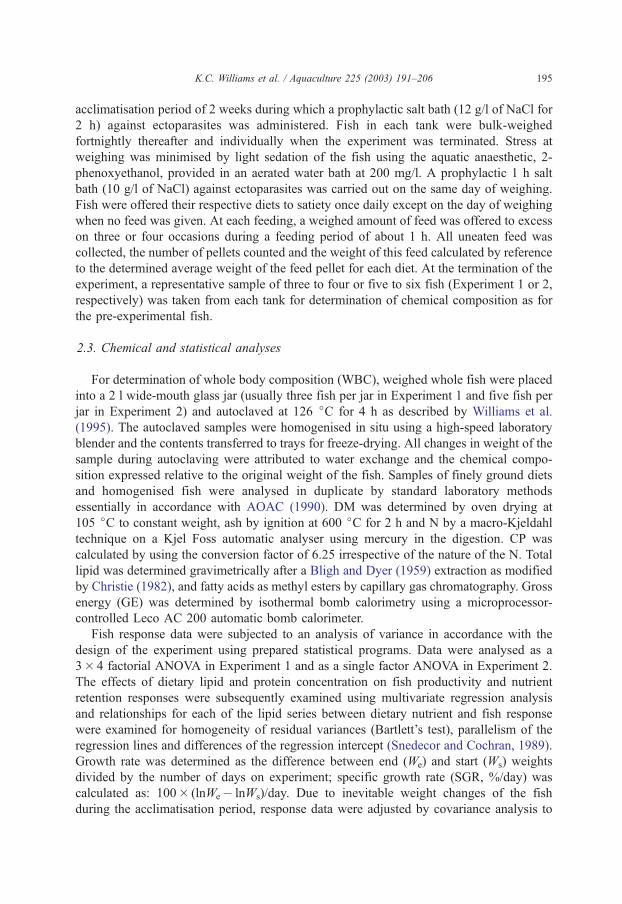
K.C. Williams et al. / Aquaculture 225 (2003) 191–206 195
acclimatisation period of 2 weeks during which a prophylactic salt bath (12 g/l of NaCl for
2 h) against ectoparasites was administered. Fish in each tank were bulk-weighed
fortnightly thereafter and individually when the experiment was terminated. Stress at
weighing was minimised by light sedation of the fish using the aquatic anaesthetic, 2-
phenoxyethanol, provided in an aerated water bath at 200 mg/l. A prophylactic 1 h salt
bath (10 g/l of NaCl) against ectoparasites was carried out on the same day of weighing.
Fish were offered their respective diets to satiety once daily except on the day of weighing
when no feed was given. At each feeding, a weighed amount of feed was offered to excess
on three or four occasions during a feeding period of about 1 h. All uneaten feed was
collected, the number of pellets counted and the weight of this feed calculated by reference
to the determined average weight of the feed pellet for each diet. At the termination of the
experiment, a representative sample of three to four or five to six fish (Experiment 1 or 2,
respectively) was taken from each tank for determination of chemical composition as for
the pre-experimental fish.
2.3. Chemical and statistical analyses
For determination of whole body composition (WBC), weighed whole fish were placed
into a 2 l wide-mouth glass jar (usually three fish per jar in Experiment 1 and five fish per
jar in Experiment 2) and autoclaved at 126 jC for 4 h as described by Williams et al.
(1995). The autoclaved samples were homogenised in situ using a high-speed laboratory
blender and the contents transferred to trays for freeze-drying. All changes in weight of the
sample during autoclaving were attributed to water exchange and the chemical compo-
sition expressed relative to the original weight of the fish. Samples of finely ground diets
and homogenised fish were analysed in duplicate by standard laboratory methods
essentially in accordance with AOAC (1990). DM was determined by oven drying at
105 jC to constant weight, ash by ignition at 600 jC for 2 h and N by a macro-Kjeldahl
technique on a Kjel Foss automatic analyser using mercury in the digestion. CP was
calculated by using the conversion factor of 6.25 irrespective of the nature of the N. Total
lipid was determined gravimetrically after a Bligh and Dyer (1959) extraction as modified
by Christie (1982), and fatty acids as methyl esters by capillary gas chromatography. Gross
energy (GE) was determined by isothermal bomb calorimetry using a microprocessor-
controlled Leco AC 200 automatic bomb calorimeter.
Fish response data were subjected to an analysis of variance in accordance with the
design of the experiment using prepared statistical programs. Data were analysed as a
3� 4 factorial ANOVA in Experiment 1 and as a single factor ANOVA in Experiment 2.
The effects of dietary lipid and protein concentration on fish productivity and nutrient
retention responses were subsequently examined using multivariate regression analysis
and relationships for each of the lipid series between dietary nutrient and fish response
were examined for homogeneity of residual variances (Bartlett’s test), parallelism of the
regression lines and differences of the regression intercept (Snedecor and Cochran, 1989).
Growth rate was determined as the difference between end (We) and start (Ws) weights
divided by the number of days on experiment; specific growth rate (SGR, %/day) was
calculated as: 100� (lnWe� lnWs)/day. Due to inevitable weight changes of the fish
during the acclimatisation period, response data were adjusted by covariance analysis to
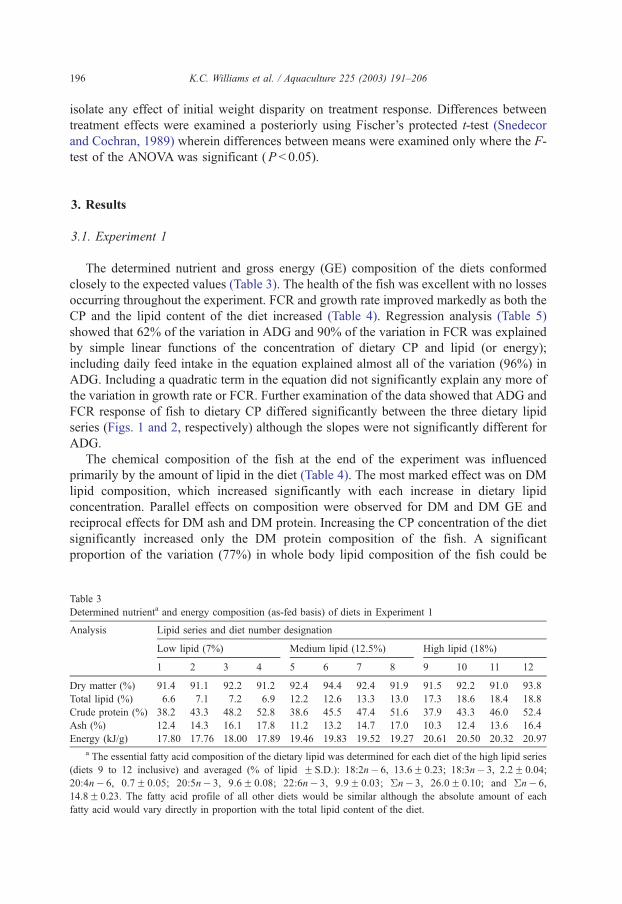
K.C. Williams et al. / Aquaculture 225 (2003) 191–206196
isolate any effect of initial weight disparity on treatment response. Differences between
treatment effects were examined a posteriorly using Fischer’s protected t-test (Snedecor
and Cochran, 1989) wherein differences between means were examined only where the F-
test of the ANOVA was significant (P < 0.05).
3. Results
3.1. Experiment 1
The determined nutrient and gross energy (GE) composition of the diets conformed
closely to the expected values (Table 3). The health of the fish was excellent with no losses
occurring throughout the experiment. FCR and growth rate improved markedly as both the
CP and the lipid content of the diet increased (Table 4). Regression analysis (Table 5)
showed that 62% of the variation in ADG and 90% of the variation in FCR was explained
by simple linear functions of the concentration of dietary CP and lipid (or energy);
including daily feed intake in the equation explained almost all of the variation (96%) in
ADG. Including a quadratic term in the equation did not significantly explain any more of
the variation in growth rate or FCR. Further examination of the data showed that ADG and
FCR response of fish to dietary CP differed significantly between the three dietary lipid
series (Figs. 1 and 2, respectively) although the slopes were not significantly different for
ADG.
The chemical composition of the fish at the end of the experiment was influenced
primarily by the amount of lipid in the diet (Table 4). The most marked effect was on DM
lipid composition, which increased significantly with each increase in dietary lipid
concentration. Parallel effects on composition were observed for DM and DM GE and
reciprocal effects for DM ash and DM protein. Increasing the CP concentration of the diet
significantly increased only the DM protein composition of the fish. A significant
proportion of the variation (77%) in whole body lipid composition of the fish could be
Table 3
Determined nutrienta and energy composition (as-fed basis) of diets in Experiment 1
Analysis Lipid series and diet number designation
Low lipid (7%) Medium lipid (12.5%) High lipid (18%)
1 2 3 4 5 6 7 8 9 10 11 12
Dry matter (%) 91.4 91.1 92.2 91.2 92.4 94.4 92.4 91.9 91.5 92.2 91.0 93.8
Total lipid (%) 6.6 7.1 7.2 6.9 12.2 12.6 13.3 13.0 17.3 18.6 18.4 18.8
Crude protein (%) 38.2 43.3 48.2 52.8 38.6 45.5 47.4 51.6 37.9 43.3 46.0 52.4
Ash (%) 12.4 14.3 16.1 17.8 11.2 13.2 14.7 17.0 10.3 12.4 13.6 16.4
Energy (kJ/g) 17.80 17.76 18.00 17.89 19.46 19.83 19.52 19.27 20.61 20.50 20.32 20.97
a The essential fatty acid composition of the dietary lipid was determined for each diet of the high lipid series
(diets 9 to 12 inclusive) and averaged (% of lipid F S.D.): 18:2n� 6, 13.6F 0.23; 18:3n� 3, 2.2F 0.04;
20:4n� 6, 0.7F 0.05; 20:5n� 3, 9.6F 0.08; 22:6n� 3, 9.9F 0.03; Sn� 3, 26.0F 0.10; and Sn� 6,
14.8F 0.23. The fatty acid profile of all other diets would be similar although the absolute amount of each
fatty acid would vary directly in proportion with the total lipid content of the diet.
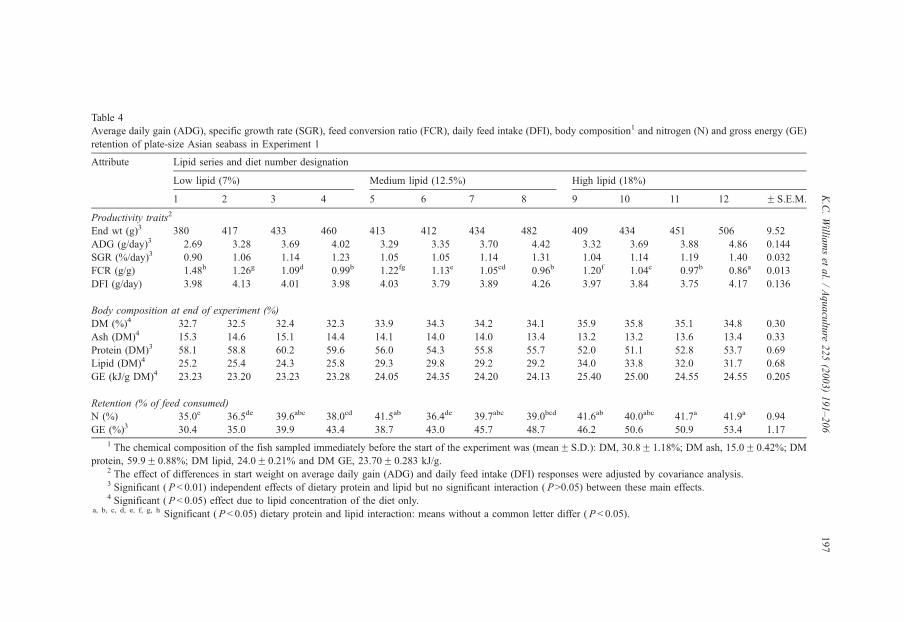
Table 4
Average daily gain (ADG), specific growth rate (SGR), feed conversion ratio (FCR), daily feed intake (DFI), body composition1 and nitrogen (N) and gross energy (GE)
retention of plate-size Asian seabass in Experiment 1
Attribute Lipid series and diet number designation
Low lipid (7%) Medium lipid (12.5%) High lipid (18%)
1 2 3 4 5 6 7 8 9 10 11 12 F S.E.M.
Productivity traits2
End wt (g)3 380 417 433 460 413 412 434 482 409 434 451 506 9.52
ADG (g/day)3 2.69 3.28 3.69 4.02 3.29 3.35 3.70 4.42 3.32 3.69 3.88 4.86 0.144
SGR (%/day)3 0.90 1.06 1.14 1.23 1.05 1.05 1.14 1.31 1.04 1.14 1.19 1.40 0.032
FCR (g/g) 1.48h 1.26g 1.09d 0.99b 1.22fg 1.13e 1.05cd 0.96b 1.20f 1.04c 0.97b 0.86a 0.013
DFI (g/day) 3.98 4.13 4.01 3.98 4.03 3.79 3.89 4.26 3.97 3.84 3.75 4.17 0.136
Body composition at end of experiment (%)
DM (%)4 32.7 32.5 32.4 32.3 33.9 34.3 34.2 34.1 35.9 35.8 35.1 34.8 0.30
Ash (DM)4 15.3 14.6 15.1 14.4 14.1 14.0 14.0 13.4 13.2 13.2 13.6 13.4 0.33
Protein (DM)3 58.1 58.8 60.2 59.6 56.0 54.3 55.8 55.7 52.0 51.1 52.8 53.7 0.69
Lipid (DM)4 25.2 25.4 24.3 25.8 29.3 29.8 29.2 29.2 34.0 33.8 32.0 31.7 0.68
GE (kJ/g DM)4 23.23 23.20 23.23 23.28 24.05 24.35 24.20 24.13 25.40 25.00 24.55 24.55 0.205
Retention (% of feed consumed)
N (%) 35.0e 36.5de 39.6abc 38.0cd 41.5ab 36.4de 39.7abc 39.0bcd 41.6ab 40.0abc 41.7a 41.9a 0.94
GE (%)3 30.4 35.0 39.9 43.4 38.7 43.0 45.7 48.7 46.2 50.6 50.9 53.4 1.17
1 The chemical composition of the fish sampled immediately before the start of the experiment was (meanF S.D.): DM, 30.8F 1.18%; DM ash, 15.0F 0.42%; DM
protein, 59.9F 0.88%; DM lipid, 24.0F 0.21% and DM GE, 23.70F 0.283 kJ/g.2 The effect of differences in start weight on average daily gain (ADG) and daily feed intake (DFI) responses were adjusted by covariance analysis.3 Significant ( P< 0.01) independent effects of dietary protein and lipid but no significant interaction ( P>0.05) between these main effects.4 Significant ( P< 0.05) effect due to lipid concentration of the diet only.
a, b, c, d, e, f, g, h Significant ( P < 0.05) dietary protein and lipid interaction: means without a common letter differ ( P < 0.05).
K.C.Willia
mset
al./Aquacultu
re225(2003)191–206
197
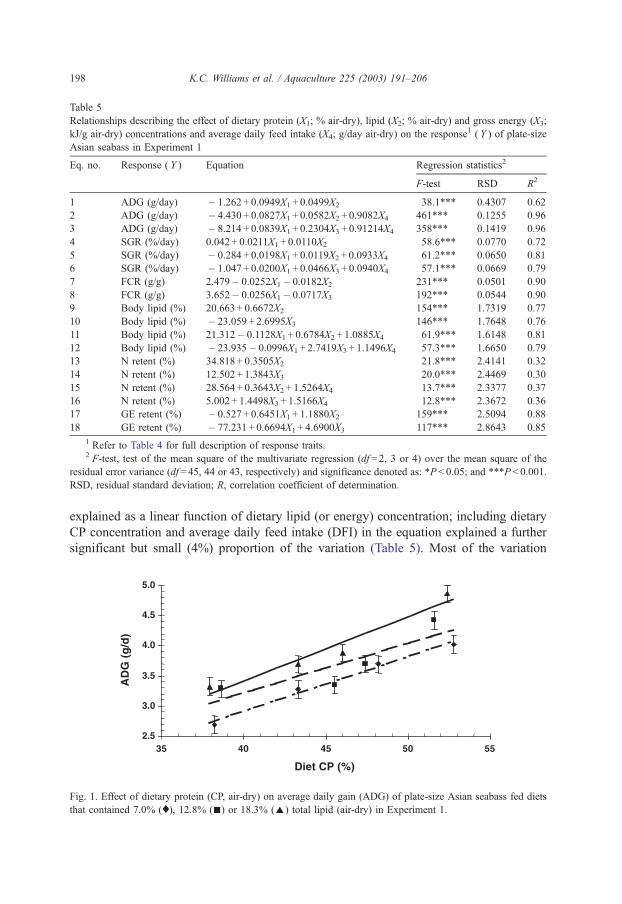
Table 5
Relationships describing the effect of dietary protein (X1; % air-dry), lipid (X2; % air-dry) and gross energy (X3;
kJ/g air-dry) concentrations and average daily feed intake (X4; g/day air-dry) on the response1 ( Y ) of plate-size
Asian seabass in Experiment 1
Eq. no. Response ( Y ) Equation Regression statistics2
F-test RSD R2
1 ADG (g/day) � 1.262 + 0.0949X1 + 0.0499X2 38.1*** 0.4307 0.62
2 ADG (g/day) � 4.430 + 0.0827X1 + 0.0582X2 + 0.9082X4 461*** 0.1255 0.96
3 ADG (g/day) � 8.214 + 0.0839X1 + 0.2304X3 + 0.91214X4 358*** 0.1419 0.96
4 SGR (%/day) 0.042 + 0.0211X1 + 0.0110X2 58.6*** 0.0770 0.72
5 SGR (%/day) � 0.284 + 0.0198X1 + 0.0119X2 + 0.0933X4 61.2*** 0.0650 0.81
6 SGR (%/day) � 1.047 + 0.0200X1 + 0.0466X3 + 0.0940X4 57.1*** 0.0669 0.79
7 FCR (g/g) 2.479� 0.0252X1� 0.0182X2 231*** 0.0501 0.90
8 FCR (g/g) 3.652� 0.0256X1� 0.0717X3 192*** 0.0544 0.90
9 Body lipid (%) 20.663 + 0.6672X2 154*** 1.7319 0.77
10 Body lipid (%) � 23.059 + 2.6995X3 146*** 1.7648 0.76
11 Body lipid (%) 21.312� 0.1128X1 + 0.6784X2 + 1.0885X4 61.9*** 1.6148 0.81
12 Body lipid (%) � 23.935� 0.0996X1 + 2.7419X3 + 1.1496X4 57.3*** 1.6650 0.79
13 N retent (%) 34.818 + 0.3505X2 21.8*** 2.4141 0.32
14 N retent (%) 12.502 + 1.3843X3 20.0*** 2.4469 0.30
15 N retent (%) 28.564 + 0.3643X2 + 1.5264X4 13.7*** 2.3377 0.37
16 N retent (%) 5.002 + 1.4498X3 + 1.5166X4 12.8*** 2.3672 0.36
17 GE retent (%) � 0.527 + 0.6451X1 + 1.1880X2 159*** 2.5094 0.88
18 GE retent (%) � 77.231 + 0.6694X1 + 4.6900X3 117*** 2.8643 0.85
1 Refer to Table 4 for full description of response traits.2 F-test, test of the mean square of the multivariate regression (df = 2, 3 or 4) over the mean square of the
residual error variance (df = 45, 44 or 43, respectively) and significance denoted as: *P < 0.05; and ***P < 0.001.
RSD, residual standard deviation; R, correlation coefficient of determination.
K.C. Williams et al. / Aquaculture 225 (2003) 191–206198
explained as a linear function of dietary lipid (or energy) concentration; including dietary
CP concentration and average daily feed intake (DFI) in the equation explained a further
significant but small (4%) proportion of the variation (Table 5). Most of the variation
Fig. 1. Effect of dietary protein (CP, air-dry) on average daily gain (ADG) of plate-size Asian seabass fed diets
that contained 7.0% (x), 12.8% (n) or 18.3% (E) total lipid (air-dry) in Experiment 1.
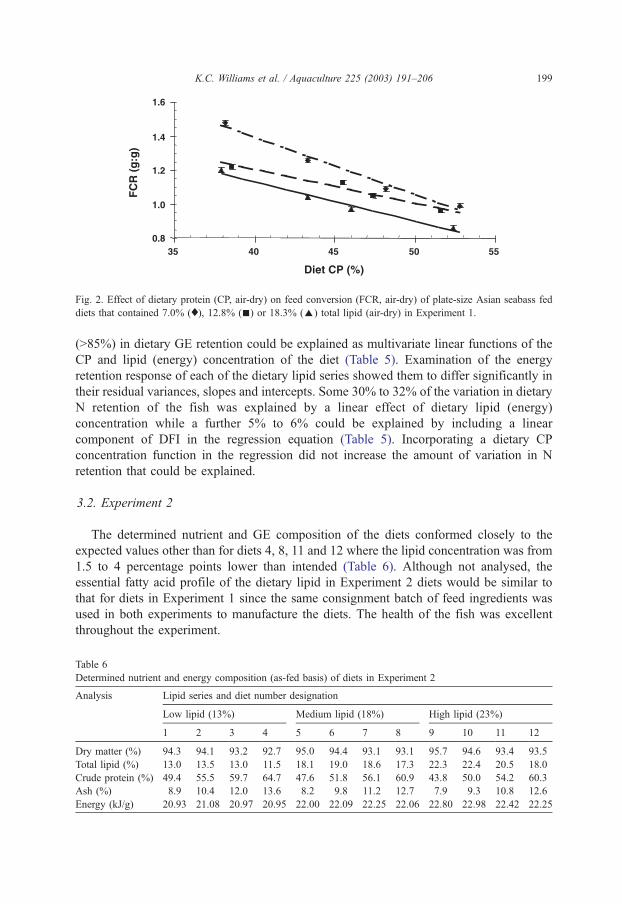
Fig. 2. Effect of dietary protein (CP, air-dry) on feed conversion (FCR, air-dry) of plate-size Asian seabass fed
diets that contained 7.0% (x), 12.8% (n) or 18.3% (E) total lipid (air-dry) in Experiment 1.
K.C. Williams et al. / Aquaculture 225 (2003) 191–206 199
(>85%) in dietary GE retention could be explained as multivariate linear functions of the
CP and lipid (energy) concentration of the diet (Table 5). Examination of the energy
retention response of each of the dietary lipid series showed them to differ significantly in
their residual variances, slopes and intercepts. Some 30% to 32% of the variation in dietary
N retention of the fish was explained by a linear effect of dietary lipid (energy)
concentration while a further 5% to 6% could be explained by including a linear
component of DFI in the regression equation (Table 5). Incorporating a dietary CP
concentration function in the regression did not increase the amount of variation in N
retention that could be explained.
3.2. Experiment 2
The determined nutrient and GE composition of the diets conformed closely to the
expected values other than for diets 4, 8, 11 and 12 where the lipid concentration was from
1.5 to 4 percentage points lower than intended (Table 6). Although not analysed, the
essential fatty acid profile of the dietary lipid in Experiment 2 diets would be similar to
that for diets in Experiment 1 since the same consignment batch of feed ingredients was
used in both experiments to manufacture the diets. The health of the fish was excellent
throughout the experiment.
Table 6
Determined nutrient and energy composition (as-fed basis) of diets in Experiment 2
Analysis Lipid series and diet number designation
Low lipid (13%) Medium lipid (18%) High lipid (23%)
1 2 3 4 5 6 7 8 9 10 11 12
Dry matter (%) 94.3 94.1 93.2 92.7 95.0 94.4 93.1 93.1 95.7 94.6 93.4 93.5
Total lipid (%) 13.0 13.5 13.0 11.5 18.1 19.0 18.6 17.3 22.3 22.4 20.5 18.0
Crude protein (%) 49.4 55.5 59.7 64.7 47.6 51.8 56.1 60.9 43.8 50.0 54.2 60.3
Ash (%) 8.9 10.4 12.0 13.6 8.2 9.8 11.2 12.7 7.9 9.3 10.8 12.6
Energy (kJ/g) 20.93 21.08 20.97 20.95 22.00 22.09 22.25 22.06 22.80 22.98 22.42 22.25
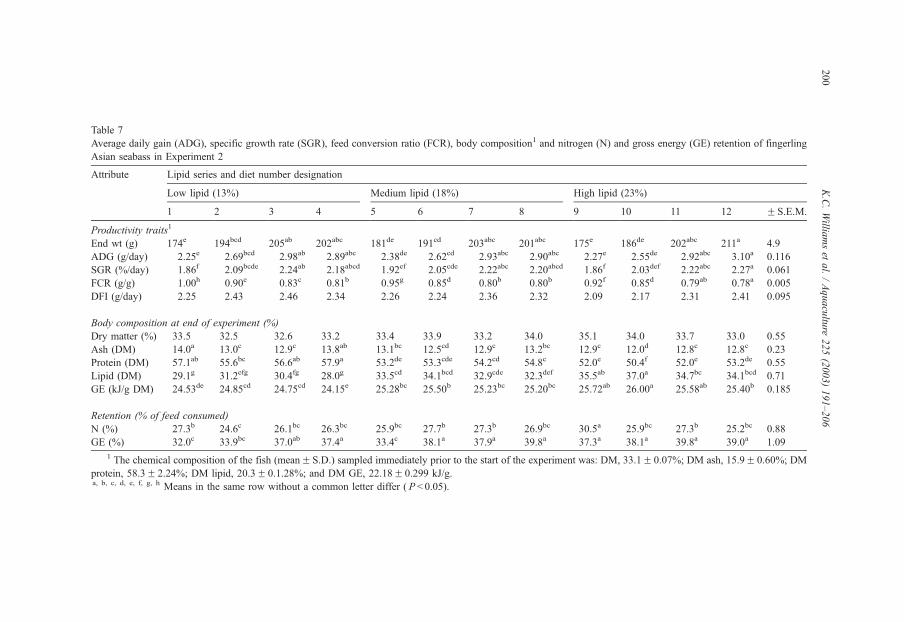
Table 7
Average daily gain (ADG), specific growth rate (SGR), feed conversion ratio (FCR), body composition1 and nitrogen (N) and gross energy (GE) retention of fingerling
Asian seabass in Experiment 2
Attribute Lipid series and diet number designation
Low lipid (13%) Medium lipid (18%) High lipid (23%)
1 2 3 4 5 6 7 8 9 10 11 12 F S.E.M.
Productivity traits1
End wt (g) 174e 194bcd 205ab 202abc 181de 191cd 203abc 201abc 175e 186de 202abc 211a 4.9
ADG (g/day) 2.25e 2.69bcd 2.98ab 2.89abc 2.38de 2.62cd 2.93abc 2.90abc 2.27e 2.55de 2.92abc 3.10a 0.116
SGR (%/day) 1.86f 2.09bcde 2.24ab 2.18abcd 1.92ef 2.05cde 2.22abc 2.20abcd 1.86f 2.03def 2.22abc 2.27a 0.061
FCR (g/g) 1.00h 0.90e 0.83c 0.81b 0.95g 0.85d 0.80b 0.80b 0.92f 0.85d 0.79ab 0.78a 0.005
DFI (g/day) 2.25 2.43 2.46 2.34 2.26 2.24 2.36 2.32 2.09 2.17 2.31 2.41 0.095
Body composition at end of experiment (%)
Dry matter (%) 33.5 32.5 32.6 33.2 33.4 33.9 33.2 34.0 35.1 34.0 33.7 33.0 0.55
Ash (DM) 14.0a 13.0c 12.9c 13.8ab 13.1bc 12.5cd 12.9c 13.2bc 12.9c 12.0d 12.8c 12.8c 0.23
Protein (DM) 57.1ab 55.6bc 56.6ab 57.9a 53.2de 53.3cde 54.2cd 54.8c 52.0e 50.4f 52.0e 53.2de 0.55
Lipid (DM) 29.1g 31.2efg 30.4fg 28.0g 33.5cd 34.1bcd 32.9cde 32.3def 35.5ab 37.0a 34.7bc 34.1bcd 0.71
GE (kJ/g DM) 24.53de 24.85cd 24.75cd 24.15e 25.28bc 25.50b 25.23bc 25.20bc 25.72ab 26.00a 25.58ab 25.40b 0.185
Retention (% of feed consumed)
N (%) 27.3b 24.6c 26.1bc 26.3bc 25.9bc 27.7b 27.3b 26.9bc 30.5a 25.9bc 27.3b 25.2bc 0.88
GE (%) 32.0c 33.9bc 37.0ab 37.4a 33.4c 38.1a 37.9a 39.8a 37.3a 38.1a 39.8a 39.0a 1.09
1 The chemical composition of the fish (meanF S.D.) sampled immediately prior to the start of the experiment was: DM, 33.1F 0.07%; DM ash, 15.9F 0.60%; DM
protein, 58.3F 2.24%; DM lipid, 20.3F 0.1.28%; and DM GE, 22.18F 0.299 kJ/g.a, b, c, d, e, f, g, h Means in the same row without a common letter differ ( P < 0.05).
K.C.Willia
mset
al./Aquacultu
re225(2003)191–206
200
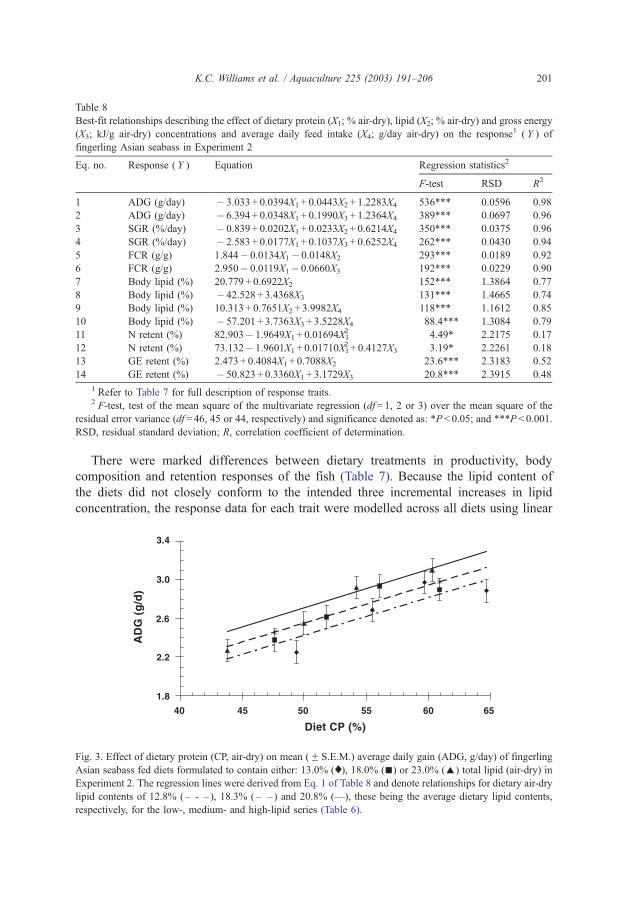
Table 8
Best-fit relationships describing the effect of dietary protein (X1; % air-dry), lipid (X2; % air-dry) and gross energy
(X3; kJ/g air-dry) concentrations and average daily feed intake (X4; g/day air-dry) on the response1 ( Y ) of
fingerling Asian seabass in Experiment 2
Eq. no. Response ( Y ) Equation Regression statistics2
F-test RSD R2
1 ADG (g/day) � 3.033 + 0.0394X1 + 0.0443X2 + 1.2283X4 536*** 0.0596 0.98
2 ADG (g/day) � 6.394 + 0.0348X1 + 0.1990X3 + 1.2364X4 389*** 0.0697 0.96
3 SGR (%/day) � 0.839 + 0.0202X1 + 0.0233X2 + 0.6214X4 350*** 0.0375 0.96
4 SGR (%/day) � 2.583 + 0.0177X1 + 0.1037X3 + 0.6252X4 262*** 0.0430 0.94
5 FCR (g/g) 1.844� 0.0134X1� 0.0148X2 293*** 0.0189 0.92
6 FCR (g/g) 2.950� 0.0119X1� 0.0660X3 192*** 0.0229 0.90
7 Body lipid (%) 20.779 + 0.6922X2 152*** 1.3864 0.77
8 Body lipid (%) � 42.528 + 3.4368X3 131*** 1.4665 0.74
9 Body lipid (%) 10.313 + 0.7651X2 + 3.9982X4 118*** 1.1612 0.85
10 Body lipid (%) � 57.201 + 3.7363X3 + 3.5228X4 88.4*** 1.3084 0.79
11 N retent (%) 82.903� 1.9649X1 + 0.01694X12 4.49* 2.2175 0.17
12 N retent (%) 73.132� 1.9601X1 + 0.01710X12 + 0.4127X3 3.19* 2.2261 0.18
13 GE retent (%) 2.473 + 0.4084X1 + 0.7088X2 23.6*** 2.3183 0.52
14 GE retent (%) � 50.823 + 0.3360X1 + 3.1729X3 20.8*** 2.3915 0.48
1 Refer to Table 7 for full description of response traits.2 F-test, test of the mean square of the multivariate regression (df= 1, 2 or 3) over the mean square of the
residual error variance (df = 46, 45 or 44, respectively) and significance denoted as: *P< 0.05; and ***P< 0.001.
RSD, residual standard deviation; R, correlation coefficient of determination.
K.C. Williams et al. / Aquaculture 225 (2003) 191–206 201
There were marked differences between dietary treatments in productivity, body
composition and retention responses of the fish (Table 7). Because the lipid content of
the diets did not closely conform to the intended three incremental increases in lipid
concentration, the response data for each trait were modelled across all diets using linear
Fig. 3. Effect of dietary protein (CP, air-dry) on mean (F S.E.M.) average daily gain (ADG, g/day) of fingerling
Asian seabass fed diets formulated to contain either: 13.0% (x), 18.0% (n) or 23.0% (E) total lipid (air-dry) in
Experiment 2. The regression lines were derived from Eq. 1 of Table 8 and denote relationships for dietary air-dry
lipid contents of 12.8% (– - – ), 18.3% (– – ) and 20.8% (—), these being the average dietary lipid contents,
respectively, for the low-, medium- and high-lipid series (Table 6).
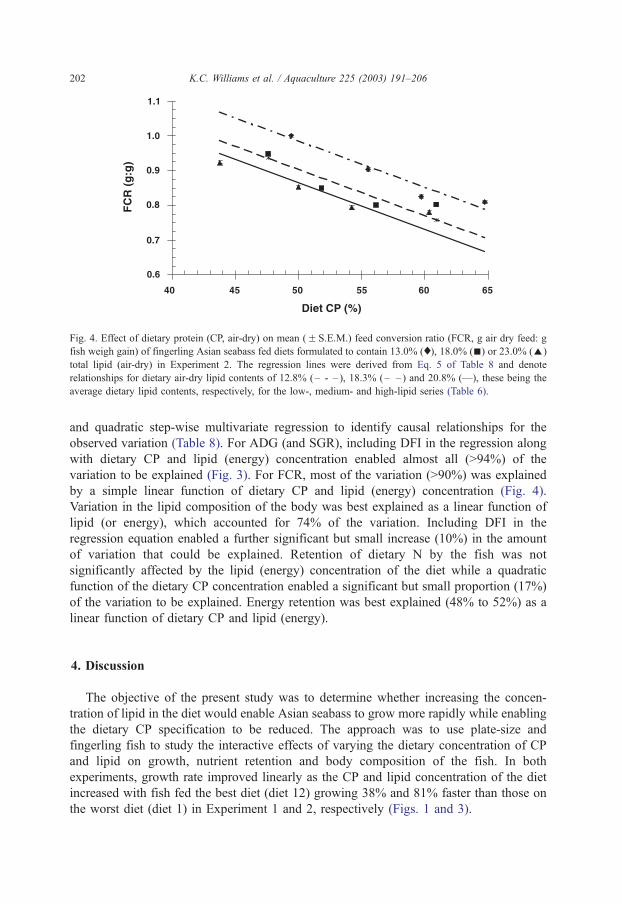
Fig. 4. Effect of dietary protein (CP, air-dry) on mean (F S.E.M.) feed conversion ratio (FCR, g air dry feed: g
fish weigh gain) of fingerling Asian seabass fed diets formulated to contain 13.0% (x), 18.0% (n) or 23.0% (E)
total lipid (air-dry) in Experiment 2. The regression lines were derived from Eq. 5 of Table 8 and denote
relationships for dietary air-dry lipid contents of 12.8% (– - – ), 18.3% (– – ) and 20.8% (—), these being the
average dietary lipid contents, respectively, for the low-, medium- and high-lipid series (Table 6).
K.C. Williams et al. / Aquaculture 225 (2003) 191–206202
and quadratic step-wise multivariate regression to identify causal relationships for the
observed variation (Table 8). For ADG (and SGR), including DFI in the regression along
with dietary CP and lipid (energy) concentration enabled almost all (>94%) of the
variation to be explained (Fig. 3). For FCR, most of the variation (>90%) was explained
by a simple linear function of dietary CP and lipid (energy) concentration (Fig. 4).
Variation in the lipid composition of the body was best explained as a linear function of
lipid (or energy), which accounted for 74% of the variation. Including DFI in the
regression equation enabled a further significant but small increase (10%) in the amount
of variation that could be explained. Retention of dietary N by the fish was not
significantly affected by the lipid (energy) concentration of the diet while a quadratic
function of the dietary CP concentration enabled a significant but small proportion (17%)
of the variation to be explained. Energy retention was best explained (48% to 52%) as a
linear function of dietary CP and lipid (energy).
4. Discussion
The objective of the present study was to determine whether increasing the concen-
tration of lipid in the diet would enable Asian seabass to grow more rapidly while enabling
the dietary CP specification to be reduced. The approach was to use plate-size and
fingerling fish to study the interactive effects of varying the dietary concentration of CP
and lipid on growth, nutrient retention and body composition of the fish. In both
experiments, growth rate improved linearly as the CP and lipid concentration of the diet
increased with fish fed the best diet (diet 12) growing 38% and 81% faster than those on
the worst diet (diet 1) in Experiment 1 and 2, respectively (Figs. 1 and 3).
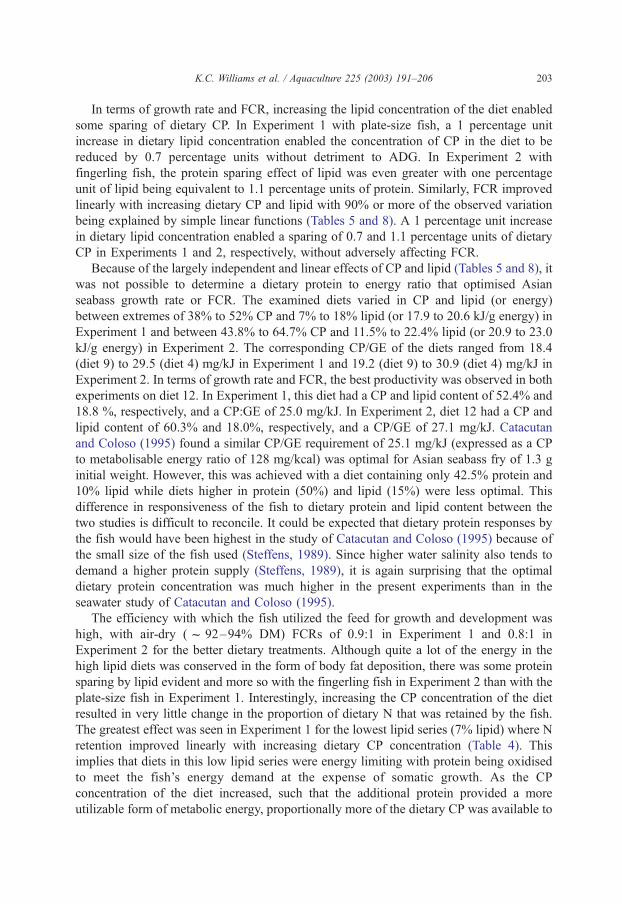
K.C. Williams et al. / Aquaculture 225 (2003) 191–206 203
In terms of growth rate and FCR, increasing the lipid concentration of the diet enabled
some sparing of dietary CP. In Experiment 1 with plate-size fish, a 1 percentage unit
increase in dietary lipid concentration enabled the concentration of CP in the diet to be
reduced by 0.7 percentage units without detriment to ADG. In Experiment 2 with
fingerling fish, the protein sparing effect of lipid was even greater with one percentage
unit of lipid being equivalent to 1.1 percentage units of protein. Similarly, FCR improved
linearly with increasing dietary CP and lipid with 90% or more of the observed variation
being explained by simple linear functions (Tables 5 and 8). A 1 percentage unit increase
in dietary lipid concentration enabled a sparing of 0.7 and 1.1 percentage units of dietary
CP in Experiments 1 and 2, respectively, without adversely affecting FCR.
Because of the largely independent and linear effects of CP and lipid (Tables 5 and 8), it
was not possible to determine a dietary protein to energy ratio that optimised Asian
seabass growth rate or FCR. The examined diets varied in CP and lipid (or energy)
between extremes of 38% to 52% CP and 7% to 18% lipid (or 17.9 to 20.6 kJ/g energy) in
Experiment 1 and between 43.8% to 64.7% CP and 11.5% to 22.4% lipid (or 20.9 to 23.0
kJ/g energy) in Experiment 2. The corresponding CP/GE of the diets ranged from 18.4
(diet 9) to 29.5 (diet 4) mg/kJ in Experiment 1 and 19.2 (diet 9) to 30.9 (diet 4) mg/kJ in
Experiment 2. In terms of growth rate and FCR, the best productivity was observed in both
experiments on diet 12. In Experiment 1, this diet had a CP and lipid content of 52.4% and
18.8 %, respectively, and a CP:GE of 25.0 mg/kJ. In Experiment 2, diet 12 had a CP and
lipid content of 60.3% and 18.0%, respectively, and a CP/GE of 27.1 mg/kJ. Catacutan
and Coloso (1995) found a similar CP/GE requirement of 25.1 mg/kJ (expressed as a CP
to metabolisable energy ratio of 128 mg/kcal) was optimal for Asian seabass fry of 1.3 g
initial weight. However, this was achieved with a diet containing only 42.5% protein and
10% lipid while diets higher in protein (50%) and lipid (15%) were less optimal. This
difference in responsiveness of the fish to dietary protein and lipid content between the
two studies is difficult to reconcile. It could be expected that dietary protein responses by
the fish would have been highest in the study of Catacutan and Coloso (1995) because of
the small size of the fish used (Steffens, 1989). Since higher water salinity also tends to
demand a higher protein supply (Steffens, 1989), it is again surprising that the optimal
dietary protein concentration was much higher in the present experiments than in the
seawater study of Catacutan and Coloso (1995).
The efficiency with which the fish utilized the feed for growth and development was
high, with air-dry (f 92–94% DM) FCRs of 0.9:1 in Experiment 1 and 0.8:1 in
Experiment 2 for the better dietary treatments. Although quite a lot of the energy in the
high lipid diets was conserved in the form of body fat deposition, there was some protein
sparing by lipid evident and more so with the fingerling fish in Experiment 2 than with the
plate-size fish in Experiment 1. Interestingly, increasing the CP concentration of the diet
resulted in very little change in the proportion of dietary N that was retained by the fish.
The greatest effect was seen in Experiment 1 for the lowest lipid series (7% lipid) where N
retention improved linearly with increasing dietary CP concentration (Table 4). This
implies that diets in this low lipid series were energy limiting with protein being oxidised
to meet the fish’s energy demand at the expense of somatic growth. As the CP
concentration of the diet increased, such that the additional protein provided a more
utilizable form of metabolic energy, proportionally more of the dietary CP was available to
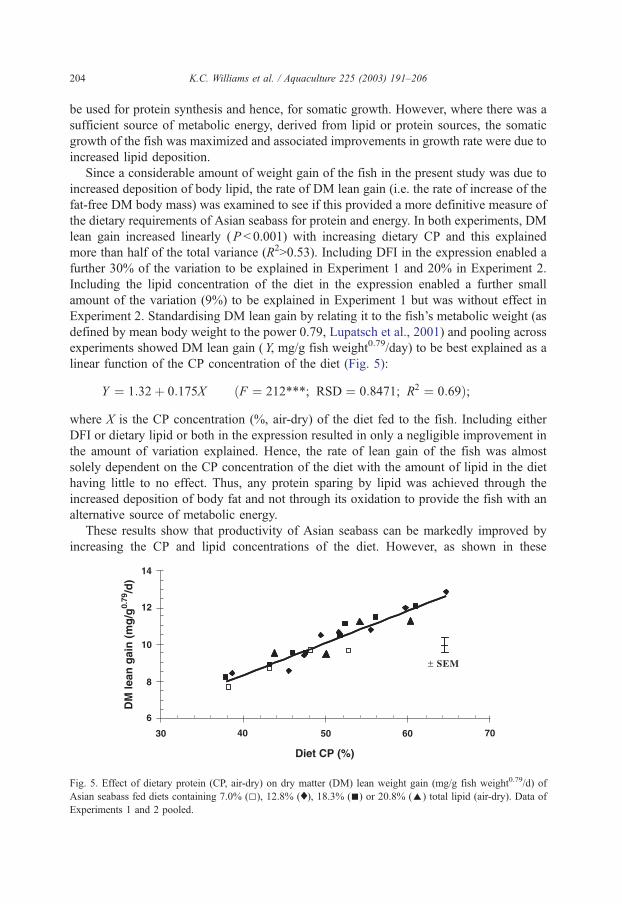
K.C. Williams et al. / Aquaculture 225 (2003) 191–206204
be used for protein synthesis and hence, for somatic growth. However, where there was a
sufficient source of metabolic energy, derived from lipid or protein sources, the somatic
growth of the fish was maximized and associated improvements in growth rate were due to
increased lipid deposition.
Since a considerable amount of weight gain of the fish in the present study was due to
increased deposition of body lipid, the rate of DM lean gain (i.e. the rate of increase of the
fat-free DM body mass) was examined to see if this provided a more definitive measure of
the dietary requirements of Asian seabass for protein and energy. In both experiments, DM
lean gain increased linearly (P < 0.001) with increasing dietary CP and this explained
more than half of the total variance (R2>0.53). Including DFI in the expression enabled a
further 30% of the variation to be explained in Experiment 1 and 20% in Experiment 2.
Including the lipid concentration of the diet in the expression enabled a further small
amount of the variation (9%) to be explained in Experiment 1 but was without effect in
Experiment 2. Standardising DM lean gain by relating it to the fish’s metabolic weight (as
defined by mean body weight to the power 0.79, Lupatsch et al., 2001) and pooling across
experiments showed DM lean gain (Y, mg/g fish weight0.79/day) to be best explained as a
linear function of the CP concentration of the diet (Fig. 5):
Y ¼ 1:32þ 0:175X ðF ¼ 212***; RSD ¼ 0:8471; R2 ¼ 0:69Þ;
where X is the CP concentration (%, air-dry) of the diet fed to the fish. Including either
DFI or dietary lipid or both in the expression resulted in only a negligible improvement in
the amount of variation explained. Hence, the rate of lean gain of the fish was almost
solely dependent on the CP concentration of the diet with the amount of lipid in the diet
having little to no effect. Thus, any protein sparing by lipid was achieved through the
increased deposition of body fat and not through its oxidation to provide the fish with an
alternative source of metabolic energy.
These results show that productivity of Asian seabass can be markedly improved by
increasing the CP and lipid concentrations of the diet. However, as shown in these
Fig. 5. Effect of dietary protein (CP, air-dry) on dry matter (DM) lean weight gain (mg/g fish weight0.79/d) of
Asian seabass fed diets containing 7.0% (5), 12.8% (x), 18.3% (n) or 20.8% (E) total lipid (air-dry). Data of
Experiments 1 and 2 pooled.
K.C. Williams et al. / Aquaculture 225 (2003) 191–206 205
experiments and previously observed, Asian seabass have only a limited ability to use lipid
as a primary energy source unless diets are also adequately supplied with protein. That is,
they appear to have only a limited capacity to oxidise lipid to provide a source of
metabolic energy. In this regard, they differ from salmonids where enhanced productivity
has been achieved by using lipid at high dietary concentrations (above 30%) to
substantially spare for protein (Arzel et al., 1995; Rasmussen et al., 2000).
The results of the present studies indicate that higher rates of growth may be possible if
Asian seabass were fed even more nutrient dense diets. However, it is likely that further
increases in growth rate would result in even higher rates of lipid deposition and perhaps
with little if any improvement in the rate of somatic growth. Whether or not it is desirable
to produce ‘fatty’ fish is questionable and market dependent. If fish are sold whole, rather
than gill and gutted, as is the present situation for Asian seabass in Australia, the greater
weight of fish produced could benefit the farmer. Conversely, if fish are sold gill and
gutted, dress-out percentage of fatty fish will be lower than for lean fish since abdominal
fat constitutes a large proportion of stored fat. Very fatty fish may also have less appeal in
the market place since the flesh of these fish can have an undesirable greyish colouration
and lower keeping qualities (Phillips, personal communication, Australian Barramundi
Farmers Association). On a plus side, the human health benefits of an increased intake of
omega-3 lipids could have positive marketing advantages. From practical considerations, it
will be difficult to formulate diets with nutrient concentrations much higher than about
50–55% CP and 20–25% lipid unless much more expensive protein feed ingredients such
as protein isolates are used.
Acknowledgements
Chemical analyses were carried out at the Queensland Department of Primary
Industries’ Biochemistry Branch at the Animal Research Institute, Yeerongpilly. We thank
Peter Martin, Colin Palmer and Ian Brock for these analyses. The research was part (96/
392) of a nationally coordinated sub-program on aquaculture diet development sponsored
by the Australian Fisheries Research and Development which was led by Geoff Allan,
New South Wales Department of Fisheries. We thank David Smith and Malcolm Brown,
CSIRO Marine Research and Ian Williams, University of Western Australia for
constructive comments on the manuscript.
References
AOAC, 1990. Official Methods of Analysis, 15th ed. AOAC International, Arlington, VA, USA.
Arzel, J., Metailler, R., Kerleguer, C., Le Delliou, H., Guillaume, J., 1995. The protein requirement of brown
trout (Salmo trutta) fry. Aquaculture 130, 67–78.
Bligh, E.G., Dyer, W.J., 1959. A rapid method of total lipid extraction and purification. Can. J. Biochem. Physiol.
37, 911–917.
Boonyaratpalin, M., 1997. Nutrient requirements of marine feed fish cultured in Southeast Asia. Aquaculture
151, 283–313.
Catacutan, M.R., Coloso, R.M., 1995. Effect of dietary protein to energy ratios on growth, survival, and body
composition of juvenile Asian seabass, Lates calcarifer. Aquaculture 131, 125–133.
K.C. Williams et al. / Aquaculture 225 (2003) 191–206206
Cho, C.Y., Kaushik, S.J., 1990. Nutritional energetics in fish: energy and protein utilization in rainbow trout
(Salmo gairdneri). World Rev. Nutr. Diet. 61, 132–172.
Christie, W.W., 1982. The analysis of fatty acids. Separation, Identification and Structural Analysis of Lipids, 2nd
ed. Pergamon, Oxford, UK, pp. 63–90.
Cuzon, G., Chou, R., Fuchs, J., 1990. Nutrition of the seabass Lates calcarifer. Advances in Tropical Aqua-
culture. AQUACOP, IFREMER, Actes de Colloques, vol. 9, pp. 757–763.
Einen, O., Roem, A.J., 1997. Dietary protein/energy ratios for Atlantic salmon in relation to fish size: growth,
feed utilization and slaughter quality. Aquac. Nutr. 3, 115–126.
Lupatsch, I., Kissil, G.Wm., Sklan, D., 2001. Optimization of feeding regimes for European sea bass Dicen-
trarchus labrax: a factorial approach. Aquaculture 202, 289–302.
Rasmussen, R.S., Ostenfeld, T.H., Ronsholdt, B., McLean, E., 2000. Manipulation of end-product quality of
rainbow trout with finishing diets. Aquac. Nutr. 6, 17–23.
Refstie, S., Storebakken, T., Baeverfjord, G., Roem, A.J., 2001. Long-term protein and lipid growth of Atlantic
salmon (Salmo salar) fed diets with partial replacement of fish meal by soy protein products at medium or
high lipid level. Aquaculture 193, 91–106.
Snedecor, G.W., Cochran, W.G., 1989. Statistical Methods, 8th ed. Iowa State Univ. Press, Ames, IA, USA.
503 pp.
Steffens, W., 1989. Proteins. Principles of Fish Nutrition. Ellis Horwood, Chichester, UK, pp. 66–117. English
edition.
Williams, K.C., Barlow, C.G., Brock, I., Rodgers, L.J., 1995. Use of autoclaving in the preparation of homo-
genates for determining the proximate chemical and fatty acid composition of fish. J. Sci. Feed Agric. 69,
451–456.
Williams, K., Barlow, C., Rodgers, L., 2001. Efficacy of crystalline and protein-bound amino acids for amino
acid enrichment of diets for barramundi/Asian seabass (Lates calcarifer Bloch). Aquac. Res. 32, 415–429.
Other titles in this series: ISSN 1440-3544 No. 1 Andrew, N.L., Graham, K.J., Hodgson, K.E. and Gordon, G.N.G., 1998. Changes after 20 years
in relative abundance and size composition of commercial fishes caught during fishery independent surveys on SEF trawl grounds. Final Report to Fisheries Research and Development Corporation. Project No. 96/139.
No. 2 Virgona, J.L., Deguara, K.L., Sullings, D.J., Halliday, I. and Kelly, K., 1998. Assessment of the stocks of sea mullet in New South Wales and Queensland waters. Final Report to Fisheries Research and Development Corporation. Project No. 94/024.
No. 3 Stewart, J., Ferrell, D.J. and Andrew, N.L., 1998. Ageing Yellowtail (Trachurus novaezelandiae) and Blue Mackerel (Scomber australasicus) in New South Wales. Final Report to Fisheries Research and Development Corporation. Project No. 95/151.
No. 4 Pethebridge, R., Lugg, A. and Harris, J., 1998. Obstructions to fish passage in New South Wales South Coast streams. Final report to Cooperative Research Centre for Freshwater Ecology. 70pp.
No. 5 Kennelly, S.J. and Broadhurst, M.K., 1998. Development of by-catch reducing prawn-trawls and fishing practices in NSW's prawn-trawl fisheries (and incorporating an assessment of the effect of increasing mesh size in fish trawl gear). Final Report to Fisheries Research and Development Corporation. Project No. 93/180. 18pp + appendices.
No. 6 Allan, G.L. and Rowland, S.J., 1998. Fish meal replacement in aquaculture feeds for silver perch. Final Report to Fisheries Research and Development Corporation. Project No. 93/120-03. 237pp + appendices.
No. 7 Allan, G.L., 1998. Fish meal replacement in aquaculture feeds: subprogram administration. Final Report to Fisheries Research and Development Corporation. Project No. 93/120. 54pp + appendices.
No. 8 Heasman, M.P., O'Connor, W.A. and O'Connor, S.J., 1998. Enhancement and farming of scallops in NSW using hatchery produced seedstock. Final Report to Fisheries Research and Development Corporation. Project No. 94/083. 146pp.
No. 9 Nell, J.A., McMahon, G.A. and Hand, R.E., 1998. Tetraploidy induction in Sydney rock oysters. Final Report to Cooperative Research Centre for Aquaculture. Project No. D.4.2. 25pp.
No. 10 Nell, J.A. and Maguire, G.B., 1998. Commercialisation of triploid Sydney rock and Pacific oysters. Part 1: Sydney rock oysters. Final Report to Fisheries Research and Development Corporation. Project No. 93/151. 122pp.
No. 11 Watford, F.A. and Williams, R.J., 1998. Inventory of estuarine vegetation in Botany Bay, with special reference to changes in the distribution of seagrass. Final Report to Fishcare Australia. Project No. 97/003741. 51pp.
No. 12 Andrew, N.L., Worthington D.G., Brett, P.A. and Bentley N., 1998. Interactions between the abalone fishery and sea urchins in New South Wales. Final Report to Fisheries Research and Development Corporation. Project No. 93/102.
No. 13 Jackson, K.L. and Ogburn, D.M., 1999. Review of depuration and its role in shellfish quality assurance. Final Report to Fisheries Research and Development Corporation. Project No. 96/355. 77pp.
No. 14 Fielder, D.S., Bardsley, W.J. and Allan, G.L., 1999. Enhancement of Mulloway (Argyrosomus japonicus) in intermittently opening lagoons. Final Report to Fisheries Research and Development Corporation. Project No. 95/148. 50pp + appendices.
No. 15 Otway, N.M. and Macbeth, W.G., 1999. The physical effects of hauling on seagrass beds. Final Report to Fisheries Research and Development Corporation. Project No. 95/149 and 96/286. 86pp.
No. 16 Gibbs, P., McVea, T. and Louden, B., 1999. Utilisation of restored wetlands by fish and invertebrates. Final Report to Fisheries Research and Development Corporation. Project No. 95/150. 142pp.
No. 17 Ogburn, D. and Ruello, N., 1999. Waterproof labelling and identification systems suitable for shellfish and other seafood and aquaculture products. Whose oyster is that? Final Report to Fisheries Research and Development Corporation. Project No. 95/360. 50pp.
No. 18 Gray, C.A., Pease, B.C., Stringfellow, S.L., Raines, L.P. and Walford, T.R., 2000. Sampling estuarine fish species for stock assessment. Includes appendices by D.J. Ferrell, B.C. Pease, T.R. Walford, G.N.G. Gordon, C.A. Gray and G.W. Liggins. Final Report to Fisheries Research and Development Corporation. Project No. 94/042. 194pp.
No. 19 Otway, N.M. and Parker, P.C., 2000. The biology, ecology, distribution, abundance and identification of marine protected areas for the conservation of threatened Grey Nurse Sharks in south east Australian waters. Final Report to Environment Australia. 101pp.
No. 20 Allan, G.L. and Rowland, S.J., 2000. Consumer sensory evaluation of silver perch cultured in ponds on meat meal based diets. Final Report to Meat & Livestock Australia. Project No. PRCOP.009. 21pp + appendices.
No. 21 Kennelly, S.J. and Scandol, J. P., 2000. Relative abundances of spanner crabs and the development of a population model for managing the NSW spanner crab fishery. Final Report to Fisheries Research and Development Corporation. Project No. 96/135. 43pp + appendices.
No. 22 Williams, R.J., Watford, F.A. and Balashov, V., 2000. Kooragang Wetland Rehabilitation Project: History of changes to estuarine wetlands of the lower Hunter River. Final Report to Kooragang Wetland Rehabilitation Project Steering Committee. 82pp.
No. 23 Survey Development Working Group, 2000. Development of the National Recreational and Indigenous Fishing Survey. Final Report to Fisheries Research and Development Corporation. Project No. 98/169. (Volume 1 – 36pp + Volume 2 – attachments).
No.24 Rowling, K.R and Raines, L.P., 2000. Description of the biology and an assessment of the fishery of Silver Trevally Pseudocaranx dentex off New South Wales. Final Report to Fisheries Research and Development Corporation. Project No. 97/125. 69pp.
No. 25 Allan, G.L., Jantrarotai, W., Rowland, S., Kosuturak, P. and Booth, M., 2000. Replacing fishmeal in aquaculture diets. Final Report to the Australian Centre for International Agricultural Research. Project No. 9207. 13pp.
No. 26 Gehrke, P.C., Gilligan, D.M. and Barwick, M., 2001. Fish communities and migration in the Shoalhaven River – Before construction of a fishway. Final Report to Sydney Catchment Authority. 126pp.
No. 27 Rowling, K.R. and Makin, D.L., 2001. Monitoring of the fishery for Gemfish Rexea solandri, 1996 to 2000. Final Report to the Australian Fisheries Management Authority. 44pp.
No. 28 Otway, N.M., 1999. Identification of candidate sites for declaration of aquatic reserves for the conservation of rocky intertidal communities in the Hawkesbury Shelf and Batemans Shelf Bioregions. Final Report to Environment Australia for the Marine Protected Areas Program. Project No. OR22. 88pp.
No. 29 Heasman, M.P., Goard, L., Diemar, J. and Callinan, R., 2000. Improved Early Survival of Molluscs: Sydney Rock Oyster (Saccostrea glomerata). Final report to the Aquaculture Cooperative Research Centre. Project No. A.2.1. 63pp.
No. 30 Allan, G.L., Dignam, A and Fielder, S., 2001. Developing Commercial Inland Saline Aquaculture in Australia: Part 1. R&D Plan. Final Report to Fisheries Research and Development Corporation. Project No. 1998/335.
No. 31 Allan, G.L., Banens, B. and Fielder, S., 2001. Developing Commercial Inland Saline Aquaculture in Australia: Part 2. Resource Inventory and Assessment. Final report to Fisheries Research and Development Corporation. Project No. 1998/335. 33pp.
No. 32 Bruce, A., Growns, I. and Gehrke, P., 2001. Woronora River Macquarie Perch Survey. Final report to Sydney Catchment Authority, April 2001. 116pp.
No. 33 Morris, S.A., Pollard, D.A., Gehrke, P.C. and Pogonoski, J.J., 2001. Threatened and Potentially Threatened Freshwater Fishes of Coastal New South Wales and the Murray-Darling Basin. Report to Fisheries Action Program and World Wide Fund for Nature. Project No. AA 0959.98. 177pp.
No. 34 Heasman, M.P., Sushames, T.M., Diemar, J.A., O’Connor, W.A. and Foulkes, L.A., 2001. Production of Micro-algal Concentrates for Aquaculture Part 2: Development and Evaluation of Harvesting, Preservation, Storage and Feeding Technology. Final Report to Fisheries Research and Development Corporation. Project No. 1993/123 and 1996/342. 150pp + appendices.
No. 35 Stewart, J. and Ferrell, D.J., 2001. Mesh selectivity in the NSW demersal trap fishery. Final Report to Fisheries Research and Development Corporation. Project No. 1998/138. 86pp.
No. 36 Stewart, J., Ferrell, D.J., van der Walt, B., Johnson, D. and Lowry, M., 2001. Assessment of length and age composition of commercial kingfish landings. Final Report to Fisheries Research and Development Corporation. Project No. 1997/126. 49pp.
No. 37 Gray, C.A. and Kennelly, S.J., 2001. Development of discard-reducing gears and practices in the estuarine prawn and fish haul fisheries of NSW. Final Report to Fisheries Research and Development Corporation. Project No. 1997/207. 151pp.
No. 38 Murphy, J.J., Lowry, M.B., Henry, G.W. and Chapman, D., 2002. The Gamefish Tournament Monitoring Program – 1993 to 2000. Final report to Australian Fisheries Management Authority. 93pp.
No. 39 Kennelly, S.J. and McVea, T.A. (Ed), 2002. Scientific reports on the recovery of the Richmond and Macleay Rivers following fish kills in February and March 2001. 325pp.
No. 40 Pollard, D.A. and Pethebridge, R.L., 2002. Report on Port of Botany Bay Introduced Marine Pest Species Survey. Final Report to Sydney Ports Corporation. 69pp.
No. 41 Pollard, D.A. and Pethebridge, R.L., 2002. Report on Port Kembla Introduced Marine Pest Species Survey. Final Report to Port Kembla Port Corporation. 72pp.
No. 42 O’Connor, W.A, Lawler, N.F. and Heasman, M.P., 2003. Trial farming the akoya pearl oyster, Pinctada imbricata, in Port Stephens, NSW. Final Report to Australian Radiata Pty. Ltd. 170pp.
No. 43 Fielder, D.S. and Allan, G.L., 2003. Improving fingerling production and evaluating inland saline water culture of snapper, Pagrus auratus. Final Report to the Aquaculture Cooperative Research Centre. Project No. C4.2. 62pp.
No. 44 Astles, K.L., Winstanley, R.K., Harris, J.H. and Gehrke, P.C., 2003. Experimental study of the effects of cold water pollution on native fish. A Final Report for the Regulated Rivers and Fisheries Restoration Project. 55pp.
No. 45 Gilligan, D.M., Harris, J.H. and Mallen-Cooper, M., 2003. Monitoring changes in the Crawford River fish community following replacement of an effective fishway with a vertical-slot fishway design: Results of an eight year monitoring program. Final Report to the Cooperative Research Centre for Freshwater Ecology. 80pp.
No. 46 Pollard, D.A. and Rankin, B.K., 2003. Port of Eden Introduced Marine Pest Species Survey. Final Report to Coasts & Clean Seas Program. 67pp.
No. 47 Otway, N.M., Burke, A.L., Morrison, NS. and Parker, P.C., 2003. Monitoring and identification of NSW Critical Habitat Sites for conservation of Grey Nurse Sharks. Final Report to Environment Australia. Project No. 22499. 62pp.
No. 48 Henry, G.W. and Lyle, J.M. (Ed), 2003. The National Recreational and Indigenous Fishing Survey. Final Report to Fisheries Research and Development Corporation. Project No. 1999/158. 188 pp.
No. 49 Nell, J.A., 2003. Selective breeding for disease resistance and fast growth in Sydney rock oysters. Final Report to Fisheries Research and Development Corporation. Project No. 1996/357. 44pp.
No. 50 Gilligan, D. and Schiller, S., 2003. Downstream transport of larval and juvenile fish. A final report for the Natural Resources Management Strategy. Project No. NRMS R7019. 66pp.
No. 51 Liggins, G.W., Scandol, J.P. and Kennelly, S.J., 2003. Recruitment of Population Dynamacist. Final Report to Fisheries Research and Development Corporation. Project No. 1993/214.05. 44pp.
No. 52 Steffe, A.S. and Chapman, J.P., 2003. A survey of daytime recreational fishing during the annual period, March 1999 to February 2000, in Lake Macquarie, New South Wales. NSW Fisheries Final Report. 124pp.
No. 53 Barker, D. and Otway, N., 2003. Environmental assessment of zinc coated wire mesh sea cages in Botany Bay NSW. Final Report to OneSteel Limited. 36pp.
No. 54 Growns, I., Astles, A. and Gehrke, P., 2003. Spatial and temporal variation in composition of riverine fish communities. Final Report to Water Management Fund. Project No. SW1 part 2. 24pp.
No. 55 Gray, C. A., Johnson, D.D., Young, D.J. and Broadhurst, M. K., 2003. Bycatch assessment of the Estuarine Commercial Gill Net Fishery in NSW. Final Report to Fisheries Research and Development Corporation. Project No. 2000/172. 58pp.
No. 56 Worthington, D.G. and Blount, C., 2003. Research to develop and manage the sea urchin fisheries of NSW and eastern Victoria. Final Report to Fisheries Research and Development Corporation. Project No. 1999/128. 182pp.
No. 57 Baumgartner, L.J., 2003. Fish passage through a Deelder lock on the Murrumbidgee River, Australia. NSW Fisheries Final Report. 34pp.
No. 58 Allan, G.L., Booth, M.A., David A.J. Stone, D.A.J. and Anderson, A..J., 2003. Aquaculture Diet Development Subprogram: Ingredient Evaluation. Final Report to Fisheries Research and Development Corporation. Project No. 1996/391. 171pp.
No. 59 Smith, D.M., Allan, G.L. and Booth, M.A., 2003. Aquaculture Diet Development Subprogram: Nutrient Requirements of Aquaculture Species. Final Report to Fisheries Research and Development Corporation. Project No. 1996/392. 220pp.
No. 60 Barlow, C.G., Allan, G.L., Williams, K.C., Rowland, S.J. and Smith, D.M., 2003. Aquaculture Diet Development Subprogram: Diet Validation and Feeding Strategies. Final Report to Fisheries Research and Development Corporation. Project No. 1996/393. 197pp.