Embed Size (px)
Citation preview
1,* 2 1 3 1
1 Department of Zoology and Marine Biology, Faculty of Biology, School of Sciences, National and Kapodistrian University of
Athens, Panepistimioupolis, Athens, Greece; 2 Institute of Marine Biological Resources, Hellenic Center for Marine Research
(HCMR), Athens-Sounio, Anavissos, Attica; 3 Department of Food Technology, Technological Educational Institute of
Athens, Ag. Spiridonos str., Egaleo, Athens, Greece
The potential effect of body mass (m), maturity stage (ms),
food type (ft), food protein (p) and lipid (li) content, and
food protein-to-energy ratio, P/E (pe) on Specific Growth
Rate (SGR, % day)1), Absolute Feeding Rate (AFR,
g day)1), Feed Efficiency (FE, %), Assimilation Efficiency
(AE, %), and Protein Retention Efficiency (PRE, %) in the
common octopus was investigated. Six food types were
provided ad libitum: shrimp, squid, hake, mussel, sardine and
artificial one (gels made of hydrated squid flour agglutinated
with sodium alginate). Estimated SGRs, AFRs, FEs, AEs and
PREs were modelled with General Linear Models based on
an information theory approach, using m, ms, ft, p, li and pe
as potential predictor variables. SGR decreased when m
increased; octopuses fed on shrimps showed the highest
SGRs and the ones fed on mussels showed the lowest SGRs.
AFR increased with m. Maximum and minimum FEs were
observed, when food provided was shrimps and mussels,
respectively. Maximum PRE was performed by octopuses fed
on shrimps or sardines and minimum PRE by octopuses fed
on mussels. Octopuses fed on artificial diet reached satis-
factory levels of SGR (0.50% day)1) and FE (12.3%).
KEY WORDSKEY WORDS: Akaike�s Information Criterion, artificial diet,
feed performance, growth, Information Theory, Octopus
vulgaris
Received 31 May 2009, accepted 18 January 2010
Correspondence: Dimitra Petza, Department of Zoology and Marine
Biology, Faculty of Biology, School of Sciences, National and Kapodistrian
University of Athens, Panepistimioupolis, 157 84 Athens, Greece. E-mail:
The common octopus Octopus vulgaris fulfils the expecta-
tions of industrial culture, because of its rapid growth
(Mangold 1983; Iglesias et al. 2000), high fecundity (Man-
gold 1983), high feed efficiency (Mangold & Von Boletszky
1973; Wells 1978; Mangold 1983), short life cycle (Mangold
& Von Boletszky 1973; Katsanevakis & Verriopoulos 2006),
easy adaptation to captivity conditions (Iglesias et al. 2000),
acceptance of non-living, non-motile foods (Boucaud-Camou
& Boucher-Rodoni 1983), high nutritional value for human
consumption, because of its high n-3 PUFA levels (Sina-
noglou & Miniadis-Meimaroglou 1998) and its high market
price, combined with increasing global market requirements
(Vaz-Pires et al. 2004).
Several studies have been carried out, providing informa-
tion about the nutritional requirements of common octopus
O. vulgaris and how they affect growth (Lee 1994; Garcıa
Garcıa & Aguado Gimenez 2002; Aguado Gimenez & Garcıa
Garcıa 2002; Garcıa Garcıa & Cerezo Valverde 2006; Cerezo
Valverde et al. 2008; Quintana et al. 2008). However, many
crucial questions remain unanswered, while in some cases
results are controversial.
Octopus vulgaris is characterized by rapid growth, with
large individual variability (O�Dor et al. 1984; Domain et al.
2000). Numerous biotic and abiotic factors are capable of
dramatically modifying its growth (Forsythe & Van Heuke-
lem 1987). Individual variability in growth, food intake, feed
efficiency and nutritional behaviour of O. vulgaris become
more intense in industrial culture conditions, where compe-
tition for food and territory, cannibalism and reproductive
activity are observed (Wells et al. 1983; O�Dor et al. 1984).
Growth rates and feed efficiencies performed by benthic
octopuses fed on artificial diets, such as O. vulgaris (Cerezo
. . . . . . . . . . . . . . . . . . . . . . . . . . . . . . . . . . . . . . . . . . . . . . . . . . . . . . . . . . . . . . . . . . . . . . . . . . . . . . . . . . . . . . . . . . . . . .
� 2010 The Authors
Journal compilation � 2010 Blackwell Publishing Ltd
2010. . . . . . . . . . . . . . . . . . . . . . . . . . . . . . . . . . . . . . . . . . . . . . . . . . . . . . . . . . . . . . . . . . . . . . . . . . . . . . . . . . . . . . . . . . . . . .
doi: 10.1111/j.1365-2095.2010.00769.x
Aquaculture Nutrition
Valverde et al. 2008; Quintana et al. 2008) and Octopus maya
(Domingues et al. 2007; Rosas et al. 2007, 2008), were found
inferior to those obtained with natural diets. These results
indicated that there is a gap in the available knowledge for
the successful design of an artificial diet for these organisms.
An artificial diet for octopus should be characterized by
specific organoleptic features, which correspond to its feeding
mechanisms and the structure of its upper and lower
digestive system, i.e.: (1) Stable structure: octopuses often do
not consume food right after its dispensing (Petza D., per-
sonal observation), so it is vital that it remains stable in the
water. (2) Palatability: the chemotactile capacity is much
developed in the octopus and involves responses to acids,
sugars, amino acids and nucleotides (Wells et al. 1965; Chase
& Wells 1986). (3) Large size: the octopus has a beak in its
buccal cavity, allowing the partition of big food particles
before its ingestion (Altman & Nixon 1970). Granulated,
extruded and semi-moist feeds, such as those designed for
fish, are not acceptable, because they disintegrate during the
manipulation by the octopus. (4) Consistency: the octopus
does not have the capacity to chew its food, because its
buccal cavity lacks a chewing device (i.e. teeth). Right after
the partition of food particles by the beak, digestive enzymes
are excreted outside the buccal cavity, by glands in the
periphery of the arms ring (Nixon 1984) and inside the buccal
cavity by the salivary glands. Then food is converted to a
fluid pulp, which is finally sucked up by the lips of the buccal
cavity. (5) Appropriate composition: artificial food should
include all the essential nutrient components (such as amino
acids, lipid acids, vitamins, trace elements, etc.) for the spe-
cific species, and its composition should meet the special
demands of each developmental stage.
In this study, an information theory approach was applied
to investigate the potential effects of diet, body mass and
maturity stage on growth and feed performance of O. vul-
garis. For this purpose, rearing experiments were conducted
on octopuses of various sizes and various maturity stages, fed
on six different food types (five natural and one artificial).
The design of an appropriate and effective artificial diet for
the octopus and the comparison of its performance with the
performance of the natural ones were an additional aim of
this study.
Animals used in this study, were hand-collected by SCUBA
and free diving in the Saronicos Gulf (37o30¢N-37o55¢N,
23oE-24oE). Right after their collection, octopuses were
immediately placed into 40-L plastic holding tanks, with
sufficient aeration provided by portable air pumps (HAI-
LEA, Guangdong Province, China), until their transporta-
tion to the laboratory facility, where each octopus was placed
individually in 50-, 110- or 190-L holding tanks, depending
on its size. All tanks were connected to a 2-m3 closed sea-
water system, filled with natural seawater of 38.5 g L)1
salinity. The closed seawater system is described in Katsa-
nevakis et al. (2005).
To minimize animal stress, a plastic pot was placed in all
holding tanks, to be used by the octopuses as a den and the
sides of the holding tanks were covered with a black self-
adhesive surface. Special attention was also given so that the
ratio of holding tank volume to animal body mass was more
than 150 L kg)1.
Six different food types were provided to six groups of
laboratory animals, five natural and one artificial. Natural
food types were as follows: squid (Loligo vulgaris), sardine
(Sardina pilchardus), hake (Merluccius merluccius), mussel
(Mytilus galloprovincialis) and shrimp (Parapenaeus longi-
rostris) and were provided as defrosted, viscera-free fillets.
All these food types are readily consumed by the common
octopus, and their selection was mostly based on the dif-
ferentiation of their biochemical composition, i.e. foods
with the largest possible variation in their characteristics
were included.
Bearing in mind the fact that an appropriate artificial diet
for octopus should be characterized by specific organoleptic
features (see introduction) and after a long period of exper-
imental trials for the optimization of its characteristics (in
terms of composition, structure, behaviour of the diet and its
acceptance by the experimental animals), an artificial diet
was designed.
Artificial food type design was based on gel formation
technology, which consists in enclosing the nutrient com-
pounds in a gel made of natural molecules (i.e. agar, collagen,
gelatin, alginates, etc.). Nutrient substances remain enclosed
in the grid formed by the gel and consequently they do not
diffuse in water. Artificial food provided in this study con-
sisted of hydrated squid flour transformed into gels, with the
addition of sodium alginate as agglutination factor.
Squid flour was prepared in the laboratory facilities by
freeze-drying squid paste for 72 h in a freeze-drying device
(FreeZone 4.5, LABCONCO, Kansas City, MO, USA).
Then squid flour was hydrated with distilled water in 1 : 1
. . . . . . . . . . . . . . . . . . . . . . . . . . . . . . . . . . . . . . . . . . . . . . . . . . . . . . . . . . . . . . . . . . . . . . . . . . . . . . . . . . . . . . . . . . . . . .
� 2010 The Authors
Journal compilation � 2010 Blackwell Publishing Ltd Aquaculture Nutrition
ratio of squid flour/distilled water and agglutinated with
20 g kg)1 aqueous solution of sodium alginate (FLUKA,
Sigma Aldrich, Buchs, Switzerland) in 1 : 0.6 ratio of
hydrated squid flour/aqueous solution of sodium alginate.
Small spherical proportions (approximately 10 g) of agglu-
tinated squid paste were subjected to a 3-hour coagulation
bath, in a 20 g kg)1 aqueous solution of calcium chloride
(CARLO ERBA REAGENTI, Rodano, Italy), in order for
the gels to be formed.
Experimental procedure included four feeding periods
(Table 1). At the beginning of each feeding period, all ani-
mals were subjected to a 30-day acclimatization period,
during which they adapted to their new environment and
became familiar with the food-dispensing procedure and
food type provided. During the acclimatization period, each
animal was fed on the same food type, intended to be pro-
vided during the experimental period.
The 30-day acclimatization period was followed by a
10-day experimental period. In each experimental period, six
laboratory animals participated and each of them was fed on
one of the six different food types (the five natural and the one
artificial). A total number of twenty four specimens (n = 24)
were used in the four feeding periods performed (Table 1).
Two different batches of natural food were supplied; the
first batch was provided to animals participating in feeding
periods 1 and 2, and the second batch to animals partici-
pating in feeding periods 3 and 4. Only one batch of artificial
food was prepared and provided to all animals throughout
the whole experimental procedure.
Because all specimens were collected from the sea, it was
impossible to obtain replicates of the same body mass or to
form dietary groups (i.e. groups consisted of animals fed on
the same food type) with exactly the same body mass range
(Miliou et al. 2005). Nevertheless, the average initial body
mass did not differ significantly among the six dietary groups
(ANOVAANOVA, P > 0.05) and special effort was given in order for
the body mass range to be as narrow as possible in all six
dietary groups. Furthermore, body mass was included as a
covariate in the set of candidate models so that its potential
effect would be taken into account.
During the experimental periods, food was provided
ad libitum once a day precisely at 1300 h. On a daily basis
and approximately 1 h after food dispensing, food leftovers
were collected and their dry mass was estimated by thermal
drying in an oven (U30; MEMMERT GmbH & Co.KG,
Schwabach, Germany) at 105 �C for 24 h. Conversion fac-
tors of dry-to-wet mass for each food type were estimated
and were used to convert the dry mass of food leftovers to
wet mass. To calculate the food quantity consumed daily by
each octopus, the food leftovers� wet mass was subtracted
from the wet mass of the food provided. The estimation of
consumed food was done on a dry basis, to avoid the effect of
changing moisture content during the 1-hr immersion in
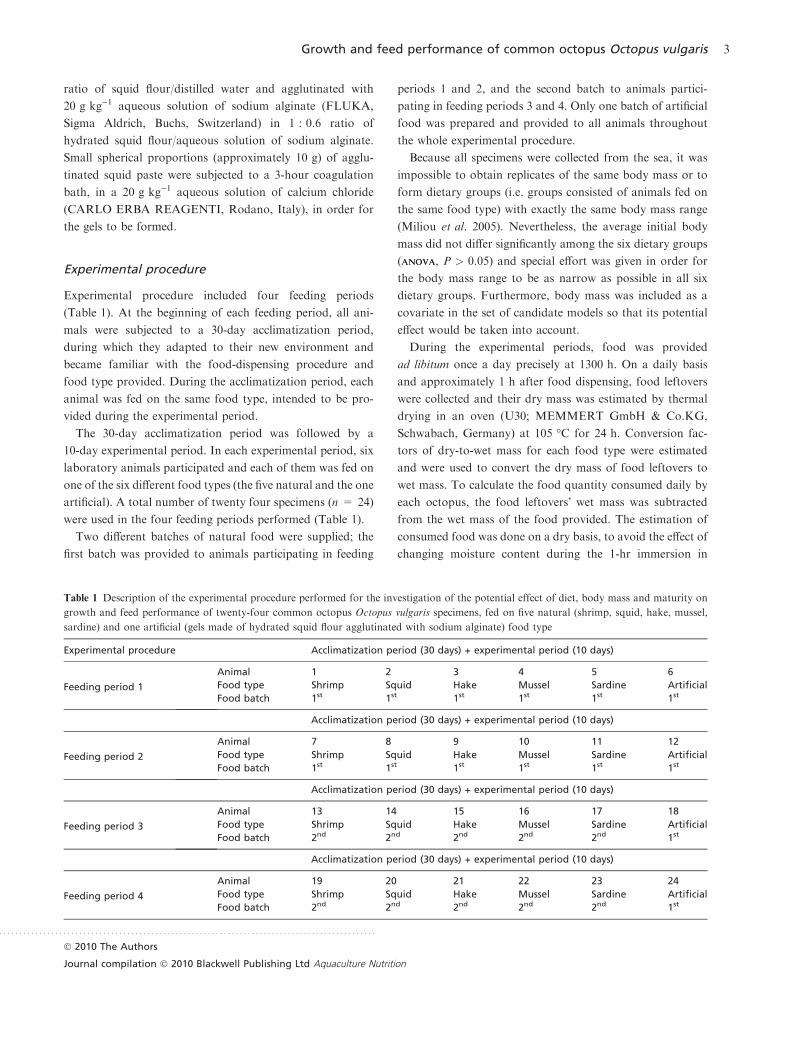
Table 1 Description of the experimental procedure performed for the investigation of the potential effect of diet, body mass and maturity on
growth and feed performance of twenty-four common octopus Octopus vulgaris specimens, fed on five natural (shrimp, squid, hake, mussel,
sardine) and one artificial (gels made of hydrated squid flour agglutinated with sodium alginate) food type
Experimental procedure Acclimatization period (30 days) + experimental period (10 days)
Feeding period 1
Animal 1 2 3 4 5 6
Food type Shrimp Squid Hake Mussel Sardine Artificial
Food batch 1st 1st 1st 1st 1st 1st
Acclimatization period (30 days) + experimental period (10 days)
Feeding period 2
Animal 7 8 9 10 11 12
Food type Shrimp Squid Hake Mussel Sardine Artificial
Food batch 1st 1st 1st 1st 1st 1st
Acclimatization period (30 days) + experimental period (10 days)
Feeding period 3
Animal 13 14 15 16 17 18
Food type Shrimp Squid Hake Mussel Sardine Artificial
Food batch 2nd 2nd 2nd 2nd 2nd 1st
Acclimatization period (30 days) + experimental period (10 days)
Feeding period 4
Animal 19 20 21 22 23 24
Food type Shrimp Squid Hake Mussel Sardine Artificial
Food batch 2nd 2nd 2nd 2nd 2nd 1st
. . . . . . . . . . . . . . . . . . . . . . . . . . . . . . . . . . . . . . . . . . . . . . . . . . . . . . . . . . . . . . . . . . . . . . . . . . . . . . . . . . . . . . . . . . . . . .
� 2010 The Authors
Journal compilation � 2010 Blackwell Publishing Ltd Aquaculture Nutrition
seawater. The faeces of each octopus were collected every day
from the outflow water, using a 500-lm nylon net, attached
to the outflows of the holding tanks. Faeces that remained at
the bottom or the sides of the tanks were removed by sucking
through a tube, which ended to a 500-lm nylon net. The
faeces produced by each specimen were preserved at )18 �C;and after the end of each feeding period, their dry mass was
estimated. The possibility of underestimating the amount of
faeces produced because of bacterial activity and lixiviation
should be mentioned.
Throughout the feeding periods, temperature remained
constant at 20.0 ± 0.5 �C, salinity at 38.5 ± 0.2 g L)1,
while pH ranged between 7.8 and 8.1. There was a photo-
period of 12 h of light/12 of hours darkness, with light period
between 0700 and 1900 h. Nitrite and unionized ammonia
was <0.1 · 10)3 and <0.05 · 10)3 g L)1, respectively.
All specimens were weighted at the beginning and the end
of the experimental period, without been anesthetized,
keeping the handling procedure as brief and calm as possible
to minimize stress.
When each experimental period ended, animals were
immediately euthanized. For this purpose, a mechanical–
physical method was used, consisting of immediate place-
ment on an ice-water mix, followed by decapitation. These
methods were chosen because they cause the least possible
pain and distress and are proposed in experiments, where
tissues are harvested for biochemical post-mortem examina-
tion (Hellebrekers et al. 2001). Each specimen was dissec-
tioned to determine sex and stage of maturity (stages 1 to 6
for each sex), according to Nigmatulin (1977).
Finally, octopuses were homogenized using a tissue
homogenizer (A950 food processor attached to KM001
kitchen machine; KENWOOD, Tokyo, Japan), freeze-dried
(FreeZone 4.5; LABCONCO, Kansas City, MO, USA) and
preserved at )18 �C, until the conduction of the biochemical
analyses. The procedure described earlier was also followed
for each batch of all food types provided, i.e. squid, shrimp,
mussel, hake, sardine and artificial.
Because the present study involved living animals held in
captivity (i.e. laboratory conditions) for a long period of time
(approximately 40–45 days), special attention was given for
their humane use and well-being. Thus, the principles and
recommendations of the Laboratory Animal Science were
taken into account, which are recapitulated on its main
guideline, the �Three R concept: Replacement, Reduction,
Refinement� (Russell & Burch 1959).
Refinement, which refers to any decrease in the incidence
or severity of painful or distressing procedures, was achieved
by optimizing the following: (a) collection (e.g. hand-collec-
tion), (b) transportation (e.g. direct transportation, use of
air-pumps), (c) husbandry (e.g. adequate size of holding
tanks and volume of available water, individual rearing,
placement of a plastic pot and black cover at the tanks,
supply of natural sea water, water recycling, long acclimati-
zation period, regular food dispensing and faeces removal,
brief and calm handling during weighting procedure, distress
and instantaneous euthanasia) and (d) environmental con-
ditions (e.g. frequent monitoring of temperature, salinity,
pH, nitrite and unionized ammonia concentration, applica-
tion of photoperiod).
Reduction, which refers to a decrease in the number of
animals required for a given experiment, was achieved by: (a)
choosing and designing the most suitable experimental pro-
cedure for the aim of the present study, (b) controlling the
environmental factors and (c) applying the most appropriate
statistical analysis for the given data, in order for the results
to be as informative as possible.
Replacement, which refers to the substitution of living
animals by alternative procedures (e.g. in vitro techniques,
computerized models, etc.), was not applicable in this study.
All these contributed to the humane use and well-being of
the laboratory animals, while at the same time a sufficiently
informative dataset was collected.
All experimental animals (n = 24) and faeces (n = 24) were
subjected to moisture, crude protein and gross energy content
determination. Food types (n = 11, two batches of the five
natural food types and one batch of the artificial food type)
were subjected to moisture, ash, crude protein, crude lipid
and gross energy content determination. All the above-
mentioned biochemical analyses were performed in triplicate.
As the flesh composition of fish, crustaceans and molluscs
varies with season and area of catch (Silva & Chamul 2000),
it was considered necessary to estimate the proximate com-
position for both batches of natural food types provided.
Dry matter was obtained by thermal drying in an oven
(U30; MEMMERT GmbH & Co.KG) at 105 �C for 24 h.
Ash was determined by incineration in a muffle furnace
(ELVEM, Spata, Greece) at 550 �C for 24 h. Crude protein
(nitrogen · 6.25) was determined according to the Hach
et al. (1985) method, and crude lipids were extracted
according to the Folch et al. (1957) method. Gross energy
content was estimated by burning samples in a bomb calo-
. . . . . . . . . . . . . . . . . . . . . . . . . . . . . . . . . . . . . . . . . . . . . . . . . . . . . . . . . . . . . . . . . . . . . . . . . . . . . . . . . . . . . . . . . . . . . .
� 2010 The Authors
Journal compilation � 2010 Blackwell Publishing Ltd Aquaculture Nutrition
rimeter (Calorimetersystem C4000A; IKA� Werke GmbH &
Co.KG, Staufen, Germany).
For each food type, the protein-to-energy ratio (P/E) was
estimated, using the formula: P/E= [crude protein content of
food (in g)] / [gross energy content of the food (in MJ)].
Specific Growth Rate (SGR, % day)1), Absolute Feeding
Rate (AFR, g day)1), Feed Efficiency (FE, %), Assimilation
Efficiency (AE, %) and Protein Retention Efficiency (PRE,
%) were estimated for each specimen for the experimental
period, using the following equations, respectively:
SGR = 100 (lnmfw – lnmiw) t)1, AFR = FIw t)1, FE = 100
(mfd – mid) FId)1, AE = 100 (Cd – Fd) Cd
)1 and PRE = 100
[(Pfd mfd - Pid mid) (Pd FId))1], where mf and mi are the final
and initial body mass, respectively (in g), t is the experimental
duration (in days), FI is the total food quantity consumed
(in g), C is the total energy content of food consumed (in J),
F is the unabsorbed energy voided through faeces (in J), Pf
and Pi are, respectively, the final and initial crude protein
content of octopus (in % dry body mass), and P is the crude
protein content of food (in % dry mass). In all the above-
mentioned equations the indices �w� and �d� correspond to wet
and dry mass, respectively.
Initial and final tissue protein content were considered to
be equal (i.e. Pid = Pfd), based on the results of other studies
that have revealed that the protein content of octopus tissue
is not affected by the animal body mass (Miliou et al. 2005).
This assumption was further tested by conducting one-way
ANOVAANOVA to the experimental data of the present study (protein
content of octopus tissue, for octopuses of various sizes, fed
on six different diets).
Estimated SGR, AFR, FE, AE and PRE for each specimen
were modelled with General Linear Models (GLMs;
McCullagh & Nelder 1989), based on an information theory
approach (Burham & Anderson 2002).
According to the information theory approach, data
analysis is taken to mean the integrated process of a priori
specification of a set of candidate models (based on the
science of the problem), model selection based on the
principle of parsimony according to Akaike�s information
criterion (AIC; Akaike 1973) and the estimation of
parameters and their precision. Information theory has been
increasingly proposed to be a better and advantageous
alternative for model selection than traditional approaches,
such as hypothesis testing (Burham & Anderson 2002).
Information theory has lately been used for model selection
in biological studies, e.g. to model absolute (Katsanevakis
2006) or relative (Katsanevakis et al. 2007a; Protopapas
et al. 2007) growth and aquatic respiration (Katsanevakis
et al. 2007b).
For each response parameter, a set of fifteen candidate
models was built using food type (ft) and maturity stage (ms)
as potential factor predictor variables, and body mass (m),
food protein content (p), food lipid content (li) and protein-to-
energy ratio (pe) as potential continuous predictor variables
(Table 2). Strongly correlated variables, such as m and ms, or
p, li and pe were not jointly included in any model. m was the
mean octopus body mass during the experimental period.
Model selection was based on the small-sample, bias-
corrected form of Akaike�s Information Criterion (AICc)
(Akaike 1973; Hurvich & Tsai 1989; Burham & Anderson
2002). The AICc differences, Di = AICc,i – AICc,min, were
computed over all candidate models. To quantify the plau-
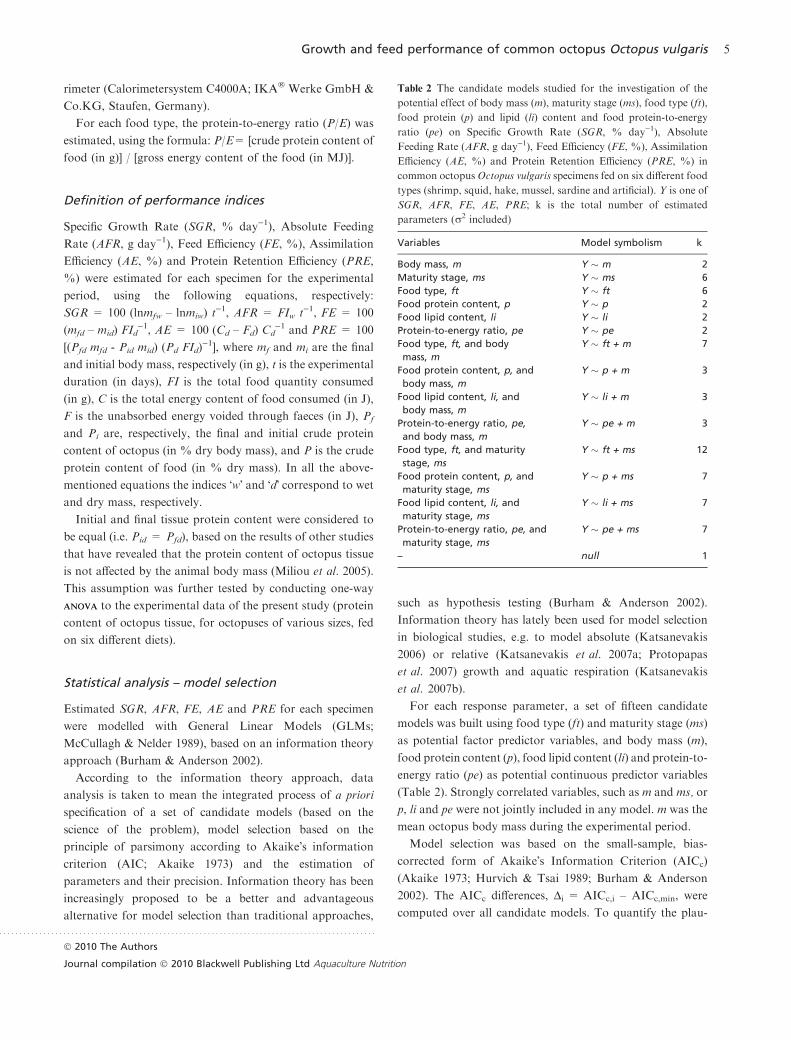
Table 2 The candidate models studied for the investigation of the
potential effect of body mass (m), maturity stage (ms), food type (ft),
food protein (p) and lipid (li) content and food protein-to-energy
ratio (pe) on Specific Growth Rate (SGR, % day)1), Absolute
Feeding Rate (AFR, g day)1), Feed Efficiency (FE, %), Assimilation
Efficiency (AE, %) and Protein Retention Efficiency (PRE, %) in
common octopusOctopus vulgaris specimens fed on six different food
types (shrimp, squid, hake, mussel, sardine and artificial). Y is one of
SGR, AFR, FE, AE, PRE; k is the total number of estimated
parameters (r2 included)
Variables Model symbolism k
Body mass, m Y � m 2
Maturity stage, ms Y � ms 6
Food type, ft Y � ft 6
Food protein content, p Y � p 2
Food lipid content, li Y � li 2
Protein-to-energy ratio, pe Y � pe 2
Food type, ft, and body
mass, m
Y � ft + m 7
Food protein content, p, and
body mass, m
Y � p + m 3
Food lipid content, li, and
body mass, m
Y � li + m 3
Protein-to-energy ratio, pe,
and body mass, m
Y � pe + m 3
Food type, ft, and maturity
stage, ms
Y � ft + ms 12
Food protein content, p, and
maturity stage, ms
Y � p + ms 7
Food lipid content, li, and
maturity stage, ms
Y � li + ms 7
Protein-to-energy ratio, pe, and
maturity stage, ms
Y � pe + ms 7
– null 1
. . . . . . . . . . . . . . . . . . . . . . . . . . . . . . . . . . . . . . . . . . . . . . . . . . . . . . . . . . . . . . . . . . . . . . . . . . . . . . . . . . . . . . . . . . . . . .
� 2010 The Authors
Journal compilation � 2010 Blackwell Publishing Ltd Aquaculture Nutrition
sibility of each model, given the data and the set of fifteen
models, the �Akaike weight� wi of each model was calculated,
where wi ¼ expð�0:5DiÞ=P15
j¼1expð�0:5DjÞ. The �Akaike
weight� is considered as the weight of evidence in favour of
model i being the actual best model of the available set of
models (Akaike 1983; Buckland et al. 1997; Burham &
Anderson 2002). Models with Di > 10 have essentially no
support and might be omitted from further consideration,
while models with Di < 2 have substantial support (Burham
& Anderson 2002).
Analysis of variance (ANOVAANOVA) at 95% confidence level was
performed for the comparison of means of (i) octopus tissue
protein content, body mass, SGR, FE and PRE for each
dietary group and (ii) protein content, lipid content and
energy content of the six food types provided. In the cases
where statistically significant differences were detected,
Tukey�s HSD multiple range tests were performed, to deter-
mine homogeneous groups of means (Zar 1999). All statistical
analyses were carried out, using the Statgraphics Plus 5
(Statistical Graphics Corp., Warrenton, VA, USA) software.
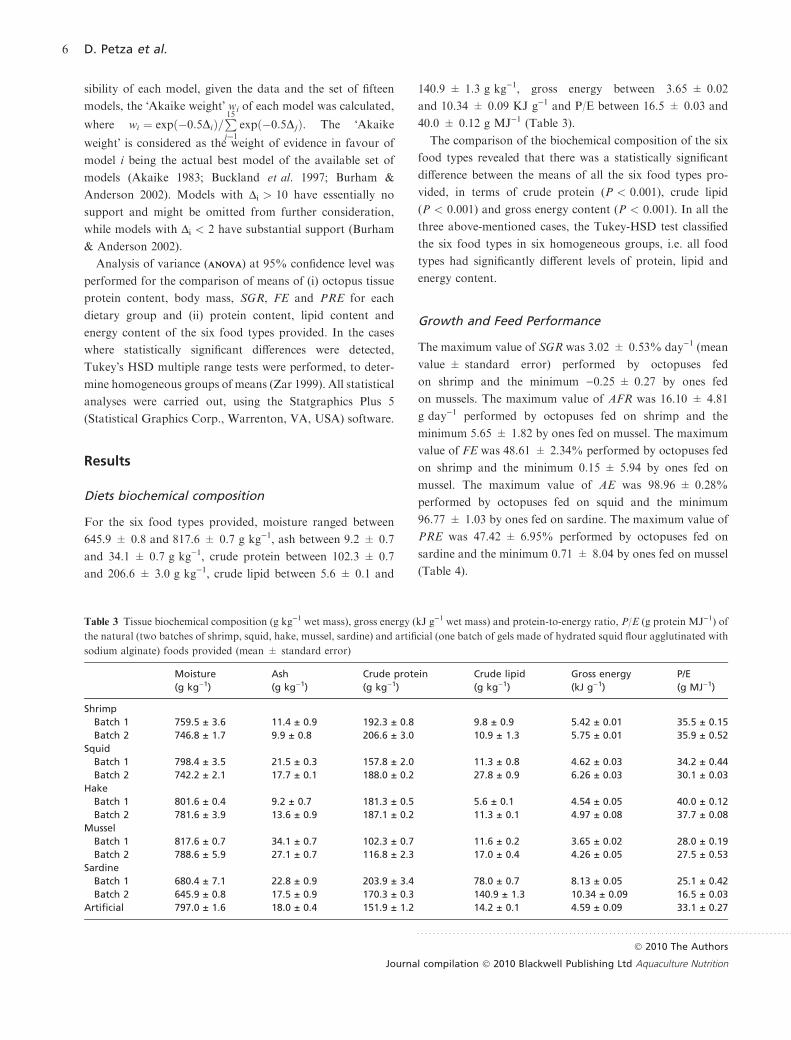
For the six food types provided, moisture ranged between
645.9 ± 0.8 and 817.6 ± 0.7 g kg)1, ash between 9.2 ± 0.7
and 34.1 ± 0.7 g kg)1, crude protein between 102.3 ± 0.7
and 206.6 ± 3.0 g kg)1, crude lipid between 5.6 ± 0.1 and
140.9 ± 1.3 g kg)1, gross energy between 3.65 ± 0.02
and 10.34 ± 0.09 KJ g)1 and P/E between 16.5 ± 0.03 and
40.0 ± 0.12 g MJ)1 (Table 3).
The comparison of the biochemical composition of the six
food types revealed that there was a statistically significant
difference between the means of all the six food types pro-
vided, in terms of crude protein (P < 0.001), crude lipid
(P < 0.001) and gross energy content (P < 0.001). In all the
three above-mentioned cases, the Tukey-HSD test classified
the six food types in six homogeneous groups, i.e. all food
types had significantly different levels of protein, lipid and
energy content.
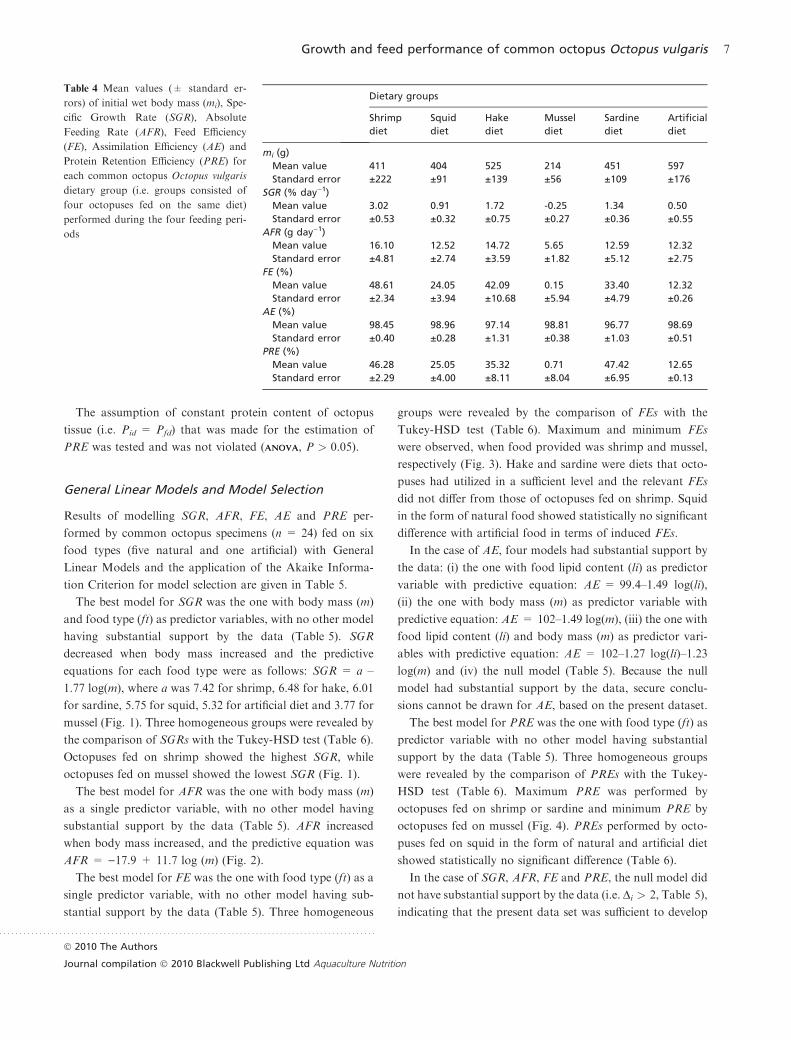
The maximum value of SGR was 3.02 ± 0.53% day)1 (mean
value ± standard error) performed by octopuses fed
on shrimp and the minimum )0.25 ± 0.27 by ones fed
on mussels. The maximum value of AFR was 16.10 ± 4.81
g day)1 performed by octopuses fed on shrimp and the
minimum 5.65 ± 1.82 by ones fed on mussel. The maximum
value of FE was 48.61 ± 2.34% performed by octopuses fed
on shrimp and the minimum 0.15 ± 5.94 by ones fed on
mussel. The maximum value of AE was 98.96 ± 0.28%
performed by octopuses fed on squid and the minimum
96.77 ± 1.03 by ones fed on sardine. The maximum value of
PRE was 47.42 ± 6.95% performed by octopuses fed on
sardine and the minimum 0.71 ± 8.04 by ones fed on mussel
(Table 4).
Table 3 Tissue biochemical composition (g kg)1 wet mass), gross energy (kJ g)1 wet mass) and protein-to-energy ratio, P/E (g protein MJ)1) of
the natural (two batches of shrimp, squid, hake, mussel, sardine) and artificial (one batch of gels made of hydrated squid flour agglutinated with
sodium alginate) foods provided (mean ± standard error)
Moisture
(g kg)1)
Ash
(g kg)1)
Crude protein
(g kg)1)
Crude lipid
(g kg)1)
Gross energy
(kJ g)1)
P/E
(g MJ)1)
Shrimp
Batch 1 759.5 ± 3.6 11.4 ± 0.9 192.3 ± 0.8 9.8 ± 0.9 5.42 ± 0.01 35.5 ± 0.15
Batch 2 746.8 ± 1.7 9.9 ± 0.8 206.6 ± 3.0 10.9 ± 1.3 5.75 ± 0.01 35.9 ± 0.52
Squid
Batch 1 798.4 ± 3.5 21.5 ± 0.3 157.8 ± 2.0 11.3 ± 0.8 4.62 ± 0.03 34.2 ± 0.44
Batch 2 742.2 ± 2.1 17.7 ± 0.1 188.0 ± 0.2 27.8 ± 0.9 6.26 ± 0.03 30.1 ± 0.03
Hake
Batch 1 801.6 ± 0.4 9.2 ± 0.7 181.3 ± 0.5 5.6 ± 0.1 4.54 ± 0.05 40.0 ± 0.12
Batch 2 781.6 ± 3.9 13.6 ± 0.9 187.1 ± 0.2 11.3 ± 0.1 4.97 ± 0.08 37.7 ± 0.08
Mussel
Batch 1 817.6 ± 0.7 34.1 ± 0.7 102.3 ± 0.7 11.6 ± 0.2 3.65 ± 0.02 28.0 ± 0.19
Batch 2 788.6 ± 5.9 27.1 ± 0.7 116.8 ± 2.3 17.0 ± 0.4 4.26 ± 0.05 27.5 ± 0.53
Sardine
Batch 1 680.4 ± 7.1 22.8 ± 0.9 203.9 ± 3.4 78.0 ± 0.7 8.13 ± 0.05 25.1 ± 0.42
Batch 2 645.9 ± 0.8 17.5 ± 0.9 170.3 ± 0.3 140.9 ± 1.3 10.34 ± 0.09 16.5 ± 0.03
Artificial 797.0 ± 1.6 18.0 ± 0.4 151.9 ± 1.2 14.2 ± 0.1 4.59 ± 0.09 33.1 ± 0.27
. . . . . . . . . . . . . . . . . . . . . . . . . . . . . . . . . . . . . . . . . . . . . . . . . . . . . . . . . . . . . . . . . . . . . . . . . . . . . . . . . . . . . . . . . . . . . .
� 2010 The Authors
Journal compilation � 2010 Blackwell Publishing Ltd Aquaculture Nutrition
The assumption of constant protein content of octopus
tissue (i.e. Pid = Pfd) that was made for the estimation of
PRE was tested and was not violated (ANOVAANOVA, P > 0.05).
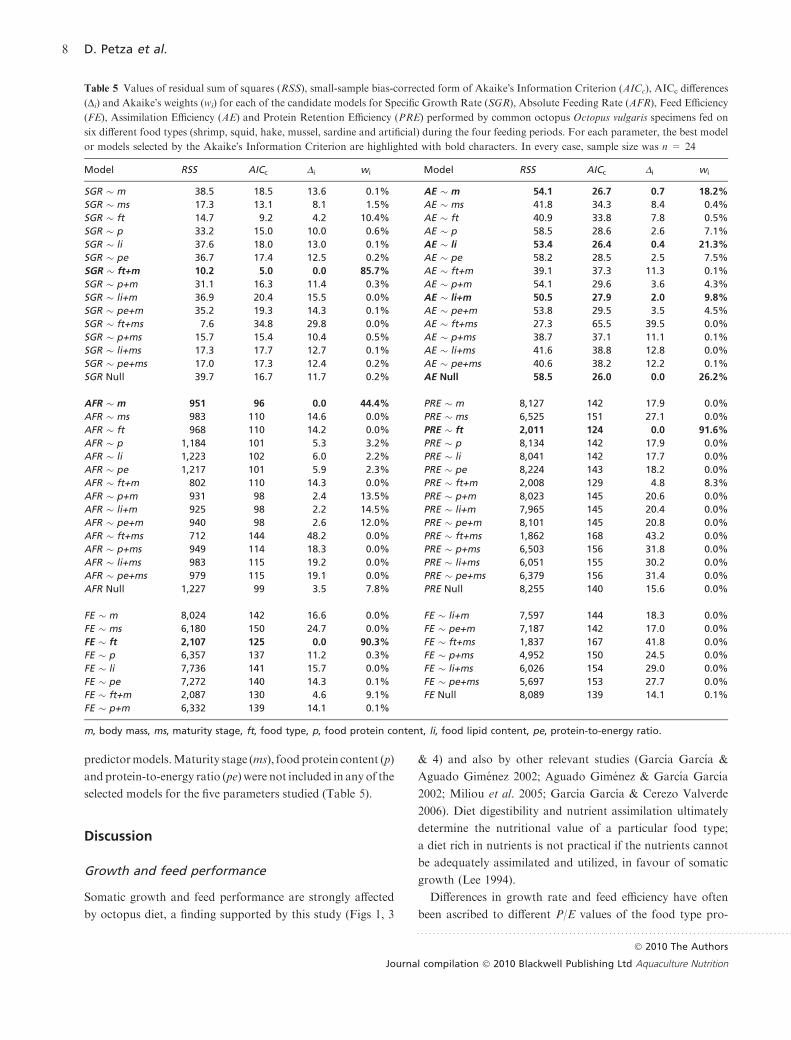
Results of modelling SGR, AFR, FE, AE and PRE per-
formed by common octopus specimens (n = 24) fed on six
food types (five natural and one artificial) with General
Linear Models and the application of the Akaike Informa-
tion Criterion for model selection are given in Table 5.
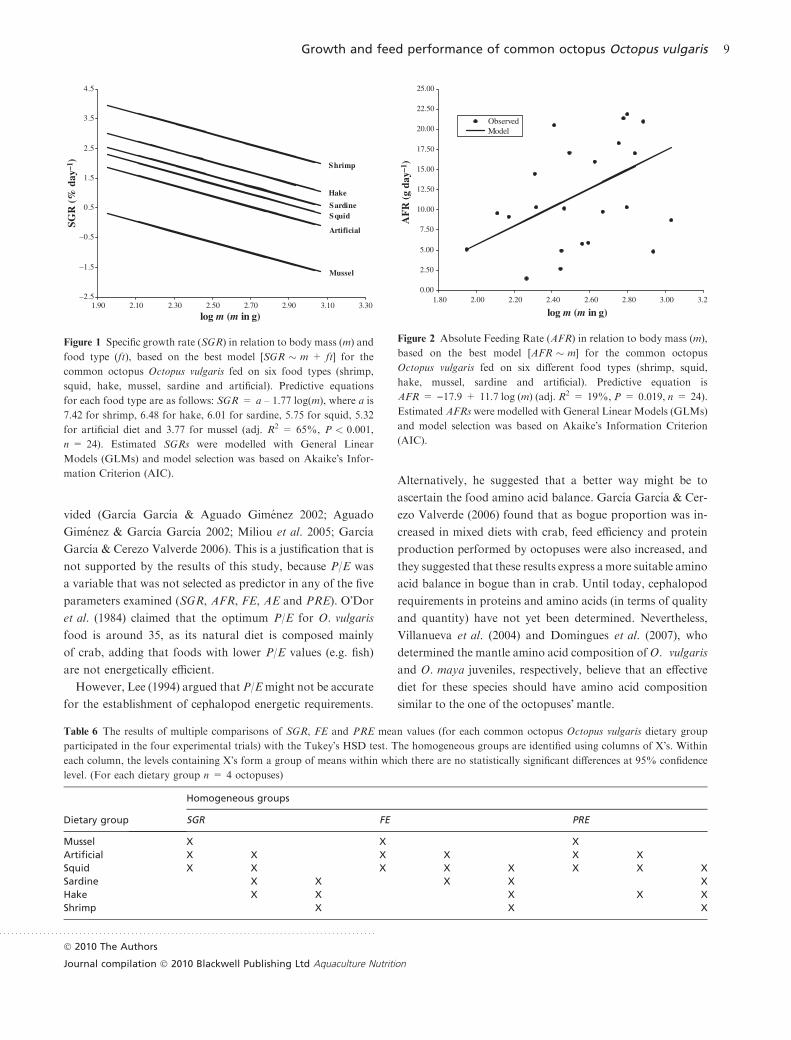
The best model for SGR was the one with body mass (m)
and food type (ft) as predictor variables, with no other model
having substantial support by the data (Table 5). SGR
decreased when body mass increased and the predictive
equations for each food type were as follows: SGR = a –
1.77 log(m), where a was 7.42 for shrimp, 6.48 for hake, 6.01
for sardine, 5.75 for squid, 5.32 for artificial diet and 3.77 for
mussel (Fig. 1). Three homogeneous groups were revealed by
the comparison of SGRs with the Tukey-HSD test (Table 6).
Octopuses fed on shrimp showed the highest SGR, while
octopuses fed on mussel showed the lowest SGR (Fig. 1).
The best model for AFR was the one with body mass (m)
as a single predictor variable, with no other model having
substantial support by the data (Table 5). AFR increased
when body mass increased, and the predictive equation was
AFR = )17.9 + 11.7 log (m) (Fig. 2).
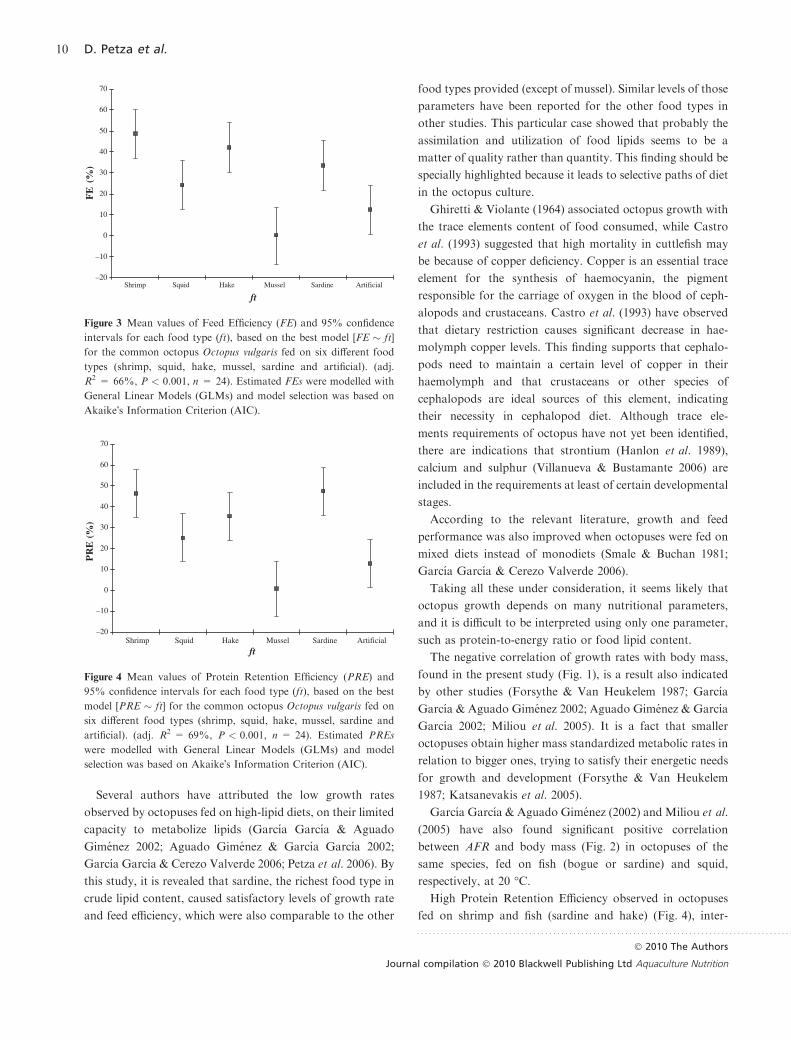
The best model for FE was the one with food type (ft) as a
single predictor variable, with no other model having sub-
stantial support by the data (Table 5). Three homogeneous
groups were revealed by the comparison of FEs with the
Tukey-HSD test (Table 6). Maximum and minimum FEs
were observed, when food provided was shrimp and mussel,
respectively (Fig. 3). Hake and sardine were diets that octo-
puses had utilized in a sufficient level and the relevant FEs
did not differ from those of octopuses fed on shrimp. Squid
in the form of natural food showed statistically no significant
difference with artificial food in terms of induced FEs.
In the case of AE, four models had substantial support by
the data: (i) the one with food lipid content (li) as predictor
variable with predictive equation: AE = 99.4–1.49 log(li),
(ii) the one with body mass (m) as predictor variable with
predictive equation: AE = 102–1.49 log(m), (iii) the one with
food lipid content (li) and body mass (m) as predictor vari-
ables with predictive equation: AE = 102–1.27 log(li)–1.23
log(m) and (iv) the null model (Table 5). Because the null
model had substantial support by the data, secure conclu-
sions cannot be drawn for AE, based on the present dataset.
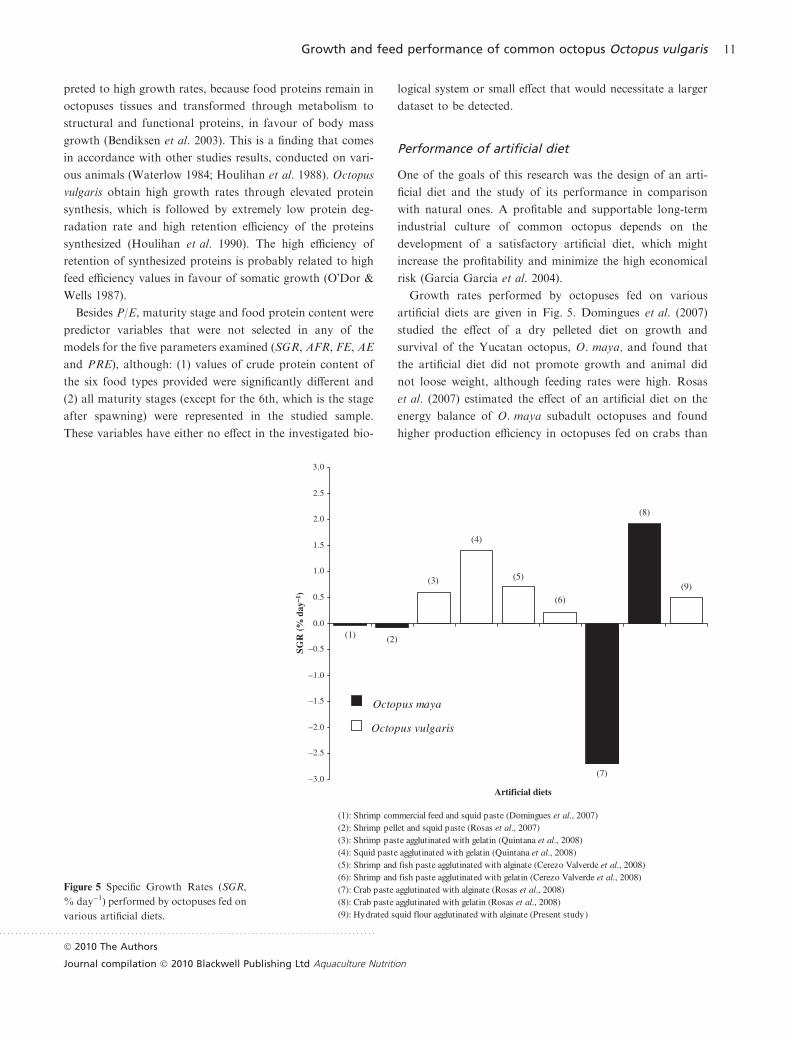
The best model for PRE was the one with food type (ft) as
predictor variable with no other model having substantial
support by the data (Table 5). Three homogeneous groups
were revealed by the comparison of PREs with the Tukey-
HSD test (Table 6). Maximum PRE was performed by
octopuses fed on shrimp or sardine and minimum PRE by
octopuses fed on mussel (Fig. 4). PREs performed by octo-
puses fed on squid in the form of natural and artificial diet
showed statistically no significant difference (Table 6).
In the case of SGR, AFR, FE and PRE, the null model did
not have substantial support by the data (i.e. Di > 2, Table 5),
indicating that the present data set was sufficient to develop
Table 4 Mean values (± standard er-
rors) of initial wet body mass (mi), Spe-
cific Growth Rate (SGR), Absolute
Feeding Rate (AFR), Feed Efficiency
(FE), Assimilation Efficiency (AE) and
Protein Retention Efficiency (PRE) for
each common octopus Octopus vulgaris
dietary group (i.e. groups consisted of
four octopuses fed on the same diet)
performed during the four feeding peri-
ods
Dietary groups
Shrimp
diet
Squid
diet
Hake
diet
Mussel
diet
Sardine
diet
Artificial
diet
mi (g)
Mean value 411 404 525 214 451 597
Standard error ±222 ±91 ±139 ±56 ±109 ±176
SGR (% day)1)
Mean value 3.02 0.91 1.72 -0.25 1.34 0.50
Standard error ±0.53 ±0.32 ±0.75 ±0.27 ±0.36 ±0.55
AFR (g day)1)
Mean value 16.10 12.52 14.72 5.65 12.59 12.32
Standard error ±4.81 ±2.74 ±3.59 ±1.82 ±5.12 ±2.75
FE (%)
Mean value 48.61 24.05 42.09 0.15 33.40 12.32
Standard error ±2.34 ±3.94 ±10.68 ±5.94 ±4.79 ±0.26
AE (%)
Mean value 98.45 98.96 97.14 98.81 96.77 98.69
Standard error ±0.40 ±0.28 ±1.31 ±0.38 ±1.03 ±0.51
PRE (%)
Mean value 46.28 25.05 35.32 0.71 47.42 12.65
Standard error ±2.29 ±4.00 ±8.11 ±8.04 ±6.95 ±0.13
. . . . . . . . . . . . . . . . . . . . . . . . . . . . . . . . . . . . . . . . . . . . . . . . . . . . . . . . . . . . . . . . . . . . . . . . . . . . . . . . . . . . . . . . . . . . . .
� 2010 The Authors
Journal compilation � 2010 Blackwell Publishing Ltd Aquaculture Nutrition
predictormodels.Maturity stage (ms), foodprotein content (p)
and protein-to-energy ratio (pe) were not included in any of the
selected models for the five parameters studied (Table 5).
Somatic growth and feed performance are strongly affected
by octopus diet, a finding supported by this study (Figs 1, 3
& 4) and also by other relevant studies (Garcıa Garcıa &
Aguado Gimenez 2002; Aguado Gimenez & Garcıa Garcıa
2002; Miliou et al. 2005; Garcıa Garcıa & Cerezo Valverde
2006). Diet digestibility and nutrient assimilation ultimately
determine the nutritional value of a particular food type;
a diet rich in nutrients is not practical if the nutrients cannot
be adequately assimilated and utilized, in favour of somatic
growth (Lee 1994).
Differences in growth rate and feed efficiency have often
been ascribed to different P/E values of the food type pro-
Table 5 Values of residual sum of squares (RSS), small-sample bias-corrected form of Akaike�s Information Criterion (AICc), AICc differences
(Di) and Akaike�s weights (wi) for each of the candidate models for Specific Growth Rate (SGR), Absolute Feeding Rate (AFR), Feed Efficiency
(FE), Assimilation Efficiency (AE) and Protein Retention Efficiency (PRE) performed by common octopus Octopus vulgaris specimens fed on
six different food types (shrimp, squid, hake, mussel, sardine and artificial) during the four feeding periods. For each parameter, the best model
or models selected by the Akaike�s Information Criterion are highlighted with bold characters. In every case, sample size was n = 24
Model RSS AICc Di wi Model RSS AICc Di wi
SGR � m 38.5 18.5 13.6 0.1% AE � m 54.1 26.7 0.7 18.2%
SGR � ms 17.3 13.1 8.1 1.5% AE � ms 41.8 34.3 8.4 0.4%
SGR � ft 14.7 9.2 4.2 10.4% AE � ft 40.9 33.8 7.8 0.5%
SGR � p 33.2 15.0 10.0 0.6% AE � p 58.5 28.6 2.6 7.1%
SGR � li 37.6 18.0 13.0 0.1% AE � li 53.4 26.4 0.4 21.3%
SGR � pe 36.7 17.4 12.5 0.2% AE � pe 58.2 28.5 2.5 7.5%
SGR � ft+m 10.2 5.0 0.0 85.7% AE � ft+m 39.1 37.3 11.3 0.1%
SGR � p+m 31.1 16.3 11.4 0.3% AE � p+m 54.1 29.6 3.6 4.3%
SGR � li+m 36.9 20.4 15.5 0.0% AE � li+m 50.5 27.9 2.0 9.8%
SGR � pe+m 35.2 19.3 14.3 0.1% AE � pe+m 53.8 29.5 3.5 4.5%
SGR � ft+ms 7.6 34.8 29.8 0.0% AE � ft+ms 27.3 65.5 39.5 0.0%
SGR � p+ms 15.7 15.4 10.4 0.5% AE � p+ms 38.7 37.1 11.1 0.1%
SGR � li+ms 17.3 17.7 12.7 0.1% AE � li+ms 41.6 38.8 12.8 0.0%
SGR � pe+ms 17.0 17.3 12.4 0.2% AE � pe+ms 40.6 38.2 12.2 0.1%
SGR Null 39.7 16.7 11.7 0.2% AE Null 58.5 26.0 0.0 26.2%
AFR � m 951 96 0.0 44.4% PRE � m 8,127 142 17.9 0.0%
AFR � ms 983 110 14.6 0.0% PRE � ms 6,525 151 27.1 0.0%
AFR � ft 968 110 14.2 0.0% PRE � ft 2,011 124 0.0 91.6%
AFR � p 1,184 101 5.3 3.2% PRE � p 8,134 142 17.9 0.0%
AFR � li 1,223 102 6.0 2.2% PRE � li 8,041 142 17.7 0.0%
AFR � pe 1,217 101 5.9 2.3% PRE � pe 8,224 143 18.2 0.0%
AFR � ft+m 802 110 14.3 0.0% PRE � ft+m 2,008 129 4.8 8.3%
AFR � p+m 931 98 2.4 13.5% PRE � p+m 8,023 145 20.6 0.0%
AFR � li+m 925 98 2.2 14.5% PRE � li+m 7,965 145 20.4 0.0%
AFR � pe+m 940 98 2.6 12.0% PRE � pe+m 8,101 145 20.8 0.0%
AFR � ft+ms 712 144 48.2 0.0% PRE � ft+ms 1,862 168 43.2 0.0%
AFR � p+ms 949 114 18.3 0.0% PRE � p+ms 6,503 156 31.8 0.0%
AFR � li+ms 983 115 19.2 0.0% PRE � li+ms 6,051 155 30.2 0.0%
AFR � pe+ms 979 115 19.1 0.0% PRE � pe+ms 6,379 156 31.4 0.0%
AFR Null 1,227 99 3.5 7.8% PRE Null 8,255 140 15.6 0.0%
FE � m 8,024 142 16.6 0.0% FE � li+m 7,597 144 18.3 0.0%
FE � ms 6,180 150 24.7 0.0% FE � pe+m 7,187 142 17.0 0.0%
FE � ft 2,107 125 0.0 90.3% FE � ft+ms 1,837 167 41.8 0.0%
FE � p 6,357 137 11.2 0.3% FE � p+ms 4,952 150 24.5 0.0%
FE � li 7,736 141 15.7 0.0% FE � li+ms 6,026 154 29.0 0.0%
FE � pe 7,272 140 14.3 0.1% FE � pe+ms 5,697 153 27.7 0.0%
FE � ft+m 2,087 130 4.6 9.1% FE Null 8,089 139 14.1 0.1%
FE � p+m 6,332 139 14.1 0.1%
m, body mass, ms, maturity stage, ft, food type, p, food protein content, li, food lipid content, pe, protein-to-energy ratio.
. . . . . . . . . . . . . . . . . . . . . . . . . . . . . . . . . . . . . . . . . . . . . . . . . . . . . . . . . . . . . . . . . . . . . . . . . . . . . . . . . . . . . . . . . . . . . .
� 2010 The Authors
Journal compilation � 2010 Blackwell Publishing Ltd Aquaculture Nutrition
vided (Garcıa Garcıa & Aguado Gimenez 2002; Aguado
Gimenez & Garcıa Garcıa 2002; Miliou et al. 2005; Garcıa
Garcıa & Cerezo Valverde 2006). This is a justification that is
not supported by the results of this study, because P/E was
a variable that was not selected as predictor in any of the five
parameters examined (SGR, AFR, FE, AE and PRE). O�Dor
et al. (1984) claimed that the optimum P/E for O. vulgaris
food is around 35, as its natural diet is composed mainly
of crab, adding that foods with lower P/E values (e.g. fish)
are not energetically efficient.
However, Lee (1994) argued that P/Emight not be accurate
for the establishment of cephalopod energetic requirements.
Alternatively, he suggested that a better way might be to
ascertain the food amino acid balance. Garcıa Garcıa & Cer-
ezo Valverde (2006) found that as bogue proportion was in-
creased in mixed diets with crab, feed efficiency and protein
production performed by octopuses were also increased, and
they suggested that these results express amore suitable amino
acid balance in bogue than in crab. Until today, cephalopod
requirements in proteins and amino acids (in terms of quality
and quantity) have not yet been determined. Nevertheless,
Villanueva et al. (2004) and Domingues et al. (2007), who
determined the mantle amino acid composition ofO. vulgaris
and O. maya juveniles, respectively, believe that an effective
diet for these species should have amino acid composition
similar to the one of the octopuses� mantle.
–2.5
–1.5
–0.5
0.5
1.5
2.5
3.5
4.5
1.90 2.10 2.30 2.50 2.70 2.90 3.10 3.30
log m (m in g)
SGR
(%
day
–1)
Hake
SardineSquid
Artificial
Shrimp
Mussel
Figure 1 Specific growth rate (SGR) in relation to body mass (m) and
food type (ft), based on the best model [SGR � m + ft] for the
common octopus Octopus vulgaris fed on six food types (shrimp,
squid, hake, mussel, sardine and artificial). Predictive equations
for each food type are as follows: SGR = a – 1.77 log(m), where a is
7.42 for shrimp, 6.48 for hake, 6.01 for sardine, 5.75 for squid, 5.32
for artificial diet and 3.77 for mussel (adj. R2 = 65%, P < 0.001,
n = 24). Estimated SGRs were modelled with General Linear
Models (GLMs) and model selection was based on Akaike�s Infor-
mation Criterion (AIC).
Table 6 The results of multiple comparisons of SGR, FE and PRE mean values (for each common octopus Octopus vulgaris dietary group
participated in the four experimental trials) with the Tukey�s HSD test. The homogeneous groups are identified using columns of X�s. Within
each column, the levels containing X�s form a group of means within which there are no statistically significant differences at 95% confidence
level. (For each dietary group n = 4 octopuses)
Dietary group
Homogeneous groups
SGR FE PRE
Mussel X X X
Artificial X X X X X X
Squid X X X X X X X X
Sardine X X X X X
Hake X X X X X
Shrimp X X X
0.00
2.50
5.00
7.50
10.00
12.50
15.00
17.50
20.00
22.50
25.00
1.80 2.00 2.20 2.40 2.60 2.80 3.00 3.2
ObservedModel
log m (m in g)
AF
R (
g da
y–1 )
Figure 2 Absolute Feeding Rate (AFR) in relation to body mass (m),
based on the best model [AFR � m] for the common octopus
Octopus vulgaris fed on six different food types (shrimp, squid,
hake, mussel, sardine and artificial). Predictive equation is
AFR = )17.9 + 11.7 log (m) (adj. R2 = 19%, P = 0.019, n = 24).
Estimated AFRs were modelled with General Linear Models (GLMs)
and model selection was based on Akaike�s Information Criterion
(AIC).
. . . . . . . . . . . . . . . . . . . . . . . . . . . . . . . . . . . . . . . . . . . . . . . . . . . . . . . . . . . . . . . . . . . . . . . . . . . . . . . . . . . . . . . . . . . . . .
� 2010 The Authors
Journal compilation � 2010 Blackwell Publishing Ltd Aquaculture Nutrition
Several authors have attributed the low growth rates
observed by octopuses fed on high-lipid diets, on their limited
capacity to metabolize lipids (Garcıa Garcıa & Aguado
Gimenez 2002; Aguado Gimenez & Garcıa Garcıa 2002;
Garcıa Garcıa & Cerezo Valverde 2006; Petza et al. 2006). By
this study, it is revealed that sardine, the richest food type in
crude lipid content, caused satisfactory levels of growth rate
and feed efficiency, which were also comparable to the other
food types provided (except of mussel). Similar levels of those
parameters have been reported for the other food types in
other studies. This particular case showed that probably the
assimilation and utilization of food lipids seems to be a
matter of quality rather than quantity. This finding should be
specially highlighted because it leads to selective paths of diet
in the octopus culture.
Ghiretti & Violante (1964) associated octopus growth with
the trace elements content of food consumed, while Castro
et al. (1993) suggested that high mortality in cuttlefish may
be because of copper deficiency. Copper is an essential trace
element for the synthesis of haemocyanin, the pigment
responsible for the carriage of oxygen in the blood of ceph-
alopods and crustaceans. Castro et al. (1993) have observed
that dietary restriction causes significant decrease in hae-
molymph copper levels. This finding supports that cephalo-
pods need to maintain a certain level of copper in their
haemolymph and that crustaceans or other species of
cephalopods are ideal sources of this element, indicating
their necessity in cephalopod diet. Although trace ele-
ments requirements of octopus have not yet been identified,
there are indications that strontium (Hanlon et al. 1989),
calcium and sulphur (Villanueva & Bustamante 2006) are
included in the requirements at least of certain developmental
stages.
According to the relevant literature, growth and feed
performance was also improved when octopuses were fed on
mixed diets instead of monodiets (Smale & Buchan 1981;
Garcıa Garcıa & Cerezo Valverde 2006).
Taking all these under consideration, it seems likely that
octopus growth depends on many nutritional parameters,
and it is difficult to be interpreted using only one parameter,
such as protein-to-energy ratio or food lipid content.
The negative correlation of growth rates with body mass,
found in the present study (Fig. 1), is a result also indicated
by other studies (Forsythe & Van Heukelem 1987; Garcıa
Garcıa & Aguado Gimenez 2002; Aguado Gimenez & Garcıa
Garcıa 2002; Miliou et al. 2005). It is a fact that smaller
octopuses obtain higher mass standardized metabolic rates in
relation to bigger ones, trying to satisfy their energetic needs
for growth and development (Forsythe & Van Heukelem
1987; Katsanevakis et al. 2005).
Garcıa Garcıa & Aguado Gimenez (2002) and Miliou et al.
(2005) have also found significant positive correlation
between AFR and body mass (Fig. 2) in octopuses of the
same species, fed on fish (bogue or sardine) and squid,
respectively, at 20 �C.High Protein Retention Efficiency observed in octopuses
fed on shrimp and fish (sardine and hake) (Fig. 4), inter-
–20
–10
0
10
20
30
40
50
60
70
Shrimp Squid Hake Mussel Sardine Artificial
ft
FE
(
)
Figure 3 Mean values of Feed Efficiency (FE) and 95% confidence
intervals for each food type (ft), based on the best model [FE � ft]
for the common octopus Octopus vulgaris fed on six different food
types (shrimp, squid, hake, mussel, sardine and artificial). (adj.
R2 = 66%, P < 0.001, n = 24). Estimated FEs were modelled with
General Linear Models (GLMs) and model selection was based on
Akaike�s Information Criterion (AIC).
–20
–10
0
10
20
30
40
50
60
70
Shrimp Squid Hake Mussel Sardine Artificial
ft
PR
E (
)
Figure 4 Mean values of Protein Retention Efficiency (PRE) and
95% confidence intervals for each food type (ft), based on the best
model [PRE � ft] for the common octopus Octopus vulgaris fed on
six different food types (shrimp, squid, hake, mussel, sardine and
artificial). (adj. R2 = 69%, P < 0.001, n = 24). Estimated PREs
were modelled with General Linear Models (GLMs) and model
selection was based on Akaike�s Information Criterion (AIC).
. . . . . . . . . . . . . . . . . . . . . . . . . . . . . . . . . . . . . . . . . . . . . . . . . . . . . . . . . . . . . . . . . . . . . . . . . . . . . . . . . . . . . . . . . . . . . .
� 2010 The Authors
Journal compilation � 2010 Blackwell Publishing Ltd Aquaculture Nutrition
preted to high growth rates, because food proteins remain in
octopuses tissues and transformed through metabolism to
structural and functional proteins, in favour of body mass
growth (Bendiksen et al. 2003). This is a finding that comes
in accordance with other studies results, conducted on vari-
ous animals (Waterlow 1984; Houlihan et al. 1988). Octopus
vulgaris obtain high growth rates through elevated protein
synthesis, which is followed by extremely low protein deg-
radation rate and high retention efficiency of the proteins
synthesized (Houlihan et al. 1990). The high efficiency of
retention of synthesized proteins is probably related to high
feed efficiency values in favour of somatic growth (O�Dor &
Wells 1987).
Besides P/E, maturity stage and food protein content were
predictor variables that were not selected in any of the
models for the five parameters examined (SGR, AFR, FE, AE
and PRE), although: (1) values of crude protein content of
the six food types provided were significantly different and
(2) all maturity stages (except for the 6th, which is the stage
after spawning) were represented in the studied sample.
These variables have either no effect in the investigated bio-
logical system or small effect that would necessitate a larger
dataset to be detected.
One of the goals of this research was the design of an arti-
ficial diet and the study of its performance in comparison
with natural ones. A profitable and supportable long-term
industrial culture of common octopus depends on the
development of a satisfactory artificial diet, which might
increase the profitability and minimize the high economical
risk (Garcıa Garcıa et al. 2004).
Growth rates performed by octopuses fed on various
artificial diets are given in Fig. 5. Domingues et al. (2007)
studied the effect of a dry pelleted diet on growth and
survival of the Yucatan octopus, O. maya, and found that
the artificial diet did not promote growth and animal did
not loose weight, although feeding rates were high. Rosas
et al. (2007) estimated the effect of an artificial diet on the
energy balance of O. maya subadult octopuses and found
higher production efficiency in octopuses fed on crabs than
(1)
(9)
(8)
(7)
(5)
(4)
(3)
(2)
(6)
–3.0
–2.5
–2.0
–1.5
–1.0
–0.5
0.0
0.5
1.0
1.5
2.0
2.5
3.0
Artificial diets
SG
R (
d
ay–1
)
Octopus maya
Octopus vulgaris
(1): Shrimp commercial feed and squid paste (Domingues et al., 2007)(2): Shrimp pellet and squid paste (Rosas et al., 2007) (3): Shrimp paste agglutinated with gelatin (Quintana et al., 2008)(4): Squid paste agglutinated with gelatin (Quintana et al., 2008)(5): Shrimp and fish paste agglutinated with alginate (Cerezo Valverde et al., 2008)(6): Shrimp and fish paste agglutinated with gelatin (Cerezo Valverde et al., 2008) (7): Crab paste agglutinated with alginate (Rosas et al., 2008) (8): Crab paste agglutinated with gelatin (Rosas et al., 2008) (9): Hydrated squid flour agglutinated with alginate (Present study)
Figure 5 Specific Growth Rates (SGR,
% day)1) performed by octopuses fed on
various artificial diets.
. . . . . . . . . . . . . . . . . . . . . . . . . . . . . . . . . . . . . . . . . . . . . . . . . . . . . . . . . . . . . . . . . . . . . . . . . . . . . . . . . . . . . . . . . . . . . .
� 2010 The Authors
Journal compilation � 2010 Blackwell Publishing Ltd Aquaculture Nutrition
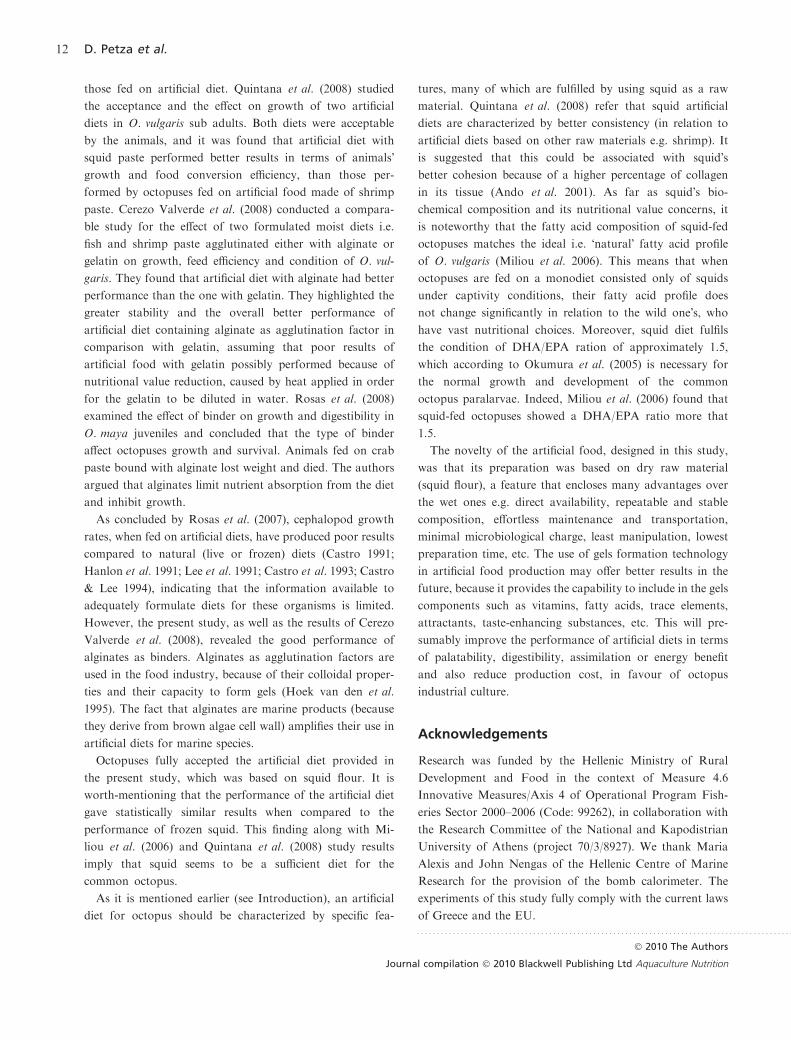
those fed on artificial diet. Quintana et al. (2008) studied
the acceptance and the effect on growth of two artificial
diets in O. vulgaris sub adults. Both diets were acceptable
by the animals, and it was found that artificial diet with
squid paste performed better results in terms of animals�
growth and food conversion efficiency, than those per-
formed by octopuses fed on artificial food made of shrimp
paste. Cerezo Valverde et al. (2008) conducted a compara-
ble study for the effect of two formulated moist diets i.e.
fish and shrimp paste agglutinated either with alginate or
gelatin on growth, feed efficiency and condition of O. vul-
garis. They found that artificial diet with alginate had better
performance than the one with gelatin. They highlighted the
greater stability and the overall better performance of
artificial diet containing alginate as agglutination factor in
comparison with gelatin, assuming that poor results of
artificial food with gelatin possibly performed because of
nutritional value reduction, caused by heat applied in order
for the gelatin to be diluted in water. Rosas et al. (2008)
examined the effect of binder on growth and digestibility in
O. maya juveniles and concluded that the type of binder
affect octopuses growth and survival. Animals fed on crab
paste bound with alginate lost weight and died. The authors
argued that alginates limit nutrient absorption from the diet
and inhibit growth.
As concluded by Rosas et al. (2007), cephalopod growth
rates, when fed on artificial diets, have produced poor results
compared to natural (live or frozen) diets (Castro 1991;
Hanlon et al. 1991; Lee et al. 1991; Castro et al. 1993; Castro
& Lee 1994), indicating that the information available to
adequately formulate diets for these organisms is limited.
However, the present study, as well as the results of Cerezo
Valverde et al. (2008), revealed the good performance of
alginates as binders. Alginates as agglutination factors are
used in the food industry, because of their colloidal proper-
ties and their capacity to form gels (Hoek van den et al.
1995). The fact that alginates are marine products (because
they derive from brown algae cell wall) amplifies their use in
artificial diets for marine species.
Octopuses fully accepted the artificial diet provided in
the present study, which was based on squid flour. It is
worth-mentioning that the performance of the artificial diet
gave statistically similar results when compared to the
performance of frozen squid. This finding along with Mi-
liou et al. (2006) and Quintana et al. (2008) study results
imply that squid seems to be a sufficient diet for the
common octopus.
As it is mentioned earlier (see Introduction), an artificial
diet for octopus should be characterized by specific fea-
tures, many of which are fulfilled by using squid as a raw
material. Quintana et al. (2008) refer that squid artificial
diets are characterized by better consistency (in relation to
artificial diets based on other raw materials e.g. shrimp). It
is suggested that this could be associated with squid�s
better cohesion because of a higher percentage of collagen
in its tissue (Ando et al. 2001). As far as squid�s bio-
chemical composition and its nutritional value concerns, it
is noteworthy that the fatty acid composition of squid-fed
octopuses matches the ideal i.e. �natural� fatty acid profile
of O. vulgaris (Miliou et al. 2006). This means that when
octopuses are fed on a monodiet consisted only of squids
under captivity conditions, their fatty acid profile does
not change significantly in relation to the wild one�s, who
have vast nutritional choices. Moreover, squid diet fulfils
the condition of DHA/EPA ration of approximately 1.5,
which according to Okumura et al. (2005) is necessary for
the normal growth and development of the common
octopus paralarvae. Indeed, Miliou et al. (2006) found that
squid-fed octopuses showed a DHA/EPA ratio more that
1.5.
The novelty of the artificial food, designed in this study,
was that its preparation was based on dry raw material
(squid flour), a feature that encloses many advantages over
the wet ones e.g. direct availability, repeatable and stable
composition, effortless maintenance and transportation,
minimal microbiological charge, least manipulation, lowest
preparation time, etc. The use of gels formation technology
in artificial food production may offer better results in the
future, because it provides the capability to include in the gels
components such as vitamins, fatty acids, trace elements,
attractants, taste-enhancing substances, etc. This will pre-
sumably improve the performance of artificial diets in terms
of palatability, digestibility, assimilation or energy benefit
and also reduce production cost, in favour of octopus
industrial culture.
Research was funded by the Hellenic Ministry of Rural
Development and Food in the context of Measure 4.6
Innovative Measures/Axis 4 of Operational Program Fish-
eries Sector 2000–2006 (Code: 99262), in collaboration with
the Research Committee of the National and Kapodistrian
University of Athens (project 70/3/8927). We thank Maria
Alexis and John Nengas of the Hellenic Centre of Marine
Research for the provision of the bomb calorimeter. The
experiments of this study fully comply with the current laws
of Greece and the EU.
. . . . . . . . . . . . . . . . . . . . . . . . . . . . . . . . . . . . . . . . . . . . . . . . . . . . . . . . . . . . . . . . . . . . . . . . . . . . . . . . . . . . . . . . . . . . . .
� 2010 The Authors
Journal compilation � 2010 Blackwell Publishing Ltd Aquaculture Nutrition
Aguado Gimenez, F.A. & Garcıa Garcıa, B. (2002) Growth and
food intake models in Octopus vulgaris Cuvier (1797): influence of
body weight, temperature, sex and diet. Aquacult. Int., 10, 361–
377.
Akaike, H. (1973) Information theory as an extension of the maxi-
mum likelihood principle. In: Second International Symposium on
Information Theory (Petrov, B.N. & Csaki, F. eds), pp. 267–281.
Budapest, Akademiai Kiado.
Akaike, H. (1983) Information measures and model selection. Bull.
Int. Stat. Inst., 44, 277–291.
Altman, J.S. & Nixon, M. (1970) Use of the beaks and radula by
Octopus vulgaris in feeding. J. Zool. (Lond.), 161, 25–38.
Ando, M., Makino, M., Tsukamasa, Y., Makinodan, Y. & Miyosh,
M. (2001) Interdependence between heat solubility and pyridin-
oline contents of squid mantle collagen. J. Food Sci., 66, 265–
269.
Bendiksen, E.A., Berg, O.K., Jobling, M., Arnesen, A.M. &
Masoval, K. (2003) Digestibility, growth and nutrient utilisation
of Altantic salmon parr (Salmo salar L.) in relation to tem-
perature, feed fat content and oil source. Aquaculture, 224, 283–
299.
Boucaud-Camou, E. & Boucher-Rodoni, R. (1983) Feeding and
digestion in Cephalopods. In: The Mollusca (Saleuddin, A.S.M. &
Wilbur, K.M. eds), pp. 149–187. Academic Press, New York.
Buckland, S.T., Burnham, K.P. & Augustin, N.H. (1997)
Model selection: an integral part of inference. Biometrics, 53,
603–618.
Burham, K.P. & Anderson, D.R. (2002) Model Selection and Mul-
timodel Inference: A Practical Information-Theoretic Approach,
2nd edn. Springer, New York.
Castro, B. (1991) Can Sepia officinalis L. be reared on artificial food?
Mar. Behav. Physiol., 19, 35–38.
Castro, B.G. & Lee, P.G. (1994) The effects of semi-purified diets on
growth and condition of Sepia officinalis. Comp. Biochem. Phys.
A., 109, 1007–1016.
Castro, B.G., Dimarco, F.P., DeRusha, R.H. & Lee, P.G. (1993) The
effects of surimi and pelleted diets on the laboratory survival,
growth, and feeding rate of the cuttlefish Sepia officinalis L. J. Exp.
Mar. Biol. Ecol., 170, 241–252.
Cerezo Valverde, J., Hernandez, M.D., Aguado Gimenez, F. &
Garcıa Garcıa, B. (2008) Growth, feed efficiency and condition of
common octopus (Octopus vulgaris) fed on two formulated moist
diets. Aquaculture, 275, 266–273.
Chase, R. & Wells, M.J. (1986) Chemotactic behaviour in Octopus.
J. Comp. Physiol., 158A, 375–381.
Domain, F., Jouffre, D. & Caveriviere, A. (2000) Growth of Octopus
vulgaris from tagging in Senegalese waters. J. Mar. Biol. Ass. UK.,
80, 699–706.
Domingues, P.M., Lopez, N., Munoz, J.A., Maldonado, T., Gaxiola,
G. & Rosas, C. (2007) Effects of a dry pelleted diet on growth and
survival of the Yucatan octopus, Octopus maya. Aquaculture
Nutrition, 13, 273–280.
Folch, J., Lees, M. & Sloane-Stanley, G.H. (1957) A simple method
for the isolation and purification of total lipids from animal tis-
sues. J. Biol. Chem., 226, 497–509.
Forsythe, J.W. & Van Heukelem, W.F. (1987) Growth. In: Cepha-
lopod Life Cycle, Vol. 2 (Boyle, P.R. ed.), pp. 135–156. Academic
Press, London.
Garcıa Garcıa, B.G. & Aguado Gimenez, F.A. (2002) Influence of
diet on ongrowing and nutrient utilization in the common octopus
(Octopus vulgaris). Aquaculture, 211, 171–182.
Garcıa Garcıa, B. & Cerezo Valverde, J. (2006) Optimal proportions
of crabs and fish in diet for common octopus (Octopus vulgaris)
ongrowing. Aquaculture, 253, 502–511.
Garcıa Garcıa, J., Rodriguez Gonzalez, L.M. & Garcıa Garcıa, B.
(2004) Cost analysis of octopus ongrowing installation in Galicia.
Span. J. Agric. Res., 2, 531–537.
Ghiretti, F. & Violante, U. (1964) Richerche sul metabolismo del
rame in Octopus vulgaris. Boll. Zool. (Torino), 31, 1081–1092.
Hach, C.C., Brayton, S.V. & Kopelove, A.B. (1985) A powerful
Kjeldahl Nitrogen method using peroxymonosulfuric acid. J. Agr.
Food. Chem., 33, 1117–1123.
Hanlon, R.T., Bidwell, J.P. & Tait, R. (1989) Strontium is required
for statolith development and thus normal swimming behaviour of
hatchling cephalopods. J. Exp. Biol., 141, 187–195.
Hanlon, R.T., Turk, P.E. & Lee, P.G. (1991) Squid and cuttlefish
mariculture: an update perspective. J. Ceph. Biol., 2, 31–40.
Hellebrekers, L.J., Booij, L.H.D.J. & Flecknell, P.A. (2001) Anaes-
thesia, analgesia and euthanasia. In: Principles of Laboratory
Animal Science, 2nd (revised) edn (Van Zutphen, L.F.M., Bau-
mans, V. & Beynen, A.C. eds), pp. 277–311. Elsevier, Amsterdam.
Hoek van den, D., Mann, D.G. & Jahns, H.M. (1995) Algae.
An Introduction to Phycology, 1st edn. Cambridge University
Press, Great Britain.
Houlihan, D.F., Hall, S.J., Gray, C. & Noble, B.S. (1988) Growth
rates and protein turnover in Atlantic hake, Gadus morhua. Can. J.
Fish. Aquat. Sci., 43, 951–964.
Houlihan, D.F., McMillan, D.N., Agnisola, C., Trara Genoino, I. &
Foti, L. (1990) Protein synthesis and growth in Octopus vulgaris.
Mar. Biol., 106, 251–259.
Hurvich, C.M. & Tsai, C.L. (1989) Regression and time series model
selection in small samples. Biometrika, 76, 297–307.
Iglesias, J., Sanchez, F.J., Otero, J.J. & Moxica, C. (2000) Culture of
octopus (Octopus vulgaris, Curvier). Present knowledge, problems
and perspectives. Cah. Options Mediterr., 47, 313–321.
Katsanevakis, S. (2006) Modelling fish growth: model selection,
multi-model inference and model selection uncertainty. Fish. Res.,
81, 229–235.
Katsanevakis, S. & Verriopoulos, G. (2006) Seasonal population
dynamics of Octopus vulgaris in the eastern Mediterranean. ICES
J. Mar. Sci., 63, 151–160.
Katsanevakis, S., Stefanopoulou, S., Miliou, H., Moraitou-Aposto-
lopoulou, M. & Verriopoulos, G. (2005) Oxygen consumption and
ammonia excretion of Octopus vulgaris (Cephalopoda) in relation
to body mass and temperature. Mar. Biol., 146, 725–732.
Katsanevakis, S., Thessalou-Legaki, M., Karlou-Riga, C., Leukadi-
tou, E., Dimitriou, E. & Verriopoulos, G. (2007a) Information
Theory Approach to allometric growth of marine organisms. Mar.
Biol., 151, 949–959.
Katsanevakis, S., Xanthopoulos, J., Protopapas, N. & Verriopoulos,
G. (2007b) Oxygen consumption of the semi-terrestrial crab
Pachygrapsus marmoratus in relation to body mass and tempera-
ture: an information theory approach. Mar. Biol., 151, 343–352.
Lee, P.G. (1994) Nutrition of cephalopods: fuelling the system. Mar.
Freshw. Behav. Physiol., 25, 35–51.
Lee, P.G., Forsythe, J.W., DiMarco, F.P., DeRusha, R. & Hanlon,
R.T. (1991) Initial palatability and growth trials on pelleted diets
for cephalopods. Bull. Mar. Sci., 49, 362–372.
Mangold, K. (1983) Octopus vulgaris. In: Cephalopod Life cycles,
Vol. I (Boyle, P.R. ed), pp. 335–364. Academic, New York.
Mangold, K. & Von Boletszky, S. (1973) New data on reproductive
biology and growth of Octopus vulgaris. Mar. Biol., 19, 7–12.
McCullagh, P. & Nelder, J.A. (1989) Generalized Linear Models, 2nd
edn. Chapman and Hall, New York, USA, pp. 511.
. . . . . . . . . . . . . . . . . . . . . . . . . . . . . . . . . . . . . . . . . . . . . . . . . . . . . . . . . . . . . . . . . . . . . . . . . . . . . . . . . . . . . . . . . . . . . .
� 2010 The Authors
Journal compilation � 2010 Blackwell Publishing Ltd Aquaculture Nutrition
Miliou, H., Fintikaki, M., Kountouris, T. & Verriopoulos, G. (2005)
Combined effects of temperature and body weight on growth and
protein utilization of the common octopus, Octopus vulgaris.
Aquaculture, 249, 245–256.
Miliou, H., Fintikaki, M., Tzitzinakis, M., Kountouris, T. & Verri-
opoulos, G. (2006) Fatty acid composition of the common
octopus, Octopus vulgaris, in relation to temperature and body
weight. Aquaculture, 256, 311–322.
Nigmatulin, C. (1977) Proisvodstvo i biologuicheskikh nabludeni v
more i ikh obrabotka i oformlenie. Kalingrand, 56–78.
Nixon, M. (1984) Is there external digestion by Octopus? J. Zool.
(Lond.), 202, 441–447.
O�Dor, R.K. & Wells, M.J. (1987) Energy and nutrient flow. In:
Cephalopod Life Cycles, Comparative Reviews, Vol. II (Boyle, P.R.
ed.), pp. 109–133. Academic Press, London.
O�Dor, R.K., Mangold, K., Boucher-Rodoni, R., Wells, M.J. &
Wells, J. (1984) Nutrient absorption, storage and remobilization in
Octopus vulgaris. Mar. Behav. Physiol., 11, 239–258.
Okumura, K., Kurihara, A., Iwamoto, A & Takeuchi, T. (2005)
Improved survival and growth in Octopus vulgaris paralarvae by
feeding large type Artemia and Pacific sandeel, Ammodytes per-
sonatus. Aquaculture, 244, 147–157.
Petza, D., Katsanevakis, S. & Verriopoulos, G. (2006) Experimental
evaluation of the energy balance in Octopus vulgaris, fed on a high-
lipid diet. Mar. Biol., 148, 827–832.
Protopapas, N., Katsanevakis, S., Thessalou-Legaki, M. & Verrio-
poulos, G. (2007) Relative growth of the semi-terrestrial crab
Pachygrapsus marmoratus: an information-theory approach. Sci.
Mar., 71, 383–394.
Quintana, D., Domingues, P. & Garcıa, S. (2008) Effect of two
artificial wet diets agglutinated with gelatin on feed and growth
performance of common octopus (Octopus vulgaris) sub-adults.
Aquaculture, 280, 161–164.
Rosas, C., Cuzon, G., Pascual, C., Gaxiola, G., Chay, D., Lopez, N.,
Maldonato, T. & Domingues, P.M. (2007) Energy balance of
Octopus maya fed crab or an artificial diet. Mar. Biol., 152, 371–
378.
Rosas, C., Tut, J., Baeza, J., Sanchez, A., Sosa, V., Pascual, C.,
Arena, L., Domingues, P. & Cuzon, G. (2008) Effect of type of
binder on growth, digestibility and energy balance of Octopus
maya. Aquaculture, 275, 291–297.
Russell, W.M.S. & Burch, R.L. (1959) The Principles of Humane
Experimental Technique. Methuen, London.
Silva, J.L. & Chamul, R.S. (2000) Composition of marine and
freshwater finfish and shellfish species. In: Marine and Freshwater
Products Handbook (Martin, R.E., Paine Carter, E., Flick, G.J. &
Davis, L.M. eds), pp. 31–45. Technomic Publishing, Lancaster.
Sinanoglou, V.J. & Miniadis-Meimaroglou, S. (1998) Fatty acid of
neutral and polar lipids of (edible) Mediterranean cephalopods.
Food. Res. Int., 31, 467–473.
Smale, M.J. & Buchan, P.R. (1981) Biology of Octopus vulgaris off
the east coast of South Africa. Mar. Biol., 65, 1–12.
Vaz-Pires, P., Seixas, P. & Barbosa, A. (2004) Aquaculture potential
of the common octopus (Octopus vulgaris Cuvier, 1797): a review.
Aquaculture, 238, 221–238.
Villanueva, R. & Bustamante, P. (2006) Composition in essential and
non-essential elements of early stages of cephalopods and dietary
effects on the elemental profiles of Octopus vulgaris paralarvae.
Aquaculture, 261, 225–240.
Villanueva, R., Riba, J., Ruiz-Capillas, C., Gonzalez, A.V. & Baeta,
M. (2004) Amino acid composition of early stages of cephalopods
and effect of amino acid dietary treatment on Octopus vulgaris
paralarvae. Aquaculture, 242, 455–478.
Waterlow, J.C. (1984) Protein turn-over with special reference to
man. Q. J. Exp. Physiol., 69, 409–438.
Wells, M.J. (1978) Octopus. Physiology and Behaviour of an advanced
Invertebrate. Chapman and Hall, London.
Wells, M.J., Freeman, N.H. & Ashburner, M. (1965) Some experi-
ments on the chemotactile sense of octopuses. J. Exp. Biol., 43,
553–563.
Wells, M.J., O�Dor, R.K., Mangold, K. & Wells, J. (1983) Feeding
and metabolic rate in Octopus. Mar. Behav. Physiol., 9, 305–317.
Zar, J.H. (1999) Biostatistical Analysis, 4th edn, p. 663. Prentice-Hall
Inc, Upper Saddle River, NJ.
. . . . . . . . . . . . . . . . . . . . . . . . . . . . . . . . . . . . . . . . . . . . . . . . . . . . . . . . . . . . . . . . . . . . . . . . . . . . . . . . . . . . . . . . . . . . . .
� 2010 The Authors
Journal compilation � 2010 Blackwell Publishing Ltd Aquaculture Nutrition