Embed Size (px)
Citation preview
PNNL-18279
Aquifer Testing Recommendations for Well 299-W15-225: Supporting Phase I of the 200-ZP-1 Groundwater Operable Unit Remedial Design FA Spane DR Newcomer March 2009
DISCLAIMER This report was prepared as an account of work sponsored by an agency of the United States Government. Neither the United States Government nor any agency thereof, nor Battelle Memorial Institute, nor any of their employees, makes any warranty, express or implied, or assumes any legal liability or responsibility for the accuracy, completeness, or usefulness of any information, apparatus, product, or process disclosed, or represents that its use would not infringe privately owned rights. Reference herein to any specific commercial product, process, or service by trade name, trademark, manufacturer, or otherwise does not necessarily constitute or imply its endorsement, recommendation, or favoring by the United States Government or any agency thereof, or Battelle Memorial Institute. The views and opinions of authors expressed herein do not necessarily state or reflect those of the United States Government or any agency thereof. PACIFIC NORTHWEST NATIONAL LABORATORY operated by BATTELLE for the UNITED STATES DEPARTMENT OF ENERGY under Contract DE-ACO5-76RL01830
Printed in the United States of America
Available to DOE and DOE contractors from the Office of Scientific and Technical Information,
P.O. Box 62, Oak Ridge, TN 37831-0062; ph: (865) 576-8401 fax: (865) 576 5728
email: [email protected]
Available to the public from the National Technical Information Service, U.S. Department of Commerce, 5285 Port Royal Rd., Springfield, VA 22161
ph: (800) 553-6847 fax: (703) 605-6900
email: [email protected] online ordering: http://www.ntis.gov/ordering.htm
PNNL-18279
Aquifer Testing Recommendations for Well 299-W15-225: Supporting Phase I of the 200-ZP-1 Groundwater Operable Unit Remedial Design FA Spane DR Newcomer March 2009 Prepared for the U.S. Department of Energy under Contract DE-AC05-76RL01830 Pacific Northwest National Laboratory Richland, Washington 99352
iii
Summary
Aquifer characterization needs are currently being assessed to optimize pump-and-treat remedial strategies within the 200-ZP-1 Operable Unit (OU), specifically for the immediate area of the 241-TX-TY Tank Farm. Currently, 14 extraction wells are actively used in the Interim Record of Decision ZP-1 pump-and-treat system to remediate the existing groundwater contamination within this general area. Four of these wells (299-W15-40, 299-W15-43, 299-W15-44, and 299-W15-765) are targeted to remediate contamination within the immediate 241-TX-TY Tank Farm area. The major contaminant of concern (COC) for the 200-ZP-1 OU is carbon tetrachloride. Other COC’s include total chromium (trivalent [III] and hexavalent [VI], nitrate, trichloroethlyene, iodine-129, technetium-99, and tritium. A new ZP-1 extraction well (299-W15-225) was identified that would be added to the pump-and-treat system. An evaluation was performed to identify characterization methods that could be implemented at the new extraction well that would significantly improve hydrologic characterization needs for this general 200-ZP-1 OU area. Hydrologic property information obtained from the new extraction well will be used to improve the design and operation of the new encompassing 200-West pump-and-treat system, as described in U.S. Department of Energy/Richland Operations (DOE/RL) (2008). The principal objectives of hydrologic characterization tests identified for the new extraction well are to determine the lateral and vertical distribution of aquifer hydraulic properties and to assess the lateral extent or area-of-influence of the new extraction well, 299-W15-225. This type of aquifer test characterization information is important for the detailed modeling of contaminant capture and the optimum design of pump-and-treat systems (i.e., future extraction well siting and completion). The three hydrologic test characterization methods identified for providing quantitative lateral and detailed vertical aquifer property information include:
Detailed test/depth-interval slug-test characterization during the drilling of 299-W15-225
Dynamic electromagnetic flowmeter survey within the completed new well 299-W15-225
Constant-rate pumping test of well 299-W15-225 and monitoring the large-scale areal response within surrounding and neighboring 241-TX-TY Tank Farm monitor wells.
Of these test methods, the constant-rate pumping test and recovery provides an opportunity for obtaining detailed, large-scale information for a wide range of hydrologic properties (i.e., transmissivity, hydraulic conductivity, vertical and horizontal anisotropy, and storativity). Many of these properties cannot be reliably estimated using standard single-well tests or hydrologic tests of short duration. This acquisition of large-scale hydrologic characterization information is particularly important for improving the design of the remediation system, particularly as it relates to siting additional pump-and-treat system extraction wells using numerical groundwater flow and contaminant capture models. The letter report provides a discussion of the three recommended hydrologic test methods to be performed at the new ZP-1 extraction well 299-W15-225 and provides a general test plan for their implementation. Specifically, Section 2 identifies available well information and results of recently conducted hydrologic characterization tests that have been performed at WMA TX-TY Tank Farm area test wells. Section 3 discusses the three hydrologic test characterization methods recommended for performance at new extraction well 299-W15-225 (i.e., performance, analysis, and characterization information provided).
iv
Section 4 provides a more detailed test plan of the sequence of activities and the frequency of monitoring the water level in wells for the recommended multi-well constant-rate pumping and recovery test to be initiated at well 299-W15-225.
v
Acronyms
CHPRC CH2M Hill Plateau Remediation Company
DOE/RL U.S. Department of Energy/Richland Operations
EBF electromagnetic borehole flowmeter
OU operable unit
PNNL Pacific Northwest National Laboratory
RCRA Resource Conservation and Recovery Act
WMA Waste Management Area
vii
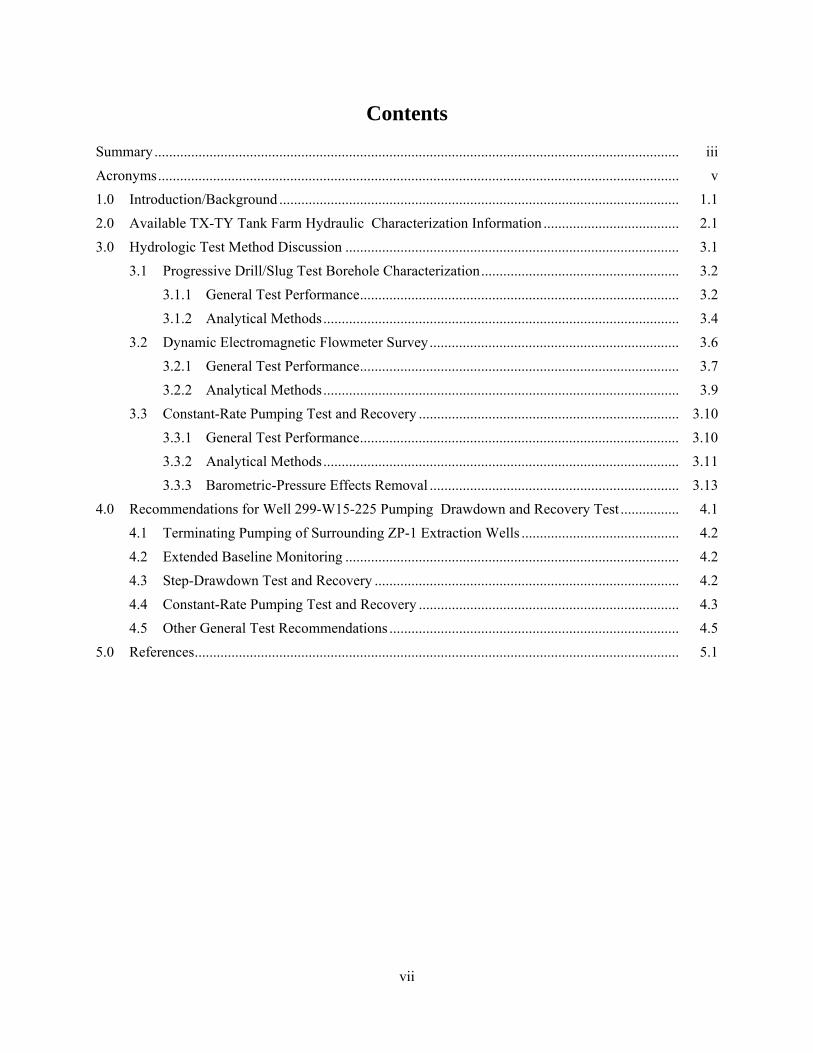
Contents
Summary ............................................................................................................................................... iii
Acronyms .............................................................................................................................................. v
1.0 Introduction/Background ............................................................................................................. 1.1
2.0 Available TX-TY Tank Farm Hydraulic Characterization Information ..................................... 2.1
3.0 Hydrologic Test Method Discussion ........................................................................................... 3.1
3.1 Progressive Drill/Slug Test Borehole Characterization ...................................................... 3.2
3.1.1 General Test Performance ....................................................................................... 3.2
3.1.2 Analytical Methods ................................................................................................. 3.4
3.2 Dynamic Electromagnetic Flowmeter Survey .................................................................... 3.6
3.2.1 General Test Performance ....................................................................................... 3.7
3.2.2 Analytical Methods ................................................................................................. 3.9
3.3 Constant-Rate Pumping Test and Recovery ....................................................................... 3.10
3.3.1 General Test Performance ....................................................................................... 3.10
3.3.2 Analytical Methods ................................................................................................. 3.11
3.3.3 Barometric-Pressure Effects Removal .................................................................... 3.13
4.0 Recommendations for Well 299-W15-225 Pumping Drawdown and Recovery Test ................ 4.1
4.1 Terminating Pumping of Surrounding ZP-1 Extraction Wells ........................................... 4.2
4.2 Extended Baseline Monitoring ........................................................................................... 4.2
4.3 Step-Drawdown Test and Recovery ................................................................................... 4.2
4.4 Constant-Rate Pumping Test and Recovery ....................................................................... 4.3
4.5 Other General Test Recommendations ............................................................................... 4.5
5.0 References .................................................................................................................................... 5.1
viii
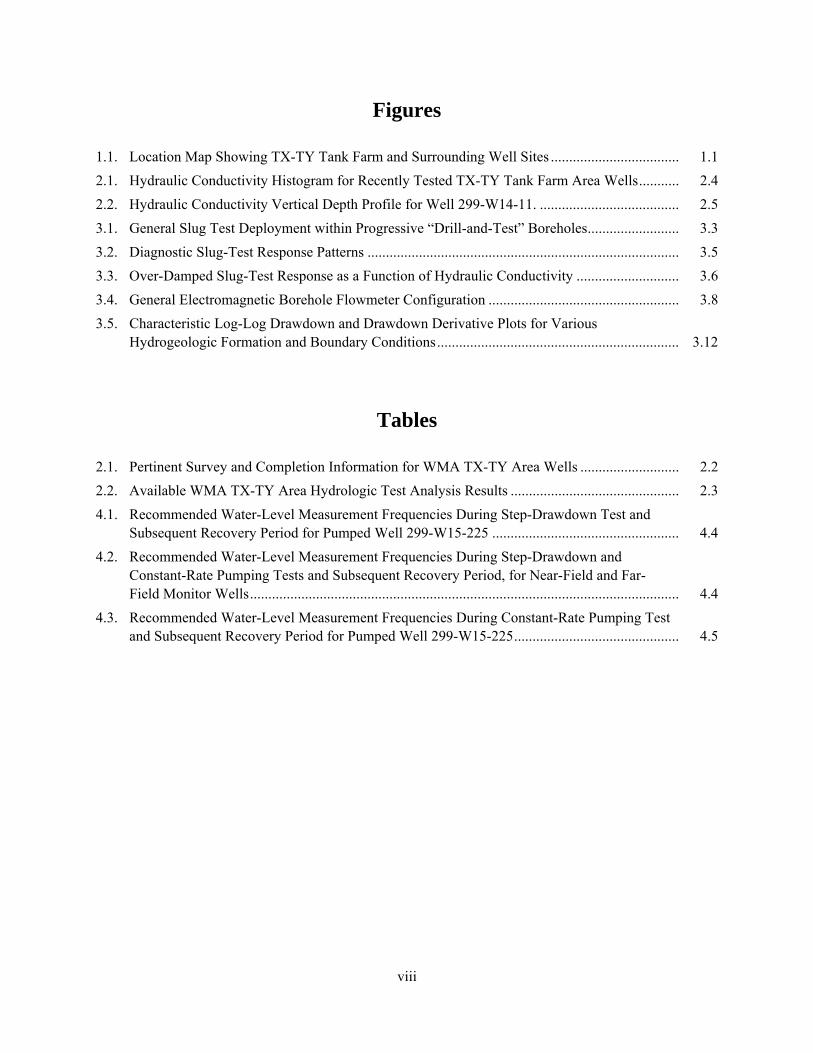
Figures
1.1. Location Map Showing TX-TY Tank Farm and Surrounding Well Sites ................................... 1.1
2.1. Hydraulic Conductivity Histogram for Recently Tested TX-TY Tank Farm Area Wells ........... 2.4
2.2. Hydraulic Conductivity Vertical Depth Profile for Well 299-W14-11. ...................................... 2.5
3.1. General Slug Test Deployment within Progressive “Drill-and-Test” Boreholes ......................... 3.3
3.2. Diagnostic Slug-Test Response Patterns ..................................................................................... 3.5
3.3. Over-Damped Slug-Test Response as a Function of Hydraulic Conductivity ............................ 3.6
3.4. General Electromagnetic Borehole Flowmeter Configuration .................................................... 3.8
3.5. Characteristic Log-Log Drawdown and Drawdown Derivative Plots for Various Hydrogeologic Formation and Boundary Conditions .................................................................. 3.12
Tables
2.1. Pertinent Survey and Completion Information for WMA TX-TY Area Wells ........................... 2.2
2.2. Available WMA TX-TY Area Hydrologic Test Analysis Results .............................................. 2.3
4.1. Recommended Water-Level Measurement Frequencies During Step-Drawdown Test and Subsequent Recovery Period for Pumped Well 299-W15-225 ................................................... 4.4
4.2. Recommended Water-Level Measurement Frequencies During Step-Drawdown and Constant-Rate Pumping Tests and Subsequent Recovery Period, for Near-Field and Far- Field Monitor Wells ..................................................................................................................... 4.4
4.3. Recommended Water-Level Measurement Frequencies During Constant-Rate Pumping Test and Subsequent Recovery Period for Pumped Well 299-W15-225 ............................................. 4.5
1.1
1.0 Introduction/Background
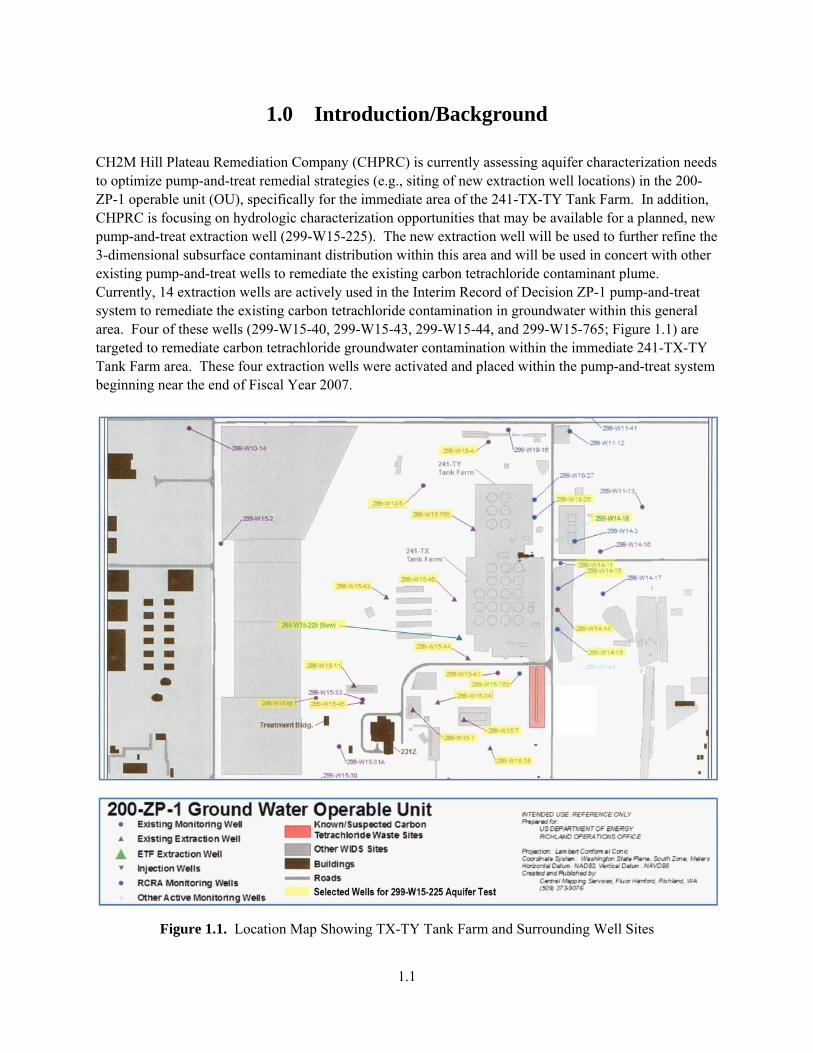
CH2M Hill Plateau Remediation Company (CHPRC) is currently assessing aquifer characterization needs to optimize pump-and-treat remedial strategies (e.g., siting of new extraction well locations) in the 200-ZP-1 operable unit (OU), specifically for the immediate area of the 241-TX-TY Tank Farm. In addition, CHPRC is focusing on hydrologic characterization opportunities that may be available for a planned, new pump-and-treat extraction well (299-W15-225). The new extraction well will be used to further refine the 3-dimensional subsurface contaminant distribution within this area and will be used in concert with other existing pump-and-treat wells to remediate the existing carbon tetrachloride contaminant plume. Currently, 14 extraction wells are actively used in the Interim Record of Decision ZP-1 pump-and-treat system to remediate the existing carbon tetrachloride contamination in groundwater within this general area. Four of these wells (299-W15-40, 299-W15-43, 299-W15-44, and 299-W15-765; Figure 1.1) are targeted to remediate carbon tetrachloride groundwater contamination within the immediate 241-TX-TY Tank Farm area. These four extraction wells were activated and placed within the pump-and-treat system beginning near the end of Fiscal Year 2007.
Figure 1.1. Location Map Showing TX-TY Tank Farm and Surrounding Well Sites
1.2
Meetings were held on November 21 and December 1, 2008, with staff and consultants of CHPRC and Pacific Northwest National Laboratory (PNNL) to help identify specific hydrologic tests that would provide needed characterization information to support optimization of the pump-and-treat system(a). Based on these meeting discussions, it was decided to focus on hydrologic test methods that could be readily applied using the new extraction well 299-W15-225. The principal objective of hydrologic test characterization was to determine the lateral and vertical distribution of hydraulic properties and the lateral extent or area-of-influence of the new extraction well 299-W15-225. This type of aquifer test characterization information is important for the detailed modeling of contaminant capture and the optimum design of pump-and-treat systems (i.e., future extraction well siting and completion). The characterization information derived from the well 299-W15-225 hydrologic tests can be incorporated for improving the design and operation of the new encompassing 200-West pump-and-treat system, as described in U.S. Department of Energy/Richland Operations (DOE/RL) (2008). Based on this hydrologic assessment, three hydrologic test methods were identified to best provide this lateral and vertical aquifer information:
Detailed test/depth-interval slug-test characterization during the drilling of 299-W15-225
Dynamic electromagnetic flowmeter survey within the completed new well 299-W15-225
Constant-rate pumping test of well 299-W15-225 and monitoring the large-scale areal response within surrounding and neighboring 241-TX-TY Tank Farm monitor wells.
It should be noted that the assessment of hydrologic test methods for use with the new 241-TX-TY Tank Farm extraction well followed the same rationale that was used for evaluating hydrologic test characterization needs for the nearby 241-T Tank Farm area, which is discussed in Spane (2008a). Three of the six hydrologic test methods identified in the previous study were not considered for application at the 241-TX-TY extraction well. The methods not considered include two multi-well tracer tests (i.e., forced-gradient and convergent). The multi-well tracer tests were not considered practical for extraction well 299-W15-225 because of relatively large inter-well distances to surrounding wells. There are other candidate 241-TX-TY Tank Farm well couplets, however, where multi-well tracer tests may be applicable. Additionally, slug testing of existing surrounding TX-TY Tank Farm wells was not considered in this test plan because it does not apply directly to extraction well 299-W15-225 and a relatively high percentage of the existing TX-TY Tank Farm wells have already been tested using this hydrologic test method.
(a) S. Simmons. 2008. Personal communication: “Conference Call Concerning 200 West P&T/ZP-1: Aquifer Test
#1.” CHPRC Meeting Minutes, November 21, 2008.
2.1
2.0 Available TX-TY Tank Farm Hydraulic Characterization Information
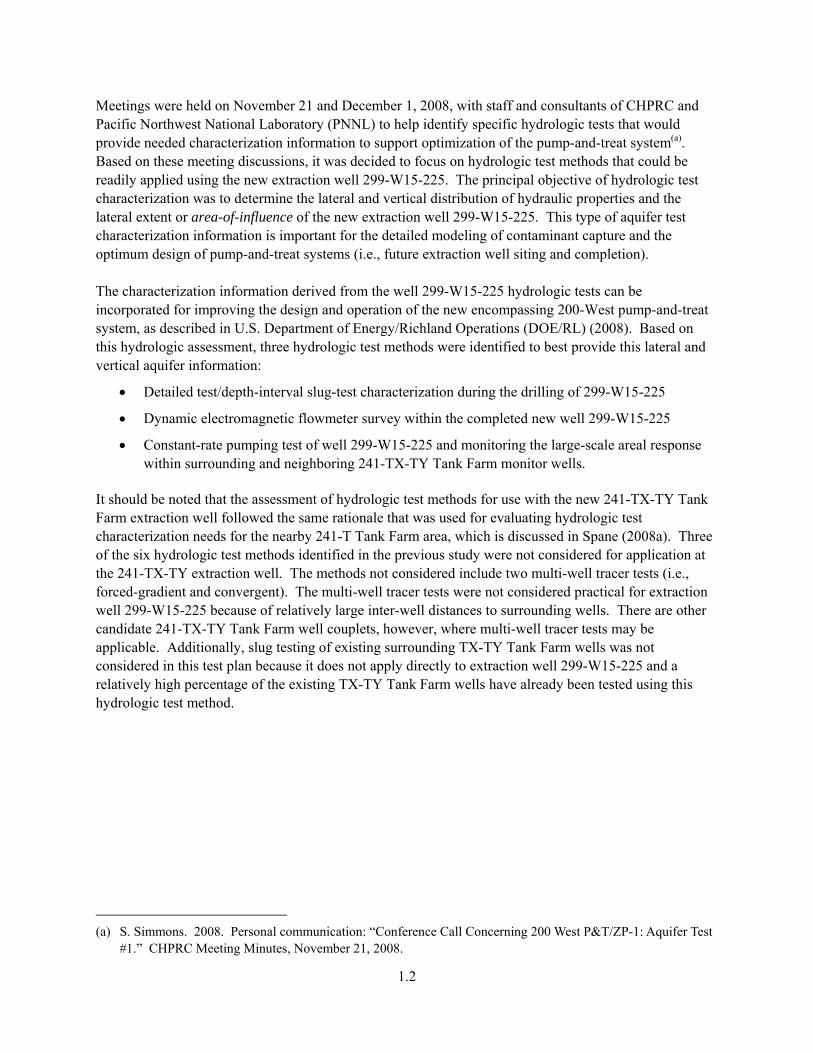
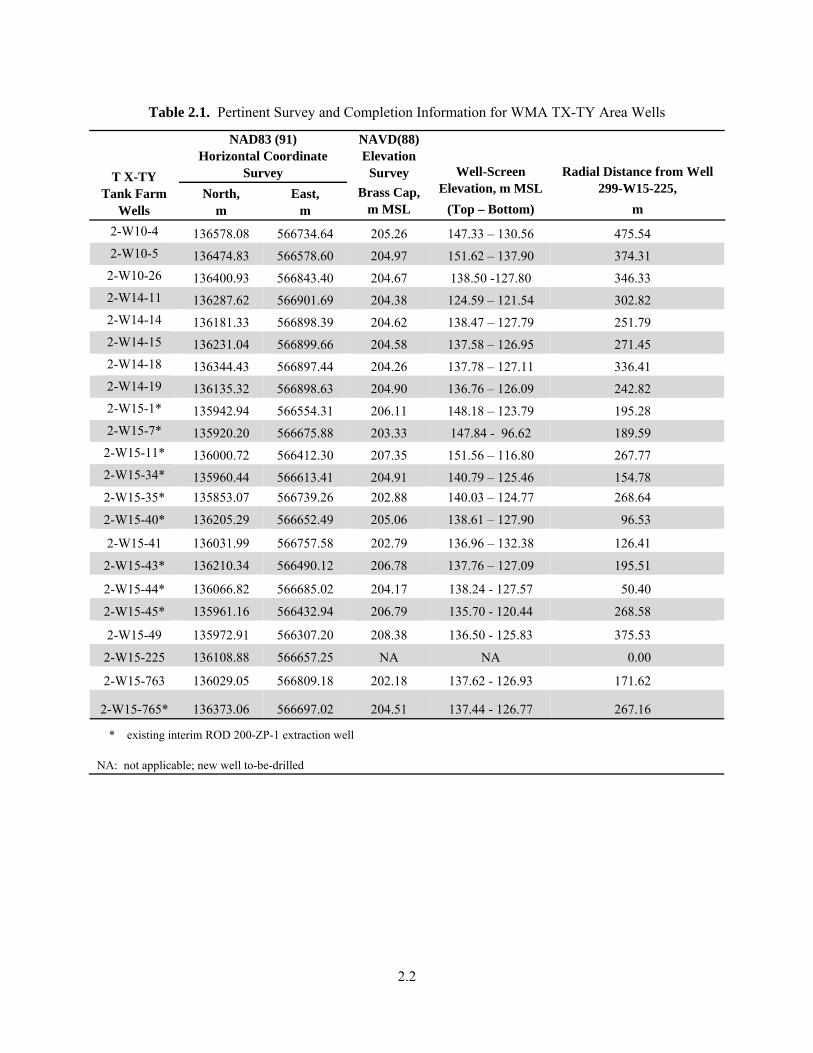
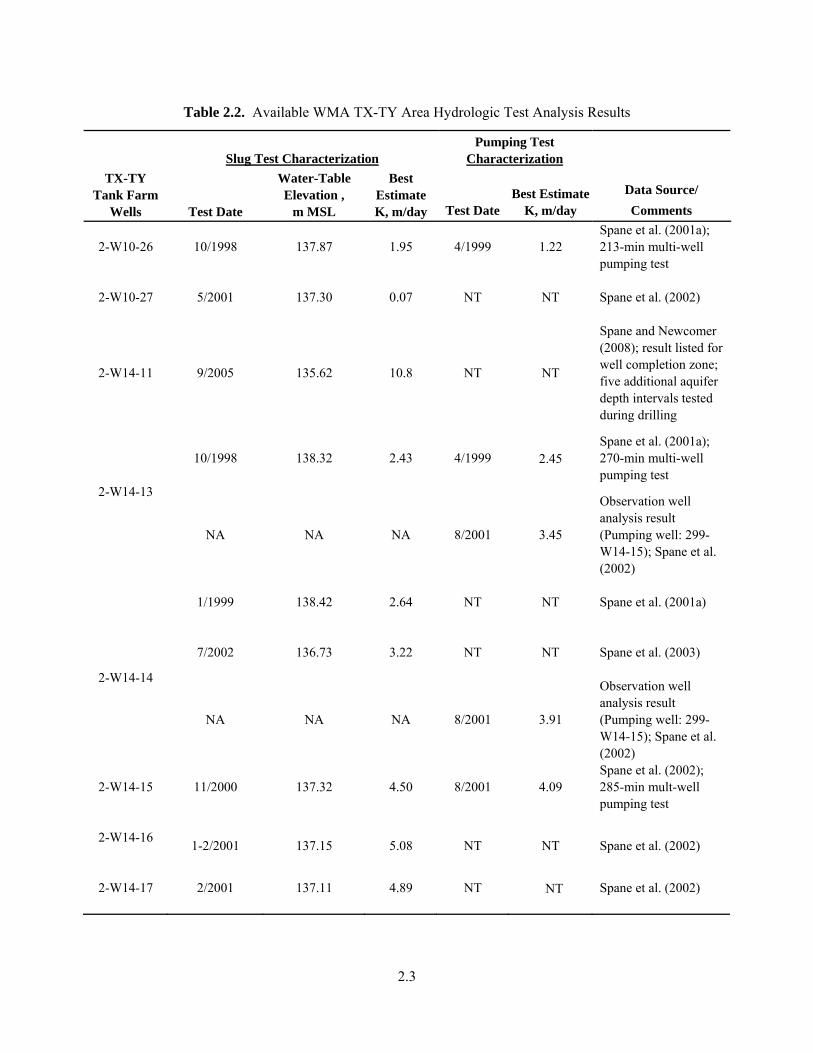
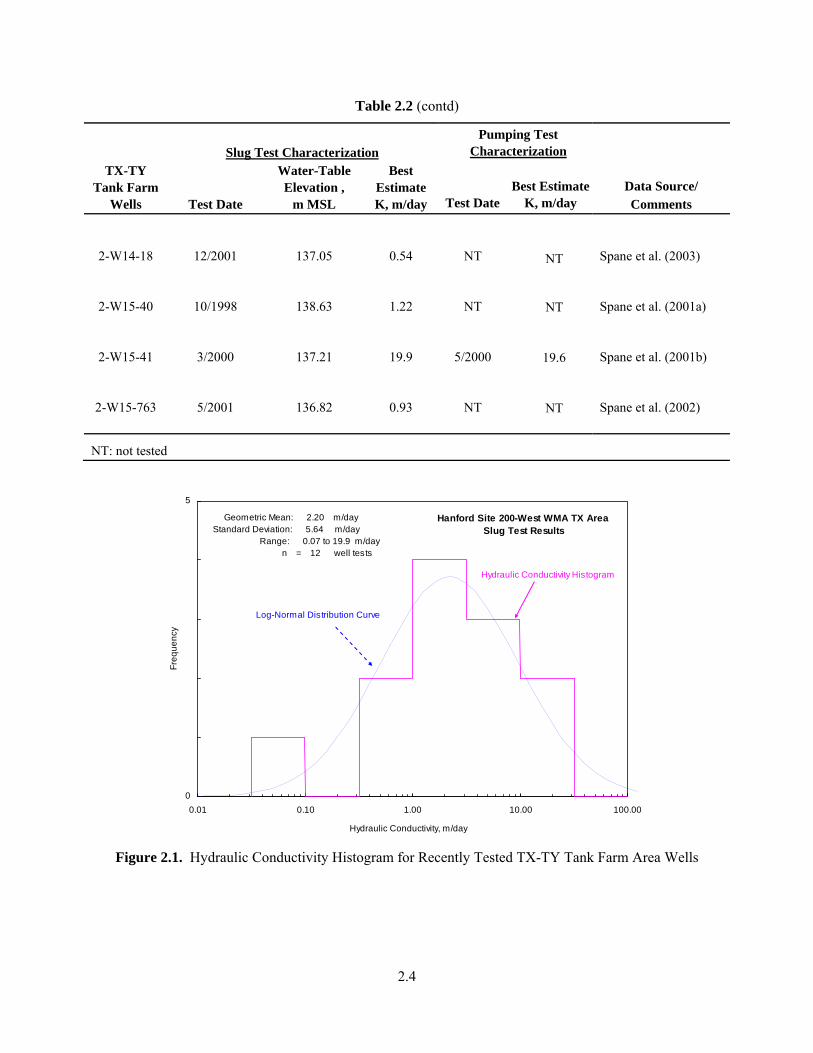
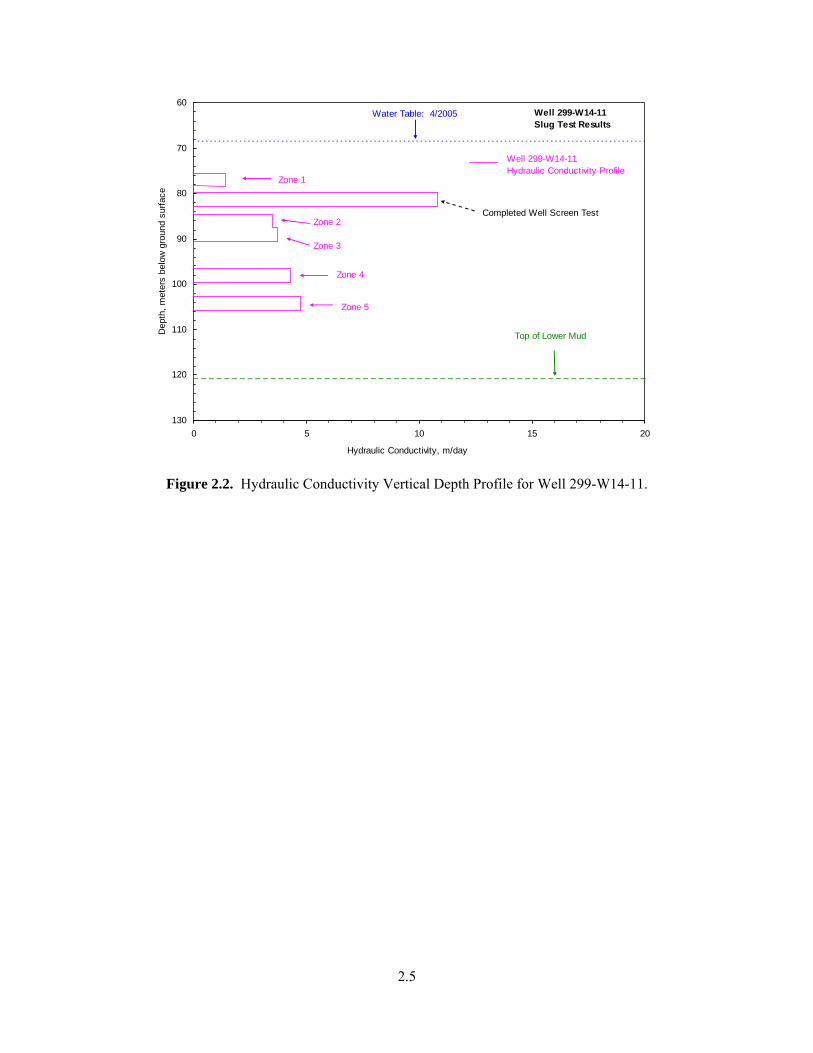
As an initial step of the hydrologic test method assessment, a review of available well information and recently conducted hydrologic characterization tests was performed for TX-TY Tank Farm test wells. Table 2.1 lists pertinent well completion and distance/location information for various monitor and extraction wells as it relates to the new WMA TX-TY extraction well 299-W15-225. Table 2.2 lists available hydraulic-property (hydraulic-conductivity) information for hydrologic tests previously conducted within the TX-TY Tank Farm area from FY 1999 to FY 2005. As indicated in Table 2.2, 12 well sites have reported slug-test characterization results within the TX-TY Tank Farm area. In addition, three TX-TY Tank Farm well site locations have had short-duration (i.e., 213 to 285 minutes) constant-rate pumping tests; one of which (299-W14-15) was a multi-well test that used nearby observation wells (299-W14-13 and 299-W14-14). The single- and multi-well hydraulic-conductivity estimates obtained from the pumping tests compare favorably with the single-well slug tests conducted at these well site locations (Table 2.2). Figure 2.1 shows a histogram distribution of hydraulic conductivity values for slug tests conducted within the top (i.e., upper 10 meters) of the unconfined aquifer. These tests are reflective of the Ringold Formation gravel unit E. As shown in the figure, the histogram distribution appears to conform to a log-normal distribution with a hydraulic conductivity range between 0.07 and 19.9 m/day and a geometric mean of 2.20 m/day. These hydraulic-conductivity values compare favorably to the range (0.05 to 64.1 m/day) and geometric mean (3.43 m/day) previously reported for slug-test characterization performed for all wells within the entire 200-West Area (Spane and Newcomer 2008). In addition to these 12 well sites, one TX-TY Tank Farm test well (299-W14-11) was progressively slug tested during the course of borehole drilling. This type of characterization was designed to provide an assessment of the variation and vertical distribution of hydraulic conductivity and hydrochemical contamination with depth within the unconfined aquifer at these specific locations. Vertically-distributed characterization information is important for predicting/simulating contaminant migration (i.e., numerical flow/transport modeling) and designing proper monitor-well strategies for specific OU locations. Characterization results for well 299-W14-11 were obtained in conjunction with Site-Wide Resource Conservation and Recovery Act (RCRA) Waste Management Area (WMA) testing activities and are reported in Spane and Newcomer (2008). Figure 2.2 shows a vertical profile of hydraulic conductivity versus depth for well 299-W14-11 obtained from slug testing of selected depth intervals during borehole advancement. When combined with test results derived for the well-screen section after well completion, approximately 35% of the composite unconfined aquifer was characterized for hydraulic conductivity vs. depth at this test site location. No obvious depth-profile correlation between higher 99Tc contaminant levels with higher values of hydraulic conductivity, K, values (not shown) was exhibited for the unconfined aquifer at this particular test well location. This is in contrast to a close association exhibited and reported in Spane (2008a) for a similarly characterized borehole (i.e., 299-W11-25B) located to the north in the WMA T Tank Farm area. It should be noted, however, that the upper 7 meters of the unconfined aquifer, which contains the highest 99Tc contaminant levels, were not hydrologically tested at the well 299-W14-11 site. No hydraulic conductivity values are available, therefore, for profile correlation over the depth zone exhibiting the highest contaminant levels.
2.2
Table 2.1. Pertinent Survey and Completion Information for WMA TX-TY Area Wells
T X-TY Tank Farm
Wells
NAD83 (91) Horizontal Coordinate
Survey
NAVD(88) Elevation
Survey Brass Cap,
m MSL
Well-Screen Elevation, m MSL
(Top – Bottom)
Radial Distance from Well 299-W15-225,
m North,
m East,
m
2-W10-4 136578.08 566734.64 205.26 147.33 – 130.56 475.54
2-W10-5 136474.83 566578.60 204.97 151.62 – 137.90 374.31
2-W10-26 136400.93 566843.40 204.67 138.50 -127.80 346.33
2-W14-11 136287.62 566901.69 204.38 124.59 – 121.54 302.82
2-W14-14 136181.33 566898.39 204.62 138.47 – 127.79 251.79
2-W14-15 136231.04 566899.66 204.58 137.58 – 126.95 271.45
2-W14-18 136344.43 566897.44 204.26 137.78 – 127.11 336.41
2-W14-19 136135.32 566898.63 204.90 136.76 – 126.09 242.82
2-W15-1* 135942.94 566554.31 206.11 148.18 – 123.79 195.28
2-W15-7* 135920.20 566675.88 203.33 147.84 - 96.62 189.59
2-W15-11* 136000.72 566412.30 207.35 151.56 – 116.80 267.77
2-W15-34* 135960.44 566613.41 204.91 140.79 – 125.46 154.78
2-W15-35* 135853.07 566739.26 202.88 140.03 – 124.77 268.64
2-W15-40* 136205.29 566652.49 205.06 138.61 – 127.90 96.53
2-W15-41 136031.99 566757.58 202.79 136.96 – 132.38 126.41
2-W15-43* 136210.34 566490.12 206.78 137.76 – 127.09 195.51
2-W15-44* 136066.82 566685.02 204.17 138.24 - 127.57 50.40
2-W15-45* 135961.16 566432.94 206.79 135.70 - 120.44 268.58
2-W15-49 135972.91 566307.20 208.38 136.50 - 125.83 375.53
2-W15-225 136108.88 566657.25 NA NA 0.00
2-W15-763 136029.05 566809.18 202.18 137.62 - 126.93 171.62
2-W15-765* 136373.06 566697.02 204.51 137.44 - 126.77 267.16
* existing interim ROD 200-ZP-1 extraction well NA: not applicable; new well to-be-drilled
2.3
Table 2.2. Available WMA TX-TY Area Hydrologic Test Analysis Results
TX-TY Tank Farm
Wells
Slug Test Characterization Pumping Test
Characterization
Data Source/
Comments Test Date
Water-Table Elevation ,
m MSL
Best Estimate K, m/day Test Date
Best Estimate K, m/day
2-W10-26
10/1998 137.87 1.95 4/1999
1.22
Spane et al. (2001a); 213-min multi-well pumping test
2-W10-27
5/2001 137.30 0.07 NT NT Spane et al. (2002)
2-W14-11
9/2005 135.62 10.8 NT NT
Spane and Newcomer (2008); result listed for well completion zone; five additional aquifer depth intervals tested during drilling
2-W14-13
10/1998
138.32
2.43 4/1999 2.45 Spane et al. (2001a); 270-min multi-well pumping test
NA NA NA 8/2001 3.45
Observation well analysis result (Pumping well: 299-W14-15); Spane et al. (2002)
2-W14-14
1/1999 138.42 2.64 NT NT Spane et al. (2001a)
7/2002 136.73 3.22 NT NT Spane et al. (2003)
NA NA NA 8/2001 3.91
Observation well analysis result (Pumping well: 299-W14-15); Spane et al. (2002)
2-W14-15
11/2000 137.32 4.50 8/2001 4.09
Spane et al. (2002); 285-min mult-well pumping test
2-W14-16
1-2/2001
137.15
5.08
NT
NT
Spane et al. (2002)
2-W14-17
2/2001 137.11 4.89 NT NT Spane et al. (2002)
2.4
Table 2.2 (contd)
TX-TY Tank Farm
Wells
Slug Test Characterization Pumping Test
Characterization
Data Source/ Comments Test Date
Water-Table Elevation ,
m MSL
Best Estimate K, m/day Test Date
Best Estimate K, m/day
2-W14-18
12/2001
137.05
0.54
NT
NT
Spane et al. (2003)
2-W15-40
10/1998 138.63 1.22 NT NT Spane et al. (2001a)
2-W15-41
3/2000 137.21 19.9 5/2000 19.6 Spane et al. (2001b)
2-W15-763
5/2001 136.82 0.93 NT NT Spane et al. (2002)
NT: not tested
0
5
0.01 0.10 1.00 10.00 100.00
Hydraulic Conductivity, m/day
Fre
qu
en
cy
Hanford Site 200-West WMA TX Area Slug Test Results
Hydraulic Conductivity Histogram
Geometric Mean: 2.20 m/day Standard Deviation: 5.64 m/day Range: 0.07 to 19.9 m/day n = 12 well tests
Log-Normal Distribution Curve
Figure 2.1. Hydraulic Conductivity Histogram for Recently Tested TX-TY Tank Farm Area Wells
2.5
60
70
80
90
100
110
120
130
0 5 10 15 20
Hydraulic Conductivity, m/day
Dep
th,
met
ers
belo
w g
roun
d su
rfac
e
Top of Lower Mud
Water Table: 4/2005 Well 299-W14-11Slug Test Results
Well 299-W14-11Hydraulic Conductivity Profile
Zone 1
Completed Well Screen Test
Zone 4
Zone 2
Zone 3
Zone 5
Figure 2.2. Hydraulic Conductivity Vertical Depth Profile for Well 299-W14-11.
3.1
3.0 Hydrologic Test Method Discussion
The following discussion pertains to the three hydrologic test characterization methods identified in the Introduction/Background section of this report that are recommended for consideration specifically for well 299-W15-225 during the drilling/construction phase and following its well completion. The three recommended test methods include:
1) progressive test/depth interval slug test characterization during borehole drilling
2) ambient and dynamic electromagnetic flowmeter surveys within the completed well-screen section
3) a constant-rate pumping and recovery test of well 299-W15-225, and monitoring the areal drawdown/recovery response within surrounding and neighboring 241-TX-TY Tank Farm monitor wells.
Detailed test/depth-interval slug-test characterization provides local-scale hydraulic property characterization of selected test/depth intervals within the penetrated unconfined aquifer. Since it is conducted during the active drilling phase, it is implemented before the other two identified hydrologic test methods. The discrete aquifer hydraulic conductivity distribution information obtained with this method is highly useful for assessing the hydrogeologic controls of aquifer contamination/depth levels, selecting the well-screen completion design, and refining hydraulic-property characterization results obtained with flowmeter and areal, large-scale constant-rate pumping tests. Electromagnetic flowmeter surveys provide a more continuous characterization of the relative hydrologic conductivity profile within the completed well-screen interval. Local to intermediate-scale information is derived using this method, depending on the duration of pumping used during the survey period. When combined with slug and/or pumping test-derived hydraulic properties of the completed well-screened section, an absolute hydraulic-conductivity profile of the well-screened interval within the aquifer can be derived. Constant-rate pumping tests where areal response is monitored at surrounding monitoring well locations provides the opportunity of acquiring intermediate- to large-scale aquifer hydraulic and storage property information. This type of information is of significant relevance for numerical modeling of contaminant transport and optimization of pump-and-treat systems, particularly when it can be constrained by depth-derived hydrologic information obtained by other hydrologic test methods (e.g., depth-interval slug-test characterization). The following provides a general discussion of these hydrologic test methods as well as their relevance to information that could be provided for numerical modeling needs within the 241-TX-TY Tank Farm area (i.e., improving contaminant transport and capture and optimizing pump-and-treat strategies). As noted previously, because the identified dynamic electromagnetic flowmeter survey and constant-rate pumping test are performed within the constructed well-screen section after well completion, detailed test/depth-interval slug-test characterization is conducted first during the initial active drilling/construction phase of the well. The testing sequence for conducting the subsequent electromagnetic flowmeter survey and constant-rate pumping test after the well is completed is arbitrary and can be selected on a basis of convenience either from operational perspectives or equipment availability.
3.2
3.1 Progressive Drill/Slug Test Borehole Characterization
As noted previously, detailed test/depth-interval slug-test characterization provides discrete aquifer hydraulic conductivity versus depth information that can be useful for assessing hydrogeologic controls of contamination depth profile levels within the unconfined aquifer. As discussed in Section 2 and reported in Spane and Newcomer (2008), one neighboring test well immediately east of the TX-TY Tank Farm (well 299-W14-11) has been previously characterized using this slug testing method during the course of test-well drilling. Unfortunately, no hydraulic test characterization was performed within the upper ~7 meters of the unconfined aquifer, which contains the highest 99Tc contaminant levels at the well 299-W14-11 site. Because of the lack of hydraulic test characterization, no quantitative assessment of subsurface hydrogeologic controls on contamination depth levels was possible for this location within the WMA TX-TY Tank Farm Area. Based on this assessment, it is recommended that detailed slug-test-interval characterization be performed at the new extraction well 299-W15-225 within the upper, middle, and lower sections of the unconfined aquifer, as described in Section 3.1.1.
3.1.1 General Test Performance
Guidance for the performance of slug tests is contained in the PNNL procedures manual PNL-MA-567, AT-6 (1993). Briefly stated, slug tests are initiated by applying an instantaneous stress and monitoring the pressure recovery response (i.e., well water-level recovery) back to pre-test conditions. The recovery time and response pattern of the recovery can provide detailed local information concerning the hydraulic properties of the surrounding test formation, the presence of complicating, non-formation conditions (e.g., well skin), and the applicable conceptual model (e.g., homogeneous vs. heterogeneous aquifer).
Slug tests are commonly implemented mechanically by rapidly immersing or removing a submerged slugging rod of known displacement or by pneumatically depressing the well water-column using compressed air (Spane et al. 1996). Generally, mechanically induced slug tests provide more test control. For this reason, slug tests using slugging rods are recommended for the test-depth characterization at well 299-W15-225. It is recommended that the slug tests be conducted using slugging rods of two different displacement volumes producing two-different well stress levels (e.g., 1 to 2 ft, and 3 to 4 ft of well water-level displacement). In addition, it is recommended that the slug tests be repeated for each stress level to assess test reproducibility. As noted in Spane and Newcomer (2008), comparison of the normalized slug-test responses is also useful to evaluate stress-dependent, non-linear test well conditions. Evidence of stress dependence for tests within low to intermediate permeability formations may indicate the effectiveness of well development, and the presence of near-well heterogeneities and dynamic skin conditions, as noted in Butler et al. (1996). Dynamic skin conditions refer to the non-repeatability of test responses conducted at a particular stress level. This non-repeatability of test response is commonly associated with changing formational conditions near the well caused by incomplete well development. As described in Butler (1998), hydraulic-property characterization results obtained from wells exhibiting stress dependence should be viewed with caution; with more credence given to test responses exhibiting less-lagged response characteristics (e.g., tests conducted at lower stress levels). Conversely, wells exhibiting repeatable slug-test responses at different stress levels indicate a stable or static formation condition surrounding the well and suggest that the well is in good hydraulic communication with the surrounding formation and the test interval has been effectively developed.
3.3
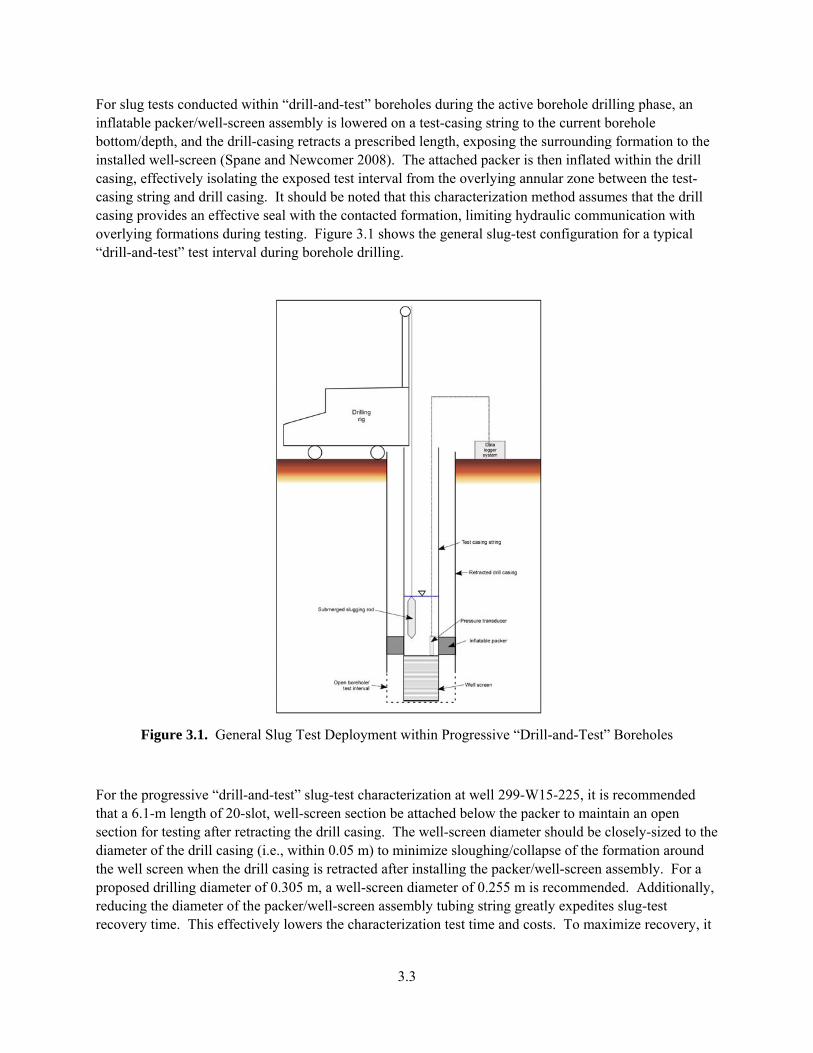
For slug tests conducted within “drill-and-test” boreholes during the active borehole drilling phase, an inflatable packer/well-screen assembly is lowered on a test-casing string to the current borehole bottom/depth, and the drill-casing retracts a prescribed length, exposing the surrounding formation to the installed well-screen (Spane and Newcomer 2008). The attached packer is then inflated within the drill casing, effectively isolating the exposed test interval from the overlying annular zone between the test-casing string and drill casing. It should be noted that this characterization method assumes that the drill casing provides an effective seal with the contacted formation, limiting hydraulic communication with overlying formations during testing. Figure 3.1 shows the general slug-test configuration for a typical “drill-and-test” test interval during borehole drilling.
Figure 3.1. General Slug Test Deployment within Progressive “Drill-and-Test” Boreholes
For the progressive “drill-and-test” slug-test characterization at well 299-W15-225, it is recommended that a 6.1-m length of 20-slot, well-screen section be attached below the packer to maintain an open section for testing after retracting the drill casing. The well-screen diameter should be closely-sized to the diameter of the drill casing (i.e., within 0.05 m) to minimize sloughing/collapse of the formation around the well screen when the drill casing is retracted after installing the packer/well-screen assembly. For a proposed drilling diameter of 0.305 m, a well-screen diameter of 0.255 m is recommended. Additionally, reducing the diameter of the packer/well-screen assembly tubing string greatly expedites slug-test recovery time. This effectively lowers the characterization test time and costs. To maximize recovery, it
3.4
is recommended that a test tubing-string diameter within the range of 0.102 and 0.127 m be used at well 299-W15-225 during the slug-test characterization.
Assuming an aquifer thickness of ~64 meters, three general depth intervals are recommended for progressive “drill-and-test” slug-test characterization: 1) near the top of the unconfined aquifer (e.g., ~0 to 6.1 meters below the water table), 2) near the middle of the unconfined aquifer (e.g., 29.0 to 35.1 meters below the water table), and 3) near the bottom of the unconfined aquifer (e.g., 57.9 to 64.0 meters below the water table). It is recommended that a “double-depth” interval characterization test be performed at each of the three identified general aquifer depth intervals. For this characterization, the drill casing is retracted initially, only exposing the lower half of the installed packer/well screen assembly (i.e., the lower 3.05 m), and the mult-level stress slug-test characterization is completed for this exposed test interval. Following completion of slug-test characterization of the lower half of the well screen, the packer is deflated, and the drill casing is retracted, exposing the entire well screen (i.e., 6.05 m) to the surrounding aquifer. The packer is then inflated, isolating the test section from the overlying water column within the drill casing, and multi-level stress slug-test characterization are conducted to complete the general test/depth-interval characterization.
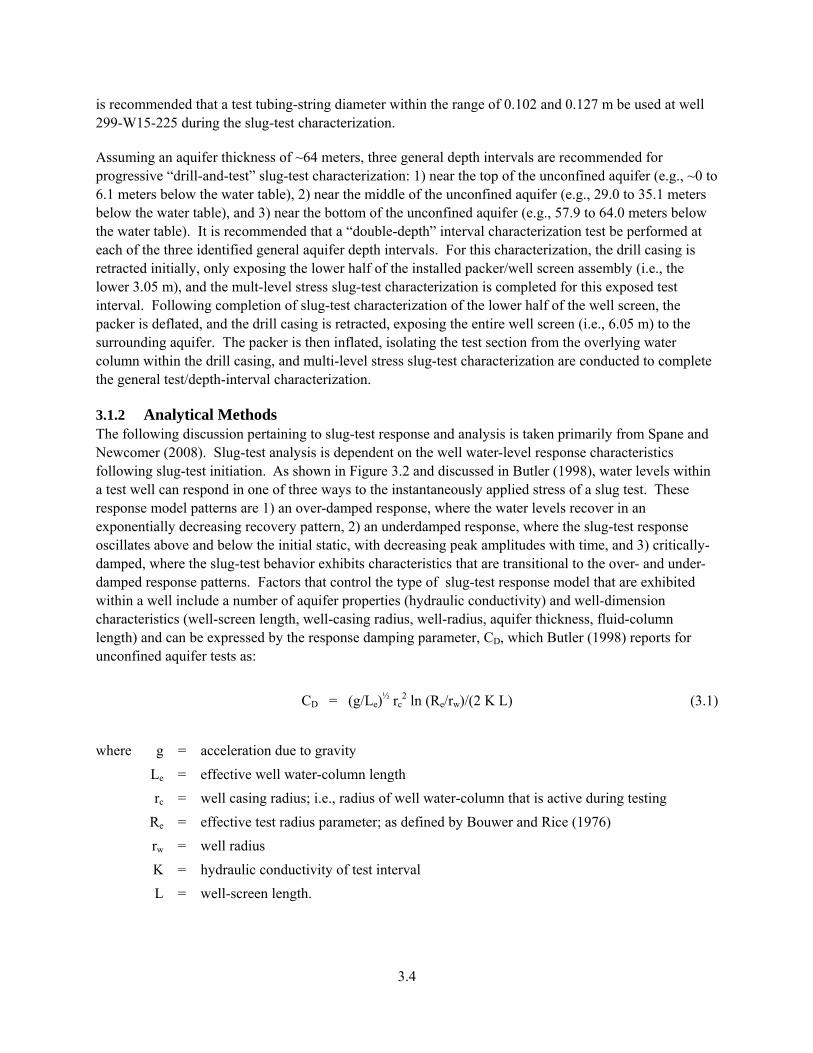
3.1.2 Analytical Methods The following discussion pertaining to slug-test response and analysis is taken primarily from Spane and Newcomer (2008). Slug-test analysis is dependent on the well water-level response characteristics following slug-test initiation. As shown in Figure 3.2 and discussed in Butler (1998), water levels within a test well can respond in one of three ways to the instantaneously applied stress of a slug test. These response model patterns are 1) an over-damped response, where the water levels recover in an exponentially decreasing recovery pattern, 2) an underdamped response, where the slug-test response oscillates above and below the initial static, with decreasing peak amplitudes with time, and 3) critically-damped, where the slug-test behavior exhibits characteristics that are transitional to the over- and under-damped response patterns. Factors that control the type of slug-test response model that are exhibited within a well include a number of aquifer properties (hydraulic conductivity) and well-dimension characteristics (well-screen length, well-casing radius, well-radius, aquifer thickness, fluid-column length) and can be expressed by the response damping parameter, CD, which Butler (1998) reports for unconfined aquifer tests as:
CD = (g/Le)½ rc
2 ln (Re/rw)/(2 K L) (3.1)
where g = acceleration due to gravity
Le = effective well water-column length
rc = well casing radius; i.e., radius of well water-column that is active during testing
Re = effective test radius parameter; as defined by Bouwer and Rice (1976)
rw = well radius
K = hydraulic conductivity of test interval
L = well-screen length.
3.5
-1.0
-0.5
0.0
0.5
1.0
0 5 10 15 20
Time, sec
Dim
ensi
onle
ss H
ead,
HD
Over-Damped
Critically Damped
Under-Damped
Static Level
Test Parameters
L = 10.7 m
b = 20.0 m
rc = 0.0508 m
rw = 0.0508 m
Diagnostic Slug Test Response
Figure 3.2. Diagnostic Slug-Test Response Patterns (adapted from Spane and Newcomer, 2008)
Given the multitude of possible combinations of aquifer properties, well-casing dimensions, and test interval lengths, no universal CD value ranges can be provided that describe slug test response conditions. However, for the assumed test system dimensions anticipated for testing at new extraction well 299-W15-225 during drilling, the following general guidelines on slug test response prediction are provided:
CD >3 = over-damped response
CD 1 - 3 = critically-damped response
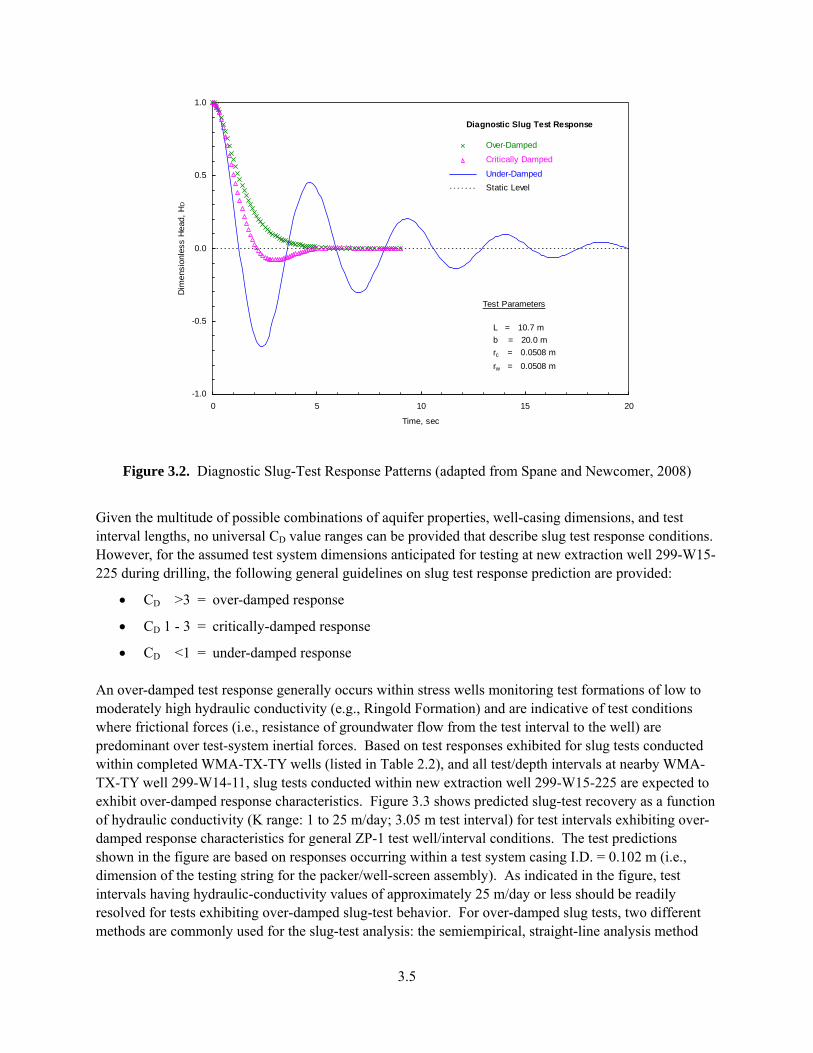
CD <1 = under-damped response An over-damped test response generally occurs within stress wells monitoring test formations of low to moderately high hydraulic conductivity (e.g., Ringold Formation) and are indicative of test conditions where frictional forces (i.e., resistance of groundwater flow from the test interval to the well) are predominant over test-system inertial forces. Based on test responses exhibited for slug tests conducted within completed WMA-TX-TY wells (listed in Table 2.2), and all test/depth intervals at nearby WMA-TX-TY well 299-W14-11, slug tests conducted within new extraction well 299-W15-225 are expected to exhibit over-damped response characteristics. Figure 3.3 shows predicted slug-test recovery as a function of hydraulic conductivity (K range: 1 to 25 m/day; 3.05 m test interval) for test intervals exhibiting over-damped response characteristics for general ZP-1 test well/interval conditions. The test predictions shown in the figure are based on responses occurring within a test system casing I.D. = 0.102 m (i.e., dimension of the testing string for the packer/well-screen assembly). As indicated in the figure, test intervals having hydraulic-conductivity values of approximately 25 m/day or less should be readily resolved for tests exhibiting over-damped slug-test behavior. For over-damped slug tests, two different methods are commonly used for the slug-test analysis: the semiempirical, straight-line analysis method
3.6
described in Bouwer and Rice (1976) and Bouwer (1989, 1996), and the type-curve-matching method for unconfined aquifers presented in Butler (1998). A detailed description of over-damped slug-test analysis methods is presented in Spane and Newcomer (2008).
0.00
0.10
0.20
0.30
0.40
0.50
0.60
0.70
0.80
0.90
1.00
1 10 100 1000 10000
Time, sec
Dim
ensi
onle
ss H
ead,
HD
K = 1 m/d
K = 5 m/d
K = 25 m/d
Test Parameters
rc = 0.051 m
L = 3.05 m
Ss = 1.0E-5 m-1
KD = 1.0
Predicted Over-Damped Slug Test Response
Figure 3.3. Over-Damped Slug-Test Response as a Function of Hydraulic Conductivity
As noted above, slug tests exhibiting under-damped or critically damped behavior are not anticipated for test/depth-interval characterizations conducted at well 299-W15-225 during drilling. A discussion of the response characteristics of under-damped and critically-damped slug test response patterns and the applicable analytical methods are provided in Spane and Newcomer (2008).
3.2 Dynamic Electromagnetic Flowmeter Survey
As noted in Spane (2008a), dynamic electromagnetic borehole flowmeter (EBF) surveys provide direct measurements of groundwater in-flow along the saturated well screen during a constant-rate pumping test. The various measured inflow rates vs. depth are directly related to the vertical profile of hydraulic conductivity outside the well screen within the surrounding aquifer formation. To correct the dynamic flowmeter survey results for natural, in-well vertical flow conditions, an ambient (i.e., non-pumping) EBF survey is normally conducted prior to the dynamic flowmeter test. A detailed description of EBF instrumentation and application of surveys for site characterization is presented in Spane and Newcomer (2008). A review of available hydrologic test-well characterization information indicates that no dynamic EBF flowmeter surveys have been conducted within the WMA TX-TY Tank Farm area. A number of dynamic flowmeter surveys, however, have been successfully completed at other Hanford Site locations, e.g., 300
3.7
Area and 100-D Area, to provide detailed hydraulic-conductivity vs. depth-profile information (e.g., Newcomer 2009). Examples of using EBF survey information to develop vertical depth profiles of hydraulic conductivity and geostatistical realizations within the surrounding aquifer materials at other, non-Hanford Site locations are also presented in Vermeul et al. (2004) and Li et al. (2008). It should be noted that the level of aquifer depth-profile characterization achievable using EBF surveys is limited by the available saturated well-screen sections of the existing well. With this respect, new extraction well 299-W15-225 will be completed with an extended well-screen section (i.e., ~35 m). This extended well-screen length provides the opportunity to characterize the vertical distribution of hydraulic conductivity over a large percentage (i.e., >50%) of the unconfined aquifer surrounding the extraction well location. Based on preliminary design information, it appears the extended well screen for the new extraction well will be position at a distance below the current water table (e.g., top of the well screen completed ~5 to 10 meters below the water table). If this type of aquifer well-screen completion relationship is used at the new extraction well 299-W15-225, a nearby well that is completed in the upper-unconfined aquifer should be considered for a supplemental EBF survey characterization to provide additional detailed hydraulic conductivity/depth-profile information for this uncharacterized upper-section of the unconfined aquifer within this general area. Table 2.1 provides pertinent well-screen completion information and distance relationships to the new extraction well 299-W15-225. Based on a review of Table 2.1, the nearest candidate well that is completed within the upper-unconfined aquifer that can provide access for supplemental EBF characterization is well 299-W15-44.
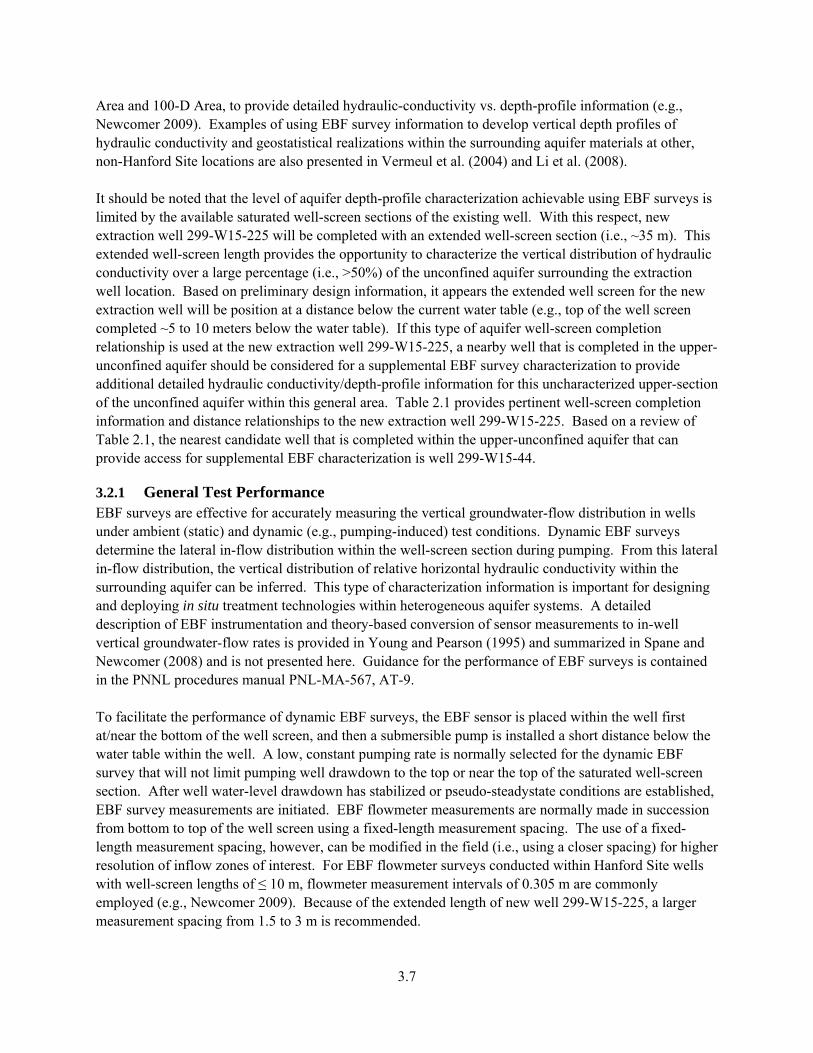
3.2.1 General Test Performance EBF surveys are effective for accurately measuring the vertical groundwater-flow distribution in wells under ambient (static) and dynamic (e.g., pumping-induced) test conditions. Dynamic EBF surveys determine the lateral in-flow distribution within the well-screen section during pumping. From this lateral in-flow distribution, the vertical distribution of relative horizontal hydraulic conductivity within the surrounding aquifer can be inferred. This type of characterization information is important for designing and deploying in situ treatment technologies within heterogeneous aquifer systems. A detailed description of EBF instrumentation and theory-based conversion of sensor measurements to in-well vertical groundwater-flow rates is provided in Young and Pearson (1995) and summarized in Spane and Newcomer (2008) and is not presented here. Guidance for the performance of EBF surveys is contained in the PNNL procedures manual PNL-MA-567, AT-9. To facilitate the performance of dynamic EBF surveys, the EBF sensor is placed within the well first at/near the bottom of the well screen, and then a submersible pump is installed a short distance below the water table within the well. A low, constant pumping rate is normally selected for the dynamic EBF survey that will not limit pumping well drawdown to the top or near the top of the saturated well-screen section. After well water-level drawdown has stabilized or pseudo-steadystate conditions are established, EBF survey measurements are initiated. EBF flowmeter measurements are normally made in succession from bottom to top of the well screen using a fixed-length measurement spacing. The use of a fixed-length measurement spacing, however, can be modified in the field (i.e., using a closer spacing) for higher resolution of inflow zones of interest. For EBF flowmeter surveys conducted within Hanford Site wells with well-screen lengths of ≤ 10 m, flowmeter measurement intervals of 0.305 m are commonly employed (e.g., Newcomer 2009). Because of the extended length of new well 299-W15-225, a larger measurement spacing from 1.5 to 3 m is recommended.
3.8
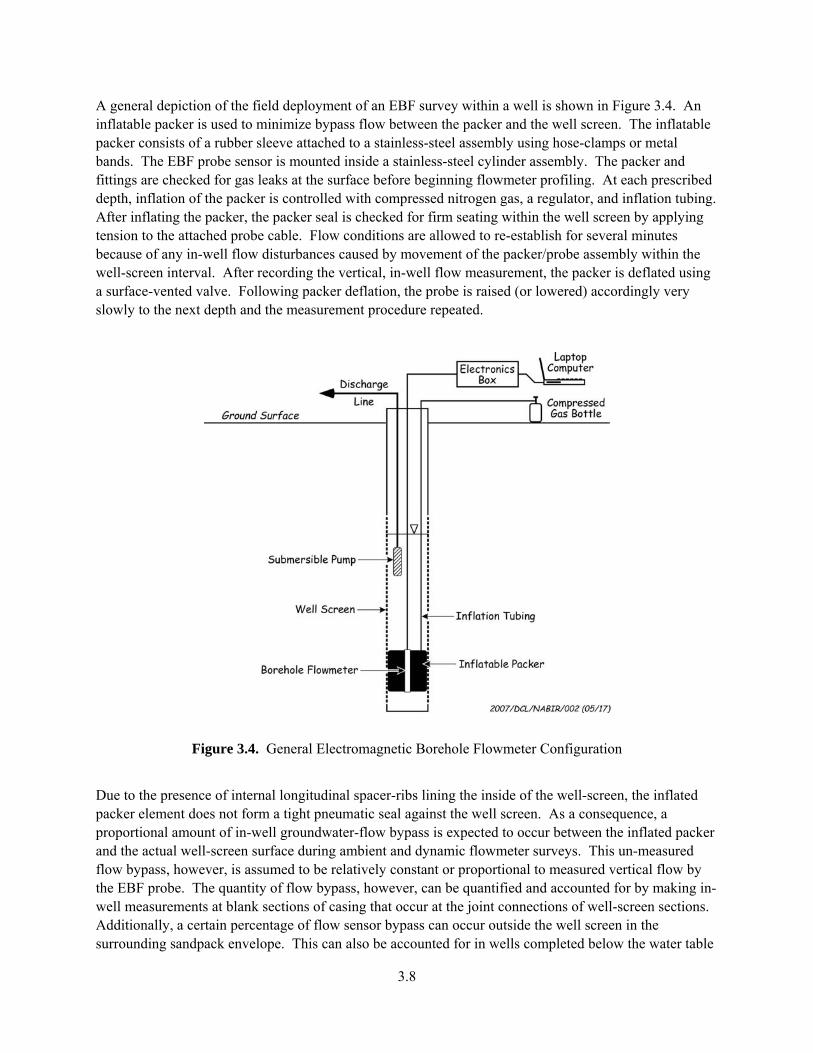
A general depiction of the field deployment of an EBF survey within a well is shown in Figure 3.4. An inflatable packer is used to minimize bypass flow between the packer and the well screen. The inflatable packer consists of a rubber sleeve attached to a stainless-steel assembly using hose-clamps or metal bands. The EBF probe sensor is mounted inside a stainless-steel cylinder assembly. The packer and fittings are checked for gas leaks at the surface before beginning flowmeter profiling. At each prescribed depth, inflation of the packer is controlled with compressed nitrogen gas, a regulator, and inflation tubing. After inflating the packer, the packer seal is checked for firm seating within the well screen by applying tension to the attached probe cable. Flow conditions are allowed to re-establish for several minutes because of any in-well flow disturbances caused by movement of the packer/probe assembly within the well-screen interval. After recording the vertical, in-well flow measurement, the packer is deflated using a surface-vented valve. Following packer deflation, the probe is raised (or lowered) accordingly very slowly to the next depth and the measurement procedure repeated.
Figure 3.4. General Electromagnetic Borehole Flowmeter Configuration
Due to the presence of internal longitudinal spacer-ribs lining the inside of the well-screen, the inflated packer element does not form a tight pneumatic seal against the well screen. As a consequence, a proportional amount of in-well groundwater-flow bypass is expected to occur between the inflated packer and the actual well-screen surface during ambient and dynamic flowmeter surveys. This un-measured flow bypass, however, is assumed to be relatively constant or proportional to measured vertical flow by the EBF probe. The quantity of flow bypass, however, can be quantified and accounted for by making in-well measurements at blank sections of casing that occur at the joint connections of well-screen sections. Additionally, a certain percentage of flow sensor bypass can occur outside the well screen in the surrounding sandpack envelope. This can also be accounted for in wells completed below the water table
3.9
(i.e., such as new well 299-W15-225) by comparing flow measurements at the top of the well screen with flow measurement immediately above this measurement point in the overlying blank casing section. Zero flow calibration adjustments can also be determined within the well by taking flow-measurement readings within the sump-section below the bottom of the well screen at the beginning and end of flowmeter surveying. The zero-flow calibration adjustments account for any uncertainty associated with instrument drift that may occur during the EBF survey.
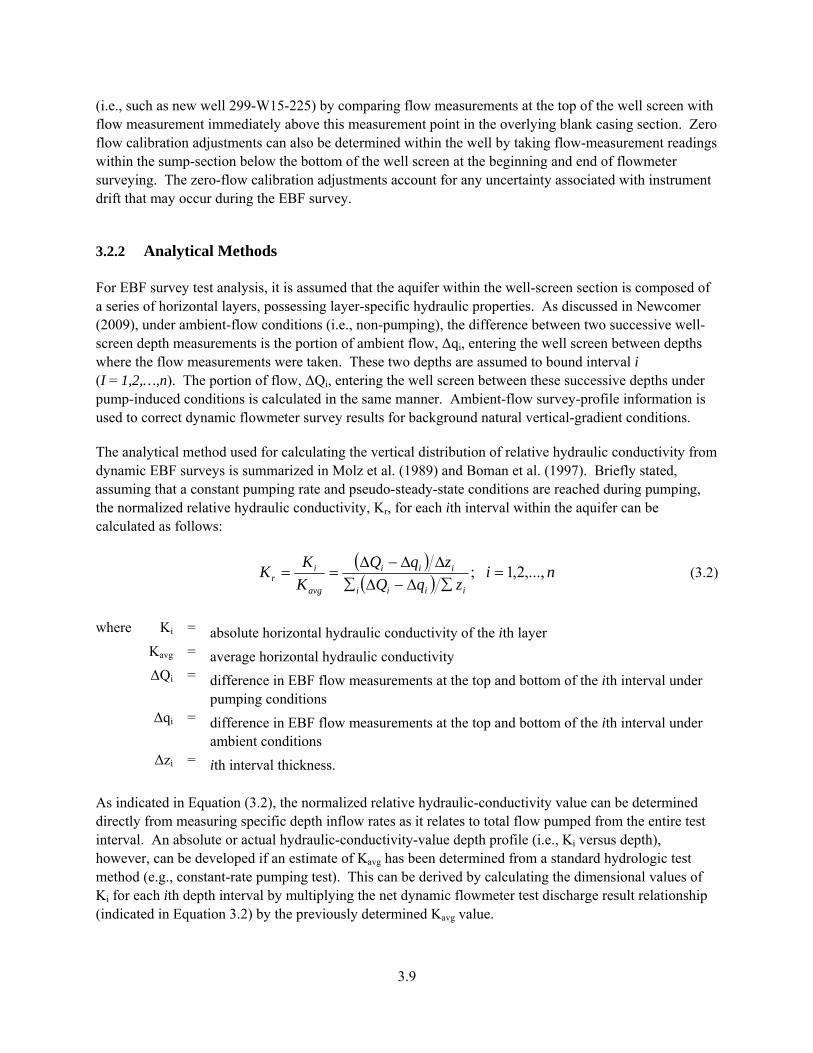
3.2.2 Analytical Methods
For EBF survey test analysis, it is assumed that the aquifer within the well-screen section is composed of a series of horizontal layers, possessing layer-specific hydraulic properties. As discussed in Newcomer (2009), under ambient-flow conditions (i.e., non-pumping), the difference between two successive well-screen depth measurements is the portion of ambient flow, Δqi, entering the well screen between depths where the flow measurements were taken. These two depths are assumed to bound interval i (I = 1,2,…,n). The portion of flow, ΔQi, entering the well screen between these successive depths under pump-induced conditions is calculated in the same manner. Ambient-flow survey-profile information is used to correct dynamic flowmeter survey results for background natural vertical-gradient conditions.
The analytical method used for calculating the vertical distribution of relative hydraulic conductivity from dynamic EBF surveys is summarized in Molz et al. (1989) and Boman et al. (1997). Briefly stated, assuming that a constant pumping rate and pseudo-steady-state conditions are reached during pumping, the normalized relative hydraulic conductivity, Kr, for each ith interval within the aquifer can be calculated as follows:
ni
zqQ
zqQ
K
KK
iiii
iii
avg
ir ,...,2,1;
(3.2)
where Ki = absolute horizontal hydraulic conductivity of the ith layer Kavg = average horizontal hydraulic conductivity ΔQi = difference in EBF flow measurements at the top and bottom of the ith interval under
pumping conditions Δqi = difference in EBF flow measurements at the top and bottom of the ith interval under
ambient conditions Δzi = ith interval thickness.
As indicated in Equation (3.2), the normalized relative hydraulic-conductivity value can be determined directly from measuring specific depth inflow rates as it relates to total flow pumped from the entire test interval. An absolute or actual hydraulic-conductivity-value depth profile (i.e., Ki versus depth), however, can be developed if an estimate of Kavg has been determined from a standard hydrologic test method (e.g., constant-rate pumping test). This can be derived by calculating the dimensional values of Ki for each ith depth interval by multiplying the net dynamic flowmeter test discharge result relationship (indicated in Equation 3.2) by the previously determined Kavg value.
3.10
It should be noted that the analysis method presented previously is strictly valid for EBF surveys conducted within fully penetrating confined aquifer wells. For EBF surveys conducted within partially penetrating unconfined aquifer wells, adverse boundary effects associated with flow convergence (i.e., non-horizontal flow) at the water table and at the base of the well screen are possible. However, because new well 299-W15-225 is planned to be completed at a distance (e.g., 5 to 10 m) below the water table, no significant water-table boundary effects are expected for flowmeter measurements obtained at the top of the well screen. Additionally, any apparent flow convergence effects at the base (or top) of the well screen can be accounted for by taking into account the well/aquifer penetration relationship. For these reasons, the Kr relationship expressed in Equation (3.2) is considered valid for determining the vertical distribution of hydraulic conductivity with depth within the unconfined aquifer at well 299-W15-225.
3.3 Constant-Rate Pumping Test and Recovery
During constant-rate pumping tests, groundwater is extracted from the test interval and regulated to maintain a constant, uniform rate. The pressure response within the pumped well is monitored during the active withdrawal (drawdown) phase and during the subsequent recovery (build-up) period following termination of pumping. The analysis of the drawdown and recovery pressure response within the pumped well and surrounding monitor wells (i.e., multi-well tests) provides a means for estimating hydraulic and storage properties of the aquifer as well as for discerning formational and non-formational flow conditions (e.g., wellbore storage, skin effects, presence of boundaries). Standard analytical methods used to analyze constant-rate tests include type-curve matching and straight-line methods (see Section 3.3.2). Guidance for the performance of constant-rate pumping tests is contained in the PNNL procedures manual PNL-MA-567, AT-7. An excellent reference for measuring, conducting, and analyzing multi-well constant-rate pumping tests is presented in Kruseman and de Ridder (2000). Examples of multi-well constant-rate pumping tests performed on the Hanford Site are presented in Spane et al. (2001a, 2001b, and 2002) and Spane (2008b).
3.3.1 General Test Performance
The extraction of groundwater from a specific well location at a constant rate causes associated drawdown pressure responses to be imposed within an aquifer that are a function of the pumping rate, distance from the point of pumping, and surrounding aquifer hydraulic and storage properties. The collection of observed drawdown data versus time (i.e., since pumping initiated) at the pumped well and various surrounding monitor well locations provides the analysis basis for determining aquifer hydraulic and storage properties.
It should be noted that an inherent assumption in hydraulic test analysis is that the observed well water-level responses are caused solely by the imposed hydrologic stress (e.g., the constant-rate pumping test at new well 299-W15-225). External man-induced stresses (i.e., from surrounding ZP-1 pump-and-treat extraction wells) as well as natural stresses such as barometric pressure fluctuations, however, can have discernible impacts on well water-level measurements and may significantly mask water-level responses within more distant monitoring wells from the pumping well location. To enhance the successful performance of a multi-well constant-rate pumping test at new well 299-W15-225, it is recommended that the transient hydrologic impacts from surrounding ZP-1 extraction wells be removed and that extended baseline monitoring be implemented to remove temporal barometric pressure
3.11
fluctuation effects and background water-table trends (see Section 3.3.3). The sequential steps required for implementing the constant-rate pumping test at extraction well 299-W15-225 are detailed in Section 4.0.
3.3.2 Analytical Methods The following discussion on constant-rate pumping-test analysis is taken largely from Spane and Newcomer (2008) and Spane (2008b) and applies for constant-rate pumping test drawdown and recovery responses both at the pumped-well and surrounding monitor-well locations. Analytical methods used to analyze well water-level responses associated with constant-rate pumping tests assume homogeneous/anisotropic conditions and account for wellbore storage and well/aquifer partial penetration relationships.
3.3.2.1 Diagnostic Analysis and Derivative Plots
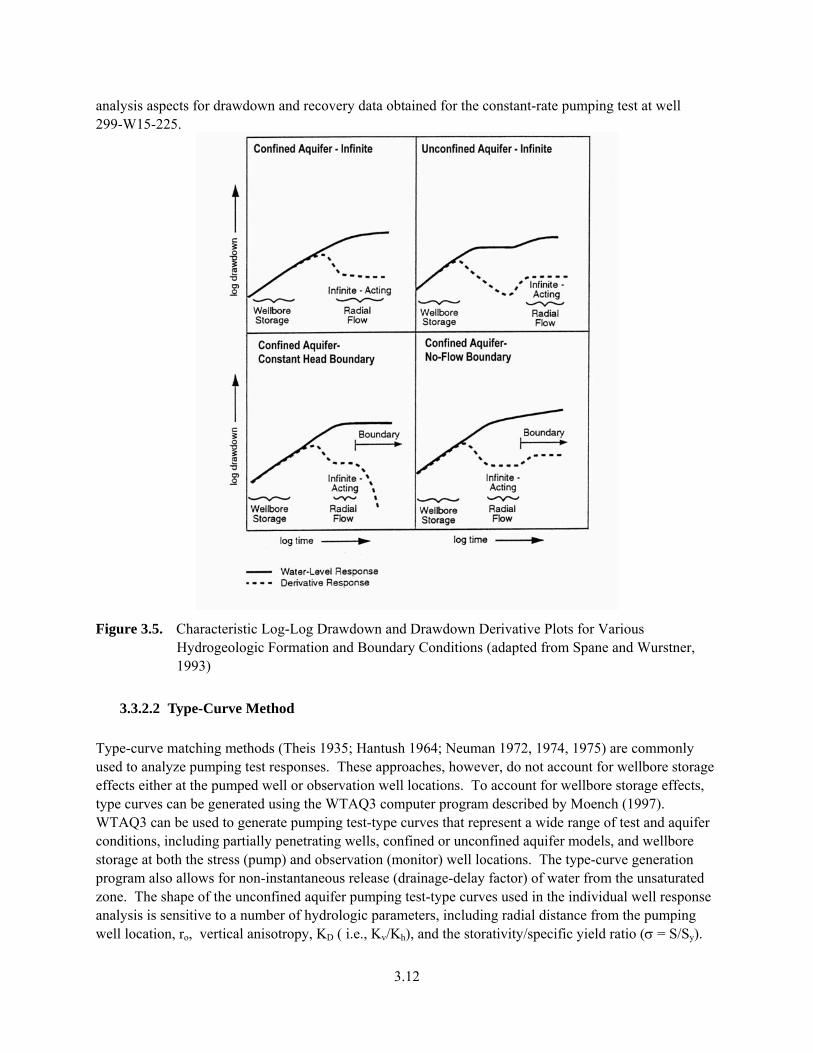
Log-log plots of water level versus time have traditionally been used for diagnostic purposes and, more recently, the derivative of the water level or pressure has also been used (e.g., Bourdet et al. 1989; Spane 1993) as an enhanced diagnostic tool. The derivative of the corrected water level with respect to the natural logarithm of time (i.e., essentially the slope of the semi-log plot) is calculated and plotted on the log-log plots of drawdown versus time. The use of derivative plots has been shown to significantly improve the diagnostic and quantitative analysis of various hydrologic test methods (Bourdet et al. 1989; Spane and Wurstner 1993). The improvement in test analysis is attributed to the sensitivity of pressure derivatives to various test/formation conditions. Specific applications for which derivatives are particularly useful include the following:
determining formation-response characteristics (confined or unconfined aquifer) and boundary conditions (impermeable or constant head) that are evident within the test data
assisting in the selection of the appropriate type-curve solution through combined type-curve/derivative plot matching
determining when infinite-acting, radial flow conditions are established and, therefore, when straight-line analysis methods are applicable.
Figure 3.5 shows log-log drawdown and derivative responses for pumping tests that are characteristic of some commonly encountered formation conditions. The early-time data, when wellbore storage is dominant, produce a steep, upward-trending derivative. The derivative normally decreases during transition from wellbore storage to radial flow and stabilizes at a constant value when infinite-acting, radial flow conditions are established. The stable derivative reflects the straight line on the semi-log plot for infinite-acting radial flow. Unconfined and double-porosity aquifers may show two stable derivative sections at the same vertical position, separated by a “valley” representing the transition from an initial elastic storage response to a total test system storativity condition. Diagnostic derivative plots are also useful in identifying boundary effects. A linear, no-flow boundary will result in a doubling of the magnitude of the derivative. If radial flow is established before the influence of the boundary is seen, a stable derivative will occur for a time followed by an upward shift to twice the original value. Constant-head boundaries display a downward trend in the derivative, which may be preceded by a stable derivative if radial flow conditions occur before the boundary effect becomes dominant. The DERIV program, described in Spane and Wurstner (1993), will be employed for diagnostic and test-
3.12
analysis aspects for drawdown and recovery data obtained for the constant-rate pumping test at well 299-W15-225.
Figure 3.5. Characteristic Log-Log Drawdown and Drawdown Derivative Plots for Various Hydrogeologic Formation and Boundary Conditions (adapted from Spane and Wurstner, 1993)
3.3.2.2 Type-Curve Method
Type-curve matching methods (Theis 1935; Hantush 1964; Neuman 1972, 1974, 1975) are commonly used to analyze pumping test responses. These approaches, however, do not account for wellbore storage effects either at the pumped well or observation well locations. To account for wellbore storage effects, type curves can be generated using the WTAQ3 computer program described by Moench (1997). WTAQ3 can be used to generate pumping test-type curves that represent a wide range of test and aquifer conditions, including partially penetrating wells, confined or unconfined aquifer models, and wellbore storage at both the stress (pump) and observation (monitor) well locations. The type-curve generation program also allows for non-instantaneous release (drainage-delay factor) of water from the unsaturated zone. The shape of the unconfined aquifer pumping test-type curves used in the individual well response analysis is sensitive to a number of hydrologic parameters, including radial distance from the pumping well location, ro, vertical anisotropy, KD ( i.e., Kv/Kh), and the storativity/specific yield ratio ( = S/Sy).
3.13
3.3.2.3 Straight-Line Method
For straight-line analysis methods, the rate of change of water levels within the well during drawdown and/or recovery is analyzed to estimate hydraulic properties. Because well effects are constant with time during constant-rate tests, straight-line methods can be used to quantitatively analyze water-level response at both pumping and observation wells. The semi-log, straight-line analysis techniques commonly used are based either on the Cooper and Jacob (1946) method (for drawdown analysis) or the Theis (1935) recovery method (for recovery analysis). These methods are theoretically restricted to analyzing test responses from wells that fully penetrate non-leaky, homogeneous, isotropic, confined aquifers. Straight-line methods, however, may be applied under non-ideal well and aquifer conditions if infinite-acting, radial flow conditions exist. Infinite-acting, radial flow conditions are indicated during testing when the change in pressure, at the point of observation, increases in proportion to the logarithm of time. As discussed above, the use of diagnostic derivative methods (Bourdet et al. 1989) makes it easier to identify the portions within the test data where straight-line analysis is appropriate. Because of the partially penetrating well conditions for all the WMA TX-TY wells, it is unlikely that infinite-acting radial flow conditions will be established during the pumping test conducted at well 299-W15-225. As a result therefore, the use of straight-line analysis methods would not be appropriate for analyzing well responses associated with this test. The use of straight-line analysis methods is mentioned in this report, however, because of their common use to analyze pumping test results and their previous historical use for pumping tests conducted on the Hanford Site.
3.3.2.4 Unconfined Aquifer Dewatering Drawdown Correction
As noted in Spane and Newcomer (2008), for thin aquifers where drawdown represents a significant percentage of the total saturated thickness, corrections for dewatering the unconfined aquifer are required to account for the decrease in associated aquifer transmissivity. Jacob (1963) provided an equation to correct drawdown data obtained for pumping tests within thin unconfined aquifers. The corrected drawdown, s’, which accounts for aquifer dewatering, can be calculated using the following relationship:
2b
ss's
2
(3.3)
where s is the observed drawdown, and b is the initial saturated aquifer thickness. The unconfined aquifer within the general WMA TX-TY area is relatively thick (i.e., ~64 m), and the predicted areal drawdown and decrease in aquifer thickness during the constant-rate pumping test are expected to be relatively small. Given this condition, the associated aquifer dewatering correction for unconfined aquifer tests would also be relatively small (e.g., for s = 0.5 m; s2/2b = 0.002 m). For this reason, dewatering drawdown corrections are not considered to be of importance for the proposed hydrologic tests.
3.3.3 Barometric-Pressure Effects Removal
As discussed in Spane and Newcomer (2008), barometric-pressure fluctuations can have a discernible impact on well water-level measurements obtained during hydrologic tests for aquifer property
3.14
characterization. Although the pressure transducers commonly used in hydrologic testing are vented to correct the well readings for changes in barometric pressure, barometric fluctuations can also cause actual changes to the water-level elevation within a well that are unrelated to actual surrounding aquifer conditions. This response effect is commonly ascribed to confined aquifers; however, wells completed within unconfined aquifers may also exhibit associated responses to barometric changes (Weeks 1979; Rasmussen and Crawford 1997). Water levels in unconfined aquifers typically exhibit variable time-lagged responses to barometric fluctuations. This time-lag response is caused by the time required for the barometric pressure change to be transmitted from land surface to the water table through the vadose zone, as compared to the instantaneous transmission of barometric pressure through the open well.
To determine the significance of barometric effects and enable their removal from well water-level measurements, an extended baseline monitoring period (e.g., 30 days) is recommended before initiating the step-drawdown and constant-rate pumping tests at well 299-W15-225. Details concerning measurement frequency and general performance activities for the extended baseline monitoring phase are provided in Section 4.2. Collection of an extended record of well water-levels and associated barometric pressure readings during this baseline monitoring period enables barometric response functions to be developed for each of the wells selected for monitoring during the hydrologic test characterization. The development of the barometric response functions provides the means for removing barometric pressure fluctuation effects from well water-level measurements collected during the drawdown and recovery phases for the recommended hydrologic tests, thereby facilitating quantitative hydrologic test analysis. This is particularly relevant for more distant monitoring wells (i.e., >100 m) from the extraction well where temporal barometric pressure fluctuations may have a greater impact on well water-levels than the hydrologic response produced by pumping at the extraction-well location. A detailed description of the barometric removal process is presented in Rasmussen and Crawford (1997) and Spane (1999, 2002). Examples of its application for barometric-pressure removal from similar areal hydrologic test characterization assessments associated with neighboring ZP-1 extraction well locations are provided in Spane and Thorne (2000) and Spane (2008b).
4.1
4.0 Recommendations for Well 299-W15-225 Pumping Drawdown and Recovery Test
The following test plan identifies the specific activities required to perform a multi-well constant-rate pumping test using the new extraction well 299-W15-225 as the stress (pumping) well location and monitor the areal hydrologic response from this imposed pumping on selected surrounding monitor-well locations. The principal objectives of the multi-well constant-rate pumping test are to determine the lateral distribution of hydraulic properties surrounding the new extraction well and to establish the lateral extent or radius of influence imposed by the hydrologic test. Because of the limited duration available for the pumping period (i.e., 3 days), only nearby wells will exhibit response characteristics that can be quantitatively analyzed for aquifer hydraulic-property determination. The principal hydrologic properties determined from analyzing the constant-rate pumping drawdown and recovery responses at nearby wells include transmissivity, hydraulic conductivity, anisotropy, and storativity. It should be noted that a quantitative estimate for aquifer-specific yield will not likely be derived from this planned test. A quantitative estimate for this aquifer parameter would require a pumping period at the new extraction well of approximately several weeks to 1 month to resolve quantitatively from the observed nearby well, water-level responses. As indicated in Table 2.1, the candidate near-field wells that can be identified for hydraulic-property analysis from the constant-rate pumping test include the pumped new well 299-W15-225, well 299-W15-44 (distance = 50.4 m), and well 299-W15-40 (distance = 96.5 m). Their location with respect to the new extraction well 299-W15-225 and surrounding monitor-well locations is shown in Figure 1.1. The remaining wells listed in Table 2.1 are too distant for hydraulic-property characterization purposes during the planned pumping test period. Their well water-level responses, however, can be analyzed for establishing the presence and assessing directional dependence (i.e., horizontal anisotropy) of the imposed hydrologic test response (i.e., radius of influence). To achieve the two identified multi-well, constant-rate pumping test objectives, it is imperative that the analyzed well water-level responses observed during testing are attributed solely to the pumping test response imposed at new well 299-W15-225. To facilitate the test analysis process, the following test elements/phases are identified and discussed in the following report sections. The sequence of the identified aquifer test phase elements are:
Terminating pumping at surrounding ZP-1 extraction wells
Extended baseline monitoring period
Step-drawdown test and recovery
Constant-rate pumping test and recovery. A discussion of identified test element/phases is provided below.
4.2
4.1 Terminating Pumping of Surrounding ZP-1 Extraction Wells
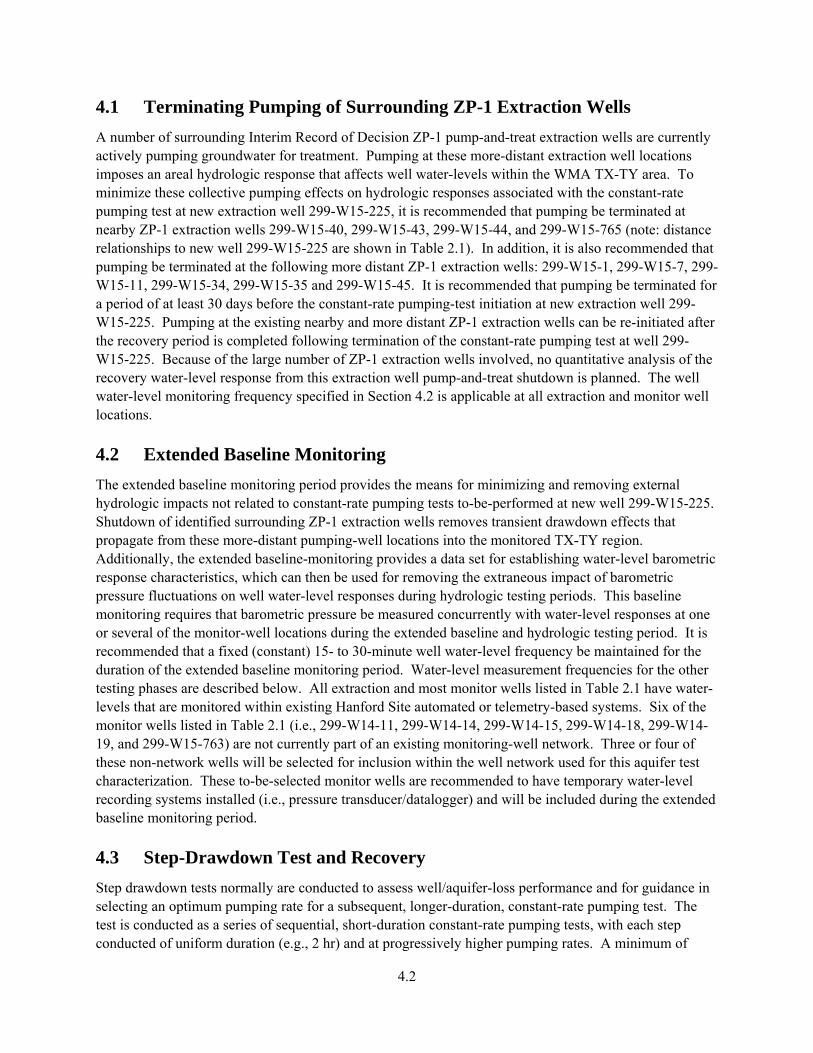
A number of surrounding Interim Record of Decision ZP-1 pump-and-treat extraction wells are currently actively pumping groundwater for treatment. Pumping at these more-distant extraction well locations imposes an areal hydrologic response that affects well water-levels within the WMA TX-TY area. To minimize these collective pumping effects on hydrologic responses associated with the constant-rate pumping test at new extraction well 299-W15-225, it is recommended that pumping be terminated at nearby ZP-1 extraction wells 299-W15-40, 299-W15-43, 299-W15-44, and 299-W15-765 (note: distance relationships to new well 299-W15-225 are shown in Table 2.1). In addition, it is also recommended that pumping be terminated at the following more distant ZP-1 extraction wells: 299-W15-1, 299-W15-7, 299-W15-11, 299-W15-34, 299-W15-35 and 299-W15-45. It is recommended that pumping be terminated for a period of at least 30 days before the constant-rate pumping-test initiation at new extraction well 299-W15-225. Pumping at the existing nearby and more distant ZP-1 extraction wells can be re-initiated after the recovery period is completed following termination of the constant-rate pumping test at well 299-W15-225. Because of the large number of ZP-1 extraction wells involved, no quantitative analysis of the recovery water-level response from this extraction well pump-and-treat shutdown is planned. The well water-level monitoring frequency specified in Section 4.2 is applicable at all extraction and monitor well locations.
4.2 Extended Baseline Monitoring
The extended baseline monitoring period provides the means for minimizing and removing external hydrologic impacts not related to constant-rate pumping tests to-be-performed at new well 299-W15-225. Shutdown of identified surrounding ZP-1 extraction wells removes transient drawdown effects that propagate from these more-distant pumping-well locations into the monitored TX-TY region. Additionally, the extended baseline-monitoring provides a data set for establishing water-level barometric response characteristics, which can then be used for removing the extraneous impact of barometric pressure fluctuations on well water-level responses during hydrologic testing periods. This baseline monitoring requires that barometric pressure be measured concurrently with water-level responses at one or several of the monitor-well locations during the extended baseline and hydrologic testing period. It is recommended that a fixed (constant) 15- to 30-minute well water-level frequency be maintained for the duration of the extended baseline monitoring period. Water-level measurement frequencies for the other testing phases are described below. All extraction and most monitor wells listed in Table 2.1 have water-levels that are monitored within existing Hanford Site automated or telemetry-based systems. Six of the monitor wells listed in Table 2.1 (i.e., 299-W14-11, 299-W14-14, 299-W14-15, 299-W14-18, 299-W14-19, and 299-W15-763) are not currently part of an existing monitoring-well network. Three or four of these non-network wells will be selected for inclusion within the well network used for this aquifer test characterization. These to-be-selected monitor wells are recommended to have temporary water-level recording systems installed (i.e., pressure transducer/datalogger) and will be included during the extended baseline monitoring period.
4.3 Step-Drawdown Test and Recovery
Step drawdown tests normally are conducted to assess well/aquifer-loss performance and for guidance in selecting an optimum pumping rate for a subsequent, longer-duration, constant-rate pumping test. The test is conducted as a series of sequential, short-duration constant-rate pumping tests, with each step conducted of uniform duration (e.g., 2 hr) and at progressively higher pumping rates. A minimum of
4.3
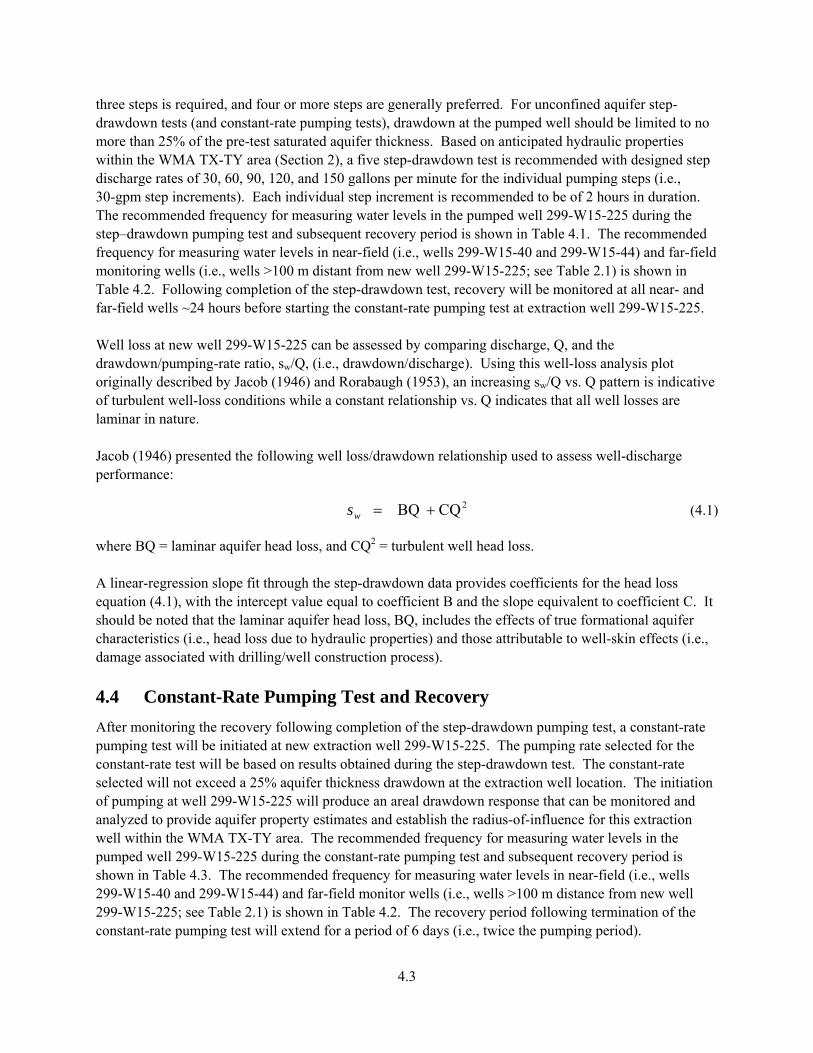
three steps is required, and four or more steps are generally preferred. For unconfined aquifer step-drawdown tests (and constant-rate pumping tests), drawdown at the pumped well should be limited to no more than 25% of the pre-test saturated aquifer thickness. Based on anticipated hydraulic properties within the WMA TX-TY area (Section 2), a five step-drawdown test is recommended with designed step discharge rates of 30, 60, 90, 120, and 150 gallons per minute for the individual pumping steps (i.e., 30-gpm step increments). Each individual step increment is recommended to be of 2 hours in duration. The recommended frequency for measuring water levels in the pumped well 299-W15-225 during the step–drawdown pumping test and subsequent recovery period is shown in Table 4.1. The recommended frequency for measuring water levels in near-field (i.e., wells 299-W15-40 and 299-W15-44) and far-field monitoring wells (i.e., wells >100 m distant from new well 299-W15-225; see Table 2.1) is shown in Table 4.2. Following completion of the step-drawdown test, recovery will be monitored at all near- and far-field wells ~24 hours before starting the constant-rate pumping test at extraction well 299-W15-225. Well loss at new well 299-W15-225 can be assessed by comparing discharge, Q, and the drawdown/pumping-rate ratio, sw/Q, (i.e., drawdown/discharge). Using this well-loss analysis plot originally described by Jacob (1946) and Rorabaugh (1953), an increasing sw/Q vs. Q pattern is indicative of turbulent well-loss conditions while a constant relationship vs. Q indicates that all well losses are laminar in nature. Jacob (1946) presented the following well loss/drawdown relationship used to assess well-discharge performance:
2CQ BQ ws (4.1) where BQ = laminar aquifer head loss, and CQ2 = turbulent well head loss. A linear-regression slope fit through the step-drawdown data provides coefficients for the head loss equation (4.1), with the intercept value equal to coefficient B and the slope equivalent to coefficient C. It should be noted that the laminar aquifer head loss, BQ, includes the effects of true formational aquifer characteristics (i.e., head loss due to hydraulic properties) and those attributable to well-skin effects (i.e., damage associated with drilling/well construction process).
4.4 Constant-Rate Pumping Test and Recovery
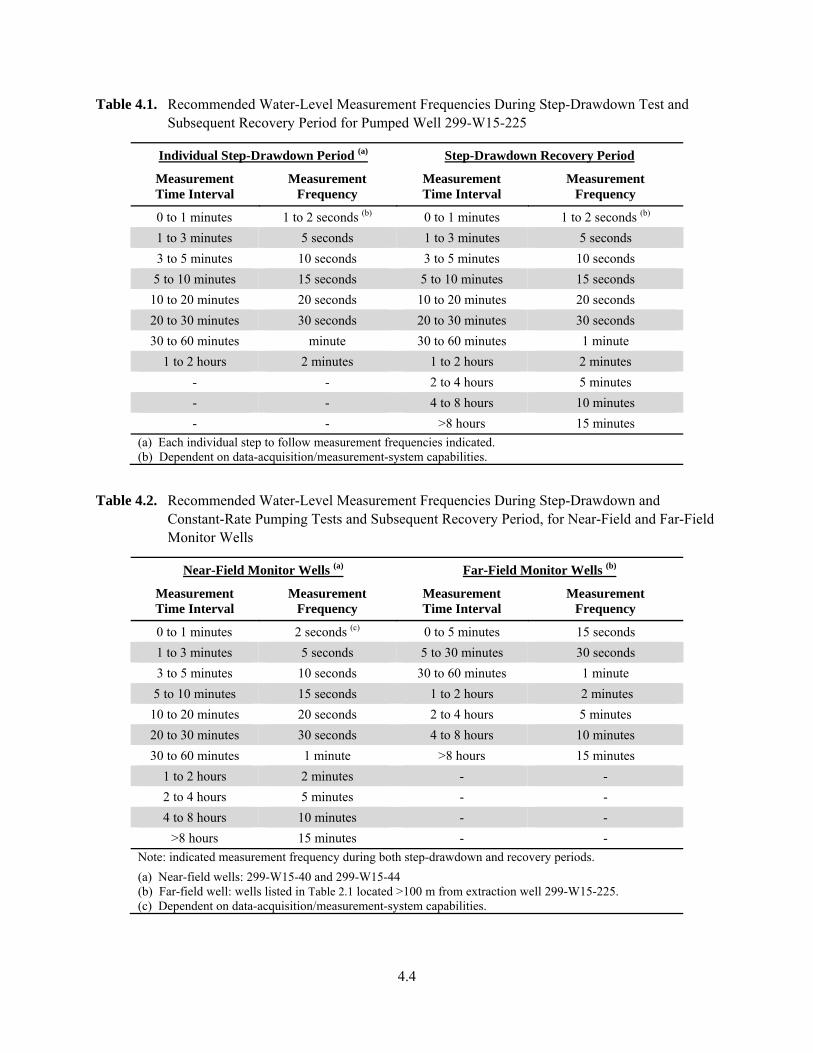
After monitoring the recovery following completion of the step-drawdown pumping test, a constant-rate pumping test will be initiated at new extraction well 299-W15-225. The pumping rate selected for the constant-rate test will be based on results obtained during the step-drawdown test. The constant-rate selected will not exceed a 25% aquifer thickness drawdown at the extraction well location. The initiation of pumping at well 299-W15-225 will produce an areal drawdown response that can be monitored and analyzed to provide aquifer property estimates and establish the radius-of-influence for this extraction well within the WMA TX-TY area. The recommended frequency for measuring water levels in the pumped well 299-W15-225 during the constant-rate pumping test and subsequent recovery period is shown in Table 4.3. The recommended frequency for measuring water levels in near-field (i.e., wells 299-W15-40 and 299-W15-44) and far-field monitor wells (i.e., wells >100 m distance from new well 299-W15-225; see Table 2.1) is shown in Table 4.2. The recovery period following termination of the constant-rate pumping test will extend for a period of 6 days (i.e., twice the pumping period).
4.4
Table 4.1. Recommended Water-Level Measurement Frequencies During Step-Drawdown Test and Subsequent Recovery Period for Pumped Well 299-W15-225
Individual Step-Drawdown Period (a) Step-Drawdown Recovery Period
Measurement Time Interval
Measurement Frequency
Measurement Time Interval
Measurement Frequency
0 to 1 minutes 1 to 2 seconds (b) 0 to 1 minutes 1 to 2 seconds (b)
1 to 3 minutes 5 seconds 1 to 3 minutes 5 seconds
3 to 5 minutes 10 seconds 3 to 5 minutes 10 seconds
5 to 10 minutes 15 seconds 5 to 10 minutes 15 seconds
10 to 20 minutes 20 seconds 10 to 20 minutes 20 seconds
20 to 30 minutes 30 seconds 20 to 30 minutes 30 seconds
30 to 60 minutes minute 30 to 60 minutes 1 minute
1 to 2 hours 2 minutes 1 to 2 hours 2 minutes
- - 2 to 4 hours 5 minutes
- - 4 to 8 hours 10 minutes
- - >8 hours 15 minutes
(a) Each individual step to follow measurement frequencies indicated. (b) Dependent on data-acquisition/measurement-system capabilities.
Table 4.2. Recommended Water-Level Measurement Frequencies During Step-Drawdown and Constant-Rate Pumping Tests and Subsequent Recovery Period, for Near-Field and Far-Field Monitor Wells
Near-Field Monitor Wells (a) Far-Field Monitor Wells (b)
Measurement Time Interval
Measurement Frequency
Measurement Time Interval
Measurement Frequency
0 to 1 minutes 2 seconds (c) 0 to 5 minutes 15 seconds
1 to 3 minutes 5 seconds 5 to 30 minutes 30 seconds
3 to 5 minutes 10 seconds 30 to 60 minutes 1 minute
5 to 10 minutes 15 seconds 1 to 2 hours 2 minutes
10 to 20 minutes 20 seconds 2 to 4 hours 5 minutes
20 to 30 minutes 30 seconds 4 to 8 hours 10 minutes
30 to 60 minutes 1 minute >8 hours 15 minutes
1 to 2 hours 2 minutes - -
2 to 4 hours 5 minutes - -
4 to 8 hours 10 minutes - -
>8 hours 15 minutes - -
Note: indicated measurement frequency during both step-drawdown and recovery periods.
(a) Near-field wells: 299-W15-40 and 299-W15-44 (b) Far-field well: wells listed in Table 2.1 located >100 m from extraction well 299-W15-225. (c) Dependent on data-acquisition/measurement-system capabilities.
4.5
Table 4.3. Recommended Water-Level Measurement Frequencies During Constant-Rate Pumping Test and Subsequent Recovery Period for Pumped Well 299-W15-225
Measurement Time Interval
Measurement Frequency
0 to 1 minutes 1 to 2 seconds (a)
1 to 3 minutes 5 seconds
3 to 5 minutes 10 seconds
5 to 10 minutes 15 seconds
10 to 20 minutes 20 seconds
20 to 30 minutes 30 seconds
30 to 60 minutes 1 minute
1 to 2 hours 2 minutes
2 to 4 hours 5 minutes
4 to 8 hours 10 minutes
>8 hours 15 minutes (a) Dependent on data acquisition/measurement system capabilities.
Pumping at the existing nearby and more-distant ZP-1 extraction wells can be re-initiated after the recovery period is completed following termination of the constant-rate pumping test at well 299-W15-225.
4.5 Other General Test Recommendations
1. All performance information (e.g., pumping rate records, in-well drawdown data) for interim ZP-1 extraction wells listed in Table 2.1 should be collected and made available before starting the step-drawdown and constant-rate pumping tests at new extraction well 299-W15-225.
2. All datalogger time systems and field clocks used during the hydrologic testing and recovery periods should be synchronized with official U.S. time (e.g. http://www.time.gov/timezone.cgi?Pacific/d/-8/java).
3. Depth-to-water measurements should be taken within all wells monitored near the beginning and end of the extended baseline monitoring period and near the end of the recovery period after the constant-rate pumping test is terminated. Depth-to-water measurements should be accurately recorded with respect to time.
4. Field-recovery datalogger systems should be downloaded weekly during the extended baseline monitoring period and at the end of recovery period following the step-drawdown and constant-rate pumping tests.
5. Accurate and detailed field notes should be maintained during all phases of the extended baseline monitoring and hydrologic testing.
DRAFT
5.1
5.0 References
Boman GK, FJ Molz, and KD Boone. 1997. “Borehole Flowmeter Application in Fluvial Sediments: Methodology, Results, and Assessment.” Ground Water 35(3):443–450.
Bourdet DJ, A Ayoub, and YM Pirard. 1989. “Use of Pressure Derivative in Well-Test Interpretation.” SPE Formation Evaluation June 1989:293–302.
Bouwer H. 1989. “The Bouwer and Rice Slug Test – an Update.” Ground Water 27(3):304–309.
Bouwer H. 1996. “Discussion of Bouwer and Rice slug test review articles.” Ground Water 34(1):171.
Bouwer H, and RC Rice. 1976. “A Slug Test for Determining Hydraulic Conductivity of Unconfined Aquifers with Completely or Partially Penetrating Wells.” Water Resources Research 12(3):423–428.
Butler JJ, Jr. 1998. The design, performance, and analysis of slug tests. Lewis Publishers, CRC Press, Boca Raton, Florida. Butler JJ, CD McElwee, and W Liu. 1996. “Improving the Quality of Parameter Estimates Obtained from Slug Tests.” Ground Water 34(3):480–490. Cooper HH, Jr., and CE Jacob. 1946. “A Generalized Graphical Method for Evaluating Formation Constants and Summarizing Well-Field History.” American Geophysical Union, Transactions 27(4):526–534.
DOE/RL. 2008. Proposed plan for remediation of the 200-ZP-1 groundwater operable unit, record of decision, Hanford 200 Area, 200-ZP-1 superfund site, Benton county, Washington. DOE/RL-2007-33, Rev.0, U.S. Department of Energy, Richland Operations Office, Richland, Washington.
Hantush MS. 1964. “Hydraulics of Wells.” Advances in Hydroscience (VT Chow, ed) 1:282–433, Academic Press, New York.
Jacob CE. 1946. “Drawdown Test to Determine Effective Radius of an Artesian Well.” Proceedings, ASCE, Paper No. 2321.
Jacob CE. 1963. “Determining the permeability of water-table aquifers.” In: Methods of Determining Permeability, Transmissibility, and Drawdown. U.S. Geological Survey, Water-Supply Paper 1536-I:245-271.
Kruseman GP, and NA de Ridder (with assistance from JM Verweij). 2000. Analysis and evaluation of pumping test data. International Institute for Land Reclamation and Improvement, Wageningen, The Netherlands. Publication 47, Second Edition (Completely Revised), 377 p.
Li W, A Englert, OA Cirpka, and H Vereecken. 2008. “Three-Dimensional Geostatistical Inversion of Flowmeter and Pumping Test Data.” Ground Water 46(2):193–201.
DRAFT
5.2
Moench AF. 1997. “Flow to a Well of Finite Diameter in a Homogeneous, Anisotropic Water-Table Aquifer.” Water Resources Research 33(6):1397–1407.
Molz FJ, RH Morin, AE Hess, JG Melville, and O Gueven. 1989. “The Impeller Meter for Measuring Aquifer Permeability Variations: Evaluation and Comparison with Other Tests.” Water Resources Research, 25(7), 1677–1683. Neuman SP. 1972. “Theory of Flow in Unconfined Aquifers Considering Delayed Response of the Water Table.” Water Resources Research 8(4):1031–1045. Neuman SP. 1974. “Effect of Partial Penetration of Flow in Unconfined Aquifer Considering Delayed Gravity Response.” Water Resources Research 10(2):303–312. Neuman SP. 1975. “Analysis of Pumping Test Data from Anisotropic Unconfined Aquifers Considering Delayed Gravity Response.” Water Resources Research 11(2):329–342.
Newcomer DR. 2009 (in progress). Electromagnetic Borehole Flowmeter Surveys at Selected In-Situ Redox Manipulation Barrier Wells, Zero-Valent Iron Site, Hanford, Washington. Pacific Northwest National Laboratory, Richland, Washington.
PNL-MA-567. 1993. Procedures for Ground-Water Investigations: AT-5, Rev.2: “Constant-rate discharge and recovery tests”; AT-6, Rev.2: “Slug injection and withdrawal tests”; AT-9, Rev. 0: “Electromagnetic borehole flowmeter survey”. Pacific Northwest National Laboratory, Richland, Washington.
Rasmussen TC, and LA Crawford. 1997. “Identifying and removing barometric pressure effects in confined and unconfined aquifers.” Ground Water 35(3):502–511.
Rorabaugh MI. 1953. “Graphical and Theoretical Analysis of Step Drawdown Tests of Artesian Wells.” Proceedings, ASCE 79 Paper No. 362.
Spane FA, Jr. 1993. Selected Hydraulic Test Analysis Techniques for Constant-Rate Discharge Tests. PNL-8539, Pacific Northwest Laboratory, Richland, Washington.
Spane FA, Jr. 1999. Effects of Barometric Fluctuations on Well Water-Level Measurements and Aquifer Test Data. PNNL-13078, Pacific Northwest National Laboratory, Richland, Washington.
Spane FA, Jr. 2002. “Considering barometric pressure in groundwater flow investigations.” Water Resources Research 38(6), 14:1–18.
Spane FA. 2008a. Aquifer Testing Recommendations for Supporting Phase II of the T-Area Technetium-99 Data Objectives Process – Letter Report. PNNL-17433, Pacific Northwest National Laboratory, Richland, Washington.
Spane FA. 2008b. Analysis of the Hydrologic Response Associated with Shutdown and Restart of the 200-ZP-1 WMA T Tank Farm Pump-and-Treat System. PNNL-17732, Pacific Northwest National Laboratory, Richland, Washington.
DRAFT
5.3
Spane FA, Jr., and DR Newcomer. 2008. Results of Detailed Hydrologic Characterization Tests – Fiscal and Calendar Year 2005. PNNL-17348, Pacific Northwest National Laboratory, Richland, Washington.
Spane FA, Jr., and PD Thorne. 2000. Analysis of the Hydrologic Response Associated with Shutdown and Restart of the 200-ZP-1 Pump-and-Treat System. PNNL-13342, Pacific Northwest National Laboratory, Richland, Washington.
Spane FA, Jr., and SK Wurstner. 1993. “DERIV: A program for calculating pressure derivatives for use in hydraulic test analysis.” Ground Water 31(5):814–822.
Spane FA, Jr., PD Thorne, and LC Swanson. 1996. “Applicability of Slug Interference Tests for Hydraulic Characterization of Unconfined Aquifer: (2) Field Test Examples.” Ground Water 34(5):925–933.
Spane FA, Jr., PD Thorne, and DR Newcomer. 2001a. Results of Detailed Hydrologic Characterization Tests – FY 1999. PNNL-13378, Pacific Northwest National Laboratory, Richland, Washington.
Spane FA, Jr., PD Thorne, and DR Newcomer. 2001b. Results of Detailed Hydrologic Characterization Tests – FY 2000. PNNL-13514, Pacific Northwest National Laboratory, Richland, Washington.
Spane FA Jr., PD Thorne, and DR Newcomer. 2002. Results of Detailed Hydrologic Characterization Tests – FY 2001. PNNL-14113, Pacific Northwest National Laboratory, Richland, Washington.
Spane FA, Jr., PD Thorne, and DR Newcomer. 2003. Results of Detailed Hydrologic Characterization Tests – FY 2002. PNNL-14186, Pacific Northwest National Laboratory, Richland, Washington.
Theis CV. 1935. “The Relationship Between the Lowering of the Piezometric Surface and the Rate and Duration of Discharge of a Well Using Ground-Water Storage.” Amer. Geophys. Union, Transactions, 2: 519–524; reprinted in Society of Petroleum Engineers, "Pressure Transient Testing Methods.", SPE Reprint Series (14):27-32.
Vermeul VR, BN Bjornstad, CJ Murray, DR Newcomer, ML Rockhold, JE Szecsody, MD Williams, and Y Xie. 2004. In Situ Redox Manipulation Permeable Reactive Barrier Emplacement: Final Report – Frontier Hard Chrome Superfund Site, Vancouver, WA. PNWD-3361, Pacific Northwest National Laboratory, Richland, Washington.
Weeks EP. 1979. “Barometric Fluctuations in Wells Tapping Deep Unconfined Aquifers.” Water Resources Research 15(5):1167–1176.
Young SC, and HS Pearson. 1995. “The Electromagnetic Borehole Flowmeter: Description and Application.” Ground-Water Monitoring Review. Fall:138–147.
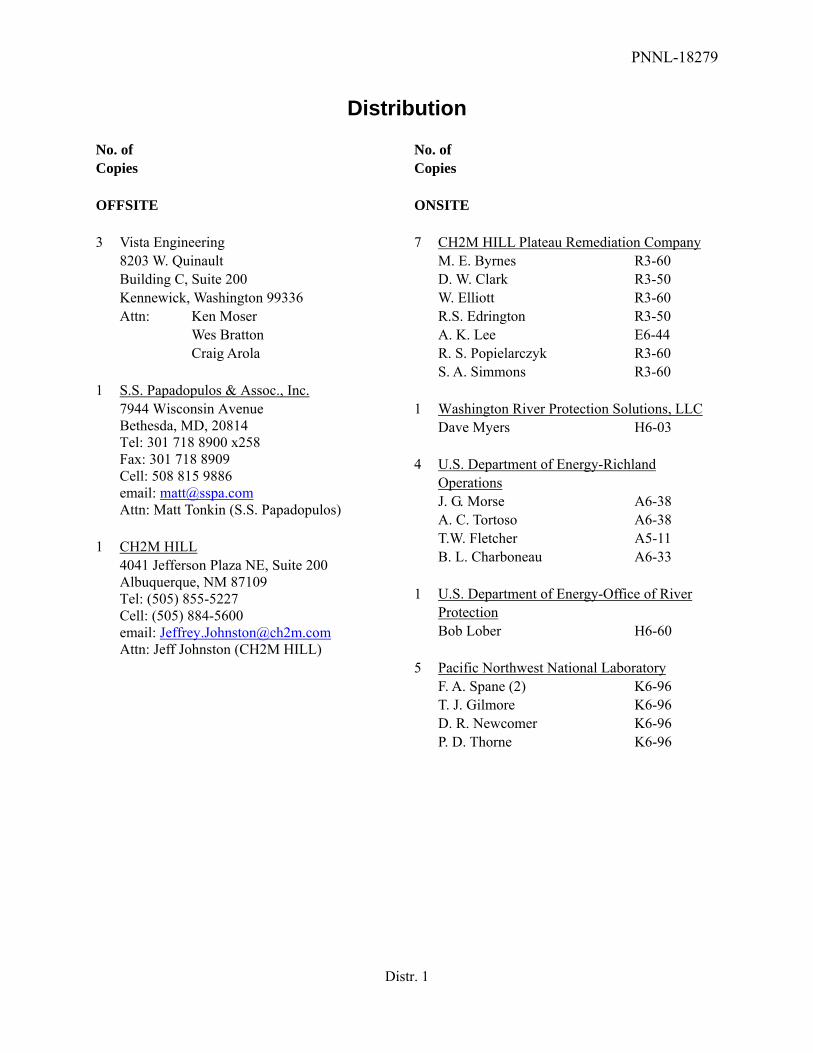
PNNL-18279
Distr. 1
Distribution No. of Copies OFFSITE
No. of Copies ONSITE
3 Vista Engineering 8203 W. Quinault Building C, Suite 200 Kennewick, Washington 99336 Attn: Ken Moser Wes Bratton Craig Arola
1 S.S. Papadopulos & Assoc., Inc. 7944 Wisconsin Avenue Bethesda, MD, 20814 Tel: 301 718 8900 x258 Fax: 301 718 8909 Cell: 508 815 9886 email: [email protected] Attn: Matt Tonkin (S.S. Papadopulos)
1 CH2M HILL 4041 Jefferson Plaza NE, Suite 200 Albuquerque, NM 87109 Tel: (505) 855-5227 Cell: (505) 884-5600 email: [email protected] Attn: Jeff Johnston (CH2M HILL)
7 CH2M HILL Plateau Remediation Company M. E. Byrnes R3-60 D. W. Clark R3-50 W. Elliott R3-60 R.S. Edrington R3-50 A. K. Lee E6-44 R. S. Popielarczyk R3-60 S. A. Simmons R3-60
1 Washington River Protection Solutions, LLC Dave Myers H6-03
4 U.S. Department of Energy-Richland Operations J. G. Morse A6-38 A. C. Tortoso A6-38 T.W. Fletcher A5-11 B. L. Charboneau A6-33
1 U.S. Department of Energy-Office of River Protection Bob Lober H6-60
5 Pacific Northwest National Laboratory F. A. Spane (2) K6-96 T. J. Gilmore K6-96 D. R. Newcomer K6-96 P. D. Thorne K6-96