Embed Size (px)
Citation preview

Board of Governors of the Federal Reserve System
mi• 92 Digitized for FRASER http://fraser.stlouisfed.org/ Federal Reserve Bank of St. Louis
February 1992
This publication is available from Publications Services, Board of Governors of the Federal Reserve System, Washington, DC 20551.
Digitized for FRASER http://fraser.stlouisfed.org/ Federal Reserve Bank of St. Louis

Contents
1 INTRODUCTION
Parti The 1992 Budgets
Chapter 1 5 FEDERAL RESERVE SYSTEM 5 Net Expenses 7 Trends in Expenses and Employment 8 Operational Areas 8 1992 Budget Initiatives
Chapter 2 11 BOARD OF GOVERNORS 11 Overview of the Budget 12 Operations Budget by Operational Area 14 Operations Budget by Division 17 Operations Budget by Object of Expense 19 Capital Budget 19 Trends 21 Extraordinary Items 22 Office of Inspector General
Chapter 3 23 FEDERAL RESERVE BANKS 23 Major Initiatives 25 1992 Budget Objective 26 Operational Areas 30 Objects of Expense 31 Capital Outlays 32 Trends in Expenses and Employment 33 Volume and Unit Costs 33 1991 Budget Performance
Part II Special Analysis
Chapter 4 37 TREASURY DIRECT: A BOOK-ENTRY SAFEKEEPING
SYSTEM FOR INDIVIDUAL INVESTORS 37 Features of Treasury Direct 40 Growth of Treasury Direct
Digitized for FRASER http://fraser.stlouisfed.org/ Federal Reserve Bank of St. Louis

Appendixes
Appendix A 45 MISSION AND OPERATIONAL AREAS
OF THE FEDERAL RESERVE SYSTEM 45 Monetary and Economic Policy 45 Services to the U.S. Treasury and Other Government Agencies 46 Services to Financial Institutions and the Public 47 Supervision and Regulation
Appendix B 49 BUDGET PROCESSES 49 The Budget and Control Process of the Board of Governors 50 The Budget and Control Process of the Federal Reserve Banks
Appendix C 55 SPECIAL CATEGORIES OF SYSTEM EXPENSE 55 Priced Services 58 Capital Outlays 58 Special Projects 59 Currency Printing
Appendix D 61 SOURCES AND USES OF FUNDS
Appendix E 63 FEDERAL RESERVE SYSTEM AUDITS 63 General Accounting Office 66 Office of Inspector General
Appendix F 67 EXPENSES AND EMPLOYMENT
AT THE FEDERAL RESERVE BANKS
74 MAPS OF THE FEDERAL RESERVE SYSTEM
Digitized for FRASER http://fraser.stlouisfed.org/ Federal Reserve Bank of St. Louis
1
Introduction
This report describes the budgeted expenses of the Federal Reserve System for 1992 and compares them with expenses for 1990 and 1991. For 1992, the Federal Reserve System has budgeted net operating expenses of $776.2 million. During this year, the System expects to realize $786.1 million, or 45.6 percent of its total operating expenses, from its priced services. Total operating expenses are budgeted at $1,725.2 million, an increase of 6.9 percent over 1991 esti-mated expenses.
The Federal Reserve System consists of the Board of Governors in Washing-ton, D.C., the twelve Federal Reserve Banks with their twenty-five Branches, the Federal Open Market Committee, and three advisory groups—the Federal Advisory Council, the Consumer Ad-visory Council, and the Thrift Institutions Advisory Council.
The System was created by the Fed-eral Reserve Act, passed by the Congress in 1913 to establish a safer and more flexible monetary and banking system. After the inception of the Federal Reserve System, it became clear that these original purposes were part of broader national economic and financial objectives. Stability and growth of the economy, stability in the purchasing power of the dollar, and reasonable balance in transactions with foreign countries have come to be recognized as primary objectives of governmental economic policy. Over the years, such objectives have been articulated by the Congress in legislation giving the Federal Reserve more authority and responsibility.
As the nation's central bank, the Fed-eral Reserve, through its conduct of monetary policy, attempts to ensure growth of the economy consistent with price stability. As the nation's lender of last resort, the Federal Reserve also has the responsibility to forestall national liquidity crises.
Because a sound financial structure is essential to an effective monetary policy and a growing and prosperous economy, the Congress has entrusted the Federal Reserve with a variety of bank super-visory and regulatory functions. Among other things, the Federal Reserve administers the laws that regulate all bank holding companies; it supervises state-chartered banks that are members of the Federal Reserve System; it regulates the foreign activities of U.S. banks and the U.S. activities of foreign banks; and it establishes rules to ensure that consumers are informed adequately and treated fairly in credit transactions.
The Federal Reserve System also plays a major role in the nation's payments mechanism. Federal Reserve Banks distribute currency and coin, provide both wire and automated clearinghouse transfers of funds and securities, and process 32 percent of all domestic checks. The Federal Reserve serves as the fiscal agent for the U.S. Treasury and provides a variety of other financial services for the Treasury and other government agencies.
To carry out these responsibilities in 1991, the Federal Reserve System spent an estimated $1.6 billion and earned an estimated $928 million in revenue from priced services, reimbursements,
Digitized for FRASER http://fraser.stlouisfed.org/ Federal Reserve Bank of St. Louis
2 Annual Report: Budget Review, 1989-90
and other income, for a 1991 total of $687 million in net operating expenses. The major source of Federal Reserve income is earnings on the portfolio of U.S. government securities in the System Open Market Account, estimated at $21.3 billion in 1991. The System uses purchases and sales from this portfolio to implement monetary policy. Gains on foreign exchange transactions approxi-mated $2.5 billion.
Each year the Federal Reserve returns to the U.S. Treasury its earnings in excess of expenses, dividends, and surplus—in 1991, an estimated $20.8 billion. These earnings are treated as receipts in the U.S. budget accounting system; projections of these earnings by the Office of Management and Budget appear in the U.S. budget. •
Digitized for FRASER http://fraser.stlouisfed.org/ Federal Reserve Bank of St. Louis
Parti The 1992 Budgets
Digitized for FRASER http://fraser.stlouisfed.org/ Federal Reserve Bank of St. Louis

5
Chapter 1
Federal Reserve System
For 1992, the Federal Reserve System has budgeted net operating expenses of $776.2 million. It expects to realize $786.1 million, or 45.6 percent of total budgeted operating expenses, from revenues from priced services. Total operating expenses are budgeted at $1,725.2 million, an increase of 6.9 per-cent over 1991 estimated expenses. The budgeted operating expenses of the System comprise those of the Reserve Banks, $1,596.4 million, and the Board of Governors, $128.8 million (tables 1.1 and 1.2).
Not included in these costs are Reserve Bank special projects, budgeted at $20.1 million for 1992, up from $6.8 million estimated for 1991.1 Also excluded is the budgeted cost of cur-rency at $325.8 million for 1992, an increase of 25.2 percent over the estimated 1991 cost of $260.2 million.2
When special projects and the cost of currency are added to operating ex-penses, the Reserve Banks account for 77.1 percent of the total; the Board, 6.2 percent; special projects, 1.0 percent; and currency, 15.7 percent (chart 1.1). This distribution of expenses is similar to that in 1991.
1. As research and development efforts, special projects are separate from the continuing operations of the System and, therefore, are not included in System operating expenses. These relatively costly, short-term projects are expected to benefit both the System and the banking industry as a whole. A description of the special projects for 1992 appears in appendix C.
2. The Federal Reserve bears the cost associated with the printing of new currency at the Bureau of Engraving and Printing. Because this cost is determined largely by public demand for new currency, it is not included in Federal Reserve operating expenses. See appendix C.
Net Expenses The System expects to recover 55.0 per-cent of the expenses it incurs during 1992. The following items are deducted from System operating expenses to derive net expenses: (1) revenue from priced payments mechanism services provided to depository institutions, (2) other income from services on behalf of the U.S. Treasury that are paid for by depository institutions using the ser-vices, and (3) claims for reimbursement by the U.S. Treasury and other gov-ernment agencies for fiscal agency ser-vices. After deducting these items, the net expenses of the System of $776.2 million show an increase of 13.0 percent over net System operating expenses estimated for 1991.
As required by the Monetary Control Act, receipts for priced services represent fees that are set to recover the full cost of providing these services to depository institutions, including the imputed costs of float and the return on capital that would have been provided and the taxes
Chart 1.1 Distribution of Expenses of the Federal Reserve System, 19921
1. See text notes 1 and 2. Digitized for FRASER http://fraser.stlouisfed.org/ Federal Reserve Bank of St. Louis

6 Annual Report: Budget Review, 1989-90
that would have been paid had a commer-cial entity in the private sector furnished the services. The revenue from priced services is detailed in table 1.3; the constraint imposed on Federal Reserve budgets by the need to keep such services competitive and the calculation of fees are discussed in appendix C. A l l sources and uses of funds are presented in appen-
dix D; the audits of the System are listed in appendix E.
The category ' 'Other income'' in table 1.2 includes fees from such services as the transfer of U.S. Treasury book-entry securities in the secondary market, the settlement of such transfers among depository institutions, and wire transfer of funds between a depository institution
Table 1.1 Operating Expenses, Special Projects, and Cost of Currency of the Federal Reserve System, 1990-921
Mi l l i ons o f dollars, except as noted
Ent i ty and type o f expense
1990 actual
1991 estimate
1992 budget
Percent change Ent i ty and type o f expense
1990 actual
1991 estimate
1992 budget
1990-91 1991-92
Reserve Banks 2 1,406.6 1,501.5 1,596.4 6.7 6.3 Personnel 897.6 971.2 1,037.6 8.2 6.8 Nonpersonnel 509.0 530.3 558.8 4.2 5.4
Board o f Governors3 103.7 112.9 128.8 8.9 14.1 Personnel 79.0 86.8 94.5 9.9 8.9 Nonpersonnel 24.7 26.1 34.3 5.7 31.4
System operating expenses 1,510.3 1,614.4 1,725.2 6.9 6.9 Personnel 976.6 1,058.0 1,132.1 8.3 7.0 Nonpersonnel 533.7 556.4 593.1 4.3 6.6
Special projects4 5.2 6.8 20.1
Currency 5 192.9 260.2 325.8 34.9 25.2
1. In this and subsequent tables in this vo lume, details 3. Includes expenses o f the Of f ice o f Inspector Gen-may not sum to totals and may not y ie ld percentage eral. For detailed in format ion, see chapter 2. changes shown because o f rounding. 4. See text note 1 and appendix C.
2. For detailed informat ion, see chapter 3. 5. See text note 2 and appendix C.
Table 1.2 Operating Expenses of the Federal Reserve System, Net of Receipts and Claims for Reimbursement, 1990-92 M i l l i o n s o f dollars, except as noted
I tem 1990
actual 1991
estimate 1992
budget
Percent change I tem
1990 actual
1991 estimate
1992 budget
1990-91 1991-92
Tota l System operating expenses 1,510.3 1,614.5 1,725.2 6.9 6.9 LESS
Revenue f r om pr iced services 746.5 758.4 786.1 1.6 3.7 Other income 19.1 19.4 5.0 1 1.6 - 7 4 . 2 Cla ims for reimbursement2 140.3 149.7 157.9 6.7 5.5
EQUALS Net System operating expenses 604.4 687.0 776.2 13.7 13.0
1. Beginn ing January 1992, fees for transfer o f U.S. 2. Costs o f fiscal agency services prov ided to the U.S. Treasury book-entry securities w i l l no longer be inc luded Treasury and other government agencies for wh i ch the i n " O t h e r i ncome , " but w i l l be forwarded direct ly to the agencies have agreed to reimburse the Federal Reserve. I n Treasury's account. practice, not al l these claims are paid.
Digitized for FRASER http://fraser.stlouisfed.org/ Federal Reserve Bank of St. Louis

Federal Reserve System 1
Table 1.3 Revenue from Priced Services, 1990-92 Mi l l ions o f dollars
Service 1990 actual
1991 estimate
1992 budget
Funds transfers and net settlement 79.7 79.6 87.6
Automated clearinghouse services 53.5 58.8 64.9
Commercial checks 571.9 578.2 592.7 Book-entry securities
transfers 10.7 11.6 12.3 Definit ive securities 5.3 4.5 3.9
safekeeping Noncash collection 10.8 10.6 9.4 Special cash services 14.5 15.1 15.4
Total 746.4 758.4 786.2
and the Treasury. (But see note 2 in table 1.2.)
Claims for reimbursement represent the expenses incurred by Reserve Banks in providing fiscal agency services to the U.S. Treasury or to other government agencies and for which the agencies have agreed to reimburse the Federal Reserve.
Trends in Expenses and Employment From 1982 (actual expenditures) to 1992 (amount budgeted), the expenses of the Federal Reserve System have increased
Chart 1.2 Operating Expenses of the Federal Reserve System, 1982-921
B i l l i ons o f dol lars
1. For 1991, estimate; for 1992, budget. 2. Calculated wi th the GNP price deflator.
an average of 5.2 percent per year in current dollars and 1.6 percent when ad-justed for inflation (chart 1.2). Over the same ten-year period, System employ-ment has increased by 666 (chart 1.3).
From 1982, when the transition to the requirements of the Monetary Control Act of 1980 was completed, through 1984, System expenses remained essen-tially flat when adjusted for inflation, and employment declined. In 1985, the Federal Reserve increased the staff in a pronounced effort to strengthen super-vision and regulation of member banks and bank holding companies. The System was able partially to offset the increase in staff through reductions in employment in other areas, primarily in services to financial institutions and the public and in support and overhead.
In 1988, the Expedited Funds Avail-ability Act (title V I of Public Law 100-86, the Competitive Equality Banking Act of 1987) became effective. The act re-quires the Federal Reserve to issue regu-lations to ensure the prompt availability of funds and the expeditious return of checks. Increases in staff throughout the System in 1988 and 1989 resulted from implementing the provisions of this legislation.
Chart 1.3 Employment in the Federal Reserve System, 1982-921
Thousands o f persons
26
i i i t t i i i i i
1982 1987 1992
1. For 1991, estimate; for 1992, budget. Digitized for FRASER http://fraser.stlouisfed.org/ Federal Reserve Bank of St. Louis
8 Annual Report: Budget Review, 1989-90
In 1990 and 1991, several major factors influenced expense and staffing levels in the System. The System continued nationwide expansion of the Regional Delivery System, which wi l l centralize the issuance of over-the-counter savings bonds. Spending on bank supervision expanded, reflecting an increase in the number and complexity of examinations, increased attention to problem institutions, and passage of the Financial Institutions Reform, Recovery and Enforcement Act of 1989 (FIRREA).
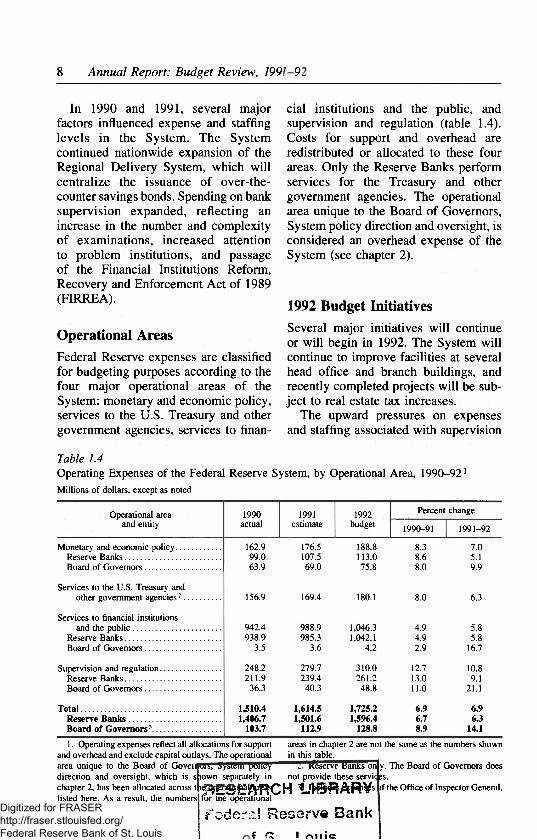
Operational Areas Federal Reserve expenses are classified for budgeting purposes according to the four major operational areas of the System: monetary and economic policy, services to the U.S. Treasury and other government agencies, services to finan-
cial institutions and the public, and supervision and regulation (table 1.4). Costs for support and overhead are redistributed or allocated to these four areas. Only the Reserve Banks perform services for the Treasury and other government agencies. The operational area unique to the Board of Governors, System policy direction and oversight, is considered an overhead expense of the System (see chapter 2).
1992 Budget Initiatives Several major initiatives wi l l continue or wi l l begin in 1992. The System wi l l continue to improve facilities at several head office and branch buildings, and recently completed projects wi l l be sub-ject to real estate tax increases.
The upward pressures on expenses and staffing associated with supervision
Table 1.4 Operating Expenses of the Federal Reserve System, by Operational Area, 1990-921
Mi l l ions o f dollars, except as noted
Operational area and entity
1990 actual
1991 estimate
1992 budget
Percent change Operational area and entity
1990 actual
1991 estimate
1992 budget 1990-91 1991-92
Monetary and economic policy 162.9 176.5 188.8 8.3 7.0 Reserve Banks 99.0 107.5 113.0 8.6 5.1 Board of Governors 63.9 69.0 75.8 8.0 9.9
Services to the U.S. Treasury and other government agencies2 156.9 169.4 180.1 8.0 6.3
Services to financial institutions and the public 942.4 988.9 1,046.3 4.9 5.8
Reserve Banks 938.9 985.3 1,042.1 4.9 5.8 Board of Governors 3.5 3.6 4.2 2.9 16.7
Supervision and regulation 248.2 279.7 310.0 12.7 10.8 Reserve Banks 211.9 239.4 261.2 13.0 9.1 Board o f Governors 36.3 40.3 48.8 11.0 21.1
Total 1,510.4 1,614.5 1,725.2 6.9 6.9 Reserve Banks 1,406.7 1,501.6 1,596.4 6.7 6.3 Board of Governors3 103.7 112.9 128.8 8.9 14.1
1. Operating expenses reflect al l allocations for support and overhead and exclude capital outlays. The operational area unique to the Board o f Gove i iU l t , Ay Wi l l i pUllL'y direction and oversight, which is s chapter 2, has been allocated across t|ii l isted here. As a result, the numbers
areas in chapter 2 are not the same as the numbers shown in this table.
" - " "F^serve Banks on y. The Board o f Governors does not provide these servk ;s.
>f the Off ice o f Inspector General. town separately in
' f f f i e S W C H O Q R A f W s for trie operational
F a d e r e : ! R e s e r v e B a n k
? Q f I o 11 i c
Digitized for FRASER http://fraser.stlouisfed.org/ Federal Reserve Bank of St. Louis

Federal Reserve System Audits 9
and regulation activities wi l l carry over from 1991 into 1992.
Nine Reserve Banks wi l l upgrade check systems to improve the efficiency of check processing.
The System wi l l continue automation projects related to office automation, contingency, and increased computer capacity.
Expenses for fiscal services w i l l continue to increase as the System moves into the final phase of implementing the Regional Delivery System for savings bonds.
Besides these initiatives, the continued rise in health care costs and an increase in the matching contribution under the thrift plan for System employees have contributed to the 1992 budget increase.
Partly offsetting these increases are productivity and operational improve-ments in a number of areas. •
Digitized for FRASER http://fraser.stlouisfed.org/ Federal Reserve Bank of St. Louis

11
Chapter 2
Board of Governors
The 1992 budget of the Board of Governors comprises three parts: a Board operations budget of $123.6 million, an extraordinary items budget of $3.2 mil-lion for special projects of a unique or one-time nature, and an Office of In-spector General budget of $2.0 million. The Board authorized 1,608 positions for the operational areas and 21 for the Office of Inspector General; no positions are required for the extraordinary items budget.
Overview of the Budget
Board Operations
The operations budget of $123.6 million, which covers the Board's four opera-tional areas, is 11.4 percent greater than estimated 1991 expenses. Increases in salaries and benefits for current personnel and in the price of goods and services account for 51 percent of the rise. Initiatives to increase staffing and im-prove automation, largely in the super-vision and regulation and monetary and economic policy operational areas, ac-count for the remaining 49 percent.
The budget adds a total of forty-one positions and abolishes two for a net increase of thirty-nine. Of this total, twenty-five positions are for the super-vision and regulation function. Coupled with positions added during 1991 and fewer vacancies, the new positions wil l enhance the Board's ability to manage a growing workload in international supervision, enforcement, and litigation as well as increased responsibilities arising from such legislation as the For-
eign Bank Supervisory Enhancement Act. Fourteen positions have been added for the monetary and economic policy function to strengthen and expand long-term research, to help in a nationwide effort to improve the quality of govern-ment economic statistics, and to enhance analytical capabilities through additional automation.
Major Initiatives The operations budget provides for increased staffing, improved training programs, and improved automation support for the supervision and regu-lation function. These changes are necessary to meet continued growth in workload, particularly in international supervision, policy analysis, applications, litigation, and enforcement. Initiatives in the area of monetary and economic policy require increased staffing to support a governmentwide effort to improve economic statistics. Other im-portant initiatives are more Boardwide in focus and include improved auto-mation capabilities, a higher level of facilities maintenance, and creation and acquisition of additional office space. The budget does not include funds to meet requirements of potential legis-lation. I f legislation is passed, new requirements wil l be considered by the Board. Also, the budget does not provide funds for a special investigative unit proposed for the supervision and regulation function but not yet fully developed or costed out. A proposal wil l be presented to the Board when the objectives are reviewed and the neces-sary resources identified.
Digitized for FRASER http://fraser.stlouisfed.org/ Federal Reserve Bank of St. Louis

12 Annual Report: Budget Review, 1989-90
Extraordinary Items
The $3.2 million budget for extraor-dinary items covers a 1992 Survey of Consumer Finances to enhance the quality of economic data, an audit of the Federal Reserve Bank of Kansas City by an outside firm, and a study by an outside consultant to ensure the security of the transfer of funds and securities via Fedwire.
Off ice of Inspector General
The $2.0 million budget for the Office of Inspector General is $0.3 million, or 17.1 percent, greater than estimated 1991 expenses. The majority of the increase w i l l fund two new audit manager positions. Also included in the budget is an increase for travel and training associated with implementation of a new Developmental Assignment Program.
Operations Budget by Operational Area The 1992 Board activities fall into four broadly defined operational areas:
monetary and economic policy, super-vision and regulation, services to finan-cial institutions and the public, and System policy direction and oversight (also see chapter 1 and appendix A). For each operational area, the costs shown include support and overhead expenses, which are allocated to each area in proportion to direct expenses. Higher costs associated with salary increases, rate increases for insurances, and other items that affect expenses in all opera-tional areas are not discussed separately by area, but they are included in the discussion by object class. Data on expenses and positions for each opera-tional area for 1990-92 are shown in tables 2.1 and 2.2.
Monetary and Economic Policy
The budget for monetary and economic policy is $59,712,000; this amount is $4,482,000, or 8.1 percent, more than estimated 1991 expenses. The budget provides an increased level of funding for the divisions that support this
Table 2.1 Expenses of the Board of Governors for Operational Areas, Extraordinary Items, and Office of Inspector General, 1990-921
Thousands of dollars, except as noted
Type o f expense 1990
actual 1991
estimate 1992
budget
1990-91 change 1991-92 change Type o f expense
1990 actual
1991 estimate
1992 budget Amount Percent Amount Percent
Monetary and economic pol icy 51,259 55,230 59,712 3,971 7.7 4,482 8.1
Supervision and regulat ion.. 29,092 32,223 38,649 3,131 10.8 6,426 19.9 Services to financial
institutions and the public 2,765 2,947 3,328 182 6.6 381 12.9
System pol icy direction and oversight 19,283 20,465 22,216 1,182 6.1 1,751 8.6
Total, Board operations ... 102,399 110,865 123,5552 8,466 8.3 12,689 11.4
Extraordinary items 0 335 3,161 335 2,826 Off ice of Inspector General . 1,341 1,714 2,007 373 27.8 293 17.1
1. Operating expenses include allocations for support and overhead. 2. The Savings Target has been removed f rom the total, but not f rom the individual
operational areas; therefore, the details do not sum to the total. Digitized for FRASER http://fraser.stlouisfed.org/ Federal Reserve Bank of St. Louis

Board of Governors 13
function to meet an increasing workload, expand long-term research, and improve the quality of economic data. Automation initiatives, including continuation of the phased development of the research computing system, are key elements of the divisions' plans to manage the workload. Because productivity improve-ments alone are no longer sufficient, the budget requests fourteen new positions: six economists, five research assistants, and three information systems analysts. (A fourth information systems analyst position added in the Division of Research and Statistics supports the supervision and regulation function.)
Investments in research automation have produced productivity gains that, combined with adjustments in priorities and reductions in long-term research, have limited the degree of staff growth. The greater personnel requirements, in large measure driven by an effort to meet analytical requirements at the Board, also reflect increased support for the Division of Banking Supervision and Regulation and the Division of Consumer and Community Affairs. Questions on such topics as the farm
credit system, insurance companies, interest-rate risk, capital standards, and regulation of government-sponsored enterprises have added to the workload. Studies on banking legislation, deposit insurance, and consolidation in the banking industry are typical of areas requiring increased attention not possible with the current level of resources. The additional staff resources wi l l slow continued growth in the volume of uncompensated overtime by exempt personnel and wi l l allow for a moderate increase in long-term research.
Supervision and Regulation
The budget for supervision and regula-tion is $38,649,000; this amount is $6,426,000, or 19.9 percent, more than estimated 1991 expenses. A significant portion of the large increase wi l l fund new staff positions. Twenty-five posi-tions have been added, eighteen in the Division of Banking Supervision and Regulation, six in the Legal Division, and one in the Division of Research and Statistics. (A seventh position added in
Table 2.2 Positions Authorized at the Board of Governors for Operational Areas, Support and Overhead,1 and Office of Inspector General, 1990-92
Type o f expense 1990 actual
1991 estimate
1992 budget
1990-91 change 1991-92 change Type o f expense 1990
actual 1991
estimate 1992
budget Amount Percent Amount Percent
Monetary and economic policy 401 401 415 0 0 14 3.5
Supervision and regulat ion.. 280 293 318 13 4.6 25 8.5 Services to financial
institutions and the public 20 22 22 2 10.0 0 0
System pol icy direction and oversight 155 154 154 - 1 - . 6 0 0
Support and overhead 701 699 699 - 2 - . 3 0 0
Total, Board operations .. 1,557 1,569 1,608 12 .8 39 2.5
Office o f Inspector General . 19 19 21 0 0 2 10.5
1. Support and overhead positions not allocated to operational areas.
Digitized for FRASER http://fraser.stlouisfed.org/ Federal Reserve Bank of St. Louis

14 Annual Report: Budget Review, 1989-90
the Legal Division is associated with support and overhead.) These positions, in conjunction with positions added during 1991, particularly four attorney positions added in the Legal Division late in the year, account for the majority of the increase.
The additional Division of Banking Supervision and Regulation positions are required to meet the division's current workload. The six positions in the Legal Division were added largely in anticipation of passage of the Foreign Bank Supervisory Enhancement Act. No new positions have been added in the Division of Consumer and Community Affairs; however, should merger activity or protested actions increase signifi-cantly, that division may also require additional resources.
In addition to costs associated directly with new initiatives, the budget continues to fund the Board's share of the auto-mation costs for development of the National Information Center (NIC). This project wi l l be the sole source of consoli-dated structure and financial data and wi l l be of major benefit to the supervision and regulation operational area. The 1992 effort wi l l be devoted primarily to the transition from existing software to the NIC database. Development of the NIC wi l l reduce Systemwide costs, improve data integrity, and lead to more timely and more meaningful analysis of applications, merger requests, and other actions.
Automation enhancements are needed to allow the divisions to replace obsolete equipment with equipment capable of greater interaction with the NIC, Bank Holding Company Performance Report (BHCPR), Home Mortgage Disclosure Act (HMDA), and other critical data-bases. The upgraded equipment wi l l improve the staffs ability to meet tight deadlines and wi l l result in higher-quality analyses and finished products.
Services to Financial Institutions and the Public
The budget for services to financial institutions and the public is $3,328,000, an amount $381,000, or 12.9 percent, more than estimated 1991 expenses. This operational area is composed almost entirely of programs supporting the payments function in the Division of Reserve Bank Operations and Payment Systems. The increase wi l l fund devel-opment and improvement of the cash tracking project for the System and a lower level of staff vacancies.
System Policy Direction and Oversight
The budget for the System policy direction and oversight operational area is $22,216,000, a $1,751,000, or 8.6 percent, increase over estimated 1991 expenses. This function is composed of most of the Division of Reserve Bank Operations and Payment Systems and parts of the Offices of Board Mem-bers, Secretary, and Staff Director for Management.
The increase in this budget is less pronounced than the increases in the budgets for other operational areas because of fewer initiatives. Much of the rise is tied to a lower level of vacancies and a new position in the Office of Board Members. Development of main-frame software to provide improved financial information to the Division of Reserve Bank Operations and Payment Systems also affects costs.
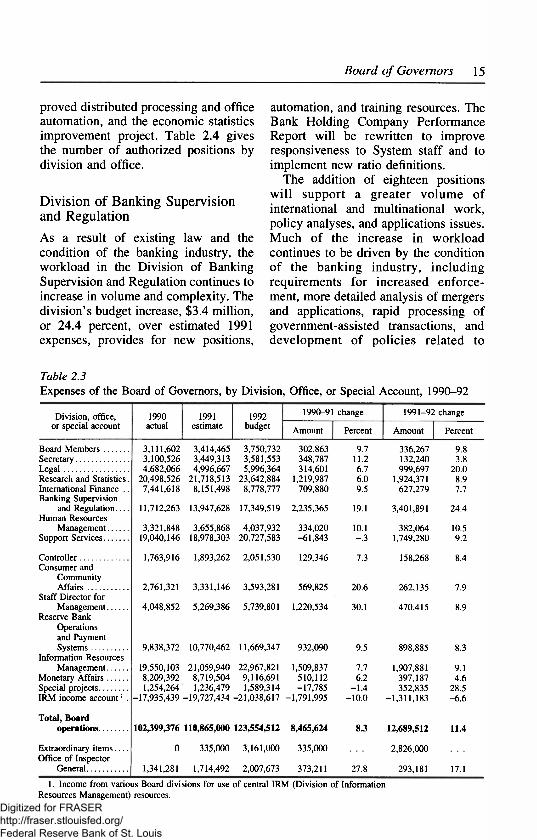
Operations Budget by Division Table 2.3 shows the 1992 budget for each Board division, office, and special account. The figures highlight the budget's emphasis on the supervision and regulation operational area, im-
Digitized for FRASER http://fraser.stlouisfed.org/ Federal Reserve Bank of St. Louis
Board of Governors 15
proved distributed processing and office automation, and the economic statistics improvement project. Table 2.4 gives the number of authorized positions by division and office.
Div is ion o f Banking Supervision and Regulation
As a result of existing law and the condition of the banking industry, the workload in the Division of Banking Supervision and Regulation continues to increase in volume and complexity. The division's budget increase, $3.4 million, or 24.4 percent, over estimated 1991 expenses, provides for new positions,
Table 2.3 Expenses of the Board of Governors, by Division, Office, or Special Account, 1990-92
Divis ion, off ice, or special account
1990 actual
1991 estimate
1992 budget
1990-91 change 1991-92 change Divis ion, off ice, or special account
1990 actual
1991 estimate
1992 budget Amount Percent Amount Percent
Board Members 3,111,602 3,414,465 3,750,732 302,863 9.7 336,267 9.8 Secretary 3,100,526 3,449,313 3,581,553 348,787 11.2 132,240 3.8 Legal 4,682,066 4,996,667 5,996,364 314,601 6.7 999,697 20.0 Research and Statistics. 20,498,526 21,718,513 23,642,884 1,219,987 6.0 1,924,371 8.9 International Finance . . 7,441,618 8,151,498 8,778,777 709,880 9.5 627,279 7.7 Banking Supervision
and Regulation 11,712,263 13,947,628 17,349,519 2,235,365 19.1 3,401,891 24.4 Human Resources
Management 3,321,848 3,655,868 4,037,932 334,020 10.1 382,064 10.5 Support Services 19,040,146 18,978,303 20,727,583 -61,843 - . 3 1,749,280 9.2
Control ler 1,763,916 1,893,262 2,051,530 129,346 7.3 158,268 8.4 Consumer and
Communi ty Af fa i rs 2,761,321 3,331,146 3,593,281 569,825 20.6 262,135 7.9
Staff Director for Management 4,048,852 5,269,386 5,739,801 1,220,534 30.1 470,415 8.9
Reserve Bank Operations and Payment Systems 9,838,372 10,770,462 11,669,347 932,090 9.5 898,885 8.3
Information Resources Management 19,550,103 21,059,940 22,967,821 1,509,837 7.7 1,907,881 9.1
Monetary Af fa i rs 8,209,392 8,719,504 9,116,691 510,112 6.2 397,187 4.6 Special projects 1,254,264 1,236,479 1,589,314 -17,785 - 1 . 4 352,835 28.5 I R M income account ' . -17,935,439 -19,727,434 -21,038,617 -1,791,995 -10 .0 -1,311,183 - 6 . 6
Total, Board operations 102,399,376 110,865,000 123,554,512 8,465,624 8.3 12,689,512 11.4
Extraordinary items 0 335,000 3,161,000 335,000 2,826,000 Off ice of Inspector
General 1,341,281 1,714,492 2,007,673 373,211 27.8 293,181 17.1
1. Income f rom various Board divisions for use o f central I R M (Div is ion o f Information Resources Management) resources.
automation, and training resources. The Bank Holding Company Performance Report wi l l be rewritten to improve responsiveness to System staff and to implement new ratio definitions.
The addition of eighteen positions w i l l support a greater volume of international and multinational work, policy analyses, and applications issues. Much of the increase in workload continues to be driven by the condition of the banking industry, including requirements for increased enforce-ment, more detailed analysis of mergers and applications, rapid processing of government-assisted transactions, and development of policies related to
Digitized for FRASER http://fraser.stlouisfed.org/ Federal Reserve Bank of St. Louis

16 Annual Report: Budget Review, 1989-90
innovations in the marketplace, such as mortgage-backed securities. Finally, the budget funds continued upgrades to office automation equipment and the expansion of network facilities.
The division's budget does not fund any requirements that might result from such proposed legislation as a banking reform bil l or legislation similar to the Foreign Bank Supervisory Enhancement Act. Nor are funds budgeted for a pro-posed special investigative unit, pending development of requirements and identi-fication of necessary resources.
Legal Div is ion
The budget for the Legal Division has increased by $1.0 million, or 20 percent over estimated 1991 expenses, to a total of $6.0 million. Most of the increase wi l l cover the costs of four attorney
positions added in late 1991 and seven new positions to be added in 1992. The positions added in 1991 were needed to handle growth in the international and litigation areas. The 1992 positions are needed as a result of recent legislation on international supervision, which significantly increased requirements for policy analysis and formulation.
Div is ion o f Information Resources Management
The increase in the 1992 budget for the Division of Information Resources Management, to a total of $23.0 million, is needed to fund vendors' increases in prices of software and maintenance and to provide contractual support to meet the division's labor requirements. The increase wi l l also fund initiatives to support requirements throughout the
Table 2.4 Positions Authorized at the Board of Governors, by Division or Office, 1990-92
Div is ion or office 1990 actual
1991 estimate
1992 budget
Change Div is ion or office 1990
actual 1991
estimate 1992
budget 1990-91 1991-92
Board Members 40 38 38 - 2 0 Secretary 57 58 57 1 - 1 Legal 67 72 79 5 7 Research and Statistics 255 256 268 1 12 International Finance 103 103 105 0 2 Banking Supervision and
Regulation 174 183 201 9 18 Human Resources Management 48 48 48 0 0
Concern1 22 22 22 0 0
Support Services 259 259 259 0 0 Control ler 31 31 31 0 0 Consumer and Communi ty Af fa i rs 42 43 43 1 0 Staff Director for Management 8 7 7 - 1 0 Reserve Bank Operations and
Payment Systems 113 116 116 3 0 Information Resources Management . . . 275 271 271 - 4 0 Monetary Af fa i rs 61 62 63 1 1 Special projects 2 0 0 - 2 0
Total, Board operations 1,557 1,569 1,608 12 39
Off ice of Inspector General 19 19 21 0 2 FF IEC 2 11 12 12 1 0
1. EEO Concern positions managed by the Div is ion o f Human Resources Management. 2. Federal Financial Institutions Examination Council .
Digitized for FRASER http://fraser.stlouisfed.org/ Federal Reserve Bank of St. Louis

Board of Governors 17
Board, such as improved records management and the premise-wide network, as well as some internal projects such as upgraded micro-computers.
Div is ion of Research and Statistics
The budget for the Division of Research and Statistics is $23.6 mil l ion, an increase of $1.9 million, or 8.9 percent, over estimated 1991 expenses. Most of the increase is tied to the twelve new positions in 1992 and consulting ser-vices for the statistics improvement project. The new positions are needed to meet requirements for a larger number of banking, regulatory, and capital analyses and to improve the division's ability to perform long-term research. Five of the positions, as well as con-sulting support and automation re-sources, are needed for the project the division is undertaking in conjunction with government efforts to improve eco-nomic statistics. The budget also includes funds for continued expansion of the distributed processing system for the research divisions.
Div is ion o f Reserve Bank Operations and Payment Systems
The 1992 budget for the Division of Reserve Bank Operations and Payment Systems is $11.7 million, an increase of $0.9 million, or 8.3 percent, over estimated 1991 expenses. The increase is needed to enhance software for support of the System's cash and currency tracking projects and for office auto-mation enhancements. A small portion of the increase wi l l be used to address payments system issues in Eastern Europe and to adjust, through training, to the changing requirements affecting the skill mix of the division's staff.
Div is ion o f Support Services
The 1992 budget for the Division of Support Services is $21.0 million, an increase of $1.7 million, or 9.2 percent, over estimated 1991 expenses. Require-ments for new office space to accom-modate new positions budgeted for 1992 wi l l add costs for reconfiguration of Board premises and additional leasing. The increase also wi l l fund a higher level of maintenance necessary to care for aging facilities. Depreciation for 1991 capital investments in facilities and new telephone and security systems wi l l also add cost.
Operations Budget by Object of Expense The most significant expense item in the Board's 1992 budget is personnel expenses, which account for 75 percent of operating expenses. The increase in the salary budget, $6.3 million, includes not only annual salary increases for current personnel but also salaries for new positions, both those added in late 1991 and the thirty-nine positions added for 1992. A lower vacancy rate also contributes to the increase. Retirement costs for 1992 are $0.7 million, or 12.5 percent, greater than estimated 1991 expenses, primarily because of increases in the Board's matching contribution to the thrift plan and in the wage base subject to social security and medicare taxes.
Insurance costs also are up over estimated 1991 expenses, by $0.3 mil-lion, or 5.4 percent. The rate increase for the Board's health insurance plan, combined with a higher level of staffing from new positions and fewer vacancies, accounts for $0.4 mill ion of the increase. The rate increases for the Federal em-ployee health benefits plan, the effect of higher salaries on medicare, and
Digitized for FRASER http://fraser.stlouisfed.org/ Federal Reserve Bank of St. Louis

18 Annual Report: Budget Review, 1989-90
miscellaneous increases add $0.1 million. Partially offsetting these increases is a $0.2 million decrease in workers com-pensation, reflecting a large one-time payout in 1991.
Table 2.5 presents the budget by object of expense. Increased use of contractual professional services w i l l provide
software development support for important projects as well as expert advice for data improvement and examiner training initiatives, and at the same time w i l l keep increases in permanent staffing to a minimum. Travel costs are expected to be higher in 1992 because of higher airfares, a greater
Table 2.5 Operating Expenses of the Board of Governors, by Object of Expense, 1990-92
Object of expense 1990 actual
1991 estimate
1992 budget
1990-91 change 1991-92 change Object of expense 1990
actual 1991
estimate 1992
budget Amount Percent Amount Percent
Personnel Salaries 68,565,290 73,821,168 80,165,410 5,255,878 7.7 6,344,242 8.6 Retirement 4,600,876 5,232,478 5,888,294 631,602 13.7 655,816 12.5 Insurance 4,931,007 6,462,477 6,812,277 1,531,470 31.1 349,800 5.4
Total 78,097,173 85,516,123 92,865,981 7,418,950 9.5 7,349,858 8.6
Goods and services Travel 3,402,408 3,791,561 4,502,591 389,153 11.4 711,030 18.8 Postage and
expressage 1,141,989 1,245,076 1,270,800 103,087 9.0 25,724 2.1 Telephone and
telegraph 1,758,280 1,698,767 1,641,150 -59,513 -3 .4 -57,617 -3 .4 Printing and binding . . . 1,153,340 1,109,802 1,112,400 -43,538 -3 .8 2,598 .2 Publications -558,890 -651,750 -471,280 -92,860 -16.6 180,470 27.7 Stationery and
supplies 897,458 866,475 863,481 -30,983 -3 .5 -2,994 - . 3 Software 2,100,704 2,463,726 3,037,952 363,022 17.3 574,226 23.3 Furniture and
equipment 827,092 695,101 852,073 -131,991 -16 .0 156,972 22.6 Rentals -964,521 -917,677 -719,704 46,844 4.9 197,973 21.6 Books and
subscriptions 578,255 630,541 721,343 52,286 9.0 90,802 14.4 Util it ies 1,701,944 1,730,000 1,735,000 28,056 1.6 5,000 .3 Bui lding repairs
and alterations 943,208 877,921 1,723,500 -65,287 -6 .9 845,579 96.3 Equipment repairs
and maintenance.. 1,837,383 2,042,822 2,181,560 205,439 11.2 138,738 6.8 Contingency
Processing Center expenses... 236,866 238,100 291,922 1,234 .5 53,822 22.6
Contractual professional services 2,685,648 2,978,660 4,021,410 293,012 10.9 1,042,750 35.0
Tuition/registration and membership fees 601,730 757,800 989,929 156,070 25.9 232,129 30.6
Subsidies and contributions 529,289 714,210 682,254 184,921 34.9 -31,956 -4 .5
Depreciation 5,881,929 5,795,775 6,378,380 -86,154 -1 .5 582,605 10.1 A l l other -451,909 -718,033 -126,230 -266,124 -58.9 591,803 82.4
Total 24,302,203 25,348,877 30,688,531 1,046,674 4.3 5,339,654 21.1
Total, Board operations 102,399,376 110,865,000 123,554,512 8,465,624 83 12,689,512 11.4
Extraordinary items 0 335,000 3,161,000 335,000 2,826,000 Office of Inspector
General 1,341,281 1,714,492 2,007,673 373,211 27.8 293,181 17.1
Digitized for FRASER http://fraser.stlouisfed.org/ Federal Reserve Bank of St. Louis
Board of Governors 19
volume of travel to resolve supervisory issues, and relocation costs for new staff. Software expenses are rising as a result of rate increases for mainframe software and the changing technological needs of the Board. Finally, with the aging of facilities, there is an increased need for building repairs and alterations.
Capital Budget The capital budget for 1992 is $5.0 million, or $100,000 less than esti-mated 1991 expenditures. The budget provides for requirements in the areas of automation and telecommunications, improvements to facilities, and relatively small equipment replacements in such locations as the cafeteria.
Continued investment by all the Board's divisions in workstation, net-work, and office automation systems wi l l cost $3.3 million. The budgets for the divisions involved in research include funds for new and upgraded work-stations, printers, and peripheral equip-ment. Also included are funds to en-hance the system used by the Division of International Finance to make it compatible with both the DOS- and UNIX-based systems used throughout the Board. The budget for the Division of Information Resources Management includes funds for a premise-wide network and a document-management system. The budget for the Division of Banking Supervision and Regulation includes new file servers, improved microcomputers, and other enhance-ments to improve data storage, handling, and retrieval capabilities needed to take ful l advantage of all data sources, including the new supervisory informa-tion system. Automation equipment for new staff is also included in the budget.
The remaining funds are for smaller projects. For example, the Office of the Controller is acquiring a specialized
network to run the Financial Manage-ment System (FMS) more efficiently, using off-the-shelf software, in a dis-tributed environment. The Division of Support Services is acquiring a larger network device on which to manage a large library of software tailored to its needs as well as a system to replace the computer that monitors and controls energy consumption. The division's budget also includes funds for a video-conferencing bridge that wi l l improve communications and reduce Boardwide travel costs.
Facilities improvements include a number of projects. The first phase of a multiyear effort to repair concrete slabs in the north parking garage has been approved. A new air handler w i l l improve heating, ventilation, and air conditioning in the data center. Capital funds wi l l be required for reconfigura-tions to provide office space.
Software costing more than $50,000 is capitalized. The budget includes funds for such software for the mainframe, the new FMS, and the distributed system for the Division of Support Services.
Trends The increase in the 1992 operations budget of the Board over estimated 1991 expenses, 11.4 percent, is significantly greater than the 7.8 percent average annual rate of increase for the last five years and the 7.1 percent increase for the last ten years. The larger increase reflects the surge in workload that has finally exceeded the ability of managers to absorb through improved productivity. Charts 2.1 through 2.5 provide data on trends for the period from 1982.
Adjusted by the GNP deflator, the average annual increase in Board costs since 1982 has been 3.1 percent. Although this figure is low relative to the substantial growth in workload, the
Digitized for FRASER http://fraser.stlouisfed.org/ Federal Reserve Bank of St. Louis

20 Annual Report: Budget Review, 1989-90
Chart 2.1 Operating Expenses of the Board of Governors, 1982-921
M i l l i o n s o f dol lars
130
1 I I I I I 1 I I I 1982 1987 1992
1. Excludes the Off ice of Inspector General and extraor-dinary items. For 1991, estimate; for 1992, budget.
2. Calculated wi th the GNP price deflator.
Year Expenses in mi l l ions o f
Year Current dollars 1982 dollars
1982 67.2 67.2 1983 71.6 69.1 1984 76.5 71.4 1985 82.0 74.3 1986 84.0 74.1 1987 86.3 73.8 1988 89.9 74.2 1989 95.6 76.3 1990 102.4 78.3 1991 110.9 81.4 1992 123.6 90.8
annual increase has been rising. For the ten years ending in 1990, the average annual increase was 1.5 percent. The recent rise is attributable to a higher level of staffing, adjustments of salaries resulting from the new employee-compensation program, and sharp increases in benefit costs, particularly for health insurance. The salary and benefit changes have had a particularly noticeable impact, as 75 percent of the Board's budget is for staffing.
For the first time since 1988, the goods and services budget increased at a faster pace than the personnel budget. The shift is a result of depreciation expenses on a larger stock of capitalized automation equipment, costs of main-taining the Board's facilities and pro-
Chart 2.2 Expenses for Personnel Services at the Board of Governors, 1982-921
M i l l i o n s o f dol lars
1 1 1 I l I l i i i 1982 1987 1992
1. Excludes the Office o f Inspector General. For 1991, estimate; for 1992, budget.
2. Calculated wi th the GNP price deflator.
Chart 2.3 Expenses for Goods and Services at the Board of Governors, 1982-921
M i l l i o n s o f dol lars
Current dollars
15
I i l l I
1982 1987 1992
1. Excludes the Off ice o f Inspector General and extraor-dinary items. For 1991, estimate; for 1992, budget.
2. Calculated wi th the GNP price deflator.
viding additional office space, and a decision to satisfy software requirements through temporary contractual arrange-ments rather than hiring additional permanent staff. The latter decision was made in recognition of the temporary nature of the increased requirement for development of software for the mainframe.
Personnel costs have been affected by the increase in the total number of positions and the decline in the number of position vacancies. The 1992 increase
Digitized for FRASER http://fraser.stlouisfed.org/ Federal Reserve Bank of St. Louis

Board of Governors 21
Chart 2.4 Annual Rate of Change in Operating Expenses of the Board of Governors, 1982-921
Percent
Chart 2.5 Employment and Authorized Positions at the Board of Governors, 1982-92'
Number, in thousands
12
9
6
3
1982 1987 1992
1. Excludes the Off ice of Inspector General and extraor-dinary items. For 1991, estimate; for 1992, budget.
1.7
1.6
1.5 Employment
1982 1987 1992
1. Year-end data. Excludes twenty-eight summer intern and youth positions and Off ice o f Inspector General. For 1991, estimate; for 1992, budget.
in positions, to a total of 1,608, returns the Board to the same number as in 1985. In recent years, increases in the supervision and regulation operational area were offset by decreases elsewhere. Between 1985 and 1991, the number of positions in the Division of Banking Supervision and Regulation increased from 138 to 183 while the overall number of positions at the Board declined.
The combined effects of the new employee-compensation program and the slowdown in the economy have resulted in a reduced rate of staff turnover and a lower level of vacancies. This is proving extremely important to the Board in meeting key requirements. Turnover in 1991 was the lowest in many years, and a low rate is projected in the 1992 budget.
The 1992 rate increase for the Board's health insurance plan, 6.3 percent, is significantly below the 22 percent annual rate of increase in the previous five years. The lower rate of increase reflects some reductions in the plan's benefits, necessary in light of the large and continuing increases that were pro-
Year Employment Authorized positions
1982 1,525 1,563 1983 1,583 1,612 1984 1,588 1,653 1985 1,521 1,580 1986 1,484 1,540 1987 1,486 1,541 1988 1,484 1,534 1989 1,485 1,528 1990 1,495 1,529 1991 1,516 1,541 1992 1,550 1,580
jected to continue indefinitely without management action.
Extraordinary Items Three projects are covered by the extraordinary items budget. The first is the 1992 Survey of Consumer Finances, which wi l l collect important financial data used for a wide variety of policy analysis and monetary policy purposes. The project reflects the Board's interest in enhancing the quality of economic data by obtaining information on income, assets, debts, pensions, employment, use of financial services, savings behavior, and other characteristics of U.S. house-holds. Cross-categorization of the data
Digitized for FRASER http://fraser.stlouisfed.org/ Federal Reserve Bank of St. Louis

22 Annual Report: Budget Review, 1989-90
wi l l allow important statistical observa-tions useful in a wide variety of eco-nomic studies.
The second project, an audit of the Federal Reserve Bank of Kansas City by a public accounting firm, was originally scheduled to be performed in 1991; because more lead time was needed for procurement, the project was rescheduled for 1992. The Financial Examinations Program in the Division of Reserve Bank Operations and Payment Systems wi l l audit the other Reserve Banks as usual. The objective of the outside audit is to provide assurance that internal audits at the Reserve Banks achieve desired controls and standards consistent with those applied by the accounting profession.
The third project covered by the extraordinary items budget is a study by an outside consultant to ensure the security of the transfer of funds and securities via Fedwire. The study wi l l focus on additional security enhance-ments that should be incorporated in the Federal Reserve System information security architecture to ensure the relia-bility and security of the Fedwire system.
Office of Inspector General The 1992 budget for the Office of Inspector General (OIG) funds imple-mentation of the 1992 portion of the OIG Strategic Plan 1991-1995 to audit, review, and investigate Board operations, to help ensure economic and efficient use of the Board's resources.
The budget of $2,007,673 is $293,181, or 17.1 percent, higher than estimated 1991 expenses. The increase is due largely to the addition of two new audit manager positions and related expenses. The office's goods and services expenses wi l l decrease slightly, primarily because
of a one-time software purchase in 1991 and reduced use of external legal services.
The office's operations continue to expand into the main mission areas of the Board and the Reserve Banks. Although the primary audits envisioned for each of the Board's operational areas are performance audits, the OIG wi l l also conduct financial and EDP (elec-tronic data processing) audits.
Three operations reviews (of the Legal Division, the Division of Consumer and Community Affairs, and the Office of Board Members) scheduled for 1992 are the last remaining to be conducted during the five-year cycle begun in 1988.
The two new audit manager positions added for 1992 wi l l increase the number of authorized positions to twenty-one. The new audit managers w i l l be responsible for specific audit sections. The investigation function wi l l cover the full range of investigative requirements arising from complaints, indications of waste, fraud, and abuse identified by audit staff or management, and requests from management or the Congress. Advice on fraud detection also wi l l be provided as part of the audits and operations reviews. Responsibilities for review of legislation and regulation wi l l continue. •
Digitized for FRASER http://fraser.stlouisfed.org/ Federal Reserve Bank of St. Louis

23
Chapter 3
Federal Reserve Banks
The 1992 operating budgets for the Fed-eral Reserve Banks approved by the Board of Governors total $1,596.4 mil-lion, an increase of $94.8 million, or 6.3 percent, over estimated 1991 ex-penses (table 3.1). Not included in this amount are expenses for special projects related to Check Image Processing ($4.3 million), Development of Currency Authentication Systems ($9.3 million), and Automation Consolidation ($6.5 mil-lion). Including the costs of these spe-cial projects, the Banks' 1992 budgets total $1,616.5 million, an increase of $108.1 million, or 7.2 percent, over esti-mated 1991 expenses.
Employment excluding the staff asso-ciated with the special projects is bud-geted at 23,871 average number of personnel (ANP), an increase of 40 ANP, or 0.2 percent, over estimated 1991 employment.1 Total budgeted employ-ment including the special projects is 23,973, an increase of 140 ANP over estimated 1991 employment. The auto-mation consolidation special project accounts for the 100 ANP increase re-lated to special projects.
Expenses for personnel, which com-prise salaries and benefits, account for $1,037.6 million, or 65 percent of Reserve Bank expenses in 1992, an
1. The term average number of personnel describes levels and changes in employment at the Reserve Banks. ANP measures the number of employees in terms of full-time positions for the time period. For instance, a full-time employee who starts work July 1 counts as 0.5 ANP for that calendar year; two half-time employees who start January 1 count as 1 ANP. The ANP for any given year is the average number of full-time employees (measured in this way) in the months of that year.
increase of $66.4 million, or 6.8 percent, over estimated 1991 personnel expenses (table 3.2). Nonpersonnel expenses are budgeted at $558.8 million, an increase of $28.5 million, or 5.4 percent, over 1991; these expenses are influenced primarily by automation and building projects.
The following two sections discuss the major initiatives and the budget objective for the Reserve Banks in 1992. Subsequent sections provide details for the four operational areas as well as objects of expense, capital outlays, and long-term trends. Appendix C gives de-tails on capital outlays, special projects, and other special categories of expense. Appendix F gives further data by District and by operational area.
Major Initiatives The 1992 increase in total expenses includes $36.6 million for Reserve Bank initiatives (table 3.3). Among the initia-tives are:
• Projects to improve facilities at head offices and branches
• Increased efforts in supervision and regulation
• Enhanced check and cash operations
• Increased efforts in automation • Enhanced programs for the U.S.
Department of the Treasury
Improvements to facilities throughout the System wil l add $18.7 million in 1992. Expenses associated with two major building projects account for nearly all the increase: New York's East
Digitized for FRASER http://fraser.stlouisfed.org/ Federal Reserve Bank of St. Louis

24 Annual Report: Budget Review, 1991-92
Rutherford Operations Center (EROC) ($9.2 million) and Dallas' new building ($7.9 million). Ongoing building projects at the Cleveland, St. Louis, and Kansas City offices also contribute to the increase.
Initiatives in supervision and regu-lation wi l l increase expenses by $8.5 million and add 108 ANP; however, the net impact on the System wi l l be 99 ANP because of staff decreases in a few Districts. A majority of the Banks attribute the need for additional staff to increased workloads, increased examina-tion of foreign banks, and more problem institutions. Expenses related to travel and increased automation also wi l l con-tribute to the increase in this area.
Nine Banks collectively have bud-geted $2.8 mil l ion to improve the efficiency of check systems. Most of these projects are continuing efforts and are contributing to a reduction in check-staff levels.
The Banks anticipate spending $1.0 million in 1992 for enhanced currency processing. Increases are primarily in San Francisco for the full-year impact of additional processing equipment and staff to handle the projected growth in currency volume.
Projects related to office automation, contingency, and increased computer capacity wi l l continue. These initiatives (excluding expenses for EROC and the new building in Dallas) are projected to
Table 3.1 Expenses and Employment at the Federal Reserve Banks, 1991-921
Category 1991 estimate
1992 budget
Change Category 1991
estimate 1992
budget Amount Percent
Expenses (millions of dollars) Operations2
Special projects Total
Employment (average number of personnel)3
Operations2
Special projects Total
1,501.6 1,596.4 94.8 6.3 6.8 20.1 13.3
1,508.4 1,616.5 108.1 7.2
23,831 23,871 40 .2 2 102 100
23,833 23,973 140 .6
1. Excludes capital outlays. 2. Includes support and overhead (see appendix F, table F.3, note 1, for definitions). 3. See text note 1 for definition of average number of personnel.
Table 3.2 Operating Expenses of the Federal Reserve Banks, by Object, 1990-921
Thousands of dollars, except as noted
Object 1990 actual
1991 estimate
1992 budget
Percent change Object 1990
actual 1991
estimate 1992
budget 1990-91 1991-92
Personnel 897,614 971,248 1,037,609 8.2 6.8 Nonpersonnel 509,038 530,333 558,796 4.2 5.4
Total 1,406,652 1,501,581 1,596,405 6.7 6-3
1. Includes the costs of support and overhead (see appendix F, table F.3, note 1, for definitions).
Digitized for FRASER http://fraser.stlouisfed.org/ Federal Reserve Bank of St. Louis

Federal Reserve Banks 25
add $2.0 mil l ion in 1992. Boston, Cleveland, and San Francisco have budgeted large office automation projects to enhance end-user computing. Phila-delphia and Richmond plan to acquire software development tools to improve computer programming productivity. Atlanta has budgeted for equipment to improve contingency and reliability.
Expenses for fiscal services are projected to increase $2.4 million. Of the overall increase, $2.1 million wi l l be incurred as the System moves into the final phase of implementation of the Regional Delivery System (RDS), which involves centralized issuance of over-the-counter savings bonds. The 1992 increase is primarily for expenses associated with the addition of 67 ANP. (A total staff increase of 350 ANP is projected by the time the RDS project is fully implemented.) In addition, Minne-apolis anticipates increased expenses and ANP for the Savings Bond Masterfile project, as volume is projected to double in 1992. RDS and Masterfile staff increases are partially offset by staff decreases in other fiscal activities. Expenses related to Treasury initiatives are fully reimbursable.
The increase in the Reserve Banks' matching contributions to the employee thrift plan wi l l add an estimated $4.6 million to Bank expenses in 1992.
Partially offsetting these increases are initiatives that wi l l result in savings of $3.4 million. Savings have been identified at Boston, Cleveland, Kansas City, and San Francisco. The savings are being achieved by increased productivity and Districtwide consolidation of cer-tain operations. San Francisco's check initiatives and the consolidation of its fiscal operations are expected to save $1.1 and 25 ANP. Productivity gains in Cleveland's check, fiscal, and currency operations wi l l produce savings of $0.8 million and 34 ANP.
1992 Budget Objective In 1991, the Board approved a two-tiered approach to establishing the 1992 budget objective. First the increase in general operating expenses was targeted at 4.5 percent of projected 1991 expenses. Then expenses for budget objective factors were estimated. The Board anticipated that these expenses, which include the costs of several Systemwide efforts and District-specific building projects, would add between 1.5 and 2.4 percentage points. Staff believed the figure would be at the lower end of the range and recommended an overall budget objective of 6.5 percent. This guideline excluded the expenses of special projects. Table 3.4 shows a comparison of the 1992 budget objective and the 1992 budget.
The 1992 budget increase for general operating expenses of 4.2 percent is $4.9 million, or 0.3 percent, less than the budget objective. The Banks are under the 4.5 percent general operating expense target primarily because of lower-than-
Table 3.3 Operating Expenses Budgeted for Major Initiatives of the Federal Reserve Banks, 1992
In i t iat ive M i l l i o n s o f dol lars
Percent o f 1992
operating budget
Faci l i ty improvements 18.7 1.2 Supervision and regulat ion 8.5 .6 Enhanced check operations . . . 2.8 .2 Currency ini t iat ives 1.0 .1 Au tomat ion and
contingency projects 2.0 .1 Fiscal in i t iat ives 2.4 .2 Th r i f t p lan 4.6 .3 Product iv i ty and operational
improvements - 3 . 4 - . 2
Total 36.6 2.5
MEMO Increase in total operat ing
expenses, 1991 estimate to 1992 budget 94.8 6.3
Digitized for FRASER http://fraser.stlouisfed.org/ Federal Reserve Bank of St. Louis

26 Annual Report: Budget Review, 1989-90
Table 3.4 Comparison of 1992 Budget Objective and Budget of the Reserve Banks over Estimated 1991 Expenses1
Percent change
I tem 1992
budget objective
1992 budget
Operating expenses 4.5 4.2 Budget objective factors 1.9 2.1 Special projects .8 .8
Total 7.2 7.2
1. See data on expenses in table 3.1.
anticipated spending for daylight over-draft processing and a smaller-than-expected increase in postage expenses.
The increase of $32.2 million, or 2.1 percent, for budget objective factors is within the range approved by the Board. The budgeted expenses for most of the factors vary only slightly from the budget objective, but the 1992 increase for supervision and regulation is ex-pected to be $8.5 million, or $6.3 million more than anticipated. The increase in the budget objective for supervision and regulation, $2.2 million, was based on an anticipated increase in staff of 55. The 1992 budget reflects a staff increase of 99 ANP. The deteriorating condition of banks on the east coast and the plan to expand examination programs through-out the System wil l require additional examiners.
Excluded from the 1992 spending target was the projected increase of $5.2 million, or 0.3 percent, associated with the Check Image Processing and Currency Authentication Systems special projects. The 1992 budget for these projects represents an increase of $6.7 million over the 1991 estimate, $1.8 million for the Check Image project and $4.8 million for the Development of Currency Authentication Systems. In addition, a new special project has been established to capture the costs asso-ciated with Automation Consolidation. The 1992 budget for this special project is $6.5 million.
Operational Areas Tables 3.5 and 3.6 summarize Reserve Bank expenses and employment in each of the four operational areas. Tables 3.7 though 3.10 show expense details for each area.
Monetary and Economic Policy
The 1992 budget increase of $5.5 mil-lion, or 5.1 percent above 1991 estimated expenses, reflects a staff increase of 3 ANP, salary administration actions, increased equipment and data-processing costs associated with automation initia-
Table 3.5 Operating Expenses of the Federal Reserve Banks, by Operational Area, 1990-92 Thousands o f dollars, except as noted
Operational area 1990 actual
1991 estimate
1992 budget
Percent change Operational area 1990
actual 1991
estimate 1992
budget 1990-91 1991-92
Monetary and economic policy 98,973 107,530 113,021 8.6 5.1 Services to the U.S. Treasury
and other government agencies 156,934 169,355 180,060 7.9 6.3 Services to financial institutions
and the public 938,862 985,340 1,042,078 5.0 5.8 Supervision and regulation 211,884 239,356 261,246 13.0 9.1
Total 1,406,652 1,501,581 1,596,405 6.7 6.3
Digitized for FRASER http://fraser.stlouisfed.org/ Federal Reserve Bank of St. Louis

Federal Reserve Banks 27
tives, costs associated with new building projects in two Districts, and increased costs of the research libraries in some Districts. Staffing increases are due pri-marily to the full-year effect of econ-omists hired during 1991.
At the District level, New York has budgeted for automation initiatives that include replacement of an information display system (IDS) in the Open Mar-ket and Foreign Exchange areas and installation of an office information system in the statistics area. New York's budget also reflects higher costs for data-processing support due to increased volume on the Securities Trading and Clearing System (STACS).
Services to the U.S. Treasury and Other Government Agencies
The 1992 budget for this operational area is projected to be $180.1 million, or 6.3 percent greater than estimated 1991 expenses. Staffing levels are expected to decline by 8 ANP. The continued conversion of over-the-counter savings bonds to the Savings Bond Regional Delivery System wi l l add 71 ANP to the consolidated operations-savings bonds area, but staff in other savings bonds activities wi l l decrease by 55 ANP. Savings bond volume is expected to increase by 9.0 percent, while unit costs are budgeted to decrease by 0.4 percent.
Table 3.6 Employment at the Federal Reserve Banks, by Activity, 1990-92 Average number of personnel, except as noted1
Activi ty 1990 actual
1991 estimate
1992 budget
Percent change Act iv i ty 1990
actual 1991
estimate 1992
budget 1990-91 1991-92
Operational areas Monetary and economic policy 772 791 794 2.4 .4 Services to the U.S. Treasury
and other government agencies 1,816 1,909 1,902 5.1 - . 4 Services to financial institutions
and the public 9,214 9,121 8,974 - 1 . 0 -1 .6 Supervision and regulation 2,217 2,378 2,477 7.3 4.2
Support and overhead2
Support 4,533 4,658 4,730 2.8 1.5 Overhead 4,940 4,974 4,995 .7 .4
Total 23,492 23,831 23,872 1.4 .2
1. See text note 1 for definition of average number of personnel. 2. See appendix F, table F.3, note 1, for definitions.
Table 3.7 Expenses of the Federal Reserve Banks for Monetary and Economic Policy, 1990-92 Thousands of dollars, except as noted
Service 1990 1991 1992 Percent change Service actual estimate budget 1990-91 1991-92
Economic policy determination 80,157 86,186 90,543 7.5 5.1 Open market trading 18,816 21,344 22,477 13.4 5.3
Total 98,973 107,530 113,021 8.6 5.1
Digitized for FRASER http://fraser.stlouisfed.org/ Federal Reserve Bank of St. Louis

28 Annual Report: Budget Review, 1989-90
Services to Financial Institutions and the Public
The 1992 budget for this operational area, which includes both priced and nonpriced operations, is expected to increase by $56.7 million, or 5.8 percent above estimated 1991 expenses. Staff is to be reduced by 147 ANP, primarily in the commercial checks (-118 ANP), definitive securities safekeeping and noncash collection ( -13 ANP), and automated clearinghouse ( -10 ANP)
operations. These decreases are partially offset by staff increases in currency and coin operations (19 ANP).
Commercial check processing is by far the largest service ($504.9 million), accounting for almost half the budgeted expenses for this operational area and requiring 5,480 ANP; the anticipated increase in expenses is $21.4 million, or 4.4 percent above estimated 1991 expenses. Staffing levels for 1992 in-clude a reduction of 118 ANP resulting from improved operations, continued
Table 3.8 Expenses of the Federal Reserve Banks for Services to the U.S. Treasury and Other Government Agencies, 1990-92 Thousands o f dollars, except as noted
Service 1990 1991 1992 Percent change Service actual estimate budget 1990-91 1991-92
Savings bonds 40,069 37,143 35,576 -7 .3 —4.2 Consolidated operations, savings bonds 13,566 23,724 28,593 74.9 20.5 Other Treasury issues 15,872 15,316 16,339 -3 .5 6.7 Consolidated operations, other Treasury
issues 1,495 1,275 1,396 -14 .7 9.5 Central Treasury and agency services 21,950 22,338 23,636 1.8 5.8 Government accounts 23,926 24,778 26,467 3.6 6.8 Food coupons 15,546 18,499 19,702 19.0 6.5 Other 24,508 26,282 28,351 7.2 7.9
Total 156,933 169,355 180,060 7.9 63
Table 3.9 Expenses of the Federal Reserve Banks for Services to Financial Institutions and the Public, 1990-92 Thousands o f dollars, except as noted
Service 1990 actual
1991 estimate
1992 budget
Percent change Service 1990
actual 1991
estimate 1992
budget 1990-91 1991-92
Currency and coin 156,240 168,215 183,279 7.7 9.0 Special cash 13,652 14,208 14,695 4.1 3.4 Commercial checks 473,099 483,528 504,892 2.2 4.4 Other checks 24,650 27,965 29,816 13.5 6.6 Funds transfer 63,731 71,562 75,742 12.3 5.8 Automated clearinghouse 78,880 82,598 89,527 4.7 8.4 Book-entry securities transfers 31,027 33,318 35,274 7.4 5.9 Defini t ive securities safekeeping
and noncash collection 14,710 14,542 14,288 - 1 . 1 - 1 . 7 Loans to members and others 15,073 15,987 16,826 6.1 5.2 Public programs 43,762 48,710 51,977 11.3 6.7 Other 24,038 24,708 25,764 2.8 4.3
Total 938,862 985,340 1,042,079 5.0 5.8
Digitized for FRASER http://fraser.stlouisfed.org/ Federal Reserve Bank of St. Louis

Federal Reserve Banks 29
automation in the area of check ad-justments, reductions in adjustment backlogs, conversion to optical disk storage systems in several Districts, and continued improvements in processing return items. Commercial check volume is budgeted to decrease 0.2 percent, while unit costs are budgeted to increase 4.2 percent.
Expenses for the currency service are expected to increase $13.3 million, or 9.3 percent, over 1991. Staff wi l l increase by 19 ANP. Currency volume is pro-jected to grow by 6.1 percent in 1992. The major initiatives affecting this service are managing increased volumes and the Second Generation Currency Processing project.
The automated clearinghouse (ACH) service is budgeted to increase by $6.9 million, or 8.4 percent. Growth in expenses wi l l shift from government to commercial ACH services, as com-mercial ACH volumes continue to grow at faster rates. Total ACH volume is projected to increase 15.9 percent in 1992, resulting in a 6.4 percent decrease in unit cost. Major initiatives affecting this service are conversion to Al l -Electronic ACH service and the Future ACH System project.
Expenses for the funds transfer service are expected to increase by $4.2 million, or 5.8 percent. Staff wi l l
decrease by 7 ANP. The increase in costs is primarily the result of increased data-processing, data-communications, and data-systems support costs associ-ated with volume growth. Some account-ing costs allocated to this service wi l l decrease as a result of funds summari-zation initiatives.
Supervision and Regulation
The increase of $21.9 mil l ion, or 9.1 percent, for this operational area is due mainly to the addition of 99 ANP and increases in compensation, equip-ment (primarily laptop computers), travel, training, and automation. Staff increases are necessitated by increased demands on the Federal Reserve's examination staffs, including more examinations of broader scope, increased emphasis on Bank Secrecy Act issues, the need to monitor compliance with and pursue enhancements to international risk-based capital standards, the in-creasing number of organizations that are likely to require special attention in the form of extended examinations in several Districts, and continued strength-ening of consumer affairs operations. Expenses are also affected by initiatives in the areas of payment system risk and daylight overdraft pricing.
Table 3.10 Expenses of the Federal Reserve Banks for Supervision and Regulation, 1990-92 Thousands of dollars, except as noted
Service 1990 actual
1991 estimate
1992 budget
Percent
1990-91
change
1991-92
Supervision of Distr ict financial institutions
Administrat ion o f laws and regulations related to banking
Studies o f banking and financial market structures
Total
131,328 151,430 168,666 15.3 11.4
69,257 76,929 80,559 11.1 4.7
11,298 10,997 12,021 - 2 . 7 9.3
211,884 239,356 261,246 13.0 9.1
Digitized for FRASER http://fraser.stlouisfed.org/ Federal Reserve Bank of St. Louis

30 Annual Report: Budget Review, 1989-90
Objects of Expense
Personnel expenses comprise officer and employee salaries, other compensation to personnel, and retirement and other benefits. Total personnel costs are expected to increase by 6.8 percent in 1992, accounting for 65.0 percent of Reserve Bank expenses (table 3.11).
Salaries and other compensation for personnel account for 52.0 percent of 1992 budgeted expenses, and anticipated growth is $45.1 million, or 5.7 percent. The increase for salaries, $46.6 million, or 6.0 percent, wi l l be partially offset by a decline of $1.5 million in other personnel expenses. Merit pay increases of $37.1 million, or 4.8 percent, are the
primary reason for salary expense growth. Also contributing to additional salary expenses are promotions, re-classifications, structure adjustments, and staffing level increases. These increases are partially offset by short-term position vacancies (lag) and reduced overtime expenses.
Retirement and other benefits ex-penses, which account for 13.0 percent of the 1992 Reserve Bank budgets, are anticipated to increase by $21.3 million, or 11.5 percent, over 1991. The increase is the result of continued escalation of hospital and medical costs, a rise in social security, workers compensation, and unemployment compensation pay-ments, and the higher employer con-
Table 3.11 Operating Expenses of the Federal Reserve Banks, by Object, 1990-92 Thousands o f dol lars, except as noted
Object 1990 actual
1991 estimate
1992 budget
Percent change Object 1990
actual 1991
estimate 1992
budget 1990-91 1991-92
PERSONNEL Of f icers ' salaries 73,979 80,598 85,005 8.9 5.5 Employees' salaries 646,980 693,656 735,867 7.2 6.1 Other personnel1 12,872 11,329 9,784 - 1 2 . 0 - 1 3 . 6 Retirement and other benefits 163,784 185,666 206,954 13.4 11.5
Tota l personnel 897,615 971,249 1,037,610 8.2 6.8
NONPERSONNEL Forms and supplies 53,418 54,942 55,997 2.9 1.9 Equipment 162,773 167,862 179,611 3.1 7.0 Software 32,221 32,931 34,433 2.2 4.6 Shipping 83,461 89,661 91,295 7.4 1.8 Travel 28,883 32,383 33,970 12.1 4.9
Bui ld ings Insurance 802 912 1,132 13.7 24.1 Real estate taxes 22,430 27,104 30,811 20.8 13.7 Property depreciation 33,545 35,666 40,228 6.3 12.8 Ut i l i t ies 25,486 26,776 29,465 5.1 10.0 Rent 22,029 23,364 24,771 6.1 6.0 Other 19,194 19,178 20,259 - . 1 5.6
Tota l bui ld ings 123,486 133,000 146,666 7.7 10.3
Recoveries - 35 ,204 -35 ,690 -38 ,033 1.4 6.6 A l l o ther 2 60,000 55,244 54,860 - 7 . 9 - . 7
Tota l nonpersonnel 509,037 530,333 558,796 4.2 5.4
Total 1,406,652 1,501,582 1,596,406 6.7 6.3
1. Expenses for certain contractual arrangements, and miscellaneous personnel expenses. 2. Communicat ions, fees, contra-expenses, shared costs distr ibuted, shared costs received,
support cost distr ibuted, support cost received, and other.
Digitized for FRASER http://fraser.stlouisfed.org/ Federal Reserve Bank of St. Louis

Federal Reserve Banks 31
tribution to the employee thrift plan in 1992.
Nonpersonnel expenses account for 35.0 percent of the 1992 Reserve Bank budgets, reflecting a projected increase of 5.4 percent over 1991.
Equipment expenses are expected to increase by 7.0 percent, accounting for 11.3 percent of total expenses in 1992. An equipment depreciation increase of $8.4 million, or 9.5 percent, is attrib-utable to continuing upgrades of data-processing equipment in some Districts, the full-year impact of equipment purchased in 1991, and the New York EROC and Dallas facilities programs.
Shipping expenses are projected to increase by 1.8 percent, accounting for 5.7 percent of Reserve Bank expenses in 1992. This small increase is due primarily to an increase in Interdistrict Transportation System costs offset by savings in postage costs as a result of RDS implementation.
Building expenses, which account for 9.2 percent of total 1992 expenses, are expected to increase by 10.3 percent over 1991 because of higher real estate taxes and the full-year effect of recently completed capital projects in a number of Districts. The New York EROC and
Dallas building projects contribute heavily to the large increases.
Recoveries are expected to increase by $2.3 million, or 6.6 percent, in 1992, primarily because of increased income from tenants and expanded electronic ACH services.
Foreign travel expenses total $2.6 million, up 8.5 percent over 1991 but accounting for only 0.2 percent of total expenses. Examiner travel, budgeted at $1.6 million, is up 11.2 percent. Foreign travel expenses for Bank Presidents and First Vice Presidents, at $186,000, are up 19.0 percent over estimated 1991 expenses. Of this amount, $112,000 is budgeted for New York, primarily for that District's participation in the work of the Bank for International Settlements.
Capital Outlays Capital outlays are budgeted at $259.1 million, a decrease of $24.0 million, or 8.5 percent, from estimated 1991 expenses (table 3.12). The decrease is a result of the near completion of two major building projects, the Dallas building and New York's East Ruther-ford Operations Center. The Reserve
Table 3.12 Capital Outlays of the Federal Reserve Banks, by Class of Outlay, 1990-92 Thousands o f dollars, except as noted
Class o f outlay 1990 actual
1991 estimate
1992 budget
Percent change Class o f outlay 1990
actual 1991
estimate 1992
budget 1990-91 1991-92
Data-processing and data-communications equipment 94,715 72,221 112,452 -23 .7 55.7
Bui ldings 76,313 138,753 51,257 81.8 - 6 3 . 1 Furniture, furnishings,
and fixtures 12,279 22,874 28,512 86.3 24.6 Other equipment 14,613 20,550 34,311 40.6 67.0 Land and other real estate 35,055 3,294 8,632 -90 .6 162.0 Bu i ld ing machinery and equipment 8,906 23,571 18,665 164.7 -20 .8 Leasehold improvements 1,012 1,813 2,830 79.1 56.1 Software 2,454
Total 242,893 283,076 259,112 16.5 -8.5
Digitized for FRASER http://fraser.stlouisfed.org/ Federal Reserve Bank of St. Louis

32 Annual Report: Budget Review, 1991-92
Banks' capital budgets continue to be dominated by outlays for data-processing and data-communications equipment.
Outlays for data-processing and data-communications equipment for 1992 amount to $112.5 million, approximately 43.4 percent of total capital outlays. The largest portion of these outlays is for central processing units and check equipment ($25.5 million), primarily for data- and check-processing systems at EROC ($9.2 million) and Dallas ($4.5 million). Purchases and upgrades of storage devices are planned by all Districts. In addition, Chicago has budgeted $6.3 million for equipment related to a system communication center.
Purchases of furniture and other equipment are budgeted at $62.8 million, about 24.2 percent of total capital outlays. New York's planned purchase of equipment for installation at EROC accounts for approximately one-fourth of these outlays ($15.4 million). The Districts plan to spend approximately $16.7 million on cash-related equipment, including currency processing machines at EROC and Baltimore ($8.7 million), cash materials handling systems at several offices ($3.9 million), and cur-rency briqueters at EROC, Atlanta, and Chicago ($1.0 million).
Building outlays account for $51.3 mil l ion in the 1992 budget, about 19.8 percent of total capital outlays. The amount includes renovation and remod-eling projects in several Districts ($15.3 million), consulting fees associated with the planned new facility at Minneapolis ($8.3 million), and construction of New York's EROC ($6.3 million).
Land and other real estate purchases are budgeted at $8.6 million. The largest item is land for the new Minneapolis building ($4.2 million); another $2.0 million is budgeted for a new parking lot at San Francisco's Portland office.
Building machinery and equipment outlays are budgeted at $18.7 million. A large portion of these outlays is related to the Dallas building project ($6.3 mill ion); the remainder w i l l enable several Districts to upgrade or replace existing machinery and equipment.
Outlays for leasehold improvements are budgeted at $2.8 million.
Trends in Expenses and Employment For the ten years ending in 1992, expenses of the Reserve Banks wi l l have increased an average of 5.1 percent per year (chart 3.1). From 1987 through 1992, the annual growth in Bank expenses has been 5.9 percent. Increases in expenses were slightly higher after 1987 because of implementation of EFA (Expedited Funds Availability Act) and increased bank supervision.
The number of employees at the Reserve Banks has increased from 23,230 in 1982 to 23,871 in 1992, an increase of 641 ANP (chart 3.2). Since 1982, staffing has increased in super-vision and regulation (681 ANP) and services to financial institutions and the public (408 ANP) because additional
Chart 3.1 Operating Expenses of the Federal Reserve Banks, 1982-921
B i l l i o n s o f dol lars
l l l l l l i I I _l_
1982 1987 1992
1. For 1991, estimate; for 1992, budget. 2. Calculated with the GNP price deflator.
Digitized for FRASER http://fraser.stlouisfed.org/ Federal Reserve Bank of St. Louis

Federal Reserve Banks 33
Chart 3.2 Employment at the Federal Reserve Banks, 1982-921
ANP, in thousands
24
23
1. For 1991, estimate; for 1992, budget. See text note 1 for definit ion o f ANP.
Table 3.13 Changes from 1991 to 1992 in Volume and Unit Costs of Federal Reserve Bank Services Percent
Service Volume Uni t cost
Payments 2.4 2.4 Commercial checks - . 2 4.2 Automated clearinghouse 15.9 - 6 . 4 Funds transfers 4.5 1.3 Other checks - 1 . 1 7.0
Cash 4.8 3.6
Fiscal 3.8 3.5
Securities and noncash - 1 . 5 5.1
All services 2.8 2.9
resources were needed to meet expanded responsibilities in the two areas. Partially offsetting these increases were decreased staff in overhead services (681 ANP) resulting from Systemwide efforts to control costs.
Volume and Unit Costs Volume for all measured operations is expected to increase by 2.8 percent over 1991, and unit cost is expected to rise by 2.9 percent (table 3.13). Over the years 1987 through 1992 budget, volume is expected to increase at an average annual rate of 3.1 percent and unit cost at an average annual rate of 1.8 percent. The increase in unit cost expected for 1992 reflects a rise in unit cost in all areas except ACH services and savings bonds. In the area of commercial checks, the largest component of the index, unit cost is expected to increase by 4.2 percent and volume to decrease by 0.2 percent; the decrease in volume is due primarily to bank mergers.
1991 Budget Performance The 1991 Reserve Bank budgets were approved in December 1990 at a total of
$1,501.0 million, an expected increase of $86.4 million, or 6.1 percent, over estimated 1990 expenses. The Reserve Banks now estimate that 1991 expenses wi l l have been $1,501.6 million, or $0.6 million over the approved budget.
Five Reserve Banks expect to be within 0.1 percent of their approved 1991 budgets. As a result of a building accident that caused water damage to its computer, Minneapolis anticipates a budget overrun of $2.9 mill ion, or 4.1 percent. Richmond anticipates a budget overrun of $492,000, or 0.4 per-cent, primarily because additional staff are needed in the area of supervision and regulation. Seven Districts expect to be under budget by less than 1 percent. •
Digitized for FRASER http://fraser.stlouisfed.org/ Federal Reserve Bank of St. Louis

Part II Special Analysis
Digitized for FRASER http://fraser.stlouisfed.org/ Federal Reserve Bank of St. Louis

37
Chapter 4
Treasury Direct: A Book-Entry Safekeeping System for Individual Investors
Treasury Direct is a book-entry system for safekeeping Treasury securities that is operated by the Federal Reserve Banks, on behalf of the U.S. Department of the Treasury. The system is most suited to serving the needs of individual investors who tend to hold Treasury securities until maturity and prefer to safekeep the securities with the Treasury Department.
Treasury Direct was designed by the Federal Reserve System and the Treasury Department as part of the department's ongoing efforts to eliminate the handling of engraved Treasury securities; it is maintained on a central computer oper-ated by the Federal Reserve Bank of Philadelphia. Introduction of the system in mid-1986 permitted the Treasury Department to begin issuing its securities in book-entry-only form (that is, no certificate is issued). Treasury officials estimate that in its first seven years of operation, Treasury Direct will have saved the department and U.S. taxpayers $46 million through increased efficiency in securities issuance, servicing, redemp-tion, and payment of interest.
Features of Treasury Direct In addition to saving money, Treasury Direct has improved services to in-vestors. For many investors, it offers a number of important advantages.
Added Security
Treasury Direct affords investors more safety than do engraved securities, because the securities are held on a
computer rather than in paper form. With engraved securities, loss or theft is always a concern. If an engraved security that was issued in registered form (that is, with the security owner's name inscribed on the security) is lost or stolen, replacement is possible, but the time and documentation required for replacement are considerable. I f an engraved security issued in bearer form (that is, payable to the bearer) is lost or stolen, recovery is unlikely, and filing a claim entails considerable paperwork as well as cost and time. With Treasury Direct, there is no engraved security to be lost; instead, the security is held on a computer in the owner's name.
More Registration Options
Treasury Direct offers investors a broader choice of registration options than is available with engraved securities. The system also enables owners to establish clear ownership and survivor-ship rights to their securities. Among the popular registration options are designation of a beneficiary, joint ownership with or without right of sur-vivorship, and registration of a natural guardian of a minor or custodian under an applicable "gifts to minors" statute. In addition, the registration on a Treasury Direct account can be changed faster than it can for engraved securities issued in registered form.
Improved Payment Procedures
Investors using Treasury Direct have greater assurance of prompt receipt of
Digitized for FRASER http://fraser.stlouisfed.org/ Federal Reserve Bank of St. Louis

38 Annual Report: Budget Review, 1989-90
securities-related payments. Payments are made automatically via direct de-posit to a checking or savings account at a financial institution designated by the investor. Prior to Treasury Direct, all payments were made by check, and most were mailed to the investor; also, interest payments to investors holding bearer (coupon) securities were not automatic, but required investors to clip the maturing coupons and present them for collection. Treasury Direct provides payment automatically. In addition, the direct deposit feature precludes loss or theft of checks and gives investors immediate access to their funds on payment day.
Easier Reinvestment and Redemption
When an engraved security matures, it must be presented, in person or by registered mail, to a Federal Reserve Bank or Branch for redemption or reinvestment. In the Treasury Direct sys-tem, investors merely inform a Federal Reserve Bank or the Treasury Depart-ment, by mail, about how a maturing security should be handled. If it is to be redeemed, the investor's account at his or her depository institution is auto-matically credited for the redemption proceeds on the day the security matures. If it is to be reinvested in a Treasury security being issued the day the original security matures, the new security is added to the investor's Treasury Direct account, and any difference between the value of the maturing security and the purchase price of the new security is automatically deposited in the investor's account at a designated depository institution. Also, under Treasury Direct the investor is notified by mail when a security is about to mature and is given
ample time to request reinvestment at maturity or to cancel an earlier in-struction to reinvest.
Simplified Recordkeeping
Treasury Direct account holders receive a single statement of account for all securities held under each registration option and with the same payment instructions. Such a consolidated state-ment can simplify bookkeeping for investors who hold a number of securities in the system.
Nationwide Servicing Offices
Investors can obtain information about and conduct transactions involving Treasury Direct accounts at the Treasury Department or at thirty-six Federal Reserve Banks and Branches around the United States (see accompanying list). Al l locations can establish new Treasury Direct accounts, process purchases of Treasury securities, handle securities transfers from one Treasury Direct account to another or from Treasury Direct to the Federal Reserve's commer-cial book-entry system, and make a variety of requested changes to account information. Al l locations wil l also provide forms and written information and handle telephone inquiries.
Each account holder is assigned a Treasury Direct servicing office based on mailing address. However, an account holder who travels or spends extended periods of time in a different location may deal with the servicing office nearest the temporary location. Any servicing office can conduct a transaction or handle an inquiry for any Treasury Direct account holder regardless of the assigned office.
Digitized for FRASER http://fraser.stlouisfed.org/ Federal Reserve Bank of St. Louis

Treasury Direct 39
Treasury Direct Servicing Offices
Federal Reserve Bank or Branch Telephone Number Address
FRB Atlanta 404-521-8657* 404-521-8653
Securities Service Department 104 Marietta Street, N W Atlanta, G A 30303
FRB Balt imore 301-576-3500* 301-576-3300
P.O. Box 1378 Balt imore, M D 21203
FRB Birmingham 205-731-8702* 205-731-8708
P.O. Box 10447 Birmingham, A L 35283
FRB Boston 617-973-3805* 617-973-3810
P.O. Box 2076 Boston, M A 02106
FRB Buf fa lo 716-849-5158* 716-849-5000
P.O. Box 961 Buffa lo, N Y 14240-0961
FRB Charlotte 704-358-2424* 704-358-2100
P.O. Box 30248 Charlotte, N C 28230
FRB Chicago 312-786-1110* 312-322-5369
P.O. Box 834 Chicago, I L 60690
FRB Cincinnati 513-721-4787 Ext. 334 P.O. Box 999 Cincinnati, O H 45201
FRB Cleveland 216-579-2490 P.O. Box 6387 Cleveland, O H 44101
FRB Dallas 214-651-6362 Security Dept. Station K 400 South Akard Street Dallas, T X 75222
FRB Denver 303-572-2475* 303-572-2470 or -2473
P.O. Box 5228 Denver, C O 80217-5228
FRB Detroit 313-963-4936* 313-964-6157
P.O. Box 1059 Detroit, M I 48231
FRB E l Paso 915-544-4730 P.O. Box 100 E l Paso, T X 79901
FRB Houston 713-659-4433 P.O. Box 2578 Houston, T X 77252
FRB Jacksonville 904-632-1178* 904-632-1179 o r - 1 1 9 0
P.O. Box 2499 Jacksonville, F L 32231-2499
FRB Kansas Ci ty 816-881-2767* 816-881-2409
P.O. Box 440 Kansas Ci ty, M O 64198
FRB Li t t le Rock 501-324-8272 P.O. Box 1261 Li t t le Rock, A R 72203
FRB Los Angeles 213-624-7398 P.O. Box 2077 Terminal Annex Los Angeles, C A 90051
FRB Louisvi l le 502-568-9240* 502-568-9236 or -9238
P.O. Box 32710 Louisvi l le, K Y 40232
FRB Memphis 901-523-7171 Ext. 641* Ext. 622
P.O. Box 407 Memphis, T N 38101
FRB M i a m i 305-471-6257* 305-471-6497
P.O. Box 520847 Miami , F L 33152
FRB Minneapolis 612-340-2051* 612-340-2075
250 Marquette Ave. Minneapolis, M N 55480
Digitized for FRASER http://fraser.stlouisfed.org/ Federal Reserve Bank of St. Louis

40 Annual Report: Budget Review, 1989-90
Treasury Direct Servicing Offices—Continued
Federal Reserve Bank or Branch
FRB Nashvil le
FRB New Orleans
FRB New York
FRB Oklahoma Ci ty
FRB Omaha
FRB Philadelphia
FRB Pittsburgh
FRB Portland
FRB Richmond
FRB Salt Lake Ci ty
FRB San Antonio
FRB San Francisco
FRB Seattle
FRB St. Louis
U.S. Treasury Department
Telephone Number
615-251-7236* 615-251-7100
504-593-3290* 504-593-3200
212-720-5823* 212-720-6619
405-270-8660* 405-270-8652
402-221-5638* 402-221-5636
215-574-6580* 215-574-6680
412-261-7988* 412-261-7863
503-221-5931* 503-221-5932
804-697-8355* 804-697-8372
801-322-7844* 801-322-7900
512-978-1330* 512-978-1303 or -1305
415-974-3491* 415-974-2330
206-343-3615* 206-343-3605
314-444-8602* 314-444-8665
202-874-4000 202-874-4026**
Address
301 Eighth Ave., N. Nashvil le, T N 37203-4407
P.O. Box 61630 New Orleans, L A 70161
Federal Reserve P.O. Station New York , N Y 10045
P.O. Box 25129 Oklahoma City, O K 73125
2201 Farnam Street Omaha, N E 68102
P.O. Box 90 Philadelphia, PA 19105
P.O. Box 867 Pittsburgh, PA 15230-0867
P.O. Box 3436 Portland, OR 97208-3436
P.O. Box 27622 Richmond, V A 23261
P.O. Box 30780 Salt Lake Ci ty, U T 84130
P.O. Box 1471 San Antonio, T X 78295
P.O. Box 7702 San Francisco, C A 94120
Securities Services Dept. P.O. Box 3567 Terminal Annex Seattle, W A 98124
P.O. Box 14915 St. Louis, M O 63178
Bureau o f the Public Debt Div is ion of Customer Services Washington, D C 20239-0001
*For recorded information. * *Dev ice for hearing impaired.
Free Services
Investors are not charged for the ser-vices provided by Treasury Direct. Also, at this time there is no limit on the number of Treasury Direct accounts an individual can have.
Growth of Treasury Direct Treasury Direct has grown in popularity since it began to accept all Treasury
issues in 1986. By the end of 1986, 77,942 Treasury Direct accounts with a par value of $731 million had been established; twelve months later, the totals had grown to 391,779 accounts with a par value of $22.6 billion; as of December 31, 1991, the numbers were 1,094,915 accounts with a par value of $64.4 billion. In 1991 alone, Treasury Direct servicing offices in Federal Reserve Banks and Branches handled approximately 600,000 new security
Digitized for FRASER http://fraser.stlouisfed.org/ Federal Reserve Bank of St. Louis
Treasury Direct 41
purchases, 1.8 million account-servicing transactions, and 1.6 million telephone, written, and walk-in inquiries and sent out more than 11.7 million notices and account statements to Treasury Direct account holders.
By offering convenience and a range of services, Treasury Direct has become an attractive alternative for investors who wish to hold their Treasury securities on the books of the Treasury Department.
Digitized for FRASER http://fraser.stlouisfed.org/ Federal Reserve Bank of St. Louis

Appendixes
Digitized for FRASER http://fraser.stlouisfed.org/ Federal Reserve Bank of St. Louis

45
Appendix A
Mission and Operational Areas of the Federal Reserve System
The Federal Reserve Banks and the Board of Governors have established four major operational areas to account for their activities: monetary and eco-nomic policy, services to the U.S. Treasury and other government agen-cies, services to financial institutions and the public, and supervision and regulation of financial institutions.1 This appendix describes each of these areas in detail.
Monetary and Economic Policy The Federal Reserve contributes to the attainment of the nation's economic and financial goals through actions to influence money and credit in the econ-omy. The System has several tools to affect the availability and cost of the nation's money and credit: setting reserve requirements; setting the discount rate (which affects the cost of bor-rowing); and open market operations, the primary tool of monetary policy.
The seven-member Board of Gover-nors sets reserve requirements and acts on requests from the Federal Reserve Banks to adjust the discount rate. The Federal Open Market Committee (FOMC) meets in Washington eight times a year, usually twice each business quarter, to set policies for System open
1. Services to the U.S. Treasury and other government agencies is an operational area unique to the Federal Reserve Banks. The fourth operational area for the Board of Governors, System policy direction and oversight, provides resources for the supervision of Board and Bank programs and is discussed in chapter 2.
market operations; it comprises the Board, the president of the Federal Reserve Bank of New York, and, on a rotating basis, the presidents of four other Reserve Banks.
A vast amount of banking and finan-cial data flows through the Reserve Banks to the Board, where it is compiled and made available to the public in weekly and monthly statistical releases on such topics as the monetary aggre-gates, interest rates, bank credit, and exchange rates. The research staffs at the Board and the Reserve Banks use this information, along with data col-lected by other public and private insti-tutions, to assess the state of the econ-omy and the relationships between the financial markets and economic activity. Staff members provide background for the Board and for each meeting of the FOMC by preparing detailed economic and financial analyses and projections for the domestic economy and interna-tional markets. In addition, they conduct longer-run economic studies of issues at the regional, national, and international levels.
Services to the U.S. Treasury and Other Government Agencies The U.S. government uses the Federal Reserve as its bank. Through deposit accounts at the Federal Reserve Banks, the government issues its checks and payments and collects its receipts. The Reserve Banks also process wire trans-fers of funds and automated clearing-house payments and give the Treasury daily statements of account activity.
Digitized for FRASER http://fraser.stlouisfed.org/ Federal Reserve Bank of St. Louis

46 Annual Report: Budget Review, 1989-90
Beyond these typical depository activ-ities, the Federal Reserve Banks provide several unique services to the govern-ment. They monitor the tax receipts deposited in the 13,026 tax and loan accounts maintained by depository insti-tutions designated to perform this func-tion, they hold the collateral that those institutions pledge to support those and other government deposits, and they transfer funds to the Treasury's account at its request. The Reserve Banks assist the Treasury in its financing of the public debt by issuing, servicing, and redeeming all marketable Treasury securities as well as all U.S. savings and retirement plan bonds. In another unique fiscal service, the Reserve Banks redeem food coupons for the U.S. Department of Agriculture and destroy them.
Services to Financial Institutions and the Public The Federal Reserve System plays a central role in the nation's payments mechanism, which consists of many independent systems designed to move funds among financial institutions across the country. The Federal Reserve dis-tributes currency and coin, processes checks for collection, operates electronic funds transfer networks, and provides for transfers of securities and for coupon collection.
Ensuring that the supply of currency and coin meets the public's demand for cash is the responsibility of the Federal Reserve. The Reserve Banks obtain cur-rency and coin from the Bureau of Engraving and Printing and from the Mint and distribute it to the public through depository institutions. The Banks use highly sophisticated equip-ment to count cash, identify counterfeits, and destroy currency that is unfit for
circulation. In 1991 the Reserve Banks paid out $285.2 billion in currency and $4.8 bi l l ion in coin and destroyed $73.8 billion of unfit currency.
The Reserve Banks collect and clear checks under the specific authority of the Federal Reserve Act of 1913. The Banks, Branches, and regional check-processing centers currently clear approximately 18.5 billion checks each year with an average daily value of more than $50 billion. Most checks deposited with the Federal Reserve by financial institutions are collected on the day they are deposited or on the next business day.
The Federal Reserve also plays a central role in the nation's payments mechanism through its wire transfer system, Fedwire. Depository institutions can draw on their reserves or clearing accounts at the Reserve Banks through Fedwire and transfer funds anywhere in the country. Approximately 6,969 depository institutions use Fedwire through direct computer connections with Federal Reserve Banks, and another 4,399 institutions use Fedwire through off-line means such as tele-phone. In 1991, approximately 64 mil-lion transfers valued at about $191 tril-lion were sent over Fedwire, an average of $3.0 million per transfer and $761 bil-lion per day.
The Federal Reserve allows partici-pants in private clearing arrangements to exchange and settle transactions on a net basis through reserve or clearing-account balances. Users of net settlement ser-vices include local check clearinghouse associations, automated clearinghouse (ACH) networks, credit card processors, automated teller machine networks, and national and regional funds and securities transfer networks. In 1991, approxi-mately 770,000 net settlement entries were processed by the Reserve Banks.
Digitized for FRASER http://fraser.stlouisfed.org/ Federal Reserve Bank of St. Louis

Mission and Operational Areas 47
Approximately 29,000 depository institutions participate in the Federal Reserve's ACH service, which makes one-time and recurring payments elec-tronically instead of by check. The depository institutions use the ACH service for credit transactions, primarily to pay salaries and pensions, and for debit transactions such as preauthorized bil l payments and cash concentration debits. Of the approximately 11,100 ACH endpoints, 3,700 have electronic connections with the Federal Reserve; the others receive payment data via magnetic tapes or paper registers. In 1991 the Reserve Banks processed more than 1.6 billion ACH transactions valued at about $6.7 trillion; 32 percent of the transactions were for the fed-eral government, and the rest were commercial.
The securities services provided by the Reserve Banks cover the handling of book-entry securities and definitive securities and the collection of coupons and miscellaneous items. The book-entry service, begun in 1968, enables holders of government agency securities to transfer them electronically to other institutions throughout the country. The Reserve Banks maintained approxi-mately 14,372 book-entry accounts in 1991 and processed approximately 11.2 million securities transfers.
In the definitive securities service, the Banks store physical securities ineligible for maintenance on the Federal Reserve's book-entry system. The Federal Reserve held about $15.1 billion of such securities in priced accounts at the end of 1991.
In its noncash collection service, the Federal Reserve presents coupons, bonds, and miscellaneous items, such as bankers acceptances and certain checks and drafts, for collection. Coupon collec-tion, which accounts for approximately 98 percent of the transactions in this
service, amounted to 2.9 million coupon envelopes in 1990 and about 2.2 million coupon envelopes in 1991.
Supervision and Regulation Under the authority of the Federal Reserve Act and the Bank Holding Com-pany Act, the Federal Reserve System plays a major role in the supervision and regulation of banks and bank holding companies. Under the Bank Holding Company Act, the Board is responsible for ensuring that all activities of bank holding companies are "closely related to banking and a proper incident thereto." The Board of Governors adopts regulations to carry out statutory direc-tives and establishes System supervisory and regulatory policies; the Reserve Banks conduct on-site examinations and inspections of state member banks and bank holding companies, review appli-cations for mergers, acquisitions, and changes in control from banks and bank holding companies, and take formal supervisory actions. The System makes available to the public nonidentifying information it periodically collects on the condition and income of banks and bank holding companies.
Beyond these activities, the Federal Reserve maintains continuous oversight of the banking industry to ensure the overall safety and soundness of the financial system. This broader respon-sibility is reflected in the System's pres-ence in financial markets, through open market operations, and in the Federal Reserve's role as lender of last resort.
In 1991 the System maintained the intensified supervision program for state member banks and bank holding com-panies that was implemented five years ago as a result of the increase in the number of bank failures and problem banks. In 1991 the Board and the Reserve
Digitized for FRASER http://fraser.stlouisfed.org/ Federal Reserve Bank of St. Louis

48 Annual Report: Budget Review, 1989-90
Banks examined approximately 790 state member banks, inspected approximately 2,254 bank holding companies and their subsidiaries, and acted on a total of 3,083 international and domestic applications.
The Board enforces compliance by state member banks with the federal laws protecting consumers in their use of credit. In 1991 the System con-ducted approximately 591 compliance examinations.
The Board's supervisory responsibili-ties also extend to foreign operations of U.S. banks and, under the International Banking Act, to U.S. operations of for-eign banks. •
Digitized for FRASER http://fraser.stlouisfed.org/ Federal Reserve Bank of St. Louis

49
Appendix B
Budget Processes
As a group, the Reserve Banks follow a budgeting process distinct from that of the Board of Governors. This appendix surveys those processes and explains PACS, the planning and control system the Banks use for accounting.
The Budget and Control Process of the Board of Governors The Board involves all levels of its management in a planning, budget, and control process based on the calendar year. Under authority delegated by the Chairman, the administrative governor oversees the process to ensure that all elements are coordinated, objectives are achieved, and duplication of effort is avoided.
The Board structures its budget in four operational areas: economic and monetary policy, supervision and regu-lation of financial institutions, services to financial institutions and the public, and System policy direction and over-sight. Costs for data processing are distributed to the four major areas ac-cording to usage. Expenses for other elements of support and overhead are allocated to the four areas in proportion to the share of direct costs attributable to each area.
The Budget Schedule
In the spring, each division at the Board reviews its goals and resource require-ments by obtaining guidance from over-sight committees made up of Board members, by participating in System planning sessions, and by conducting division planning sessions. The manage-
ment of each division lists events likely to affect the division's budget and estimates budget changes associated with those events. Simultaneously, the Office of the Controller prepares a budget esti-mate based on the current level of opera-tion, taking into account known or anticipated factors such as wage and benefit increases and changes in costs for goods and services. The controller uses this projection of expenses, with the estimates from the other divisions and guidance from the Board's oversight committees, to estimate a budget guide-line. The Chairman and the administra-tive governor review the proposed guide-line before it is submitted to the Board in June. Using the staff analyses, the Board approves a guideline in an open meeting, and the divisions use the guideline to develop their budgets.
During the summer, the divisions prepare their budgets. First the Board's controller and staff director for manage-ment and then the appropriate oversight committees review them. These reviews usually result in improved coordination, better consistency among division plans and objectives, and reduced expenses. The administrative governor then pre-sents the consolidated budget proposal to the Chairman for his review and comments. In early December, at an open meeting, the budget is presented to the Board of Governors for action.
The Budget of the OIG
The Board's Office of Inspector General (OIG), in accordance with its statutory independence, prepares its proposed budget apart from the oversight and
Digitized for FRASER http://fraser.stlouisfed.org/ Federal Reserve Bank of St. Louis

50 Annual Report: Budget Review, 1989-90
guideline process just described and submits it directly to the Board without formal staff review. The Board may seek staff assistance in reviewing the budget of the OIG before reviewing and approving it at the same open meeting as the regular budget.1
Treatment of Capital Expenditures
In 1985 the Board began capitalizing certain assets and depreciating their value over appropriate time periods instead of expensing them in their year of purchase. Capitalizing, which is in accordance with generally accepted accounting principles, more closely aligns the cost of capital assets with their periods of service and is consistent with the accounting practices followed by the Reserve Banks.
Assessments
After the Board adopts its budget, the cash requirement for the first half of the year is estimated. The administrative governor reviews and approves this estimate in early January, and, as the Federal Reserve Act provides, the re-quired amount is raised by an assessment on each of the Reserve Banks in proportion to its capital stock and surplus. The cash requirement for the second half of the year is estimated in June, and the second assessment is made in July. To minimize cash balances held by the Board, funds are transferred quarterly.
Financial Monitoring and Control
Al l levels of Board management monitor and review Board expenses throughout
1. Operations of the OIG are also discussed in chapter 2 and appendix E.
the budget year. To facilitate this process, each division constructs quarterly oper-ating plans. Administrative management observes performance against these plans monthly and submits quarterly reports to the Board.
At midyear, the controller and the staff director for management review current expenses with each division director, estimate expenses for the entire year, and submit the estimate to the Board with any recommendations for reallocations. The midyear review helps control current expenses and provides a baseline for analyzing budget requests. At the beginning of the next year, the controller and the staff director for management report to the Board on the previous year's performance against budget and operating goals.
The Budget and Control Process of the Federal Reserve Banks Each year the Federal Reserve Banks, like the Board, establish major operat-ing goals for the calendar year, devise strategies for their attainment, estimate required resources, and monitor results of current operations and financial performance.
The Budget Process
A task force drawn from staff members of the Board and the Reserve Banks develops a proposed budget guideline for the coming year based on forecasts of changes in workload and productivity at the Reserve Banks. The Conference of First Vice Presidents and the Confer-ence of Presidents of the Reserve Banks review the work of the task force and, if necessary, revise it before sending it to the Board of Governors. The Board determines the appropriateness of the proposed level of spending and at about midyear communicates the budget ob-
Digitized for FRASER http://fraser.stlouisfed.org/ Federal Reserve Bank of St. Louis

Budget Processes 51
jective to the Reserve Banks for their guidance in developing plans and budgets. To plan for priced services, the Banks update a multiyear strategic statement.
The management of each Bank de-partment develops its budget on the basis of workloads, required initiatives, and the budget objective. Senior Bank officials review the departmental re-quests and, with the president and first vice president, determine priorities for the overall budget level to be recom-mended to the Bank's board of direc-tors. In the fall, the Board of Governors approves the budget of each Reserve Bank as well as the fee schedule for priced services, which is developed simultaneously with the budget data.
The Capital Budget Process
The Reserve Banks account for capital expenditures in accordance with gener-ally accepted accounting principles and, therefore, include depreciation of capital assets in expenses. Technical staff members at the Board review all plans for large capital expenditures, whether for buildings, automation equipment, furnishings, or land. The staff members then make recommendations to the director of the Division of Reserve Bank Operations and Payment Systems or to the Board of Governors, depending on the significance of the item or project.
Review at the Board of Governors
In the fall, analysts at the Board review the budget of each Reserve Bank and note Systemwide issues to be addressed during the budget review. They analyze the executive summary and the statement of objectives in each budget in light of the Bank's own trends, plans at the other Banks, the System budget objective, and
the cost-recovery objectives for priced services. The product directors and the Pricing Policy Committee examine the budgets for priced services.2 A commit-tee of three governors reviews the budget of each Reserve Bank and meets with the president and first vice president of each Bank to discuss issues and directions. Following review by the committee of three governors, all Bank budgets are sent to the Board of Governors for action at a public meeting in December.
Special Projects
Special projects are those few research and development efforts that have the potential to make a major improvement in the nation's payments mechanism or in the Federal Reserve's ability to provide services. Because of their long-range importance, special projects are approved separately from the process described above, which focuses on operational costs. Although not included in the budget objective, these projects are individually approved by the Conference of Presidents and the Board of Governors, and their effect on total system outlays is carefully reviewed. Three such projects, described in appendix C, have been approved for 1992.
2. The product directors are the first vice presidents at selected Reserve Banks with responsi-bility for day-to-day policy guidance over specific Systemwide priced services. The Pricing Policy Committee comprises one governor, the Board's staff director for Federal Reserve Bank activities, the presidents of two Reserve Banks, and the first vice presidents of two other Reserve Banks.
Digitized for FRASER http://fraser.stlouisfed.org/ Federal Reserve Bank of St. Louis
52 Annual Report: Budget Review, 1989-90
The Planning and Control System
The Planning and Control System (PACS), implemented by the Reserve Banks in 1977, is the fundamental cost accounting system for all the services provided by the Banks, whether priced or nonpriced, special or routine. Under PACS, budgets can be compared with actual expenses by service and object, and the Board of Governors can compare the financial and operating performances of the Reserve Banks.
PACS groups all costs by major ser-vices, listed on the facing page under the four operational areas and support and overhead. The costs of support and overhead, in turn, are fully allocated to the four operational areas. PACS offers a detailed analysis of all these services
and activities, including productivity statistics (primarily unit costs and items per employee-hour), "environmental" statistics (to clarify the differences among the Banks' operating environ-ments), and "quality" statistics (to meas-ure performance).
PACS affords the Banks a review of expenses, an audit trail, and expense accountability. Through periodic on-site reviews, the Board confirms that the Reserve Banks are complying with PACS instructions and also with System guidelines set by the Board. In addition, the General Accounting Office and an outside public accounting firm have determined in independent examinations that PACS is an appropriate and effective accounting mechanism for the Federal Reserve.
Digitized for FRASER http://fraser.stlouisfed.org/ Federal Reserve Bank of St. Louis

Budget Processes 53
Federal Reserve Bank Services
OPERATIONAL AREAS SUPPORT AND OVERHEAD
Monetary and economic policy Support Economic policy determination Data services Open market trading Centrally provided support
Occupancy service Services to the U.S. Treasury Printing and supplies
and other government agencies Centralized planning Savings bonds District projects Consolidated operations—savings bonds Other Treasury issues Overhead Consolidated operations—other Treasury issues Administration Centrally provided Treasury and agency services System projects and contingency processing center Government agency issues Special projects Other Treasury and government agency services Mail Treasury and other government coupons Legal Food coupons General books and budget and expense control Government accounts Files and records storage
Personnel Services to financial institutions and the public Purchasing Special cash service Protection Currency Motor vehicles Coin Library Transfer of account balances Telephone Automated clearinghouse Audit Commercial check Other check Book-entry securities Definitive securities Loans to depository institutions and others Noncash collection Public programs Other
Supervision and regulation Supervision of District financial institutions Administration of laws and regulations
related to banking Market structure and supervisory and regulatory
policy studies
Digitized for FRASER http://fraser.stlouisfed.org/ Federal Reserve Bank of St. Louis

55
Appendix C
Special Categories of System Expense
This appendix discusses System ex-penses for priced services, capital assets, special projects, and currency printing.
Priced Services The Monetary Control Act of 1980 (MCA) requires the Federal Reserve to make available to all depository institutions, for a fee, certain services that the Federal Reserve had previously provided without explicit charge and only to member banks. As the act requires, the cost of providing these services includes all direct and indirect costs, the interest on items credited before actual collection (float), and the private sector adjustment factor (PSAF). The PSAF is the return on capital that would have been provided and the taxes that would have been paid had the services been furnished by a private business firm.
To meet the requirement for the full recovery of costs, the Federal Reserve has developed an annual pricing process involving a review of Reserve Bank expenses in addition to the review required by the budget process. Use of the budgets is an integral part of the pricing exercise because most of the recoverable costs of priced services are direct and indirect costs as determined by the budgets. To assist depository institutions in their planning to provide or use correspondent banking services, the Federal Reserve usually sets each year's prices only once, in the fourth quarter of the preceding year.
Fees for Federal Reserve services must be approved by the product director for the respective service, by the Pricing
Policy Committee, and ultimately by the Board of Governors.1 If fees for any service are set so that the full recovery of costs is not anticipated, the Board announces the rationale.
The cost of float is estimated by applying the current federal funds rate to the level of float expected to be generated in the coming year. Estimates of income taxes and the return on capital are based on tax and financing rates derived from a model of the fifty largest U.S. bank holding companies; these rates are applied to the assets the Federal Reserve expects to use in providing priced ser-vices in the coming year. The other components of the PSAF are derived from the budgets of the Reserve Banks and the Board: the imputed sales tax (based on budgeted outlays for materials, supplies, and capital assets); the imputed assessment for insurance by the Federal Deposit Insurance Corporation (FDIC) (based on expected clearing balances and amounts deferred to depository in-stitutions for items deposited for collection with the Reserve Banks); and an estimate of the direct and indirect expenses of the Board of Governors that is related to the development of priced services.
The inclusion of all these costs means the Federal Reserve offers its priced services on a basis comparable with that in the private sector, and the discipline of the market ensures that the prices charged will be no higher than necessary.
1. See appendix B, note 2, for a description of the position of product director and of the Pricing Policy Committee.
Digitized for FRASER http://fraser.stlouisfed.org/ Federal Reserve Bank of St. Louis

56 Annual Report: Budget Review, 1989-90
Calculation of the PSAF for 1992
In 1991 the Board approved a 1992 private sector adjustment factor of $79.9 million, a decrease of $5.9 million, or 6.8 percent, from the PSAF of $85.8 targeted for 1991.
Asset Base The estimated value of Federal Reserve assets to be used in providing priced
services in 1992 is $6,531.8 million (table C.l). The value of assets assumed to be financed through debt and equity in 1992 is $563.6 million, an increase of $32.9 million, or 6.2 percent, over 1991 (table C.2). This increase results largely from capital expenditures for bank prem-ises planned by the Reserve Banks next year and from an increase in long-term prepayments of equipment maintenance costs.
Table C.l Pro Forma Balance Sheet for Federal Reserve Priced Services, 1991-921
Millions of dollars
Asset or liability 1991 1992
ASSETS
Short-term assets Imputed reserve requirement on clearing balances Investment in marketable securities Receivables2
Materials and supplies2
Prepaid expenses2
Items in process of collection3
Total short-term assets
244.1 1.790.4
32.8 8.2
13.7 3.637.5
Long-term assets Premises23
Furniture and equipment2
Leasehold improvements and long-term prepayments2
Capital leases Total long-term assets
305.3 146.8 23.9
.3
Total assets
LIABILITIES Short-term liabilities Clearing balances and balances arising
from early credit of uncollected items Deferred-credit items Short-term debt4
Total short-term liabilities
2,466.7 3,205.3
54.7
Long-term liabilities Obligations under capital leases Long-term debt4
Total long-term liabilities .
.3 154.8
5,726.7
476.3
6,203.0
5,726.7
155.1
372.0 2.728.0
32.7 5.6
11.2 2.868.1
341.0 139.2 33.9
.1
3,511.4 2,456.7
49.5
.1 170.4
6,017.6
514.2
6^31.8
6,017.6
170.5
Total liabilities
Equity4
Total liabilities and equity
5,881.8
321.2
6,203.0
6,188.1
343.7
6,531.8
1. Data are averages for the year. to priced services of $0.5 million for 1991 and $0.3 2. Financed through the PSAF; other assets are self- million for 1992.
financing. 4. Imputed figures representing the source of financing 3. Includes allocations of Board of Governors' assets for certain priced-service assets.
Digitized for FRASER http://fraser.stlouisfed.org/ Federal Reserve Bank of St. Louis

Special Categories of System Expense 57
Cost of Capital and Taxes and Other Imputed Costs For 1992, a pretax rate of return on equity of 10.7 percent is planned. Other required PSAF recoveries for 1992— imputed sales taxes, imputed FDIC insurance assessment, and Board ex-penses—total $23.5 million, up from
$19.9 million approved for 1991 (table C.2). The decrease in the PSAF of $5.9 million is due primarily to a decrease in the pretax return on equity rate from 14.5 percent in 1991 to 10.7 percent in 1992 attributable to the weaker 1990 financial performance of bank holding companies included in the model relative
Table C.2 Derivation of the Private Sector Adjustment Factor (PSAF), 1991-92 Millions of dollars, except as noted
Item 1991 1992
Assets to be financed1
Short-term Long-term2
Total
PSAF COMPONENTS
Cost of capital (percent)3
Short-term debt Long-term debt Pretax return on equity4 .
Weighted average...
Capital structure (percent) Short-term debt Long-term debt Equity
Total
Tax rate (percent)4.
REQUIRED PSAF RECOVERIES Capital costs5
Short-term debt Long-term debt. Equity
Total
Other costs Sales taxes Assessment for federal deposit insurance Expenses of Board of Governors
Total
Total PSAF recoveries Millions of dollars As a percent of capital .. As a percent of expenses
54.7 476.0 530.7
8.6 9.4
14.5 12.9
10.3 29.2 60.5
100.0
30.5
4.7 14.5 46.7 65.9
8.7 9.2 2.0
19.9
85.8 16.2 14.7
49.5 514.1 563.6
7.9 9.2
10.7 10.2
30.2 61.0
100.0
29.4
3.9 15.7 36.8 56.4
10.2 11.4
1.9 23.5
79.9 14.2 13.2
1. The asset base for priced services is directly determined.
2. Total long-term assets less capital leases that are self-financing.
3. A l l short-term assets are assumed to be financed by short-term debt. Of the total long-term assets, 33 percent are assumed to be financed by long-term debt and 67 percent by equity. The data are average rates paid by the bank holding companies included in the sample.
4. The pretax rate of return on equity is based on average after-tax rates of return on equity, adjusted by the effective tax rate to yield the pretax rate of return on equity for each bank holding company for each year. These data are then averaged over the five years 1986-90 to yield the pretax return on equity for use in the PSAF.
5. The calculations underlying these data use the dollar value of assets to be financed, divided as described in note 3, and the rates for the cost of capital.
Digitized for FRASER http://fraser.stlouisfed.org/ Federal Reserve Bank of St. Louis

58 Annual Report: Budget Review, 1989-90
to the 1985 performance included in the 1991 calculation. The decrease is partially offset by an increase in the asset base and by a rise in the imputed FDIC insurance assessment of $2.2 million resulting from an increase in clearing balances maintained as well as an increase in the FDIC assessment rate.
Capital Outlays In accordance with generally accepted accounting principles (GAAP), the Fed-eral Reserve System depreciates the cost of fixed assets over their estimated useful lives. In the federal government, where no requirement for depreciation ac-counting exists, the cost of fixed assets is typically recorded as an expense at the time of purchase. However, the Policy and Procedures Manual for Guidance of Federal Agencies of the General Accounting Office, which governs accounting procedures in the federal government, specifies in title 2 the use of depreciation accounting for business types of operations and for activities that recover costs from reimbursements or user charges. Certain activities of the Federal Reserve meet both these criteria. Under GAAP, the cost of acquiring an asset that is expected to benefit an entity over future periods should be allocated over those periods. Such treatment allows a more realistic measurement of operating performance.
The Banks capitalize and depreciate all assets that cost $1,500 or more; they can either capitalize or expense assets costing less. The capitalization guideline for the Board is $1,000.
The Banks maintain a multiyear plan for capital spending. The Board, in turn, requires the Banks to budget annually for capital outlays by capital class to estimate the effect of total operating and capital spending. During the budget year, the Banks must submit proposed major
purchases of assets to the Board for further review and approval. The Board of Governors reviews capital expendi-tures for the Board.
Special Projects For 1992 the Board of Governors has approved research and development for three projects intended to provide long-range benefits to the Federal Reserve and the banking industry. Because the spending on such projects is relatively high and short-term, the Federal Reserve accounts for it separately from its operating expenses.
Check Image Processing In 1988, the Conference of First Vice Presidents of the Reserve Banks ap-proved the concept of testing digital technologies to record images for use in processing checks. The application that provided the strictest parameters was archiving information on government check payments for the Department of the Treasury. This application involves storage of a large amount of data and retrieval of high-quality data, require-ments similar to those for processing return items. Consequently, it was decided to explore both applications to determine the feasibility of the technology.
The Check Image Processing special project will continue to build on the first four years of results. The focus during 1992 will be on developmental work in preparation for sustained tests of high-speed image-capture systems for the government check application, continued developmental work on low-speed personal computer-based systems for the return item application, and leadership of efforts to develop industry standards for interchange of check images between Banks (using different systems). The
Digitized for FRASER http://fraser.stlouisfed.org/ Federal Reserve Bank of St. Louis

Special Categories of System Expense 59
1992 budget for these efforts is $4.3 million. Including 1992 expenses, Sys-tem expenditures on Check Image Processing to date total $13.6 million.
Development of Currency Authentication Systems In 1989, the Federal Reserve initiated a special project for development of an Optical Counterfeit Detection System (OCDS). Later that year the project was renamed Development of Currency Authentication Systems because research efforts included development not only of an OCDS, but also of other authen-tication alternatives.
OCDS is an effort to improve counterfeit-detection capabilities that will enhance the currency service provided to financial institutions and the public. Other activities include development of both long- and short-term authentication alternatives that are expected to improve the Federal Reserve's ability to detect counterfeit currency. All these efforts should produce counterfeit detector de-vices to be placed on the Federal Re-serve's high-speed currency-processing equipment.
The 1992 project budget includes $9.3 million in support of these efforts. Including 1992 expenses, expenditures on this special project to date total $15.8 million.
Automation Consolidation
In 1992, the Federal Reserve System will incur its first expenditures for the Automation Consolidation special project. The project wil l result in consolidation of all mainframe computer operations at three sites within the System. The three sites, selected in late 1991, are Richmond, Dallas, and New York. The 1992 project budget of $6.5 million covers staffing of the project
team and development of a detailed plan for achieving a consolidated automation environment within the Federal Reserve System.
Currency Printing The Bureau of Engraving and Printing produces currency; the Federal Reserve Banks put it into circulation through depository institutions and destroy it as it wears out. The Federal Reserve Act stipulates that the costs of producing currency, as well as the costs of putting it into circulation and destroying it, are to be assumed by the Federal Reserve System (table C.3).
New currency is printed to replace worn notes and to accommodate increases in the demand for circulating currency (table C.4). Notes are also required for inventories held by the Reserve Banks to meet changes in demand.
To minimize the number of new notes ordered and the cost of their printing, the Board consults with the Bureau of Engraving and Printing to ensure that it uses efficient methods, maintains System
Table C.3 Currency in Circulation, New Notes Issued, and Notes Destroyed, 1991 Estimate Millions of pieces
Dollar denomination
Notes in
circulation1
New notes paid out2
Notes destroyed2
1 4,928 3,209 2,818 2 432 18 3 5 1,194 779 751
10 1,184 733 695 20 3,301 1,682 1,431 50 677 175 140
100 1,506 417 223
Total 13,222 7,013 6,061
1. As of September 1991. 2. Based on actual levels through October and expected
levels for November and December. Notes paid out do not include additions to inventory at the Reserve Banks.
Digitized for FRASER http://fraser.stlouisfed.org/ Federal Reserve Bank of St. Louis

60 Annual Report: Budget Review, 1989-90
guidelines on the quality of notes, and sees that Reserve Banks do not destroy notes prematurely. The Board and the
Banks also monitor all related costs, such as those for transportation and packaging.
Table C.4 Costs to the Federal Reserve of New Currency, 1990-92 Millions of dollars, except as noted
Item 1990 actual
1991 estimated
1992 budget
Percent change, 1991-92
Printing1 185.7 253.3 317.0 25.1 Shipping from Washington and western facility 5.3 5.2 6.8 30.8 Reimbursement to the Treasury
for issuance and retirement2 1.9 1.7 2.0 17.6
Total cost of currency 192.9 260.2 325.8 25.2
1. Based on 7 billion notes in 1990, 8 billion notes in 1991, and 9 billion notes in 1992. 2. Includes intrasystem shipment of fit currency, purchase of currency pallets, and ship-
ment of currency pallets to the Bureau of Engraving and Printing.
Digitized for FRASER http://fraser.stlouisfed.org/ Federal Reserve Bank of St. Louis

61
Appendix D
Sources and Uses of Funds
The Federal Reserve System, in accor-dance with generally accepted account-ing principles, accrues income and expenses and capitalizes acquisitions of assets whose useful lives extend over several years (see appendix C).
The System derives its income pri-marily from U.S. government securities that the Federal Reserve has acquired through open market operations, one of the tools of monetary policy. These earnings account for approximately 85 percent of current income (table D.l).
The current expenses of the Reserve Banks consist of their operating expenses and the costs of the earnings credits
Table D.l Income of the Federal Reserve System, 1990-91 Millions of dollars
Source 1990 actual
1991 estimate
117.9 25.6 19.994.5 19,262.3 2,603.9 2,498.9
730.2 737.3 30.1 27.2
23.476.6 22,551.3
U.S. government securities Foreign currencies Priced services Other
117.9 25.6 19.994.5 19,262.3 2,603.9 2,498.9
730.2 737.3 30.1 27.2
23.476.6 22,551.3 Total
117.9 25.6 19.994.5 19,262.3 2,603.9 2,498.9
730.2 737.3 30.1 27.2
23.476.6 22,551.3
117.9 25.6 19.994.5 19,262.3 2,603.9 2,498.9
730.2 737.3 30.1 27.2
23.476.6 22,551.3
granted to depository institutions on clearing balances held with the Reserve Banks (table D.2). The Reserve Banks record extraordinary adjustments to current net income in a profit and loss account. The primary entries in the account are for gains or losses on the sale of U.S. government securities and for gains or losses on assets denominated in foreign currencies that result either from the sale of those assets or from their revaluation at market exchange rates.
The Reserve Banks retain a surplus to cushion unexpected losses, much as commercial establishments retain earn-ings. The Board of Governors requires that the surplus account at year-end be equal to the capital paid in by the member banks. Since the end of 1964, the Board's policy has been to transfer to the U.S. Treasury all net income after paying the statutory dividend to member banks and the amount necessary to equate surplus to paid-in capital. The amount transferred is classified as interest on Federal Reserve notes. Such payments were $23.6 billion in 1990 and are estimated to be $20.8 billion in 1991.
Digitized for FRASER http://fraser.stlouisfed.org/ Federal Reserve Bank of St. Louis

62 Annual Report: Budget Review, 1989-90
Table D.2 Distribution of the Income of the Federal Reserve System, 1990-91 Millions of dollars
Item 1990 actual
1991 estimate
Current income1
LESS Current expenses of Reserve Banks2
Operating expenses Costs of earnings credits
EQUALS Current net income
PLUS Net additions to, or deductions from (-), current net income3
LESS Cost of unreimbursed Treasury services4
Assessments by Board Board expenses Cost of currency
Other distributions Dividends paid to member banks 5 . Transfers to, or from (-), surplus6
EQUALS Payment to U.S. Treasury
23,477
1,211 139
22,127
2,201
102
104 193
141 180
23,608
22,551
1,268 160
21,124
496
91
110 261
153 228
20,778
1. See table D.l. 2. Net of reimbursements due from the U.S. Treasury
and other government agencies. Also reflects reductions of $60.5 million in 1990 and $83.1 million in 1991 in credits for net periodic pension cost.
3. This account is the same as that reported under the same name in the table "Income and Expenses of Federal Reserve Banks" in the Statistical Tables section of the Board's Annual Report and includes realized and unrealized gains on assets denominated in foreign cur-rencies; gains on sales of U.S. government securities; and miscellaneous gains and losses.
4. The cost of services provided to the U.S. Treasury that are reimbursable under agreements with the Treasury and for which reimbursement is not anticipated.
5. The Federal Reserve Act requires the Federal Reserve to pay dividends to member banks at the rate of 6 percent of paid-in capital.
6. Each year the Federal Reserve transfers to its surplus account an amount sufficient to equate surplus to paid-in capital to provide a reserve against losses.
Digitized for FRASER http://fraser.stlouisfed.org/ Federal Reserve Bank of St. Louis

63
Appendix E
Federal Reserve System Audits
The Board of Governors, each of the Reserve Banks taken separately, and the Federal Reserve System as a whole are all subject to several levels of audit and review. At each Federal Reserve Bank, a full-time staff of auditors under the direction of a general auditor reports directly to the Bank's board of directors. The Board's Division of Federal Re-serve Bank Operations, acting on behalf of the Board of Governors, regularly audits the financial operations of each of the Banks and periodically reviews all other Bank operations. The Office of Inspector General (OIG) conducts audits, operations reviews, and investi-gations of the programs and operations of the Board and those Board functions delegated to the Federal Reserve Banks. The OIG retains an independent auditor each year to certify the fairness of the Board's financial statements and its
compliance with laws and regulations affecting those financial statements.
General Accounting Office The 1978 passage of the Federal Bank-ing Agency Audit Act (Public Law 95-320) brought most of the operations of the Federal Reserve System under the purview of the General Accounting Office (GAO). The GAO, which cur-rently has 25 projects in various stages of completion, since 1979 has com-pleted 93 reports on selected aspects of Federal Reserve operations (tables E.l and E.2). The GAO has also involved the Federal Reserve in about 68 other reviews not directly related to the Sys-tem and has terminated 39 others before completion. The reports are available directly from the GAO.
Table E.l Active GAO Projects Relating to the Federal Reserve
Subject
Fraud backlog cases Anticompetitive service contracts Capital adequacy standards for securities brokers-dealers Foreign affiliates of U.S. brokers-dealers Federal tax deposit system Collecting and disseminating thrift and bank call report data Criminal cases from financial-institution fraud Debt crisis in less-developed countries Comparability of compensation and benefits of federal regulatory agencies . Information on securities and futures activities exchanged between countries Supervision and examination processes Use of automation in clearance and setdement process Foreign business structures that impede competition Financing of multifamily housing Future banking-industry consolidation Banking supervision and regulation in Canada Personnel management evaluation program Activities of Credit and Commerce American Holdings Bank-failure resolutions Preparation and dissemination of the Federal Register Joint Lending Program Off-balance-sheet activities Regulator oversight of bank automation systems Export-credit abuse Insider activity at banks
Digitized for FRASER http://fraser.stlouisfed.org/ Federal Reserve Bank of St. Louis

64 Annual Report: Budget Review, 1989-90
Table E.2 Completed GAO Reports Relating to the Federal Reserve System
Report Number Date
Comparing Policies and Procedures of the Three Bank Regulatory Agencies
Are OPEC Financial Holdings a Danger to U.S. Banks or the Economy? Federal Systems Not Designed to Collect Data on Al l Foreign
Investments in U.S. Depository Institutions Considerable Increase in Foreign Banking in United States since 1972 Investment Policies, Practices and Performance
of Federal Retirement Systems
Federal Supervision of Bank Holding Companies Needs Better, More Formalized Supervision
The Federal Reserve Should Assure Compliance with the 1970 Bank Holding Company Act Amendments
Federal Agencies' Initial Problems with the Right to Financial Privacy Act of 1978
Internal Auditing Can Be Strengthened in the Federal Reserve System . Despite Positive Effects, Further Foreign Acquisitions of U.S. Banks
Should Be Limited until Policy Conflicts Are Fully Addressed
Federal Examinations of Financial Institutions: Issues That Need to Be Resolved
Examinations of Financial Institutions Do Not Assure Compliance with Consumer Credit Laws
Disappointing Progress in Improving Systems for Resolving Billions in Audit Findings
An Economic Overview of Bank Solvency Regulation Federal Reserve Security over Currency Transportation Is Adequate The Federal Structure for Examining Financial Institutions
Can Be Improved Response to Questions Bearing on the Feasibility
of Closing the Federal Reserve Banks Bank Secrecy Act Reporting Requirements Have Not Met
Expectations, Suggesting Need for Amendment Federal Reserve Could Improve the Efficiency of Bank Holding
Company Inspections Financial Institution Regulatory Agencies Should Perform Internal Audit
Reviews of their Examination and Supervision Activities
Information on Selected Aspects of Federal Reserve System Expenditures Federal Review of Intrastate Branching Can Be Reduced Despite Improvements, Recent Bank Supervision Could
Be More Effective and Less Burdensome Issues to Be Considered while Debating Interstate Bank Branching The Federal Reserve Should Move Faster to Eliminate Subsidy
of Check-Clearing Operations Information about Depository Institutions' Ancillary Activities Is Not
Adequate for Policy Purposes Bank Merger Process Should Be Modernized and Simplified An Analysis of Fiscal and Monetary Policies Bank Examination for Country Risk and International Lending Credit Insurance Disclosure Provisions of the Truth-in-Lending Act
Consistently Enforced Except When Decisions Appealed
Survey of Investor Protection and the Regulation of Financial Intermediaries
Financial Institutions Regulatory Agencies Can Make Better Use of Consumer Complaint Information
Expediting Tax Deposits Can Increase the Government's Interest Earnings
Unauthorized Disclosure of the Federal Reserve's Monetary Policy Decision
Federal Financial Institutions Examination Council Has Made Limited Progress toward Accomplishing Its Mission
Control Improvements Needed in Accounting for Treasury Securities at the Federal Reserve Bank of New York
Statutory Requirements for Examining International Banking Institutions Need Attention
GGD-79-27 EMD-79-45
GGD-79-42 GGD-79-75
FPCD-79-17
GGD-80-20
GGD-80-21
GGD-80-64 GGD-80-59
GGD-80-66
GGD-81-12
GGD-81-13
AFMD-81-27 PAD-81-25 GGD-81-27
GGD-81-21
GGD-81-49
GGD-81-80
GGD-81-79
GGD-82-5
GGD-82-33 GGD-82-31
GGD-82-21 GGD-82-36
GGD-82-22
GGD-82-57 GGD-82-53 PAD-82-45
ID-82-52
GGD-83-3
GGD-83-30
GGD-83-13
GGD-84-14
GGD-84-40
GGD-84-4
AFMD-84-10
GGD-84-39
3/29/79 6/11/79
6/19/79 8/1/79
8/31/79
2/12/80
3/12/80
5/29/80 8/8/80
8/26/80
1/6/81
1/21/81
1/23/81 2/13/81 2/23/81
4/24/81
5/21/81
7/23/81
8/18/81
10/19/81
2/12/82 2/24/82
2/26/82 4/9/82
5/7/82
6/1/82 8/16/82 8/31/82
9/2/82
10/25/82
7/13/83
8/25/83
11/21/83
2/3/84
2/3/84
5/2/84
7/11/84
Digitized for FRASER http://fraser.stlouisfed.org/ Federal Reserve Bank of St. Louis

Federal Reserve System Audits 65
Table E.2 Continued
Report Number Date
Supervisory Examinations of International Banking Facilities Need to Be Improved GGD-84-65 9/30/84
An Examination of Concerns Expressed about the Federal Reserve's Pricing of Check-Clearing Activities GGD-85-9A 1/14/85
Difficulties in Evaluating the Effectiveness of the Community Reinvestment Act OCE-86-1 11/4/85
International Coordination of Bank Supervision: The Record to Date . . . NSIAD-86-40 2/6/86 Implementation of the Export Trading Company Act of 1982 NSIAD-86-42 2/27/86 Information on Independent Public Accountant Audits
of Financial Institutions GGD-84-44FS 4/21/86 An Analysis of Two Types of Pooled Investment Funds GGD-86-63 5/12/86 How the Markets Are Developed and How They Are Regulated GGD-86-26 5/15/86 U.S. Banking Supervision and International Supervisory Principles NSIAD-86-93 7/25/86 Financial Institution Regulators' Compliance Examination GGD-86-94 8/1/86 The Market's Structure, Risks, and Regulation GGD-86-80BR 8/20/86 Dealer Views on Market Operations and Federal Reserve
Securities Transfer System GGD-86-147FS 9/29/86 Questions about the Federal Reserve's Securities Transfer System GGD-87-15BR 10/20/86
Federal Reserve Board Opposition to Credit Card Interest Rate Limits . GGD-87-38BR 4/7/87 Insulating Banks from the Potential Risk of Expanded Activities GGD-87-35 4/14/87 The Federal Reserve Response Regarding Its Market-Making Standard . GGD-87-55FS 4/21/87 Change in Fees and Deposit Account Interest Rates since Deregulation . GGD-87-70 7/13/87 An Examination of Views Expressed about Access to Brokers' Services . GGD-88-8 12/18/87
Issues Related to Repeal of the Glass-Steagall Act GGD-88-37 1/22/88 Preliminary Observations on the October 1987 Crash GGD-88-38 1/26/88 Supervision of Overseas Lending Is Inadequate NSIAD-88-87 5/5/88 Competitive Concerns of Foreign Financial Firms in Japan,
the United Kingdom and the United States NSIAD-88-171 6/2/88 Administrative Expenses at FHLBB and FRB for 1985 and 1986 AFMD-88-33 6/15/88 Government in the Sunshine Act Compliance at Selected Agencies GGD-88-97 7/20/88 Trends in Commercial Bank Performance, December 1976-June 1987 .. GGD-88-106BR 7/28/88 U.S. Commercial Banks' Securities Activities in London NSIAD-88-238 9/8/88 Lending to Troubled Sectors GGD-88-126BR 9/26/88 Government Check-Cashing Issues GGD-89-12 10/7/88
Conflict of Interest: Abuses in Commercial Banking Institutions GGD-89-35 1/27/89 Competitive Fairness Is an Elusive Goal GGD-89-61 5/12/89 Independent Audits Needed to Strengthen Internal Control
and Bank Management AFMD-89-25 5/31/89 Information on the System's Check Collection Service GGD-90-17 12/15/89
Oversight of Critical Banking Systems Should Be Strengthened IMTEC-90-14 1/14/90 Activities of Securities of Bank Holding Companies GGD-90-48 3/14/90 The Stock, Options, and Futures Markets Are Still at Risk GGD-90-33 4/11/90 Update on U.S. Commercial Banks' Securities in London NSIAD-90-98 5/7/90 U.S. Financial Services' Competitiveness under the Single
Market Program NSIAD-90-99 5/21/90 Limited Public Demand for New Dollar Coin or Elimination of Pennies . GGD-90-88 5/23/90 Oversight of Automation Used to Clear and Settle Trades Is Uneven . . . IMTEC-90-47 7/12/90 The Government's Exposure to Risks GGD-90-97 8/15/90 Office of Inspector General Operations at Financial Regulatory Agencies . AFMD-90-55FS 8/24/90 Additional Reserves and Reform Needed to Strengthen the Fund AFMD-90-100 9/11/90 More Transaction Information and Investor Protection Measures
Are Needed GGD-90-114 9/14/90 Issues Relating to Banks Selling Insurance GGD-90-113 9/25/90
Implementation of Risk-Based Capital Adequacy Standards NSIAD-91-80 1/25/91 Overview of Six Foreign Systems NSIAD-91-104 2/22/91 Deposit Insurance: A Strategy for Reform GGD-92-26 3/4/91 Bank Supervision: Prompt and Forceful Regulatory Actions Needed GGD-91-69 4/15/91
Digitized for FRASER http://fraser.stlouisfed.org/ Federal Reserve Bank of St. Louis

66 Annual Report: Budget Review, 1989-90
Table E.2 Continued
Report Number Date
Many Federal Agencies Collect and Disseminate Information NSIAD-91-173 5/1/91 Money Laundering: The U.S. Government Is Responding to the Problem . NSIAD-91-130 5/16/91 A Framework for Limiting the Government's Exposure to Risks GGD-91-90 5/22/91 Treasury Tax and Loan Activity at Two Troubled Banks AFMD-91-87 9/12/91 OCC's Supervision of the Bank of New England
Was Not Timely or Forceful GGD-91-128 9/16/91 Bank Holding Company Securities Subsidiaries' Market
Activities Update GGD-91-131 9/20/91 Time Limits on Holding Deposits Generally Met
but More Oversight Needed GGD-91-132 9/30/91 Legislation Needed to Strengthen Bank Oversight AFMD-92-19 10/21/91
Office of Inspector General The Board's Office of Inspector General functions in accordance with the Inspec-tor General Act of 1978, as amended. The OIG provides policy direction for audits, operations reviews, and investiga-tions of the programs and operations of the Board and its delegated functions at the Federal Reserve Banks, and plans and conducts them. The OIG also re-views existing and proposed legislation and regulations for economy and effi-ciency. It recommends policies and super-vises and conducts activities that promote economy and efficiency and that prevent and detect waste, fraud, and abuse in Board and Board-delegated programs and operations. In addition, it coor-dinates its efforts with other govern-mental and nongovernmental agencies to promote economy and efficiency and to detect and prevent fraud and abuse in activities administered or financed by the Board. The OIG keeps the Congress and the Chairman of the Board fully informed about serious abuses and defi-ciencies and about the status of any corrective actions.
During 1991, the OIG reported on eight audits and three operations reviews, closed out thirteen investigations, and conducted 1,283 legislative and regu-latory reviews. Audit reports issued
during 1991 addressed the Board's National Information Center develop-ment project; its portable personal computer equipment loaner programs; its revised compensation programs for officers and for wage and printer grade staff; the fairness of the financial statements of the Board and the Federal Financial Institutions Examination Coun-cil, and each agency's compliance with applicable laws and regulations; the Board portion of the System's thrift plan financial audit statement; and the Board portion of a specific health benefit plan audit being conducted across a number of agencies by the Office of Personnel Management. Operations review reports were issued on the Divisions of Monetary Affairs, Research and Statistics, and International Finance. An audit survey of the Federal Reserve's commercial disk examination program also was conducted. •
Digitized for FRASER http://fraser.stlouisfed.org/ Federal Reserve Bank of St. Louis

67
Appendix F
Expenses and Employment at the Federal Reserve Banks
Table F.l Operating Expenses of the Federal Reserve Banks, by District, 1991-921
Thousands of dollars, except as noted
District 1991 1992 Change District estimate budget Amount Percent
Boston 88,049 92,730 4,682 5.3 New York 297,157 324,552 27,394 9.2 Philadelphia 82,387 88,390 6,003 7.3 Cleveland 87,847 91,022 3,175 3.6 Richmond 117,136 123,212 6,077 5.2 Atlanta 142,623 151,952 9,329 6.5 Chicago 170,565 181,205 10,640 6.2 St. Louis 68,970 72,177 3,207 4.7 Minneapolis 73,4452 74,049 604 .8 Kansas City 97,698 101,070 3,372 3.5 Dallas 98,685 111,420 12,735 12.9 San Francisco 177,021 184,626 7,605 4.3
Total, all Districts 1,501,582 1,596,405 94,823 6.3
Special projects 6,840 20,076 13,236
Total 1,508,422 1,616,481 108,059 7.2
1. Excludes capital outlays. 2. Includes $2.9 million for water damage to the computer site. Without these expenses
in 1991, Minneapolis' 1992 budget increase would have been 5.0 percent.
Table R2 Employment at the Federal Reserve Banks, by District, 1991-92 Average number of personnel, except as noted1
District 1991 1992 Change District estimate budget Amount Percent
Boston 1,481 1,476 -5 -.3 New York 4,122 4,177 55 1.3 Philadelphia 1,384 1,402 19 1.4 Cleveland 1,470 1,438 -32 -2.2 Richmond 2,083 2,075 -7 -.3 Atlanta 2,378 2,433 55 2.3 Chicago 2,611 2,643 32 1.2 St. Louis 1,210 1,200 -10 -.8 Minneapolis 1,114 1,117 2 .2 Kansas City 1,683 1,626 -57 -3.4 Dallas 1,703 1,718 15 .9 San Francisco 2,592 2,565 -27 -1.0
Total, all Districts 23,831 23,871 40 .2
Special projects 2 102 100
Total 23,833 23,973 140 .6
1. See chapter 3, note 1, for definition of average number of personnel (ANP). Digitized for FRASER http://fraser.stlouisfed.org/ Federal Reserve Bank of St. Louis
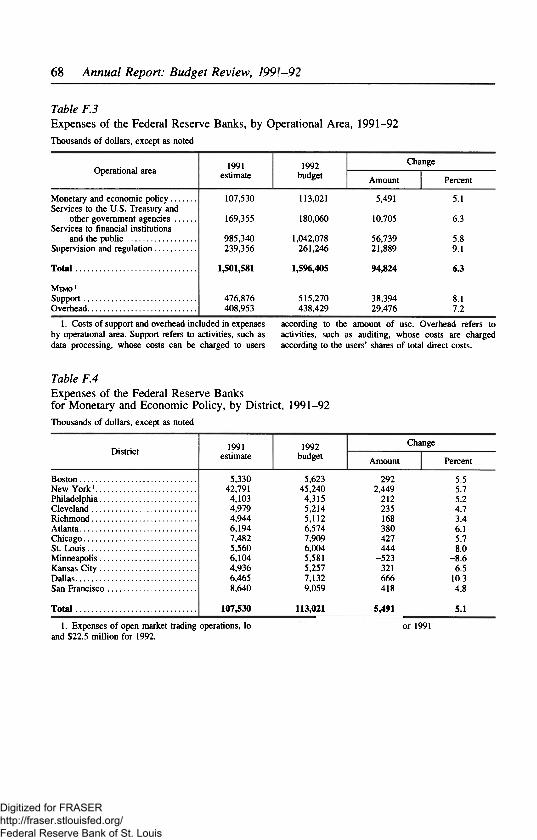
68 Annual Report: Budget Review, 1989-90
Table F.3 Expenses of the Federal Reserve Banks, by Operational Area, 1991-92 Thousands of dollars, except as noted
Operational area 1991 estimate
1992 budget
Change Operational area 1991
estimate 1992
budget Amount Percent
Monetary and economic policy 107,530 113,021 5,491 5.1 Services to the U.S. Treasury and
other government agencies 169,355 180,060 10,705 6.3 Services to financial institutions
and the public 985,340 1,042,078 56,739 5.8 Supervision and regulation 239,356 261,246 21,889 9.1
Total 1,501,581 1,596,405 94,824 6.3
MEMO 1
Support 476,876 515,270 38,394 8.1 Overhead 408,953 438,429 29,476 7.2
1. Costs of support and overhead included in expenses according to the amount of use. Overhead refers to by operational area. Support refers to activities, such as activities, such as auditing, whose costs are charged data processing, whose costs can be charged to users according to the users' shares of total direct costs.
Table F.4 Expenses of the Federal Reserve Banks for Monetary and Economic Policy, by District, 1991-92 Thousands of dollars, except as noted
District 1991 1992 Change District estimate budget Amount Percent
Boston 5,330 5,623 292 5.5 New York1 42,791 45,240 2,449 5.7 Philadelphia 4,103 4,315 212 5.2 Cleveland 4,979 5,214 235 4.7 Richmond 4,944 5,112 168 3.4 Atlanta 6,194 6,574 380 6.1 Chicago 7,482 7,909 427 5.7 St. Louis 5,560 6,004 444 8.0 Minneapolis 6,104 5,581 -523 -8.6 Kansas City 4,936 5,257 321 6.5 Dallas 6,465 7,132 666 10.3 San Francisco 8,640 9,059 418 4.8
Total 107,530 113,021 5,491 5.1
1. Expenses of open market trading operations, located in the District, are $21.3 million for 1991 and $22.5 million for 1992.
Digitized for FRASER http://fraser.stlouisfed.org/ Federal Reserve Bank of St. Louis

Expenses and Employment 69
Table F.5 Expenses of the Federal Reserve Banks for Services to the U.S. Treasury and Other Government Agencies, by District, 1991-92 Thousands of dollars, except as noted
District 1991 1992 Change District estimate budget Amount Percent
Boston 8,617 9,354 736 8.5 New York 36,175 38,678 2,503 6.9 Philadelphia 18,331 19,936 1,605 8.8 Cleveland 13,371 13,363 -8 - .1 Richmond 10,439 10,985 546 5.2 Atlanta 13,885 15,215 1,330 9.6 Chicago 18,552 20,116 1,564 8.4 St. Louis 8,708 8,858 150 1.7 Minneapolis 6,466 6,912 446 6.9 Kansas City 10,925 11,309 384 3.5 Dallas 8,891 10,574 1,593 17.7 San Francisco 14,906 14,760 -146 -1.0
Total 169355 180,060 10,705 63
Table F.6 Expenses of the Federal Reserve Banks for Services to Financial Institutions and the Public, by District, 1991-92 Thousands of dollars, except as noted
District 1991 1992 Change District estimate budget Amount Percent
Boston 62,355 65,019 2,664 4.3 New York 162,466 180,155 17,689 10.9 Philadelphia 47,993 50,818 2,825 5.9 Cleveland 58,109 60,192 2,082 3.6 Richmond 87,858 91,652 3,794 4.3 Atlanta 104,121 109,741 5,619 5.4 Chicago 113,183 119,033 5,850 5.2 St. Louis 45,080 46,711 1,631 3.6 Minneapolis 48,615 48,404 -211 - .4 Kansas City 61,688 63,290 1,602 2.6 Dallas 64,815 72,361 7,545 11.6 San Francisco 129,058 134,704 5,647 4.4
Total 985340 1,042,078 56,739 5.8
Digitized for FRASER http://fraser.stlouisfed.org/ Federal Reserve Bank of St. Louis

70 Annual Report: Budget Review, 1989-90
Table F.7 Expenses of the Federal Reserve Banks for Supervision and Regulation, by District, 1991-92 Thousands of dollars, except as noted
District 1991 estimate
1992 budget
Change District 1991
estimate 1992
budget Amount Percent
Boston 11,746 12,735 989 8.4 New York 55,726 60,478 4,753 8.5 Philadelphia 11,960 13,321 1,362 11.4 Cleveland 11,388 12,253 865 7.6 Richmond 13,895 15,463 1,568 11.3 Atlanta 18,424 20,423 2,000 10.9 Chicago 31,347 34,146 2,799 8.9 St. Louis 9,622 10,604 982 10.2 Minneapolis 12,260 13,152 891 7.3 Kansas City 20,149 21,214 1,065 5.3 Dallas 18,423 21,353 2,930 15.9 San Francisco 24,417 26,103 1,686 6.9
Total 239356 261,246 21,889 9.1
Table F.8 Expenses of the Federal Reserve Banks for Salaries of Officers and Employees, by District, 1991-92 Thousands of dollars, except as noted
District 1991 1992 Change District estimate budget Amount Percent
Boston 50,749 53,566 2,817 5.6 New York 155,516 168,056 12,539 8.1 Philadelphia 42,755 45,433 2,678 6.3 Cleveland 43,654 45,284 1,631 3.7 Richmond 60,379 63,967 3,587 5.9 Atlanta 69,941 75,252 5,312 7.6 Chicago 84,852 90,361 5,509 6.5 St. Louis 35,000 36,889 1,888 5.4 Minneapolis 34,909 37,209 2,300 6.6 Kansas City 51,896 53,387 1,491 2.9 Dallas 52,766 55,762 2,996 5.7 San Francisco 91,837 95,707 3,870 4.2
Total 774,254 820,871 46,618 6.0
Digitized for FRASER http://fraser.stlouisfed.org/ Federal Reserve Bank of St. Louis

Expenses and Employment 71
Table F.9 Factors in the 1991-92 Change in Salaries of Officers and Employees of the Federal Reserve Banks, by District Percentage points
District Merit
adjust-ment
Structure adjust-ment
Promotion and reclassi-
fication Change in
staffing Tumovei and lag1 Overtime Other Total
change
Boston 4.2 .0 1.3 .0 .0 -.1 .2 5.6 New York 5.0 .3 1.3 2.0 -.8 .1 .2 8.1 Philadelphia 4.5 .4 .4 1.9 -.5 -.5 .0 6.3 Cleveland 4.5 .1 .3 -.4 -.8 - .1 .0 3.7 Richmond 5.0 .0 1.4 2.0 -2.3 -.2 .1 5.9 Atlanta 5.1 .2 .8 2.2 -.6 -.2 .0 7.6 Chicago 4.9 .0 1.6 .9 -.7 -.3 .1 6.5 St. Louis 4.9 .1 .6 .0 - .1 - .1 .1 5.4 Minneapolis 4.7 .4 .7 1.0 -.5 - .1 .4 6.6 Kansas City 5.0 .3 1.4 -2.6 -1.1 - .1 .0 2.9 Dallas 4.8 .1 .5 1.0 -.9 .1 .0 5.7 San Francisco 4.5 .7 .5 -.6 -.8 .0 .0 4.2
Total 4.8 .2 1.0 .8 - .8 - .1 .1 6.0
1. Turnover is the replacement of a departing employee with one having a lower pay grade. Lag is the time during which a position remains vacant.
Table F.10 Capital Outlays of the Federal Reserve Banks, by District, 1991-92 Thousands of dollars, except as noted
District 1991 1992 Change District estimate budget Amount Percent
Boston 9,044 10,348 1,303 14.4 New York 78,773 77,450 -1,323 -1.7 Philadelphia 6,456 10,063 3,607 55.9 Cleveland 11,092 11,502 410 3.7 Richmond 16,475 11,997 -4,477 -27.2 Atlanta 9,771 19,402 9,630 98.6 Chicago 19,539 23,472 3,933 20.1 St. Louis 7,125 7,151 26 .4 Minneapolis 8,293 15,778 7,485 90.3 Kansas City 5,129 9,148 4,019 78.4 Dallas 92,837 37,386 -55,451 -59.7 San Francisco 18,543 25,415 6,872 37.1
Total 283,076 259,112 -23,964 -8.5
Digitized for FRASER http://fraser.stlouisfed.org/ Federal Reserve Bank of St. Louis

72 Annual Report: Budget Review, 1989-90
Table F.ll Budget Performance of the Federal Reserve Banks, Operating Expenses, by District, 1991 Thousands of dollars, except as noted
District 1991 budget
1991 estimate
Change District 1991
budget 1991
estimate Amount Percent
Boston 88,742 88,049 -693 -.8 New York 296,931 297,157 226 .1 Philadelphia 82,398 82,387 -11 .0 Cleveland 87,956 87,847 -108 -.1 Richmond 116,644 117,136 492 .4 Atlanta 143,128 142,623 -505 -.4 Chicago 171,018 170,565 —453 -.3 St. Louis 69,261 68,970 -291 -.4 Minneapolis 70,520 73,445 2,925 4.1 Kansas City 97,753 97,698 -55 - .1 Dallas 98,680 98,685 6 .0 San Francisco 177,935 177,021 -915 -.5
Total 1,500,965 1,501,582 618 .0
Table ¥.12 Budget Performance of the Federal Reserve Banks, Employment, by District, 1991 Average number of personnel, except as noted1
District 1991 budget
1991 estimate
Change District 1991
budget 1991
estimate Amount Percent
Boston 1,485 1,481 -A -.3 New York 4,080 4,122 42 1.0 Philadelphia 1,366 1,384 17 1.3 Cleveland 1,499 1,470 -28 -1.9 Richmond 2,073 2,083 9 .4 Atlanta 2,387 2,378 -9 -.4 Chicago 2,628 2,611 -17 -.7 St. Louis 1,222 1,210 -12 -1.0 Minneapolis 1,099 1,114 15 1.4 Kansas City 1,697 1,683 -14 -.8 Dallas 1,714 1,703 -11 - .6 San Francisco 2,611 2,592 -19 -.7
Total 23,861 23,831 -30 - .1
1. See chapter 3, note 1, for definition of average number of personnel.
Digitized for FRASER http://fraser.stlouisfed.org/ Federal Reserve Bank of St. Louis

Expenses and Employment 73
Table F.13 Expenses of the Federal Reserve Banks, by Operational Area, 1987-92 Thousands of dollars, except as noted
Year Monetary
and economic
policy
Services to the U.S. Treasury and other
government agencies
Services to financial
institutions and the public
Supervision and
regulation Total
1987 86,484 135,693 799,227 170,428 1,191,832 1988 87,283 141,524 848,481 185,090 1,262,379 1989 93,553 145,547 916,310 195,076 1,350,487 1990 98,973 156,934 938,862 211,884 1,406,652 1991 estimate 107,530 169,355 985,340 239,356 1,501,581 1992 budget 113,021 180,060 1,042,078 261,246 1,596,405
MEMO Average annual
change, percent 5.5 5.8 5.4 8.9 5.9
Table F.l 4 Employment at the Federal Reserve Banks, by Operational Area, 1987-92 Average number of personnel, except as noted1
Year Monetary
and economic
policy
Services to the U.S. Treasury and other
government agencies
Services to financial
institutions and the public
Supervision and
regulation Support2 Overhead2 Total
1987 776 1,837 8,776 2,148 4,452 5,025 23,013 1988 766 1,819 9,033 2,209 4,562 4,952 23,340 1989 783 1,771 9,423 2,198 4,552 4,948 23,674 1990 773 1,816 9,214 2,217 4,533 4,941 23,496 1991 estimate 791 1,909 9,121 2,378 4,658 4,974 23,831 1992 budget 794 1,902 8,974 2,477 4,730 4,995 23,871
MEMO Average annual
change, percent .5 .7 .4 2.9 1.2 .0 .7
1. See chapter 3, note 1, for definition of average number of personnel. 2. See table F.3, note 1, for definition.
Digitized for FRASER http://fraser.stlouisfed.org/ Federal Reserve Bank of St. Louis

74 Annual Report: Budget Review, 1989-90
Maps of the Federal Reserve System
12
9 1 MINNEAPOLIS • ^ BOSTON
C H I C A G O • • ^ " N E W Y O R K
I SAN FRANCISCO „ „ CLEVELAND U • PHILADELPHIA 10 4 •
KANSAS C I T Y B • •
11 • DALLAS
ST. LOUIS RICHMOND
ATLANTA
HAWAII
L E G E N D
Both pages
• Federal Reserve Bank city
• Board of Governors of the Federal Reserve System, Washington, D.C.
Facing page
• Federal Reserve Branch city
— Branch boundary
N O T E
The Federal Reserve officially identifies Districts by number and Reserve Bank city (shown on both pages) and by letter (shown on the facing page).
In the 12th District, the Seattle Branch serves Alaska, and the San Francisco Bank serves Hawaii.
The System serves commonwealths and territories as follows: the New York
Bank serves the Commonwealth of Puerto Rico and the U.S. Virgin Islands; the San Francisco Bank serves American Samoa, Guam, and the Commonwealth of the Northern Mariana Islands. The maps show the boundaries within the System as of October 1990.
Digitized for FRASER http://fraser.stlouisfed.org/ Federal Reserve Bank of St. Louis

Maps of the Federal Reserve System 75
5 - E Balt imore Pittsburgh
Cincinnati Buffalo
NEW YORK CLEVELAND RICHMOND PHILADELPHIA BOSTON
• Nashville
Birmingham.
Louisville Detroit •
Jacksonville • Memphis New Orleans
Miami CHICAGO ST. LOUIS ATLANTA
• Helena
MINNEAPOLIS
Omaha* ALASKA
Denver Seattle
Portland Oklahoma City
KANSAS CITY
Houston
San Antonio i HAWAII
DALLAS SAN FRANCISCO
Digitized for FRASER http://fraser.stlouisfed.org/ Federal Reserve Bank of St. Louis

FRB 1/1-2000-0292-C
Digitized for FRASER http://fraser.stlouisfed.org/ Federal Reserve Bank of St. Louis