Embed Size (px)
Citation preview
ARC Resources Ltd.2017 Investor Day
November 13, 2017

Agenda
8:00 – 8:05 am Welcome
Bevin Wirzba, Senior Vice President, Business Development and Capital Markets
8:05 – 8:25 am Built to Last
Terry Anderson, Senior Vice President and Chief Operating Officer
Van Dafoe, Senior Vice President and Chief Financial Officer
Lisa Olsen, Vice President, Human Resources
Myron Stadnyk, President and Chief Executive Officer
8:25 – 9:05 am Portfolio Strategy and Pace of Development
Lara Conrad, Vice President, Engineering and Planning
David Kehrig, Manager, Facilities
Sean Stuart, Manager, Completions
9:05 – 9:20 am Break
9:20 – 10:00 am How We Achieve Long-term Profitability
Ryan Berrett, Vice President, Marketing
Kris Bibby, Vice President, Finance
Sean Calder, Vice President, Production
10:00 – 10:40 am ARC’s Approach to Long-term Sustainable Development
Terry Anderson, Senior Vice President and Chief Operating Officer
Chris Baldwin, Vice President, Geosciences
Armin Jahangiri, Vice President, Operations
10:40 – 10:45 am Summary
Myron Stadnyk, President and Chief Executive Officer
10:45 – 11:00 am Questions

Our Plan
2017
Reduced the
dividend
Sold Saskatchewan
assets
Eliminated DRIP
and SDP plans
118,000 boe per day
2018
Sustain Montney
businesses
Progress Sunrise
Phase II
Advance Attachie
piloting activities
130,000 to 134,000
boe per day
2019
Maintain consistent
investment levels
Bring on Sunrise
Phase II
Progress Dawson
Phase IV to add
~17,500 boe per day
ARC’s Plan Is Fully Funded and Will Result in 10 Per Cent Production CAGR over a Three-year Period
2016
Brought on Dawson
Phase III
Rebuilt liquids
production from
divestments
Achieved success
in Lower Montney
and Attachie
120,000 to 124,000
boe per day
BUILT TO LAST
RISK-
MANAGED
VALUE
CREATION
Financial
Flexibility
High-quality,
Long-life
Assets
Top Talent
and Strong
Leadership
Culture
HSE and
Operational
Excellence
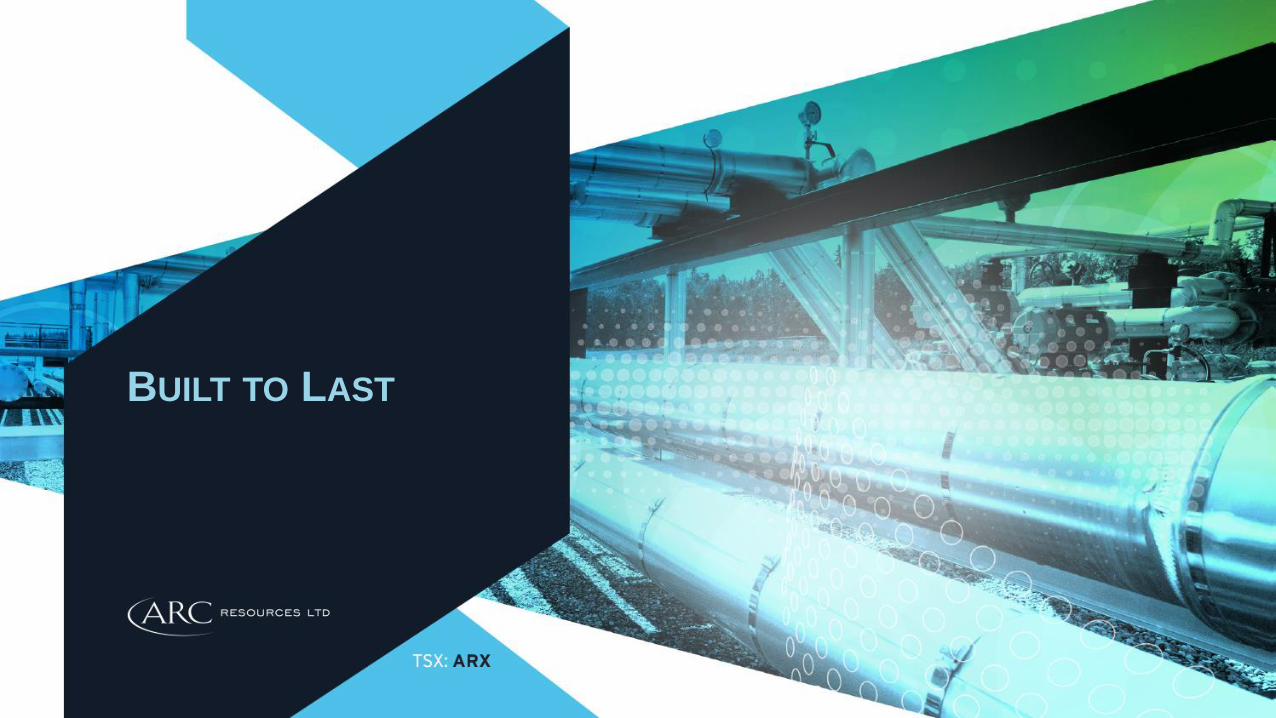
ARC at a Glance
A Leading Montney Producer Focused on Risk-managed Value Creation and Strategic Decision-making
8thLargest Canadian
Conventional Producer
130,000 boe/day
Q3 2017 Production
550
MMcf/dayNatural Gas
38,000
bbl/day Crude Oil & Liquids
737 MMboe
2P Reserves
3.2
TcfNatural Gas
196
MMbbl Crude Oil & Liquids

Long-term Value Creation
Strategic Decisions Have Created a Resilient Business and Positioned ARC for Future Success
(400%)
300%
1000%
1700%
2400%
1996 1997 1998 1999 2000 2001 2002 2003 2004 2005 2006 2007 2008 2009 2010 2011 2012 2013 2014 2015 2016 2017
ARX Total Return Performance vs. Indices (1)
ARX SPTSX Comp SPTSX E&P
>$6 Billionof Distributions /
Dividends & 13%
Annualized Total Return
Stayed within
Target of 1.0 to 1.5xNet Debt to
Funds from Operations
10%Return on Average
Capital Employed
TransitionedAsset Base to
World-class Montney
ARX: 13%
SPTSX E&P: 9%
SPTSX Comp: 8%
(1) Returns to November 10, 2017.
2,400%
1,700%
1,000%
300%
(400%)
To
tal R
etu
rn

Renais
sance E
nerg
y
Ta
lism
an E
nerg
y
Su
ncor
Inc.
Alb
ert
a E
nerg
y (
EnC
ana &
Cen
ovus)
Canadia
n O
ccid
en
tal
Canadia
n N
atu
ral R
esourc
es
An
ders
on E
xplo
ration
Cre
sta
r E
nerg
y
Po
co P
etr
ole
um
s
Norc
an E
nerg
y
Wascana E
nerg
y
Ranger
Oil
Gulf C
anada R
eso
urc
es
Pa
nC
anadia
n P
etr
ole
um
(E
nC
ana)
Rig
el E
nerg
y
Ta
rragon
Oil
& G
as
Ela
n E
nerg
y
Nort
hsta
r E
nerg
y
Mo
rris
on P
etr
ole
um
s
Ab
acan R
esourc
es
Pe
nn W
est P
etr
ole
um
(O
bsid
ian E
nerg
y)
Pin
na
cle
Resourc
es
Sceptr
e R
esourc
es
Chie
ftain
Inte
rnatio
nal
Tri L
ink R
esourc
es
Chauvco R
esourc
es
Rio
Alto E
xplo
ration
Num
ac E
nerg
y
Cabre
Explo
ratio
n
Sta
mp
eder
Explo
ratio
n
Blu
e R
ange R
esourc
e
Gulfstr
ea
m R
esourc
es
CS
Resourc
es
Uls
ter
Petr
ole
um
s
En
cal E
nerg
y
AR
C R
esourc
es L
td.
Jord
an P
etr
ole
um
Nort
hro
ck R
esourc
es
Be
au C
an
ada E
xplo
ratio
n
Ba
rrin
gto
n P
etr
ole
um
Mo
rgan H
ydro
carb
ons
Ocelo
t E
nerg
y
Dors
et E
xplo
ration
Inte
nstity
Resourc
es
Su
mm
it R
esourc
es
Arc
her
Reso
urc
es
Pe
trom
et R
esourc
es
TSX Oil & Gas Producers (1)
July 1996
Survivor Bias
• Only six of the companies from the TSX Oil & Gas Producers group in July 1996 still exist today
ARC Has Transformed Its Business to Be Competitive in Today’s Energy Sector
Still in Business
No Longer in Business
(1) Quoted market value of Oil & Gas Producers group on the Toronto Stock Exchange in July 1996.

WT
I C
rud
e O
il (
US
$/b
bl)
Banded Commodity Price Environment
ARC’s Response Has Been to Focus on the Montney, Reduce Costs, Improve Efficiencies, and Maintain a Strong Balance Sheet
(1) Forecasted pricing based on November 10, 2017 forward price curve.
NY
ME
X H
en
ry H
ub
Na
tura
l G
as
(U
S$
/MM
Btu
)
Crude Oil and Natural Gas Pricing (1)
2006 2007 2008 2009 2010 2011 2012 2013 2014 2015 2016 2017 2018F 2019F 2020F 2021F
WTI Crude Oil (LHS) NYMEX Henry Hub Natural Gas (RHS)

Building Sustainable Businesses in the Montney
Businesses Sustain Production and Generate Free Cash Flow at Low Reinvestment Rates
0
30,000
60,000
90,000
120,000
150,000
2009 Non-coreDispositions
2010 2011 2012 2013 2015 2015 2017 2019
Sunrise
Phase II
Dawson
Phase III
Tower
Battery
ExpansionSunrise
Phase IParkland/Tower
Phase II
Ante Creek
Phase IDawson
Phase IIDawson
Phase I
Montney Production
Cardium & Non-core Production
Montney Businesses

Ryan BerrettVice President
Marketing
Kris BibbyVice President
Finance
Sean CalderVice President
Production
Lara ConradVice President
Engineering & Planning
Terry AndersonSenior Vice President &
Chief Operating Officer
Chris BaldwinVice President
Geosciences
Wayne LentzVice President
Business Analysis
Lisa OlsenVice President
Human Resources
Myron StadnykPresident & CEO
Van DafoeSenior Vice President &
Chief Financial Officer
Armin JahangiriVice President
Operations
Our Team
Our Team Has the Proven Ability to Execute and Is Committed to Building an Enduring Company
Bevin WirzbaSenior Vice President
Business Development &
Capital Markets

Consistent and Sustainable Strategy
Delivering on Our Strategy of Risk-managed Value Creation
RISK-
MANAGED
VALUE
CREATION
Financial
Flexibility
High-quality,
Long-life
Assets
Top Talent
and Strong
Leadership
Culture
HSE and
Operational
Excellence

Top Talent and Strong Leadership Culture
High-performance Culture Creates an Environment Where Employees Are Committed to Achieving Superior Business Results
STRATEGIC DECISION-MAKING:
• Building a functional organization with
multi-disciplinary teams
• Focusing on long-term talent development
and succession
• Aligning compensation programs with the
interests of shareholders
RISK-
MANAGED
VALUE
CREATION
Financial
Flexibility
High-quality,
Long-life
Assets
HSE and
Operational
Excellence
Top Talent
and Strong
Leadership
Culture

High-quality, Long-life Assets
Portfolio Strategy and Pace of Development Support Ongoing Value Creation
RISK-
MANAGED
VALUE
CREATION
Financial
Flexibility
Top Talent
and Strong
Leadership
Culture
HSE and
Operational
Excellence
STRATEGIC DECISION-MAKING:
• Completing Montney transformation
• Creating full-cycle businesses
• Allocating strategic capital to liquids-rich
Attachie and Lower Montney
• Implementing full-stack development
of Montney assets
High-quality,
Long-life
Assets

HSE and Operational Excellence
Leveraging Expertise to Develop ARC’s High-quality Assets and Continuing to Drive Efficiencies
RISK-
MANAGED
VALUE
CREATION
Financial
Flexibility
Top Talent
and Strong
Leadership
Culture
High-quality,
Long-life
Assets
STRATEGIC DECISION-MAKING:
• Focusing on safety performance
• Investing in owned-and-operated infrastructure
• Creating and retaining capital and
operating efficiencies
• Advancing ESG considerations across
the business
• Managing pace of development as part
of managing risk
HSE and
Operational
Excellence

Financial Flexibility
Managing a Profitable Business within Banded Commodity Price Environment
RISK-
MANAGED
VALUE
CREATION
Top Talent
and Strong
Leadership
Culture
High-quality,
Long-life
Assets
HSE and
Operational
Excellence
STRATEGIC DECISION-MAKING:
• Preserving access to capital
• Maintaining discipline around debt levels
• Executing an integrated physical and financial
risk management diversification strategy
• Continually assessing long-term profitability
of business plans
Financial
Flexibility
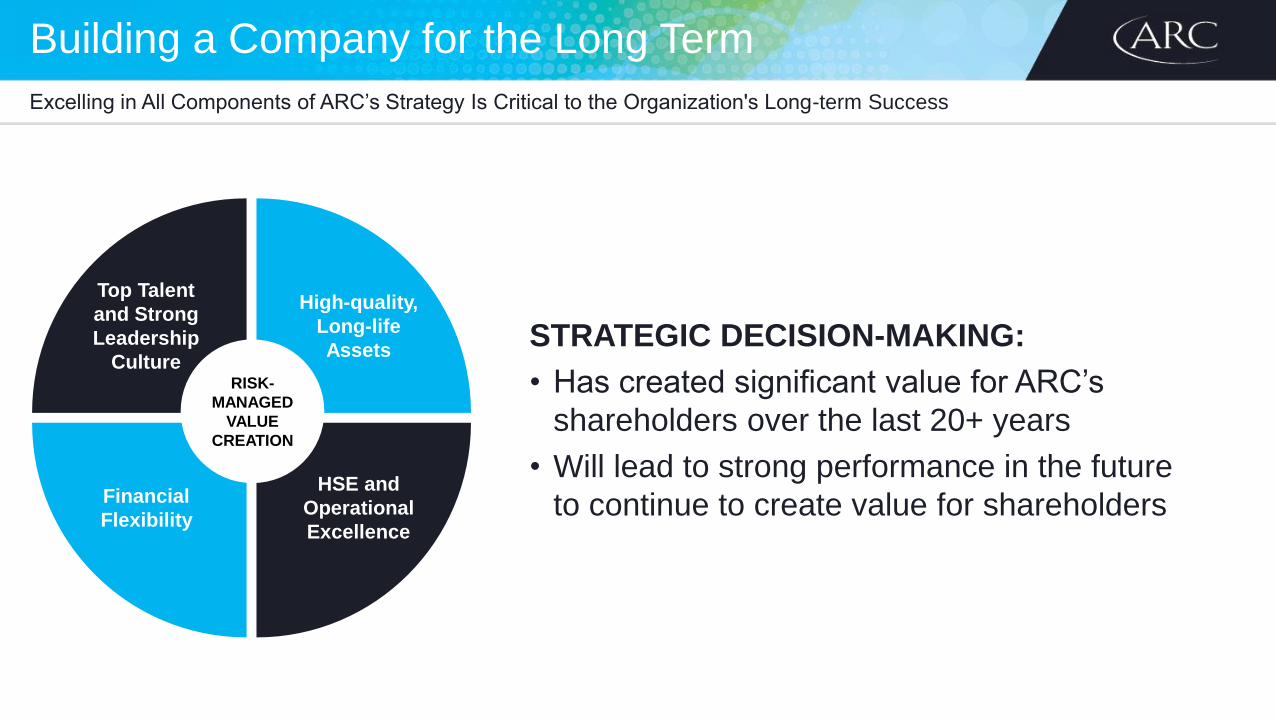
Building a Company for the Long Term
Excelling in All Components of ARC’s Strategy Is Critical to the Organization's Long-term Success
STRATEGIC DECISION-MAKING:
• Has created significant value for ARC’s
shareholders over the last 20+ years
• Will lead to strong performance in the future
to continue to create value for shareholders
RISK-
MANAGED
VALUE
CREATION
Financial
Flexibility
High-quality,
Long-life
Assets
Top Talent
and Strong
Leadership
Culture
HSE and
Operational
Excellence

PORTFOLIO STRATEGY
& PACE OF
DEVELOPMENT

Proven Development Model
Inventory at All Stages Allows for Self-funding and Full-cycle Returns across Portfolio
Dawson Phase I & II
Sunrise Phase I
Attachie East
Parkland/Tower Phase I & II
Net Cash Flow +
Blueberry
Sundown
Attachie West (Pilot)
Redwater
Pembina
Growth for Future Phase
• Exploration
• Appraisal / Piloting
• Geographic and Commodity
Diversity
Development Phase
• Develop to Commercialize
• Exploit
Free Cash Flow Phase
• Optimization
• Maintenance
Growth & Development Capital
$275 million
Sustaining Capital
$390 million
Ante Creek (Central)
Dawson Phase III
Pouce Coupe
Dawson Phase IV
Ante Creek (South)
2018 Budget
$690 million (1)
Sunrise Phase II
Parkland/Tower Phase III
Septimus
(1) Includes $25 million of non-core and corporate capital.
Attachie West Phase I
Dawson Phase V
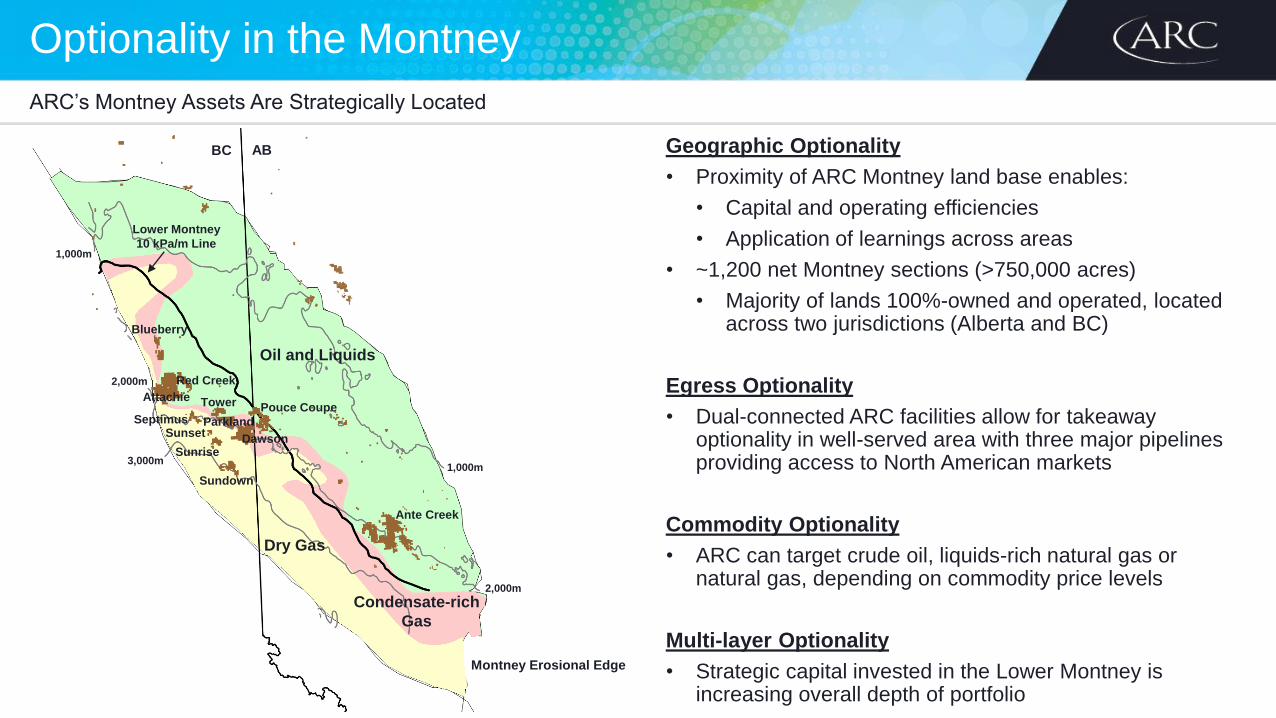
Optionality in the Montney
ARC’s Montney Assets Are Strategically Located
Geographic Optionality
• Proximity of ARC Montney land base enables:
• Capital and operating efficiencies
• Application of learnings across areas
• ~1,200 net Montney sections (>750,000 acres)
• Majority of lands 100%-owned and operated, located across two jurisdictions (Alberta and BC)
Egress Optionality
• Dual-connected ARC facilities allow for takeaway optionality in well-served area with three major pipelines providing access to North American markets
Commodity Optionality
• ARC can target crude oil, liquids-rich natural gas ornatural gas, depending on commodity price levels
Multi-layer Optionality
• Strategic capital invested in the Lower Montney is increasing overall depth of portfolio
Oil and Liquids
Dry Gas
ABBC
Blueberry
Red Creek
Attachie
Septimus
Tower
ParklandSunset
Sunrise
Sundown
Dawson
Pouce Coupe
Ante Creek
1,000m
2,000m
3,000m1,000m
Montney Erosional Edge
2,000m
Lower Montney
10 kPa/m Line
Condensate-rich
Gas

Demonstrating Optionalityat Ante Creek:A Case Study

Step Changes in Execution at Ante Creek
2017 Operational Results Are Allowing Ante Creek to Now Compete with Our Other Montney Assets
2014 20182016
2015 2017
New well design applied:
• Transverse orientation
• Monobore
• Slickwater fracturing
• 2016 drilling program deferred;
optimization activities become
key focus
• Modernized Royalty Framework
• Technical learnings from NE BC
integrated into exploitation strategy
• 2017 drilling program set
• Drilling program to
sustain production
• FEED studies for next
phase of development
• Regulatory application
Oil prices begin
to deteriorate
• NDP government elected
• Royalty review initiated
• 2016 drilling program set

0
1,000
2,000
3,000
4,000
5,000
0 2 4 6 8 10 12
Days
Drilling Times
Capital Efficiency Improvements at Ante Creek
Improvements in Drilling Times and Costs Are Sustainable across ARC’s Asset Base
0
150
300
450
600
750
0
150
300
450
600
750
2014 Pacesetter 2015 Pacesetter Q3 2016 Q1 2017 Q2 2017
Drilling Costs
Cost per Meter
Meters Drilled per Day
2014
2017
35%Reduction in
Overall Drill Times
(1) Change is relative to 2015 Pacesetter well.
60%Increase in
Meters Drilled
25%Reduction in Costs (1)
De
pth
(m
)
Co
st
pe
r M
ete
r ($
/m)
Me
ters
Dri
lle
d p
er
Da
y (
m/d
ay)
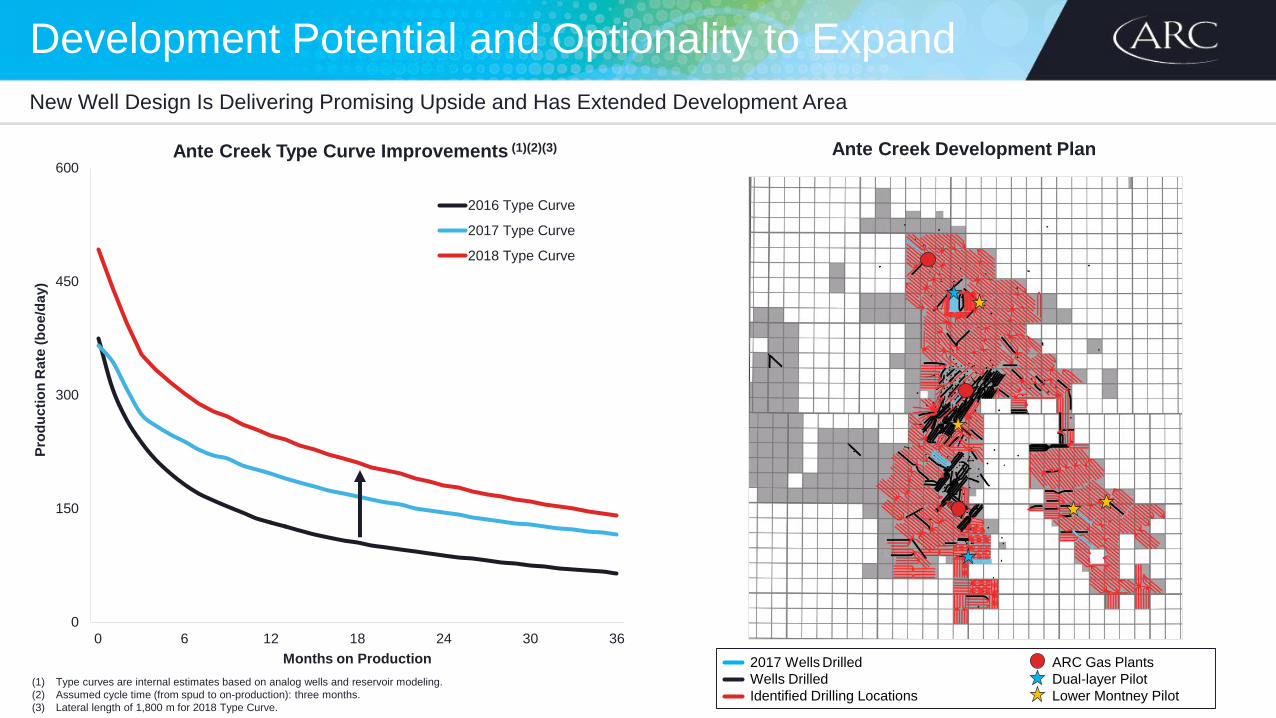
Development Potential and Optionality to Expand
New Well Design Is Delivering Promising Upside and Has Extended Development Area
Ante Creek Development Plan
0
100
200
300
400
0 6 12 18 24 30 36
Pro
du
cti
on
Ra
te
(bo
e/d
ay)
Months on Production
2017 Type Curve
2016 Type Curve
0
150
300
450
600
0 6 12 18 24 30 36
Pro
du
cti
on
Ra
te (
bo
e/d
ay)
Months on Production
2016 Type Curve
2017 Type Curve
2018 Type Curve
Ante Creek Type Curve Improvements (1)(2)(3)
(1) Type curves are internal estimates based on analog wells and reservoir modeling.
(2) Assumed cycle time (from spud to on-production): three months.
(3) Lateral length of 1,800 m for 2018 Type Curve.
2017 Wells Drilled ARC Gas Plants
Wells Drilled Dual-layer Pilot
Identified Drilling Locations Lower Montney Pilot

0
20000000
40000000
60000000
80000000
100000000
120000000
140000000
160000000
180000000
1 2 3 4 5 6 7 8 9 10 11 12 13 14 15 16 17 18 19 20 21 22 23 24 25 26 27 28 29 30 31 32 33 34 35 36
Fa
cilit
y I
nve
stm
en
t ($
)
Months
Creating Optionality through Facility Design
Upfront Investment and Templated Approach to Facility Design Creates Flexibility within ARC’s Long-term Plans
Build Asset Confidence
Initiate Low
Investment Up Front
Infrastructure
Optionality Strategy
Facility Investment Profile
• Identify Plant Location
• Process Design
• Noise & Emission Modelling
• FEED Engineering
• Regulatory Applications
• Long-lead Items (e.g., Turbines)
• Water Infrastructure

Managing the Pace of Development at Attachie:A Case Study

A Paced Approach to Development at Attachie
ARC’s Disciplined Approach Has Allowed for Learnings to be Applied from Other Fields and for Efficiencies to Be Captured
2010 20182016
2017
Tower completion
design applied
to five wells
(25 m IFS & 1.9 T/m)
• Piloted production
through third-party facility
• Second well drilled
(liquids-rich)
88 net sections
acquired through
land sales
First well
drilled
(wet gas)
2011 2014
2015 2019 2020
21 net sections
acquired through
land sales
• First multi-
well pad on
production
• Lower Montney
test
Refined completion
design applied
to two wells
(18 m IFS & 1.9 T/m)
Targeted in-
service date for
TCPL North
Montney Mainline
307 net sections
97 net sections
acquired through
land transactions
0
25
50
75
100
125
0 100 200 300 400 500 600
Cu
mu
lati
ve
Oil &
Co
nd
en
sate
Pro
du
cti
on
(M
bb
l)
Days on Production
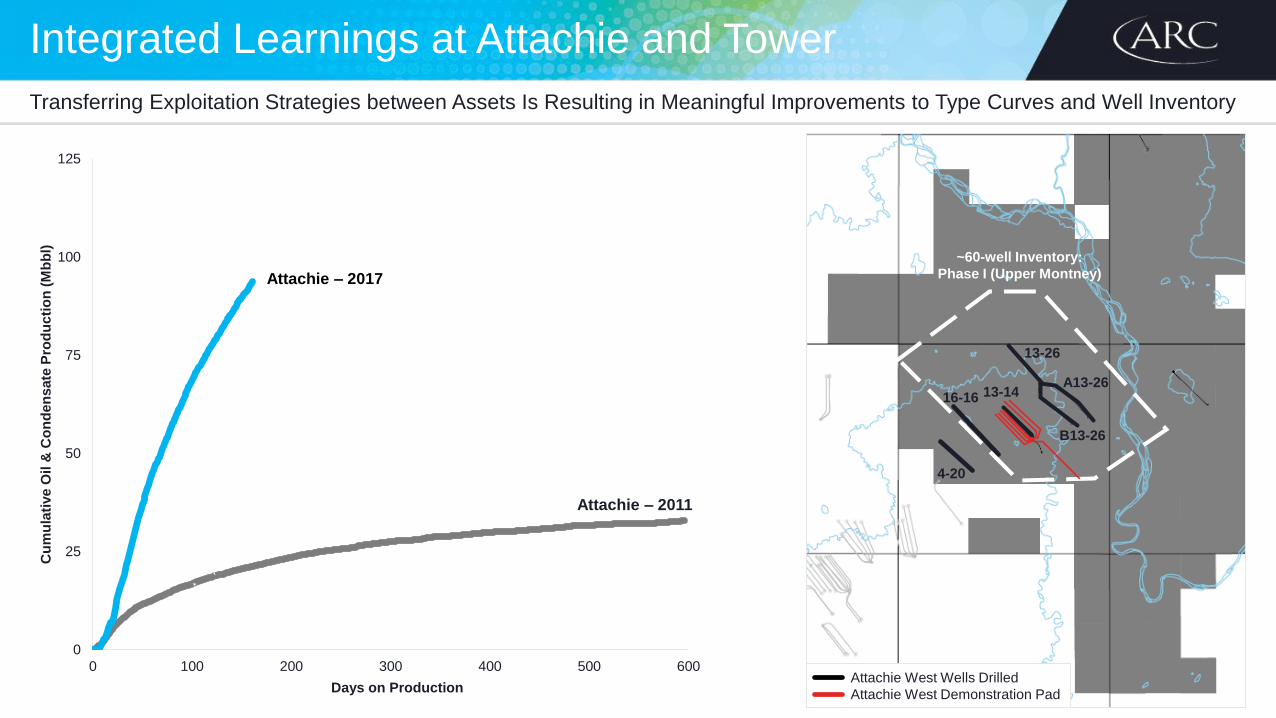
Integrated Learnings at Attachie and Tower
Transferring Exploitation Strategies between Assets Is Resulting in Meaningful Improvements to Type Curves and Well Inventory
Attachie – 2011
Attachie – 2017
13-14
13-26
B13-26
~60-well Inventory:
Phase I (Upper Montney)
16-16
4-20
A13-26
Attachie West Wells Drilled
Attachie West Demonstration Pad

Progressing Attachie Towards Commercialization
De-risking and Piloting Attachie for Optimal Infrastructure Design
Manage Pace of
Development
Takeaway Secured on
TCPL North Montney
Mainline for Phase I
Further Delineation of
Upper and Lower Montney
for Phase II+ Sanctioning TCPL North Montney Mainline
(Targeted In-service Date: H1 2019)
ARC 4-20
Demonstration
Battery
(Phases I & II)
Progress
Farrell Creek
(180 MMcf/day)
Canbriam/
Pembina
Liquids

HOW WE ACHIEVE
LONG-TERM
PROFITABILITY
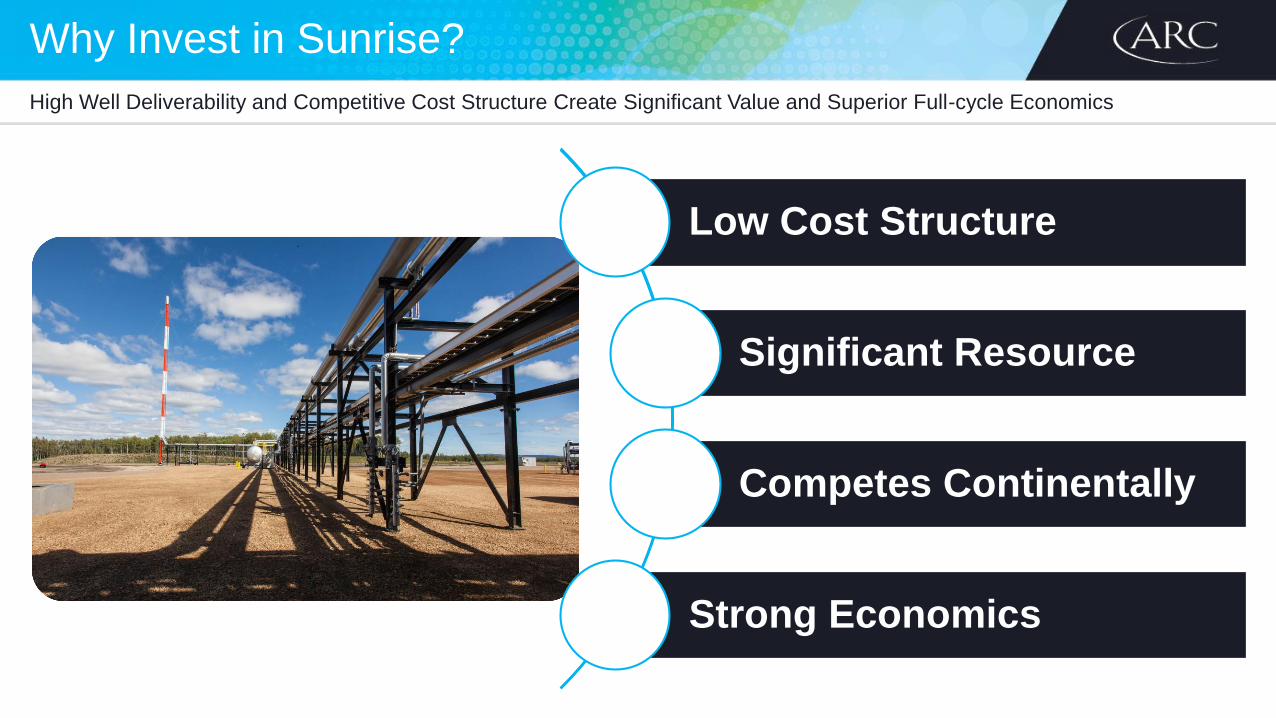
Why Invest in Sunrise?
High Well Deliverability and Competitive Cost Structure Create Significant Value and Superior Full-cycle Economics
Low Cost Structure
Significant Resource
Competes Continentally
Strong Economics

Full-stack Development at Sunrise
Significant Natural Gas Resource Base with Excellent Capital and Operating Efficiencies
Sunrise Full-stack Development (1)
Up
pe
r M
on
tney
Lo
we
r M
on
tne
y
Existing Horizontal Wells, Development
Existing Horizontal Wells, Pilots
Potential Horizontal Wells(1) Spacing and completions approach varies by project area.ARC Montney Lands with 2P
Reserves Booked as of YE 2016

Sunrise Phase II Expansion
ARC’s Next Growth Driver Is a High-rate-of-return Project
Sunrise Phase I60 MMcf/day sales capacity
Sunrise Phase II180 MMcf/day sales capacity
(1) After-tax rate of return run at US$50/bbl WTI and Cdn$2.50/GJ AECO flat pricing.
(2) Economics have been normalized to a 10-year project life.
0
60
120
180
240
2011 2012 2013 2014 2015 2016 2017 2018 2019 2020 2021
Na
tura
l G
as
Pro
du
cti
on
(M
Mc
f/d
ay)
Sunrise Production Profile
Third-party Processing Facility ARC Sunrise 13-36
>25%Full-cycle
Economics (1)(2)
85%Half-cycle
Economics (1)
80%Reduction in
Processing Costs for
Repatriated Volumes
>99%Facility Run-time

Moving Our Sunrise Gas to Market
Competitive Cost Structure and Long-term Approach to Takeaway Is Resulting in Favourable Netbacks
Operated Sunrise Costs $0.85
Transportation $1.05
ARC Cost to Chicago $1.90
Operated Sunrise Costs $0.85
Transportation $1.30
ARC Cost to Henry Hub $2.15Henry Hub
Chicago
Market Access
Market
Diversification
Price
Optimization
Operated Sunrise Cost Structure
(Cdn$/Mcfe)
AECOF&D Costs $0.45
Operating Expenses &
Royalties $0.40
Operated Sunrise Costs $0.85

Natural Gas Pricing Exposure
ARC Continues to Physically and Financially Diversify to Downstream Markets to Manage Risk and to Achieve Optimal Pricing
Hedged
38%
Pac-NW US
4%
Dawn
8%
AECO
11%
2018 Physical and Financial
Diversification Activities
2017 YTD Physical and Financial
Diversification Activities (Cdn$/Mcfe)
Average Price before
Diversification Activities (1) $2.37
Diversification Activities (1) $0.30
Realized Gains on Risk
Management Contracts $0.72
Overall Corporate Price $3.39
Midwest
30%
(1) ARC’s average realized natural gas price is a combination of average price before diversification activities and diversification activities.
(60)
0
60
120
180
240
200
9
201
0
201
1
201
2
201
3
201
4
201
5
201
6
201
7F
201
8F
201
9F
202
0F
$ m
illio
ns
Financial Risk Management
Realized Gains (Losses)
Station 2
9%

-35,000
-30,000
-25,000-20,000-15,000-10,000
-5,000
05,00010,00015,00020,000
25,00030,000
35,000
($200,000,000)
($150,000,000)
($100,000,000)
($50,000,000)
$0
$50,000,000
$100,000,000
$150,000,000
$200,000,000
2017F
2018F
2019F
2020F
2021F
2022F
2023F
2024F
2025F
2026F
2027F
-35,000
-30,000
-25,000
-20,000
-15,000
-10,000
-5,000
0
5,000
10,000
15,000
20,000
25,000
30,000
35,000
($200,000,000)
($150,000,000)
($100,000,000)
($50,000,000)
$0
$50,000,000
$100,000,000
$150,000,000
$200,000,000
0
2,000
4,000
6,000
8,000
0 10 20 30 40 50 60
Delivering Full-cycle and Corporate Returns
Efficiently Converting Resources into Corporate Earnings for Shareholders
Single-well
Economics
(Half-cycle)
Proportional Facility
and Appropriate
Timing Included:
Project Economics
(Full-cycle)
Corporate Costs
ROACE of 10% since
Inception
Aft
er-
tax R
ate
of
Retu
rn
Pro
du
cti
on
Rate
(M
cf/
da
y)
Months on Production
Field NetbackCapital Expenditures, excluding Facility Expenditures
Facility Expenditures Production
Net Cash Flow
Sunrise Type Curves & Single-well Economics (Half-cycle)
Full-cycle and Corporate Returns
~$225 million of capital
investment for facility start-up
~$400 million of capital
investment to sustain facility
Projected Sunrise Phase II Cash Flows
2017 Type Curve (Previous Well Design: 2,000 m)
2018 Type Curve (New Well Design: 2,440 m)
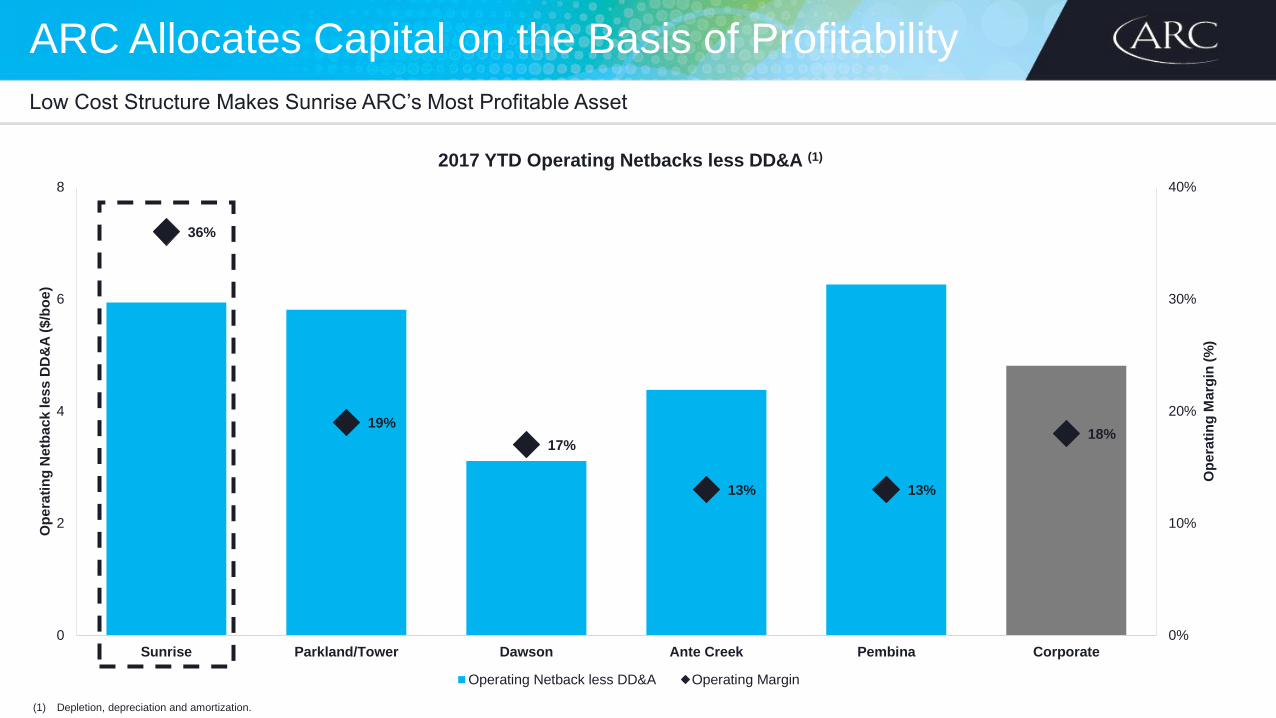
ARC Allocates Capital on the Basis of Profitability
Low Cost Structure Makes Sunrise ARC’s Most Profitable Asset
36%
19%
17%
13% 13%
18%
0%
10%
20%
30%
40%
0
2
4
6
8
Sunrise Parkland/Tower Dawson Ante Creek Pembina Corporate
Op
era
tin
g M
arg
in (
%)
Op
era
tin
g N
etb
ac
k le
ss
DD
&A
($
/bo
e)
2017 YTD Operating Netbacks less DD&A (1)
Operating Netback less DD&A Operating Margin
(1) Depletion, depreciation and amortization.

How We Choose to Fund Our Business
• ARC is currently funding its business through the use of cash and long-term debt
ARC’s Funding Choices Have the Lowest Cost of Capital
Cash
Debt
Equity
Asset Sale PDP
Midstream Joint Venture(Includes Operating Expense Dilution)
Upstream Joint Venture(Includes Asset Dilution)
Q4 2016 sale of
Saskatchewan assets
Incre
asin
g C
ost
of
Cap
ital
Dividends
Sustaining Capital
Growth Capital
Funds from Operations
2016 DispositionProceeds
Dividends
Sustaining Capital
Growth Capital
Funds from Operations
DRIP/SDP
Equity Proceeds
Net A&D Proceeds
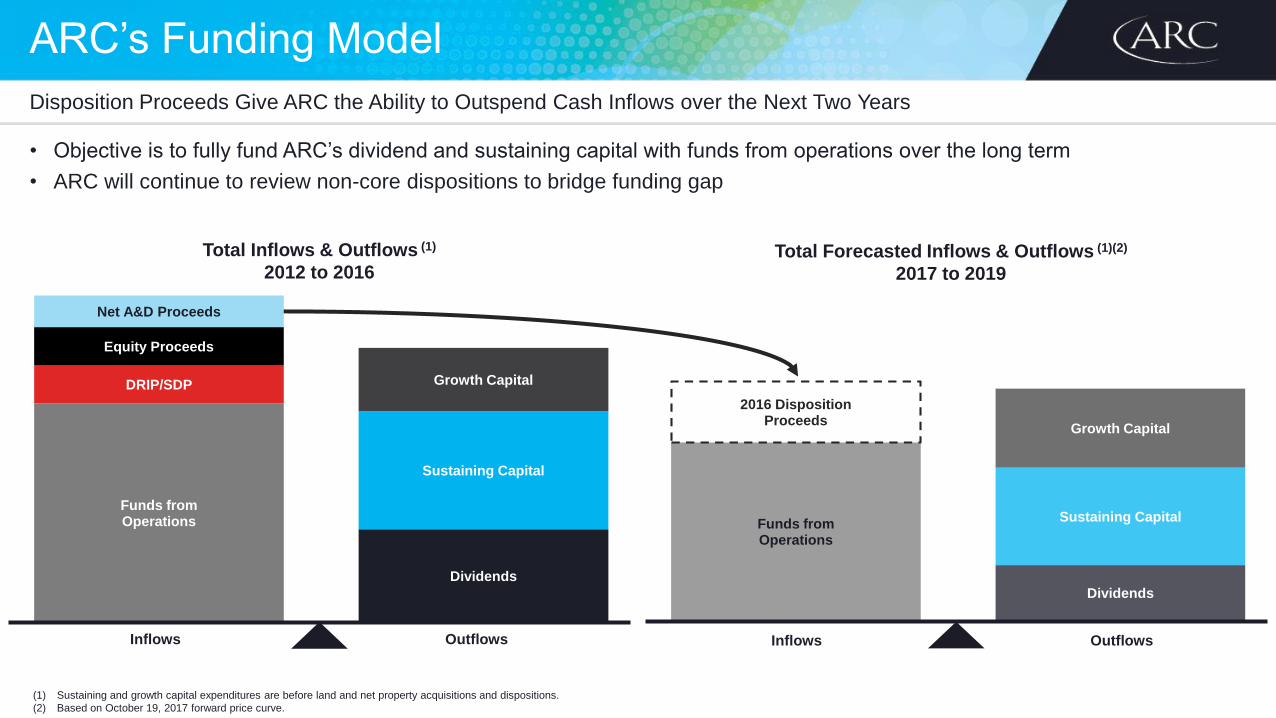
ARC’s Funding Model
• Objective is to fully fund ARC’s dividend and sustaining capital with funds from operations over the long term
• ARC will continue to review non-core dispositions to bridge funding gap
Disposition Proceeds Give ARC the Ability to Outspend Cash Inflows over the Next Two Years
Inflows Outflows
(1) Sustaining and growth capital expenditures are before land and net property acquisitions and dispositions.
(2) Based on October 19, 2017 forward price curve.
Total Inflows & Outflows (1)
2012 to 2016
Inflows Outflows
Total Forecasted Inflows & Outflows (1)(2)
2017 to 2019

Positioned for Continued Long-term Profitability
Low Sustaining Capital Requirements, Efficient Investment of Growth Capital and Low-cost Funding Decisions Lead to Profitability
(10%)
0%
10%
20%
30%
1996 1997 1998 1999 2000 2001 2002 2003 2004 2005 2006 2007 2008 2009 2010 2011 2012 2013 2014 2015 2016 2017F
Return on Average Capital Employed (1)
(1) 2017F ROACE based on October 19, 2017 forward price curve.
ROACE of 10% since Inception ROACE
Trailing Three-year ROACE

ARC’S APPROACH
TO LONG-TERM
SUSTAINABLE
DEVELOPMENT

Unlocking the Lower Montney

Benefits of Multi-layer Development
Significant Future Delineation Opportunities
Attachie Septimus Sunrise Tower Parkland Dawson Pouce Coupe
Montney
A
Montney
B
Montney
C
Montney
D
Montney
E
Existing Horizontal Wells, Development Existing Horizontal Wells, Pilots Potential Horizontal Wells
Up
pe
r M
on
tney
Lo
we
r M
on
tne
y
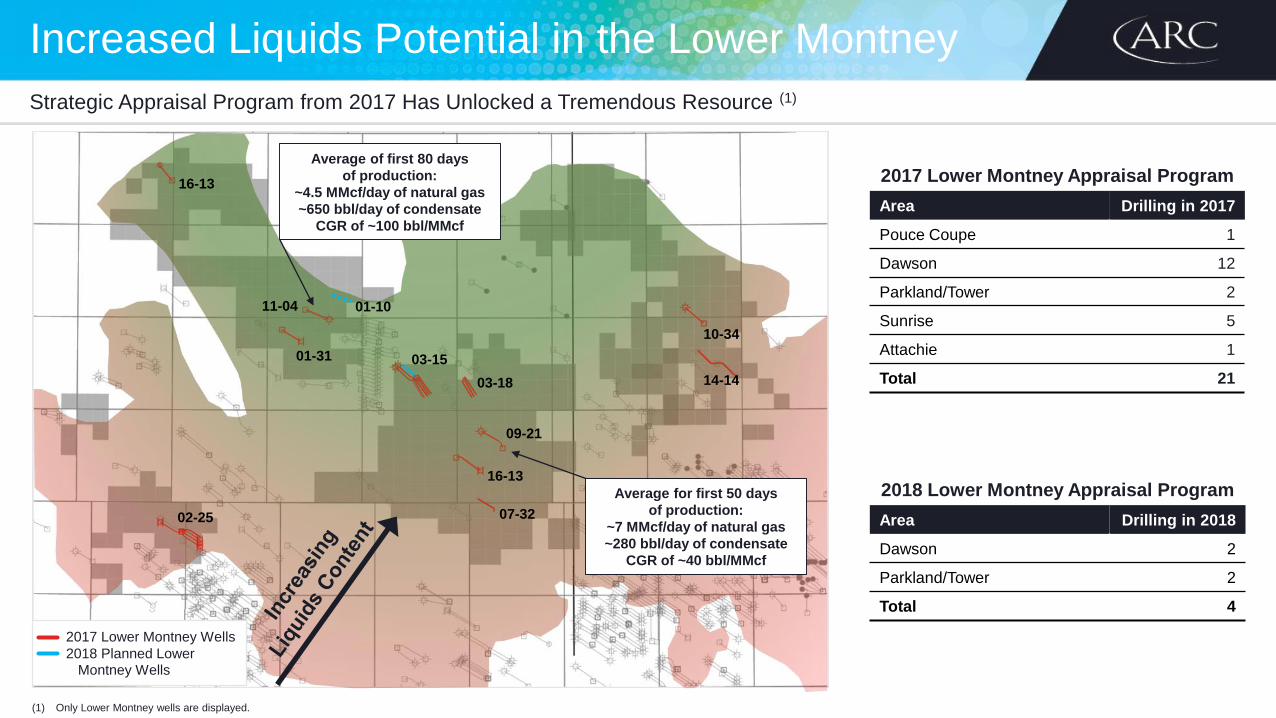
Increased Liquids Potential in the Lower Montney
Strategic Appraisal Program from 2017 Has Unlocked a Tremendous Resource (1)
(1) Only Lower Montney wells are displayed.
2017 Lower Montney Appraisal Program
Area Drilling in 2017
Pouce Coupe 1
Dawson 12
Parkland/Tower 2
Sunrise 5
Attachie 1
Total 21
2018 Lower Montney Appraisal Program
Area Drilling in 2018
Dawson 2
Parkland/Tower 2
Total 4
10-34
14-14
07-32
16-13
09-21
03-18
03-15
11-04
01-31
02-25
2017 Lower Montney Wells
2018 Planned Lower Montney Wells
01-10
16-13
Average of first 80 days
of production:
~4.5 MMcf/day of natural gas
~650 bbl/day of condensate
CGR of ~100 bbl/MMcf
Average for first 50 days
of production:
~7 MMcf/day of natural gas
~280 bbl/day of condensate
CGR of ~40 bbl/MMcf

Montney Exploitation Approach Improves Efficiencies
ARC Has Advanced Its Understanding of the Full-stack Development Potential for All Project Areas in Order to Execute Efficiently
Dawson Full-stack Development (1)
(1) Spacing and completions approach varies by project area.

ARC’s ESG Considerations for Infrastructure Development

Protection
and
Conservation
Water Strategy Limits Impact and Creates Efficiencies
Integrated Approach with Collaboration Between Technical Experts and Participation in Industry Discussions and Partnerships
ARC’s Guiding Principles of Water Stewardship
Transport,
Store and
Dispose
Responsibly
Measure,
Monitor and
Set Targets
Strategy in Action:
$80 million investment planned for water-related infrastructure over the next three years
Reduce fresh water usage by 80% in Dawson, Parkland and Tower
Reduce northeast BC frac water costs by 70 to 80% by 2019
Lead and Support
Research,
Collaboration and
Technology
Sustainable
and Economic
Water Supply

Evaluate
Opportunities
for Reduction
Carbon and Emissions Management Strategy
Committed to Minimizing Emissions that Pose Potential Risks While Recognizing the Importance of Economic Viability
ARC’s Guiding Principles of Carbon and Emissions Management
Measure,
Monitor and
Set Targets
Participate in
Carbon
Incentives
Participate in
Emissions
Dialogue
Reduced corporate emissions intensity by 30% since 2010
Strategy in Action:
~15% reduction in emissions intensity by 2019 through planned electrification of facilities
Planned solar pump conversion project will reduce methane emissions by 1,100 tonnes of CO2e per year
Dawson Phase III waste heat recovery project will reduce our corporate CO2 emissions by 2% per year
Lead and Support
Research,
Collaboration and
Technology

Proven Expertise in NE BC Facility Development
Best-in-class Capital Efficiency
$550 million>500 MMcf/day natural gas
>17 Mbbl/day liquids-handling
✓ Increased Reliability (ARC-owned and Operated)
✓ Low-cost Operator
✓Continuous Improvement
✓Design for Future Flexibility
Investment in Strategic Infrastructure Has Resulted in Best-in-class Efficiencies
Dawson Phase I
(2010)
Dawson Phase II
(2011)
Parkland/Tower
Phase II
(2013)
Sunrise Phase II
(2019 Est.)
Dawson Phase III
(2017)
Sunrise Phase I
(2015)

ARC’s Approach toLong-term Planning
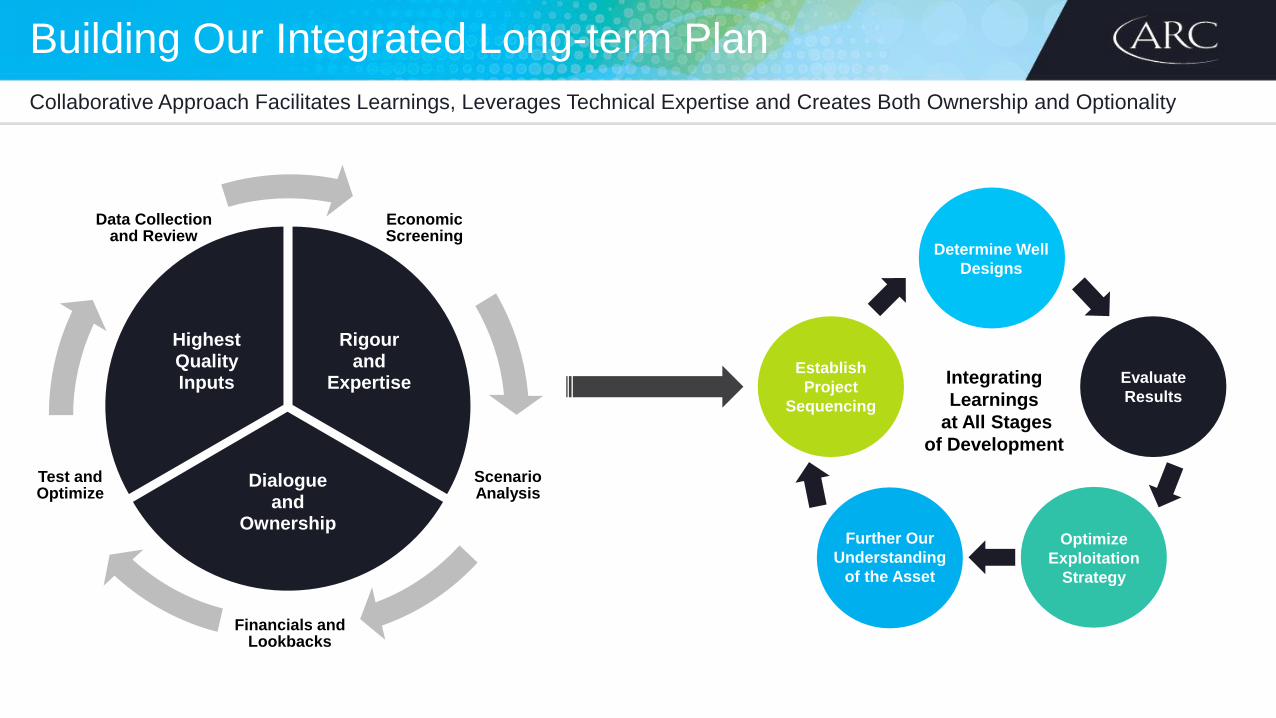
Building Our Integrated Long-term Plan
Collaborative Approach Facilitates Learnings, Leverages Technical Expertise and Creates Both Ownership and Optionality
Economic Screening
Scenario Analysis
Financials and Lookbacks
Test and Optimize
Data Collection and Review
Integrating
Learnings
at All Stages
of Development
Determine Well
Designs
Evaluate
Results
Optimize
Exploitation
Strategy
Further Our
Understanding
of the Asset
Establish
Project
Sequencing
Rigour and
Expertise
Dialogue and
Ownership
Highest Quality Inputs

2018 Budget and Guidance

2018 Guidance
Focused on Profitability and Long-term Value Creation
$690 million
Invest to drill
64 gross
Allowing
ARC to:
While managing operating costs
at $6.50 – $6.90/boe
Maintain Balance Sheet Strength
Facilitate an Orderly Pace of Development
Create Shareholder Value
Keeping gas plants in
our core Montney areas
at capacity
Ensuring the safe and responsible
execution of the capital program
operated wells
37,500 – 40,500 bbl/day
of Liquids Production
555 – 565 MMcf/day
of Gas Production
To produce
130,000 – 134,000boe/day

2018 Budget – Our Most Capitally Efficient Year
Capital Budget of $690 Million Focuses on Overall Capital Efficiency and Profitability
ABBC
Blueberry
Red CreekAttachie
Septimus
Tower
ParklandSunset
Sunrise
Sundown
Dawson
Pouce Coupe
Ante Creek
Attachie
$45MM • 2 wells
Advance towards
commercialization with
multi-well pad and long-term
infrastructure evaluation
Ante Creek
$75MM • 8 wells
Focus on results from new
wells and advance technical
learnings through
optimization activities
Pembina
$30MM
Manage production declines
and maximize free cash
flow generation from light
oil production
Parkland/Tower
$175MM • 13 wells
Sustain production at
current facility capacity
and interconnect Parkland
and Dawson assets
Sunrise
$190MM • 23 wells
Phase II facility construction
and pipeline infrastructure
and drill wells to fill facility
(on-stream mid-year 2019)
Pembina
Redwater
Dawson
$150MM • 17 wells
Manage overall pace
of development and
continue to develop
Lower Montney
$390MM - Sustaining Capital
$275MM - Growth and Development Capital
$25MM - Non-core and Corporate Capital

SUMMARY
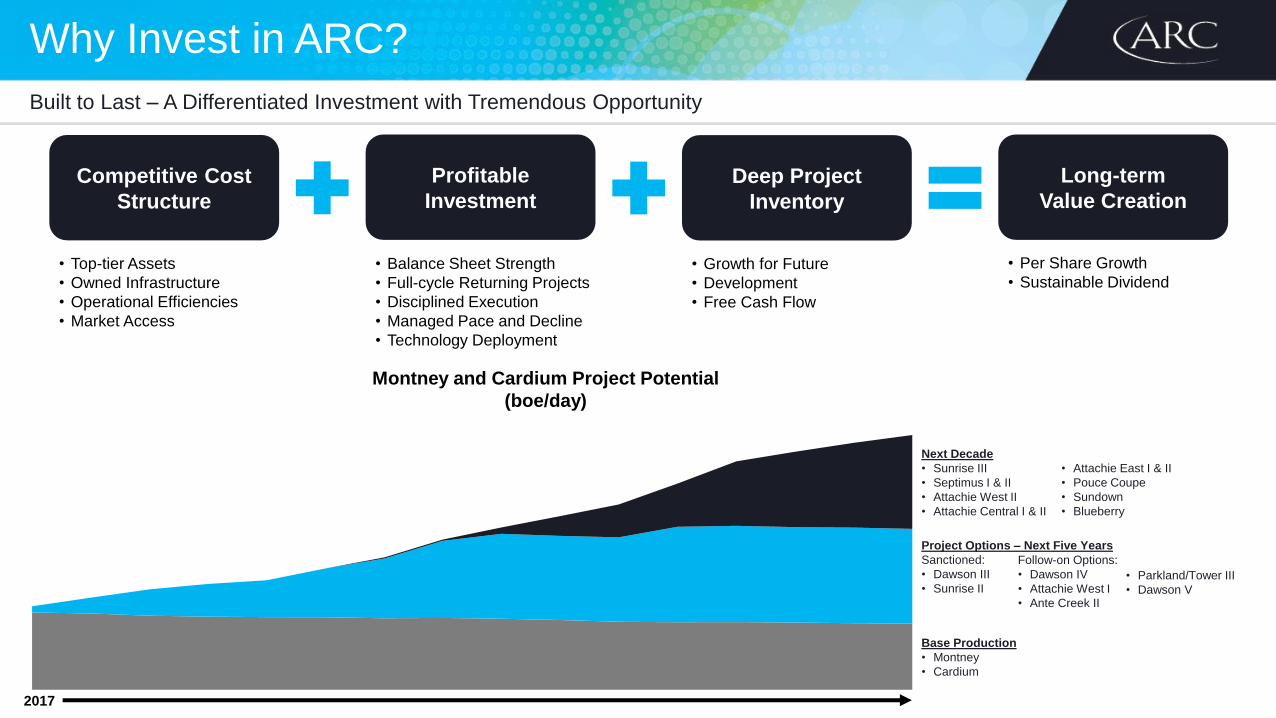
Why Invest in ARC?
Built to Last – A Differentiated Investment with Tremendous Opportunity
• Top-tier Assets
• Owned Infrastructure
• Operational Efficiencies
• Market Access
• Balance Sheet Strength
• Full-cycle Returning Projects
• Disciplined Execution
• Managed Pace and Decline
• Technology Deployment
• Growth for Future
• Development
• Free Cash Flow
• Per Share Growth
• Sustainable Dividend
Montney and Cardium Project Potential
(boe/day)
2017
Competitive Cost
Structure
Profitable
Investment
Deep Project
Inventory
Long-term
Value Creation
Base Production
• Montney
• Cardium
Project Options – Next Five Years
Sanctioned:
• Dawson III
• Sunrise II
Next Decade
• Sunrise III
• Septimus I & II
• Attachie West II
• Attachie Central I & II
• Attachie East I & II
• Pouce Coupe
• Sundown
• Blueberry
Follow-on Options:
• Dawson IV
• Attachie West I
• Ante Creek II
• Parkland/Tower III
• Dawson V
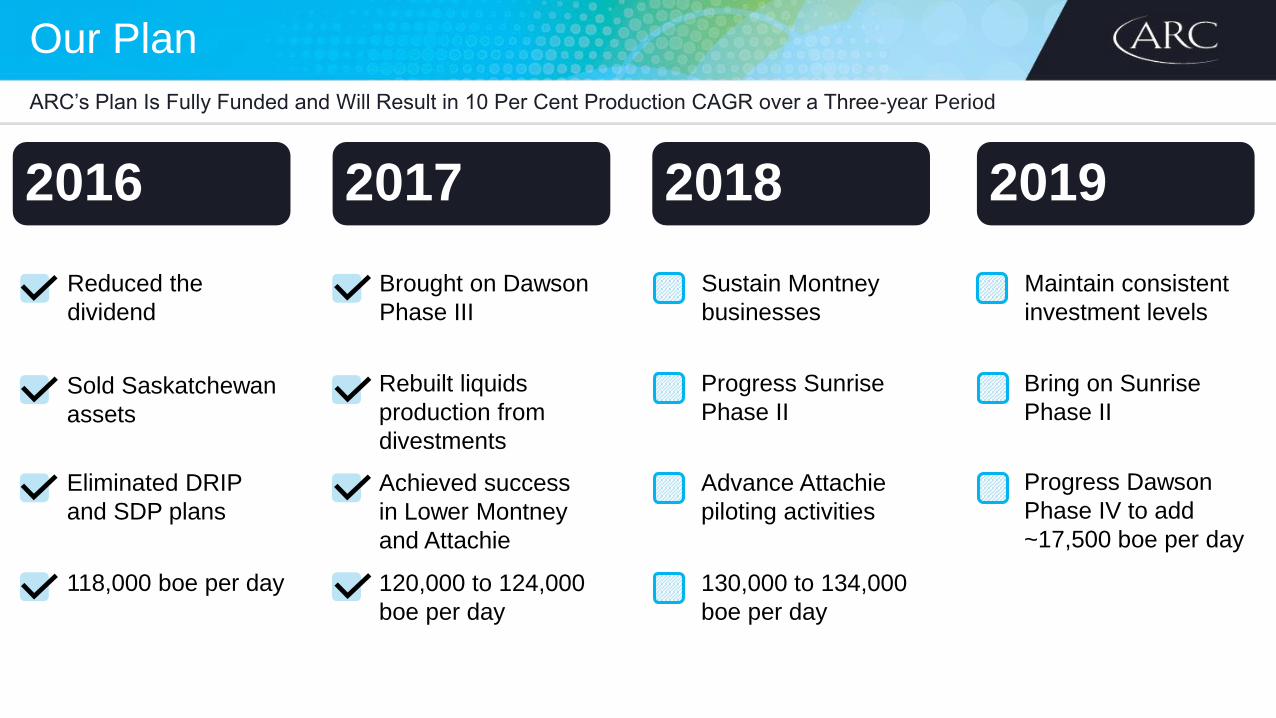
Our Plan
2017
Reduced the
dividend
Sold Saskatchewan
assets
Eliminated DRIP
and SDP plans
118,000 boe per day
2018
Sustain Montney
businesses
Progress Sunrise
Phase II
Advance Attachie
piloting activities
130,000 to 134,000
boe per day
2019
Maintain consistent
investment levels
Bring on Sunrise
Phase II
Progress Dawson
Phase IV to add
~17,500 boe per day
ARC’s Plan Is Fully Funded and Will Result in 10 Per Cent Production CAGR over a Three-year Period
2016
Brought on Dawson
Phase III
Rebuilt liquids
production from
divestments
Achieved success
in Lower Montney
and Attachie
120,000 to 124,000
boe per day
APPENDIX

This presentation contains forward-looking information as to ARC’s internal projections, expectations or beliefs relating to future eventsor future performance and includes information as to our future well inventory in our core areas, our exploration and development drillingand other exploitation plans for 2017, 2018 and beyond, and related production expectations, costs and cash flow, expenses, our plansfor constructing and expanding facilities, the volume of ARC's oil and gas reserves and the volume of ARC's oil and gas resources in thenortheast British Columbia Montney (“NE BC Montney”), the recognition of additional reserves and the capital required to do so, the lifeof ARC's reserves, the volume and product mix of ARC's oil and gas production, future results from operations and operating metrics.These statements represent Management’s expectations or beliefs concerning, among other things, future operating results and variouscomponents thereof or the economic performance of ARC. The projections, estimates and beliefs contained in such forward-lookingstatements are based on Management's assumptions relating to the production performance of ARC’s oil and gas assets, the cost andcompetition for services, the continuation of ARC’s historical experience with expenses and production, changes in the capitalexpenditure budgets, future commodity prices, continuing access to capital and the continuation of the current regulatory and tax regimein Canada and necessarily involve known and unknown risks and uncertainties, such as changes in oil and gas prices, infrastructureconstraints in relation to the development of the Montney in British Columbia, risks associated with the degree of certainty in resourceassessments and including the business risks discussed in ARC’s annual and quarterly MD&A and other continuous disclosuredocuments, and related to Management’s assumptions, which may cause actual performance and financial results in future periods todiffer materially from any projections of future performance or results expressed or implied by such forward-looking statements.Accordingly, readers are cautioned that events or circumstances could cause actual results to differ materially from those predicted.Other than the 2017 and 2018 Guidance, which is discussed quarterly, ARC does not undertake to update any forward-lookinginformation in this document whether as to new information, future events or otherwise except as required by securities lawsand regulations.
We have adopted the standard of 6 Mcf:1 barrel when converting natural gas to barrels of oil equivalent ("boe"). Boe may be misleading,particularly if used in isolation. A boe conversion ratio of 6 Mcf:1 barrel is based on an energy equivalency conversion method primarilyapplicable at the burner tip and does not represent a value equivalency at the wellhead. Given that the value ratio based on the currentprice of crude oil as compared to natural gas is significantly different than the energy equivalency of the 6:1 conversion ratio, utilizing the6:1 conversion ratio may be misleading as an indication of value.
Forward-looking Statements

Reserves and Resources Disclosure
All reserves and resources volumes for NE BC Montney and elsewhere in this presentation are, unless indicated otherwise, asat December 31, 2016 as evaluated by GLJ Petroleum Consultants Ltd. in accordance with the definitions, standards andprocedures contained in the Canadian Oil and Gas Evaluation Handbook and National Instrument 51-101 – Standards forDisclosure for Oil and Gas Activities.
TPIIP, DPIIP and UPIIP have been estimated using a one per cent porosity cut-off for shale gas and tight oil.
Reserves volumes for the NE BC Montney and elsewhere in this presentation are, unless indicated otherwise, Proved plusProbable, while the resource categories for NE BC Montney in this presentation are “Best Estimates.” “NE BC Montney”includes lands in Pouce Coupe, Alberta.
All reserves and resources volumes for NE BC Montney and elsewhere in this presentation are company gross.
Gas volumes are “sales” for reserves and resource and raw gas for DPIIP and TPIIP.
The tight oil DPIIP is a stock tank barrel.
All DPIIP and TPIIP other than cumulative production, reserves, Economic Contingent Resources and Prospective Resourceshave been categorized as unrecoverable.
The amount of natural gas and liquids ultimately recovered from ARC’s NE BC Montney resource will be primarily a function ofthe future price of both commodities.
This presentation contains metrics commonly used in the oil and natural gas industry, such as “recycle ratio,” “finding anddevelopment costs,” “finding and development recycle ratio,” “finding, development and acquisition costs,” “operatingnetbacks,” and “reserve life index.” These terms do not have a standardized meaning and may not be comparable to similarmeasures presented by other companies, and therefore should not be used to make such comparisons.

Definitions of Oil and Gas Reserves and Resources
Reserves are estimated remaining quantities of oil and natural gas and related substances anticipated to be recoverable from known accumulations, as of a given date,
based on the analysis of drilling, geological, geophysical and engineering data; the use of established technology; and specified economic conditions, which are generally
accepted as being reasonable. Reserves are classified according to the degree of certainty associated with the estimates as follows:
Proved Reserves are those reserves that can be estimated with a high degree of certainty to be recoverable. It is likely that the actual remaining quantities recovered
will exceed the estimated proved reserves.
Probable Reserves are those additional reserves that are less certain to be recovered than proved reserves. It is equally likely that the actual remaining quantities
recovered will be greater or less than the sum of the estimated proved plus probable reserves.
Possible Reserves are those additional reserves that are less certain to be recovered than probable reserves. It is unlikely that the actual remaining quantities
recovered will exceed the sum of the estimated proved plus probable plus possible reserves.
Resources encompasses all petroleum quantities that originally existed on or within the earth’s crust in naturally occurring accumulations, including Discovered and
Undiscovered (recoverable and unrecoverable) plus quantities already produced. “Total Resources” is equivalent to “Total Petroleum Initially-in-Place”. Resources are
classified in the following categories:
Total Petroleum Initially-In-Place (“TPIIP”) is that quantity of petroleum that is estimated to exist originally in naturally occurring accumulations. It includes that
quantity of petroleum that is estimated, as of a given date, to be contained in known accumulations, prior to production, plus those estimated quantities in
accumulations yet to be discovered.
Discovered Petroleum Initially-In-Place (“DPIIP”) is that quantity of petroleum that is estimated, as of a given date, to be contained in known accumulations prior to
production. The recoverable portion of discovered petroleum initially in place includes production, reserves, and contingent resources; the remainder is unrecoverable.
Contingent Resources are those quantities of petroleum estimated, as of a given date, to be potentially recoverable from known accumulations using established
technology or technology under development but which are not currently considered to be commercially recoverable due to one or more contingencies.
Economic Contingent Resources (“ECR”) are those contingent resources which are currently economically recoverable.
Project Maturity Subclass Development Pending is defined as a contingent resource that has been assigned a high chance of development and the resolution of
final conditions for development are being actively pursued.

Forecast
Definitions of Oil and Gas Reserves and Resources
Project Maturity Subclass Development Unclarified as a contingent resources that requires further appraisal to clarify the potential for development and has been
assigned a lower chance of development until contingencies can be clearly defined.
Undiscovered Petroleum Initially-In-Place (“UPIIP”) is that quantity of petroleum that is estimated, on a given date, to be contained in accumulations yet to be
discovered. The recoverable portion of undiscovered petroleum initially in place is referred to as “prospective resources” and the remainder as “unrecoverable.”
Prospective Resources are those quantities of petroleum estimated, as of a given date, to be potentially recoverable from undiscovered accumulations by application
of future development projects.
Unrecoverable is that portion of DPIIP and UPIIP quantities which is estimated, as of a given date, not to be recoverable by future development projects. A portion of
these quantities may become recoverable in the future as commercial circumstances change or technological developments occur; the remaining portion may never be
recovered due to the physical/chemical constraints represented by subsurface interaction of fluids and reservoir rocks.
Uncertainty Ranges are described by the Canadian Oil and Gas Evaluation Handbook as low, best, and high estimates for reserves and resources as follows:
Low Estimate: This is considered to be a conservative estimate of the quantity that will actually be recovered. It is likely that the actual remaining quantities recovered
will exceed the low estimate. If probabilistic methods are used, there should be at least a 90 percent probability (P90) that the quantities actually recovered will equal or
exceed the low estimate.
Best Estimate: This is considered to be the best estimate of the quantity that will actually be recovered. It is equally likely that the actual remaining quantities
recovered will be greater or less than the best estimate. If probabilistic methods are used, there should be at least a 50 percent probability (P50) that the quantities
actually recovered will equal or exceed the best estimate.
High Estimate: This is considered to be an optimistic estimate of the quantity that will actually be recovered. It is unlikely that the actual remaining quantities recovered
will exceed the high estimate. If probabilistic methods are used, there should be at least a 10 percent probability (P10) that the quantities actually recovered will equal
or exceed the high estimate.

Non-GAAP Measures
Throughout this presentation, ARC uses the terms operating netback (“netback”) to analyze financial and operatingperformance. This non-GAAP measure presented does not have any standardized meaning prescribed by GAAP and thereforemay not be comparable with the calculation of similar measures for other entities. ARC feels that this non-GAAP measure is akey industry benchmark of performance for ARC and provide investors with information that is commonly used by other oil andgas companies.
Netback
Netback is a common non-GAAP metric used in the oil and gas industry. This measurement assists Management and investorsin evaluating operating results on a per boe basis to better analyze performance on a comparable basis. A calculation ofnetback is disclosed within ARC’s MD&A.

This presentation contains forward-looking information and statements that may be identified by words like “outlook”,“estimates” and similar expressions. These forward-looking statements are based on certain assumptions that involve a numberof risks and uncertainties and are not guarantees of future performance. Reference is made to the section titled “Forward-looking Statements” at the beginning of the presentation and also to the February 8, 2017 news release entitled, “ARCResources Ltd. Announces Fourth Quarter and Year-end 2016 Results as It Increases Capital Investment in ARC’s Multi-year,Large-scale Development Projects at Dawson, Parkland/Tower, and Sunrise” which may be found on ARC’s website atwww.arcresources.com or on SEDAR at www.sedar.com and which are hereby incorporated by reference in this presentationand which outline a number of assumptions, risks and uncertainties associated with forward-looking statements. Actual resultscould differ materially as a result of changes to ARC’s plans, the impact of changes in commodity prices, general economic,market and business conditions as well as production, development and operating performance and other risks associated withoil and gas operations.
For further information about ARC Resources Ltd. please visit our website www.arcresources.com
Or contact:Investor RelationsE-mail: [email protected] 403.503.8600Toll Free 1.888.272.4900F 403.509.6417ARC Resources Ltd.1200, 308 – 4th Avenue SWCalgary, AB T2P 0H7