Embed Size (px)
Citation preview

UC 2006 Tech SessionUC 2006 Tech Session11
ArcGIS ArcMap: Making Professional ArcGIS ArcMap: Making Professional Quality Thematic Maps Quality Thematic Maps
Charlie Frye, ESRI RedlandsCharlie Frye, ESRI RedlandsAileen Buckley, ESRI RedlandsAileen Buckley, ESRI Redlands
UC 2006 Tech SessionUC 2006 Tech Session22
ArcGIS ArcMap: Making Professional ArcGIS ArcMap: Making Professional Quality Thematic MapsQuality Thematic Maps
Charlie Frye, ESRI RedlandsCharlie Frye, ESRI RedlandsAileen Buckley, ESRI RedlandsAileen Buckley, ESRI Redlands

UC 2006 Tech SessionUC 2006 Tech Session33
Key ConceptsKey Concepts
•• Visual ClarityVisual Clarity•• BasemapBasemap layers vs. operational or focus layerslayers vs. operational or focus layers
–– BasemapBasemap should be:should be:•• CorrectCorrect•• UnobtrusiveUnobtrusive•• MinimalisticMinimalistic
–– Operational or Focus layer should be:Operational or Focus layer should be:•• ObviousObvious•• Makes your point graphically (legend should explain, not define)Makes your point graphically (legend should explain, not define)
•• Graphical ProfessionalismGraphical Professionalism–– Cartographic Representation examplesCartographic Representation examples–– Color choices that reinforce visual hierarchy and variablesColor choices that reinforce visual hierarchy and variables

UC 2006 Tech SessionUC 2006 Tech Session44
Thematic MapsThematic Maps
•• A map related to a topic, theme or subject A map related to a topic, theme or subject –– these maps these maps emphasize a single topicemphasize a single topic
•• A map showing statistical rather than topographical A map showing statistical rather than topographical information about a placeinformation about a place

UC 2006 Tech SessionUC 2006 Tech Session55
ExamplesExamples

UC 2006 Tech SessionUC 2006 Tech Session66
•• Historic TimberHistoric Timber•• FarmlandsFarmlands•• Cattle and CropsCattle and Crops•• Specialty Crops and WineSpecialty Crops and Wine•• Energy SourcesEnergy Sources•• Energy Distribution Energy Distribution •• Development of the Road NetworkDevelopment of the Road Network•• Highway TrafficHighway Traffic•• Railroads Railroads •• Public Transportation and AirportsPublic Transportation and Airports•• Ports and TradePorts and Trade•• Tourism & RecreationTourism & Recreation
•• Economic SectorsEconomic Sectors•• LaborLabor•• Public Sector EmploymentPublic Sector Employment•• Taxation, Revenue and the LotteryTaxation, Revenue and the Lottery•• ManufacturingManufacturing•• Lumber and Wood ProductsLumber and Wood Products•• High TechnologyHigh Technology•• Business ActivityBusiness Activity•• International InvestmentsInternational Investments•• Public LandsPublic Lands•• Land OwnershipLand Ownership•• ZoningZoning•• Minerals and MiningMinerals and Mining•• FisheriesFisheries
•• Landforms: ElevationLandforms: Elevation•• Landforms: Shaded ReliefLandforms: Shaded Relief•• Cross SectionsCross Sections•• Ice Age GlaciersIce Age Glaciers•• Ice Age Lakes and FloodsIce Age Lakes and Floods•• VolcanoesVolcanoes•• EarthquakesEarthquakes•• LandslidesLandslides•• GeologyGeology•• Geologic AgesGeologic Ages•• Geologic EvolutionGeologic Evolution•• Soil OrdersSoil Orders•• Soil SubordersSoil Suborders•• Soil InterpretationsSoil Interpretations•• Annual PrecipitationAnnual Precipitation•• Monthly PrecipitationMonthly Precipitation•• Monthly TemperatureMonthly Temperature
•• Climatic Indicators and ProjectionsClimatic Indicators and Projections•• RiversRivers•• Stream FlowStream Flow•• LakesLakes•• Drainage BasinsDrainage Basins•• Water Quality and DamsWater Quality and Dams•• Protected AreasProtected Areas•• EcoregionsEcoregions•• Threatened and Endangered SpeciesThreatened and Endangered Species•• HabitatHabitat•• Habitat Legend, Vegetation IntroHabitat Legend, Vegetation Intro•• Vegetation: NW, NE, SW, SEVegetation: NW, NE, SW, SE•• Vegetation LegendVegetation Legend
Human Geography TopicsHuman Geography Topics
•• Oregon in the WorldOregon in the World•• Location and RoutesLocation and Routes•• Historic MapsHistoric Maps•• IndiansIndians•• Exploration: 1800Exploration: 1800--18451845•• Oregon TrailOregon Trail•• Epidemics, Wars and ReservationsEpidemics, Wars and Reservations•• Donation Land Claims, Public Land Donation Land Claims, Public Land
SurveySurvey•• BoundariesBoundaries•• Land GrantsLand Grants•• Place NamesPlace Names•• County PopulationsCounty Populations•• Cities: 1860Cities: 1860--20002000•• Historic PortlandHistoric Portland•• Willamette Valley PopulationWillamette Valley Population•• Population Growth and DensityPopulation Growth and Density
•• Age and SexAge and Sex•• ImmigrationImmigration•• Race and EthnicityRace and Ethnicity•• IncomeIncome•• ReligionReligion•• PoliticsPolitics•• School DistrictsSchool Districts•• EducationEducation•• Colleges and UniversitiesColleges and Universities•• Crime and PrisonsCrime and Prisons•• Health CareHealth Care•• Newspapers and BroadcastingNewspapers and Broadcasting•• European Exploration to 1800European Exploration to 1800
Economic TopicsEconomic TopicsNatural Environment TopicsNatural Environment Topics

UC 2006 Tech SessionUC 2006 Tech Session77
Presentation outlinePresentation outline
•• Choropleth mapsChoropleth maps•• Graduated Symbol mapsGraduated Symbol maps•• Proportional Symbol mapsProportional Symbol maps•• Multivariate mapsMultivariate maps•• Line width mapsLine width maps•• Prism mapsPrism maps
UC 2006 Tech SessionUC 2006 Tech Session88
Choropleth mapsChoropleth maps
•• Transparent vignettesTransparent vignettes•• Custom legend design Custom legend design –– longer legend box areas to longer legend box areas to
denote amount of data in classesdenote amount of data in classes•• Text Text –– black and white in areasblack and white in areas•• Drop shadowsDrop shadows•• Custom color rampsCustom color ramps•• Small multiplesSmall multiples
•• Choropleth map example (single symbol Choropleth map example (single symbol –– p. 87)p. 87)

UC 2006 Tech SessionUC 2006 Tech Session99
Graduated Symbol mapsGraduated Symbol maps
•• Variable depth maskingVariable depth masking•• Custom legend design Custom legend design –– CindyCindy’’s histogram methods histogram method•• Leader linesLeader lines•• Background hillshadesBackground hillshades

UC 2006 Tech SessionUC 2006 Tech Session1010
Proportional Symbol mapsProportional Symbol maps
•• TablesTables•• Extent rectanglesExtent rectangles•• Custom legend design or NO legend but lots of textCustom legend design or NO legend but lots of text•• Drop shadowsDrop shadows•• 3D symbols3D symbols
•• Proportional Symbol map examples (p. 74 for background Proportional Symbol map examples (p. 74 for background info, 3D symbols p. 80)info, 3D symbols p. 80)

UC 2006 Tech SessionUC 2006 Tech Session1111
Multivariate mapsMultivariate maps
•• Custom legend design Custom legend design –– pie chart legend = total area pie chart legend = total area valuesvalues
•• Paragraph textParagraph text•• 4 color theorem4 color theorem
•• Multivariate maps examples (pie charts, bar charts, Multivariate maps examples (pie charts, bar charts, combined methods) (cubes with colors p. 74; bar charts p. combined methods) (cubes with colors p. 74; bar charts p. 74; prop symbols and colors p. 76)74; prop symbols and colors p. 76)

UC 2006 Tech SessionUC 2006 Tech Session1212
Line width mapsLine width maps
•• Symbol level drawingSymbol level drawing
•• Line width map examples (p. 106, changing the width to Line width map examples (p. 106, changing the width to equal the value)equal the value)

UC 2006 Tech SessionUC 2006 Tech Session1313
Prism mapsPrism maps
•• Border shadowsBorder shadows•• Perspective view parameters (angle, azimuth)Perspective view parameters (angle, azimuth)•• Z factorZ factor•• 3D symbols3D symbols
•• Prism map examples Prism map examples –– Alex Alex TaitTait’’ss Sports AtlasSports Atlas

UC 2006 Tech SessionUC 2006 Tech Session1414
Other thingsOther things
•• Feature outline masks Feature outline masks –– Tom PattersonTom Patterson’’s effect for s effect for transparency behind text on mapstransparency behind text on maps
•• Flow arrow map Flow arrow map –– produced manuallyproduced manually•• Prism mapsPrism maps•• Drop shadowsDrop shadows•• Change perspectiveChange perspective•• Perspective view mapsPerspective view maps•• Multivariate mapsMultivariate maps•• Adding charts and tablesAdding charts and tables•• Dot density to show tree patternsDot density to show tree patterns

UC 2006 Tech SessionUC 2006 Tech Session1515
World thematic mapWorld thematic map
•• Show the labeling for the graticule and how you slice the Show the labeling for the graticule and how you slice the lines to show where you want the labelslines to show where you want the labels
•• Show the calc statement to Show the calc statement to densifydensify the lines so they bend the lines so they bend when you project themwhen you project them
UC 2006 Tech SessionUC 2006 Tech Session1616
Dasymetric MappingDasymetric Mapping
•• The dasymetric map is a method of The dasymetric map is a method of thematic mappingthematic mapping, which uses areal symbols to , which uses areal symbols to spatially classify volumetric data. The method was developed andspatially classify volumetric data. The method was developed and named by named by TyanTyan--ShanskyShansky and popularized by and popularized by J.K. WrightJ.K. Wright..
•• Cartographers use dasymetric mapping for population density overCartographers use dasymetric mapping for population density over other methods other methods because of its ability to realistically place data over geographbecause of its ability to realistically place data over geography. Similar to y. Similar to choropleth choropleth mapsmaps, a dasymetric map utilizes standardized data, but places areal , a dasymetric map utilizes standardized data, but places areal symbols by taking symbols by taking into consideration actual changing densities with in the boundarinto consideration actual changing densities with in the boundaries of the map. To do ies of the map. To do this, ancillary information is acquired, which means the cartogrthis, ancillary information is acquired, which means the cartographer steps statistical apher steps statistical data according to extra information collected within the boundardata according to extra information collected within the boundary. If appropriately y. If appropriately approached it is far superior to choropleth maps in relaying staapproached it is far superior to choropleth maps in relaying statistical data within areas tistical data within areas of interest. Dasymetric mapping corrects for error, termed `of interest. Dasymetric mapping corrects for error, termed `ecological fallacyecological fallacy', that may ', that may occur with choropleth mapping.occur with choropleth mapping.
•• Like other forms of thematic mapping, the dasymetric method was Like other forms of thematic mapping, the dasymetric method was created and created and historically used because of the need for accurate visualizationhistorically used because of the need for accurate visualization methods of population methods of population data. Dasymetric maps are not widely used because of the difficudata. Dasymetric maps are not widely used because of the difficulty in producing them lty in producing them with automated tools such as with automated tools such as Geographic Information SystemsGeographic Information Systems. Although fields such as . Although fields such as public health still rely on choropleth maps, dasymetric maps arepublic health still rely on choropleth maps, dasymetric maps are becoming more becoming more prevalent in developing fields, such as conservation and sustainprevalent in developing fields, such as conservation and sustainable development. able development. Researchers in various fields of science are pushing the way forResearchers in various fields of science are pushing the way for use of souse of so--called called critical GIScritical GIS and to make dasymetric mapping techniques more easily applicabland to make dasymetric mapping techniques more easily applicable with e with modern technology.modern technology.
•• (From (From WikipediaWikipedia))
UC 2006 Tech SessionUC 2006 Tech Session1717
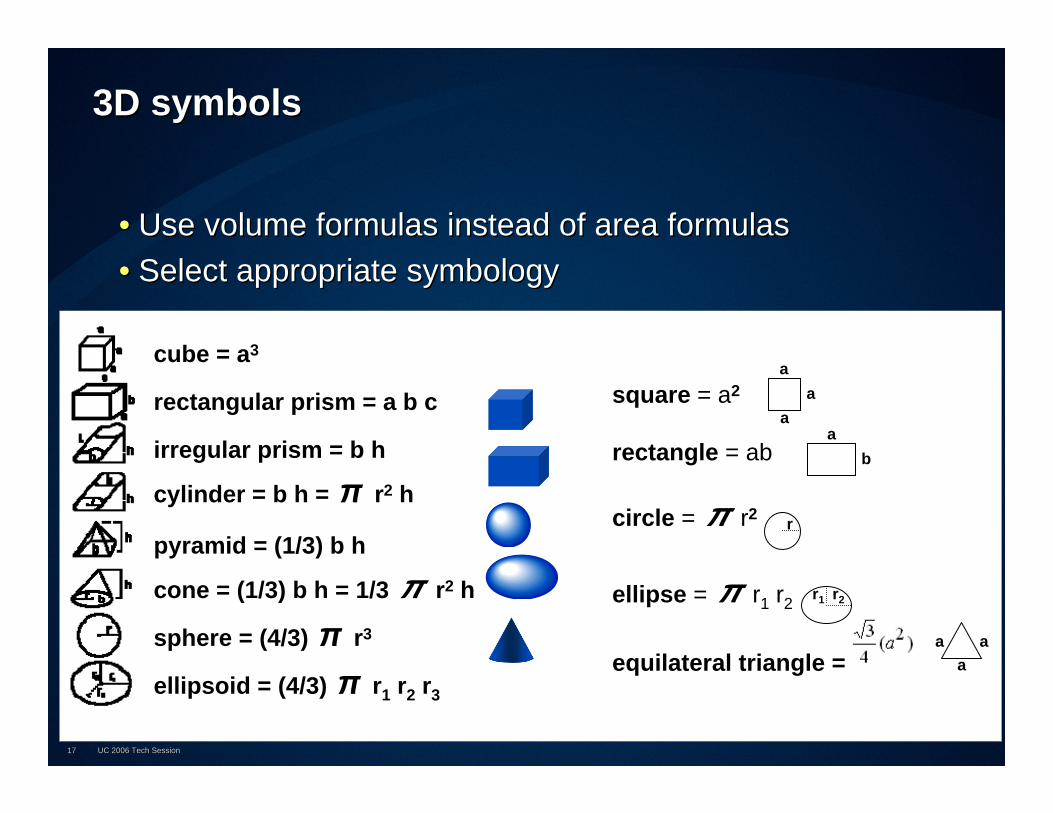
3D symbols3D symbols
•• Use volume formulas instead of area formulasUse volume formulas instead of area formulas•• Select appropriate symbologySelect appropriate symbology
square = a2
rectangle = ab
circle = π r2
ellipse = π r1 r2
equilateral triangle =
cube = a3
rectangular prism = a b c
irregular prism = b h
cylinder = b h = π r2 h
pyramid = (1/3) b h
cone = (1/3) b h = 1/3 π r2 h
sphere = (4/3) π r3
ellipsoid = (4/3) π r1 r2 r3
aa
a
r
ba
r2r1
aa
a

UC 2006 Tech SessionUC 2006 Tech Session1818
2004 Comparison of Energy Production and 2004 Comparison of Energy Production and Consumption MapConsumption Map
•• Overview/Goal:Overview/Goal:–– Three variables: Three variables:
•• Energy Consumption: 3D Energy Consumption: 3D Graduated SymbolGraduated Symbol
•• Energy Production: 3D Energy Production: 3D Graduated SymbolGraduated Symbol
•• Population: Population: ChoroplethChoropleth–– Two Visualizations:Two Visualizations:
•• MapMap•• GraphGraph
–– One map with One map with ““Visual PopVisual Pop””and and ““Graphical PanacheGraphical Panache””
UC 2006 Tech SessionUC 2006 Tech Session1919
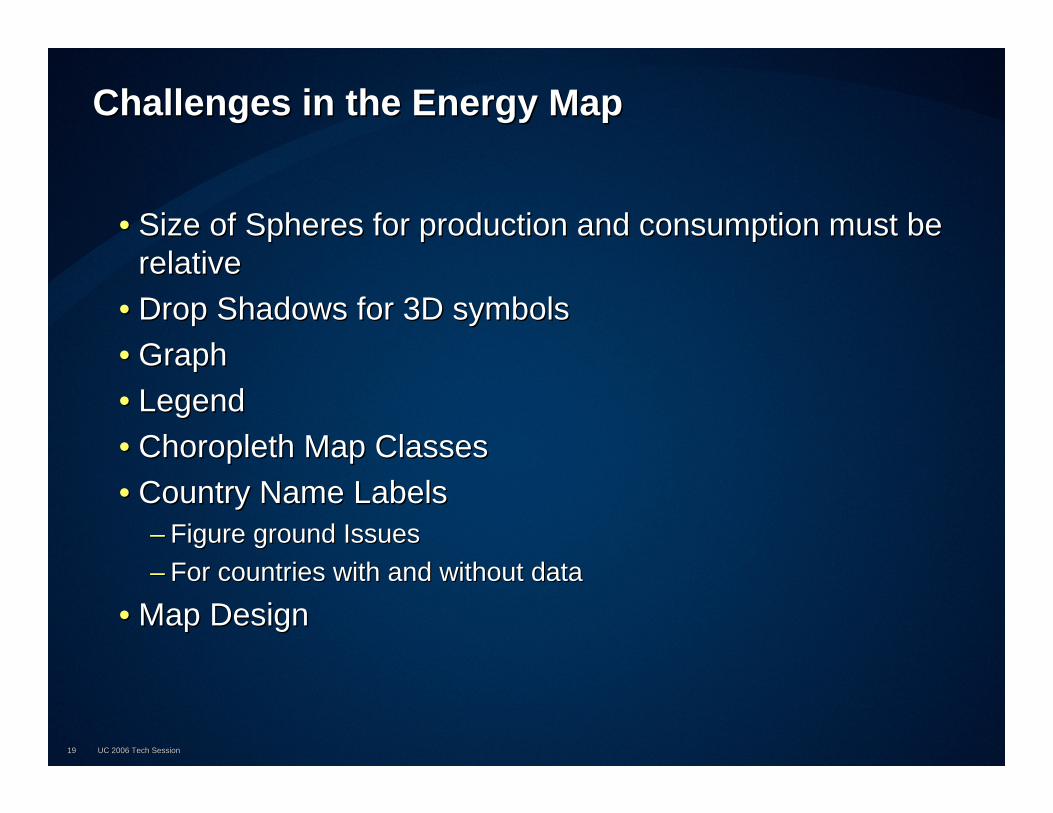
Challenges in the Energy MapChallenges in the Energy Map
•• Size of Spheres for production and consumption must be Size of Spheres for production and consumption must be relativerelative
•• Drop Shadows for 3D symbolsDrop Shadows for 3D symbols•• GraphGraph•• LegendLegend•• ChoroplethChoropleth Map ClassesMap Classes•• Country Name LabelsCountry Name Labels
–– Figure ground IssuesFigure ground Issues–– For countries with and without dataFor countries with and without data
•• Map DesignMap Design

UC 2006 Tech SessionUC 2006 Tech Session2020
Challenge #1: Relative Size, Spheres vs. CirclesChallenge #1: Relative Size, Spheres vs. Circles
•• Scaling Spherical SymbolsScaling Spherical Symbols––Spheres are volumes or cubic measuresSpheres are volumes or cubic measures––ArcMap symbols are sized linearly (vs. geometric or ArcMap symbols are sized linearly (vs. geometric or
cubic)cubic)
––4/34/3ππrr33 …… or r = or r = (([<field>](([<field>] / 3.141592) * 0.75)^(1/3)/ 3.141592) * 0.75)^(1/3)
––ππrr2 2 …… or r = or r = ([<field>]([<field>] / 3.141592)^(1/2)/ 3.141592)^(1/2)
UC 2006 Tech SessionUC 2006 Tech Session2121
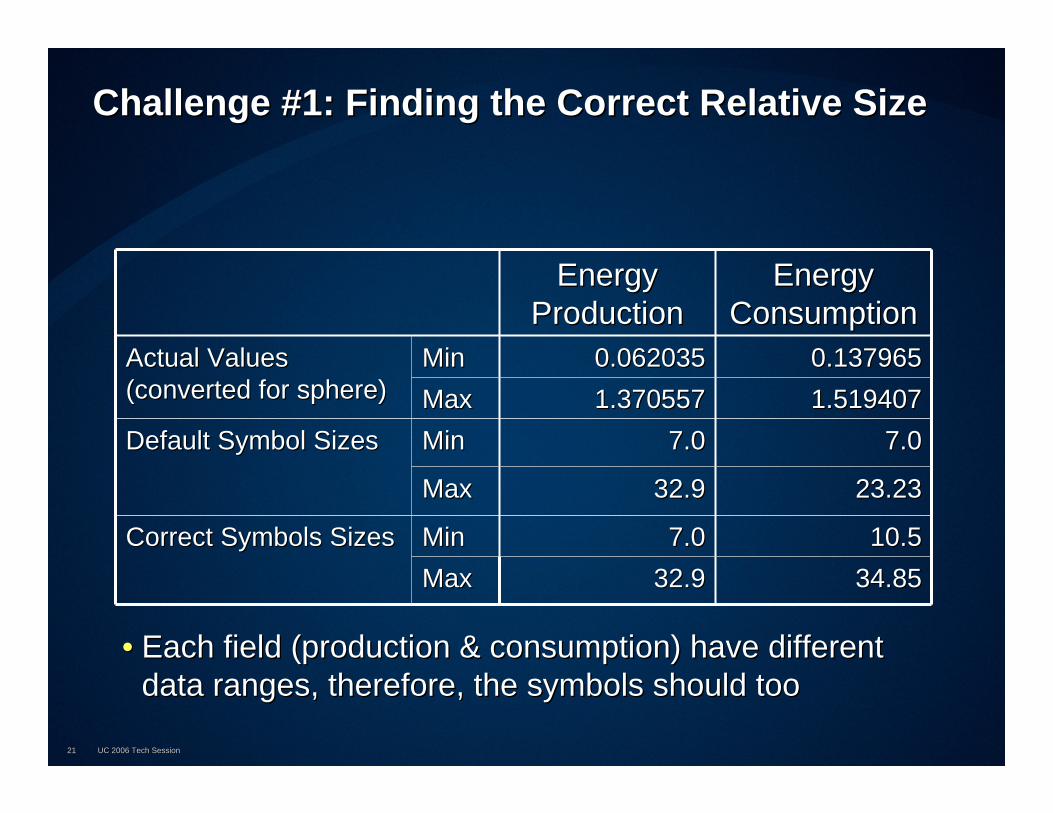
Challenge #1: Finding the Correct Relative Size Challenge #1: Finding the Correct Relative Size
•• Each field (production & consumption) have different Each field (production & consumption) have different data ranges, therefore, the symbols should toodata ranges, therefore, the symbols should too
MaxMaxMinMin
MaxMax
MinMinMaxMaxMinMin 0.1379650.1379650.0620350.062035Actual Values Actual Values
(converted for sphere)(converted for sphere) 1.5194071.5194071.3705571.3705577.07.07.07.0Default Symbol SizesDefault Symbol Sizes
34.8534.8532.932.910.510.57.07.0Correct Symbols SizesCorrect Symbols Sizes
23.2323.2332.932.9
Energy Energy ConsumptionConsumption
Energy Energy ProductionProduction

UC 2006 Tech SessionUC 2006 Tech Session2222
Challenge #1: Finding the Correct Relative Size Challenge #1: Finding the Correct Relative Size
•• Each field (production & consumption) have different Each field (production & consumption) have different data ranges, therefore, the symbols should toodata ranges, therefore, the symbols should too
MaxMaxMinMin
MaxMax
MinMinMaxMaxMinMin 0.1379650.1379650.0620350.062035Actual Values Actual Values
(converted for sphere)(converted for sphere) 1.5194071.5194071.3705571.3705577.07.07.07.0Default Symbol SizesDefault Symbol Sizes
34.8534.8532.932.910.510.57.07.0Correct Symbols SizesCorrect Symbols Sizes
23.2323.2332.932.9
Energy Energy ConsumptionConsumption
Energy Energy ProductionProduction

UC 2006 Tech SessionUC 2006 Tech Session2323
Challenge #1: Finding the Correct Relative SizeChallenge #1: Finding the Correct Relative Size
Set proportional symbology for field with the range that has Set proportional symbology for field with the range that has the smallest nonthe smallest non--zero valuezero value–– If the other field has values that are significantly larger thanIf the other field has values that are significantly larger than the the
highest value in this field, then trend to smaller symbolshighest value in this field, then trend to smaller symbols–– Convert to graphicsConvert to graphics–– Get the symbols that correspond the two values on either side ofGet the symbols that correspond the two values on either side of
the smallest value in the second table and graph thisthe smallest value in the second table and graph this
Red dot, is atRed dot, is atsize for smallest size for smallest symbol in the symbol in the other layerother layer
UC 2006 Tech SessionUC 2006 Tech Session2424
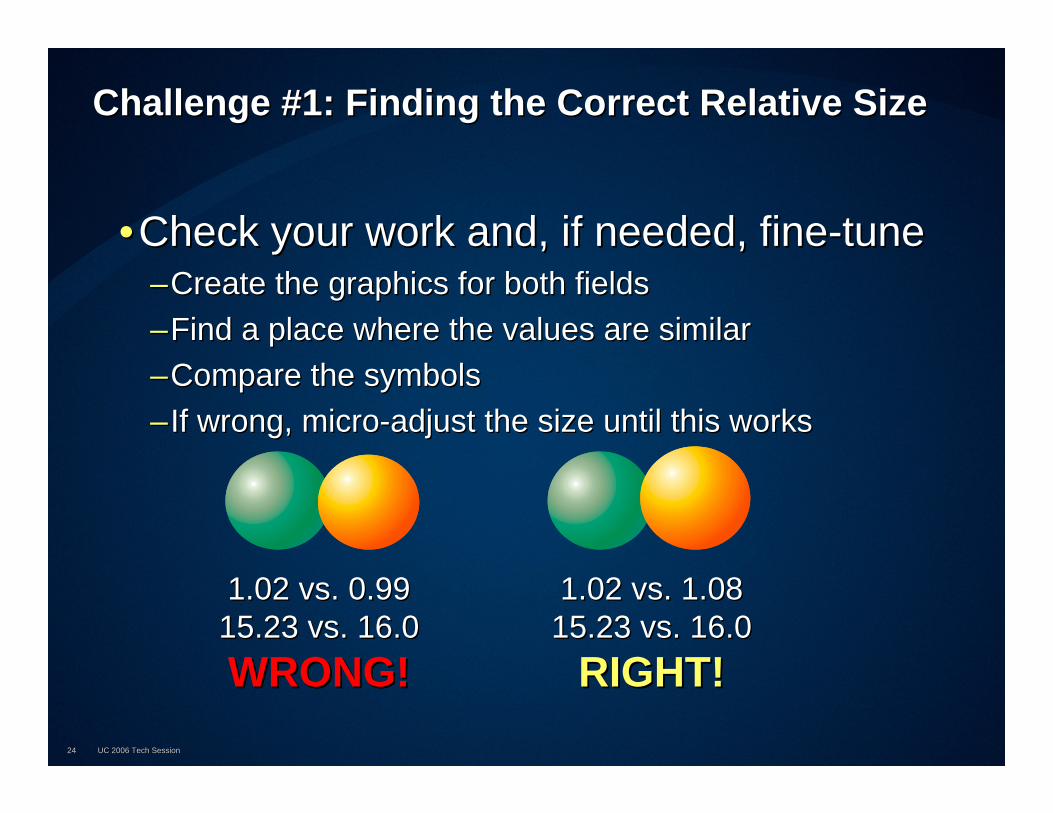
Challenge #1: Finding the Correct Relative SizeChallenge #1: Finding the Correct Relative Size
•• Check your work and, if needed, fineCheck your work and, if needed, fine--tunetune––Create the graphics for both fieldsCreate the graphics for both fields––Find a place where the values are similarFind a place where the values are similar––Compare the symbolsCompare the symbols––If wrong, microIf wrong, micro--adjust the size until this worksadjust the size until this works
1.02 vs. 0.991.02 vs. 0.9915.23 vs. 16.015.23 vs. 16.0WRONG!WRONG!
1.02 vs. 1.081.02 vs. 1.0815.23 vs. 16.015.23 vs. 16.0
RIGHT!RIGHT!

UC 2006 Tech SessionUC 2006 Tech Session2525
Challenge #2: Drop ShadowsChallenge #2: Drop Shadows
•• Spheres are stored as graphicsSpheres are stored as graphics–– Easy access to size information and for legend constructionEasy access to size information and for legend construction
•• Shadows are on custom feature layers (point)Shadows are on custom feature layers (point)–– So they can have a transparency valueSo they can have a transparency value
•• Edit the position of each sphere and shadow to align Edit the position of each sphere and shadow to align properly.properly.
++
++ ====

UC 2006 Tech SessionUC 2006 Tech Session2626
Challenge #3: GraphChallenge #3: Graph
•• Use ArcGIS 9.2Use ArcGIS 9.2–– The graphing software ESRI licensed has been upgradedThe graphing software ESRI licensed has been upgraded
•• Better graphicsBetter graphics•• Matches ArcGIS ColorsMatches ArcGIS Colors•• Rich editing environmentRich editing environment
–– See the team in the demo areaSee the team in the demo area

UC 2006 Tech SessionUC 2006 Tech Session2727
Challenge #4: Proportional Symbol LegendChallenge #4: Proportional Symbol Legend
•• Copy the largest, smallest, and representative midCopy the largest, smallest, and representative mid--size size sphere for each color out of the data frame and paste into sphere for each color out of the data frame and paste into the layoutthe layout
•• Get their corresponding data values; not the converted Get their corresponding data values; not the converted values, but the raw valuesvalues, but the raw values
•• Arrange the graphicsArrange the graphics

UC 2006 Tech SessionUC 2006 Tech Session2828
Challenge #5: Challenge #5: ChoroplethChoropleth Map ClassesMap Classes
•• Custom field for abbreviated Custom field for abbreviated populationpopulation–– Long IntegerLong Integer–– Calc: [<Calc: [<popfieldpopfield>]/1000000>]/1000000–– Also used for left graph axisAlso used for left graph axis
•• Custom spacing of labelsCustom spacing of labels–– Right Aligned ColumnsRight Aligned Columns
•• Custom legend boundaryCustom legend boundary–– Drawn by hand Drawn by hand –– Copied Copied –– Left AlignedLeft Aligned

UC 2006 Tech SessionUC 2006 Tech Session2929
Challenge #6: Country Name LabelsChallenge #6: Country Name Labels
•• National boundary lines do not intermingle well with textNational boundary lines do not intermingle well with text
UC 2006 Tech SessionUC 2006 Tech Session3030
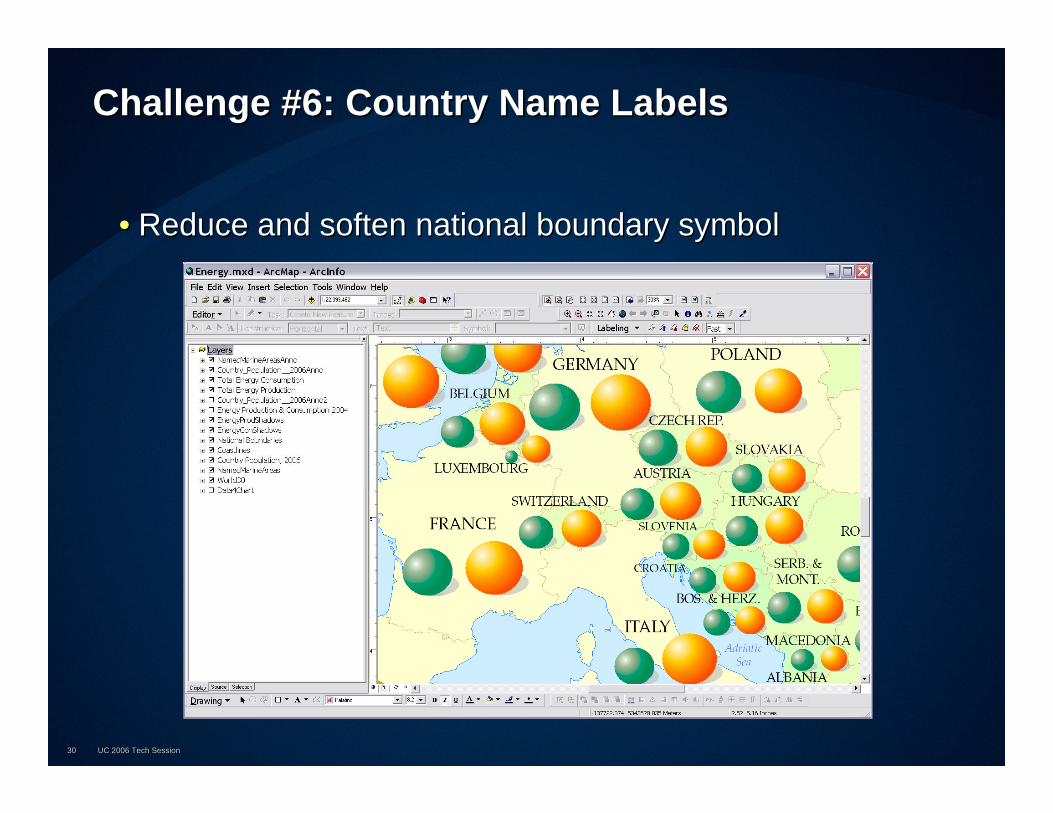
Challenge #6: Country Name LabelsChallenge #6: Country Name Labels
•• Reduce and soften national boundary symbolReduce and soften national boundary symbol
UC 2006 Tech SessionUC 2006 Tech Session3131
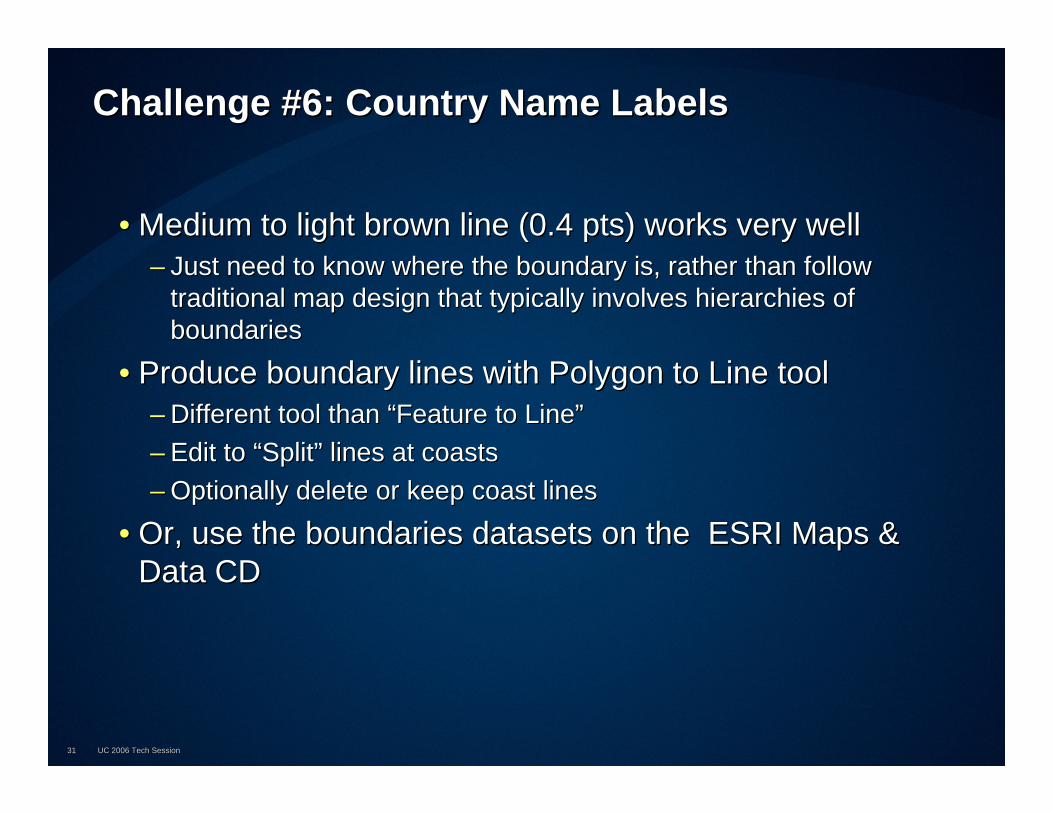
Challenge #6: Country Name LabelsChallenge #6: Country Name Labels
•• Medium to light brown line (0.4 pts) works very wellMedium to light brown line (0.4 pts) works very well–– Just need to know where the boundary is, rather than follow Just need to know where the boundary is, rather than follow
traditional map design that typically involves hierarchies of traditional map design that typically involves hierarchies of boundariesboundaries
•• Produce boundary lines with Polygon to Line tool Produce boundary lines with Polygon to Line tool –– Different tool than Different tool than ““Feature to LineFeature to Line””–– Edit to Edit to ““SplitSplit”” lines at coastslines at coasts–– Optionally delete or keep coast linesOptionally delete or keep coast lines
•• Or, use the boundaries datasets on the ESRI Maps & Or, use the boundaries datasets on the ESRI Maps & Data CDData CD
UC 2006 Tech SessionUC 2006 Tech Session3232
Challenge #7: Map DesignChallenge #7: Map Design
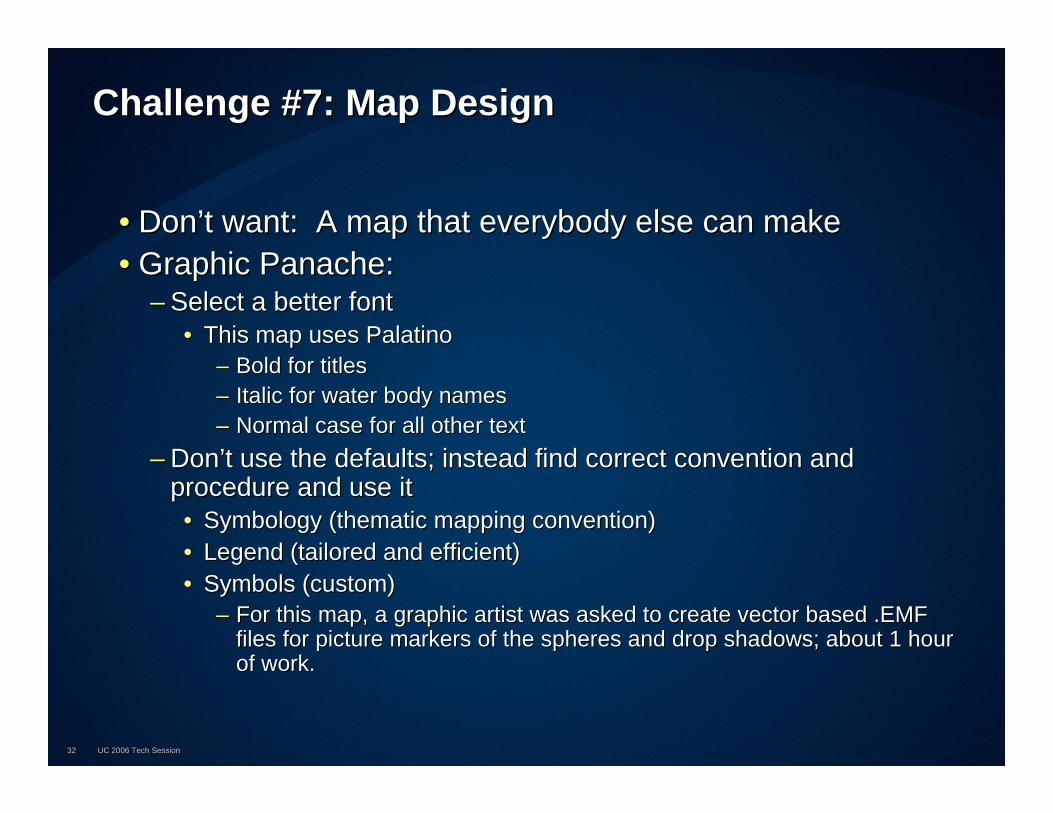
•• DonDon’’t want: A map that everybody else can maket want: A map that everybody else can make•• Graphic Panache:Graphic Panache:
–– Select a better fontSelect a better font•• This map uses PalatinoThis map uses Palatino
–– Bold for titlesBold for titles–– Italic for water body namesItalic for water body names–– Normal case for all other textNormal case for all other text
–– DonDon’’t use the defaults; instead find correct convention and t use the defaults; instead find correct convention and procedure and use itprocedure and use it•• Symbology (thematic mapping convention)Symbology (thematic mapping convention)•• Legend (tailored and efficient)Legend (tailored and efficient)•• Symbols (custom)Symbols (custom)
–– For this map, a graphic artist was asked to create vector based For this map, a graphic artist was asked to create vector based .EMF .EMF files for picture markers of the spheres and drop shadows; aboutfiles for picture markers of the spheres and drop shadows; about 1 hour 1 hour of work.of work.

UC 2006 Tech SessionUC 2006 Tech Session3333
Thank YouThank You
•• Please fill out your surveysPlease fill out your surveys


![ArcGIS(ArcMap)の基本操作 ArcGIS の起動の手順:[スタート] →[すべてのプログラム]→[ArcGIS]→[ArcMap 10] ArcMap のウィンドウ構成 <ツールバーの説明>](https://img.pdfslide.net/doc/110x75/5aed14837f8b9ae5318fc463/arcgisarcmap-arcgis-arcgisarcmap.jpg)