Embed Size (px)
Citation preview

Motivation

ArcGIS Monitor: Why?Optimize Your Enterprise GIS Deployments
• Standard monitoring tools:
- Focus on infrastructure only
- IT controlled
- No ArcGIS components
- Low success of ArcGIS troubleshooting

ArcGIS Monitor: Why?Optimize Your Enterprise GIS Deployments
• Customers need help with:
- resolution time
- performance
- administration
- end-user satisfaction

ArcGIS Monitor: Why? Growing complexity of ArcGIS Enterprise and underlying infrastructure
Certificates
Load balancer
Firewall
ArcGIS Web Adaptor
Portal for ArcGIS
Storage with
immediate consistency
ArcGIS Server
ArcGIS Data Store
Database

ArcGIS Monitor: How?
• End to End monitoring:
- ArcGIS platform
- Underlying infrastructure
• Quickly diagnose:
- Unstable infrastructure
- Overloaded system
- Bottlenecks
• Scalable and non-intrusive
Used by Esri Managed Cloud Services to Monitor 500+ GIS Servers

ArcGIS Monitor: What?A monitoring product that provides:
• Actionable information
- Health
- Usage
- SLA reporting
7

Overload System:• Users
• Services
Identify typical cases

Unstable
Infrastructure:• -Network
-NAS
-VMWare
Identify typical cases

Bottlenecks:• configuration
• maintenance
• workflows
Identify typical cases

Monitoring Enterprise GISChallenges
• Multiple administrators
• Multiple disparate monitoring/diagnostic tools
• Data collected in a reactive fashion: on demand and for limited time
• Correlation of data with different timestamp is difficult
• ArcGIS administrators do not have access to all tools, data and reports
• Challenging to quickly identify the root cause and take appropriate measures
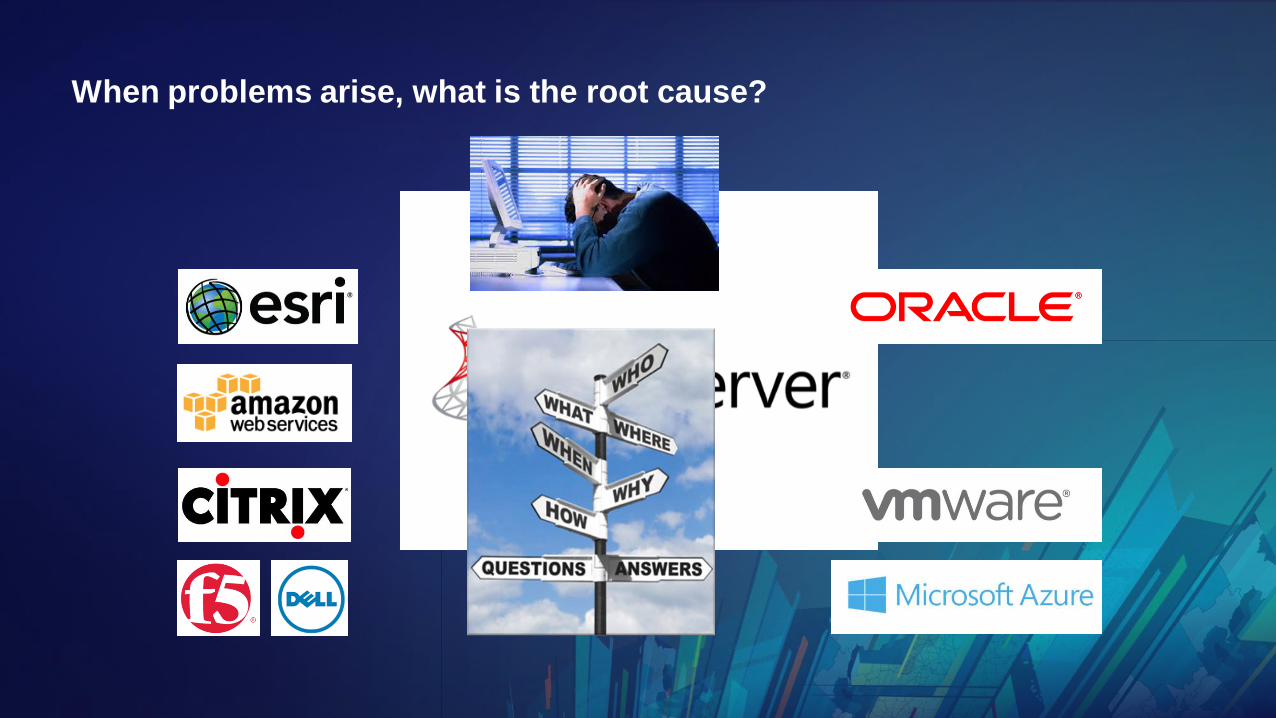
When problems arise, what is the root cause?
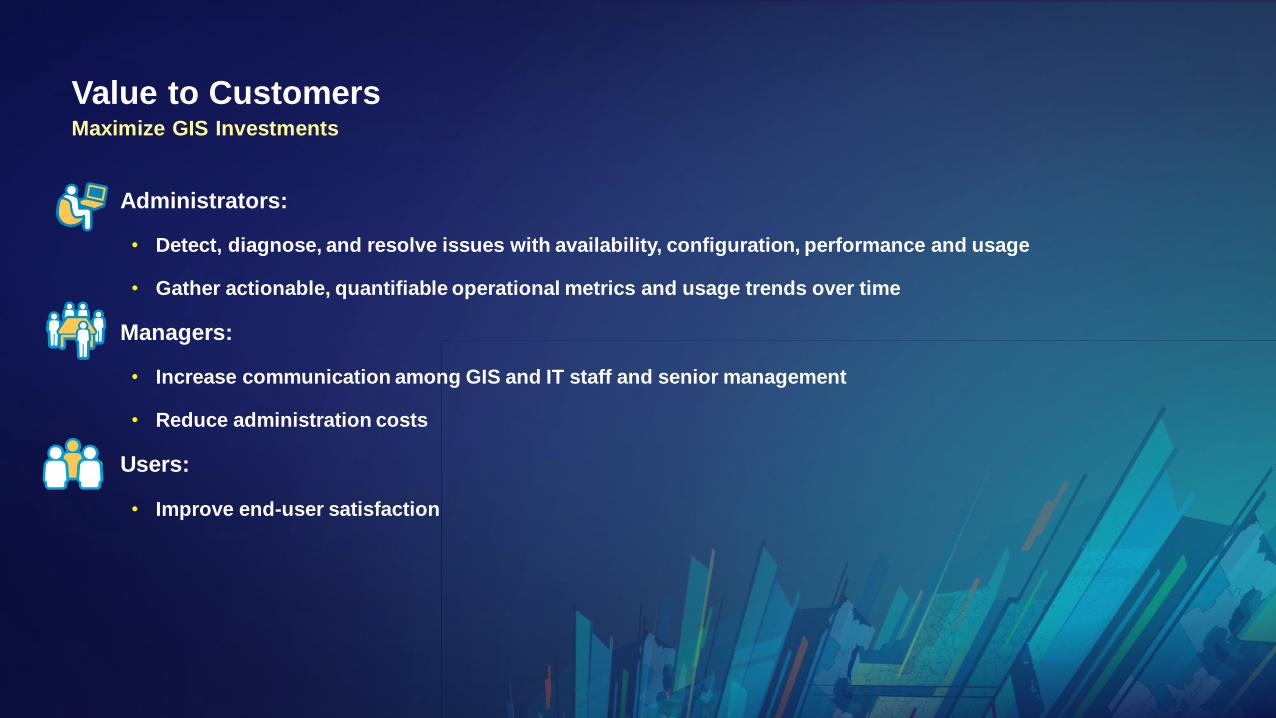
Value to CustomersMaximize GIS Investments
Administrators:
• Detect, diagnose, and resolve issues with availability, configuration, performance and usage
• Gather actionable, quantifiable operational metrics and usage trends over time
• Managers:
• Increase communication among GIS and IT staff and senior management
• Reduce administration costs
• Users:
• Improve end-user satisfaction

Primary audience is enterprise GIS / IT admins
• Users (“patients”)
• GIS / IT admins (“doctors”)
• Esri PS and Tech Support (“specialists”)
Although a novice user can install and configure, this tool is intended to empower experienced GIS / IT Administrators

Installation and Configuration

Planning for ArcGIS Monitor deployment
• Approve MongoDB and other software prerequisites
• Identify environments and solutions to be monitored
• Select deployment option: centralized or distributed
• Prepare credentials and connectivity
• Assign ArcGIS Monitor administrator

Installationhttps://enterprise.arcgis.com/en/monitor/latest/get-started/arcgis-
monitor-system-requirements.htm

Centralized deploymentOn-premises option

Use “local” monitoring services for each “environment”
• Pros:
- One server
- Central admin
• Cons:
- Longer collection times
- CPU spikes when “concurrent” collection on one machine
Do not use one Monitoring Service for all environments
MongoDB
Monitoring
Service
Monitoring
ServiceMonitoring
Service
Monitoring
Service

Distributed deploymentFull stack monitoring

Use “remote” monitoring services for each “environment”Multiple data centers over high latency, but managed from central location.
Users in remote datacenters should remote desktop to central data center to access System Monitor..
MongoDB
Monitoring
Service
Monitoring
Service
Monitoring
Service
Monitoring
Service

Register collection
Add monitoring services
Add counters
Demo:
Administrator1. Register Collection
2. Add monitoring service
3. Add Counters

Resources

Gallery: https://arcgismonitor.maps.arcgis.com
• Tutorials
• Video
• Extensions / Tasks
https://www.arcgis.com/home/group.html?id=58d996e9b40d45439d298d14fa309534&start=1&view=list&sortOrder=asc&sortField=owner#content

KB articleshttps://support.esri.com/en/technical-article/000017474

Categories

Web
• Response Time
• HTTP code

ArcGIS
• Server
• Portal
• GeoEvent
• GeoAnalytics
• ArcSOC Optimizer

GeoAnalytics

Database
• ArcGIS Datastore
• Oracle
• SQL Server
AWS RDS and SQL Azure coming soon

InfrastructureCPU, Memory, Disk, Network, Load Balancer stats

UsageUser stats
• Transactions
• Response Time
• HTTP Codes
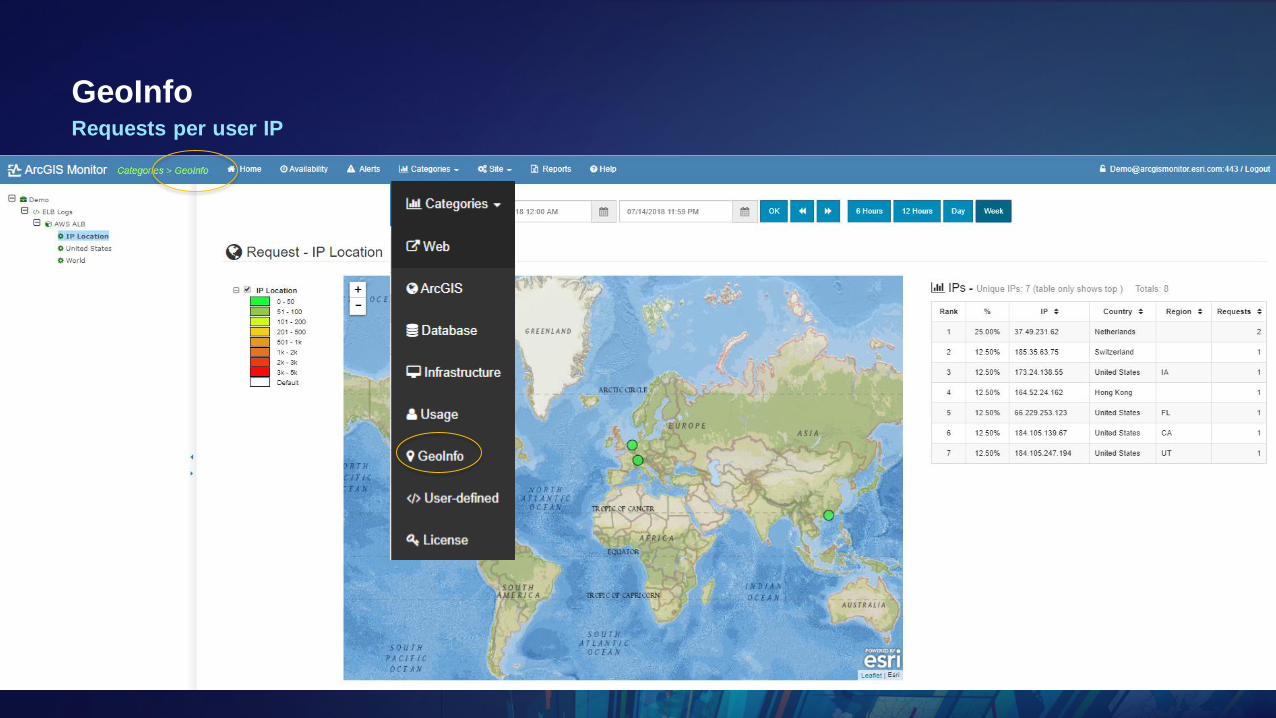
GeoInfoRequests per user IP

Extensions

Gallery: https://arcgismonitor.maps.arcgis.com
• Tutorials
• Video
• Extensions / Tasks

ArcSOC Optimizer
• Decrease or increase instances, based on:
• 1. historical usage
• 2. available memory and process count

ArcSOC OptimizerSetting min / max instances across 100 to 1000s of services
in dynamic environments is challenging

Alerts

Alerts: actionable informationStarting point for troubleshooting
Available in 10.6.1Charts and Stats SourceDetailsAnalyze
alert groups

Charts and stats

Details

Availability

• Availability is usually expressed as a percentage of uptime in a given time span, e.g.
month, year:
• Availability (%)=(Total time – Downtime) / Total Time *100%
Availability % Downtime per year Downtime per monthDowntime per
weekDowntime per day
90% ("one nine") 36.5 days 72 hours 16.8 hours 2.4 hours
95% ("one and a half nines") 18.25 days 36 hours 8.4 hours 1.2 hours
99% ("two nines") 3.65 days 7.20 hours 1.68 hours 14.4 minutes
99.5% ("two and a half nines") 1.83 days 3.60 hours 50.4 minutes 7.2 minutes
99.9% ("three nines") 8.76 hours 43.8 minutes 10.1 minutes 1.44 minutes
99.95% ("three and a half nines") 4.38 hours 21.56 minutes 5.04 minutes 43.2 seconds
99.99% ("four nines") 52.56 minutes 4.38 minutes 1.01 minutes 8.64 seconds
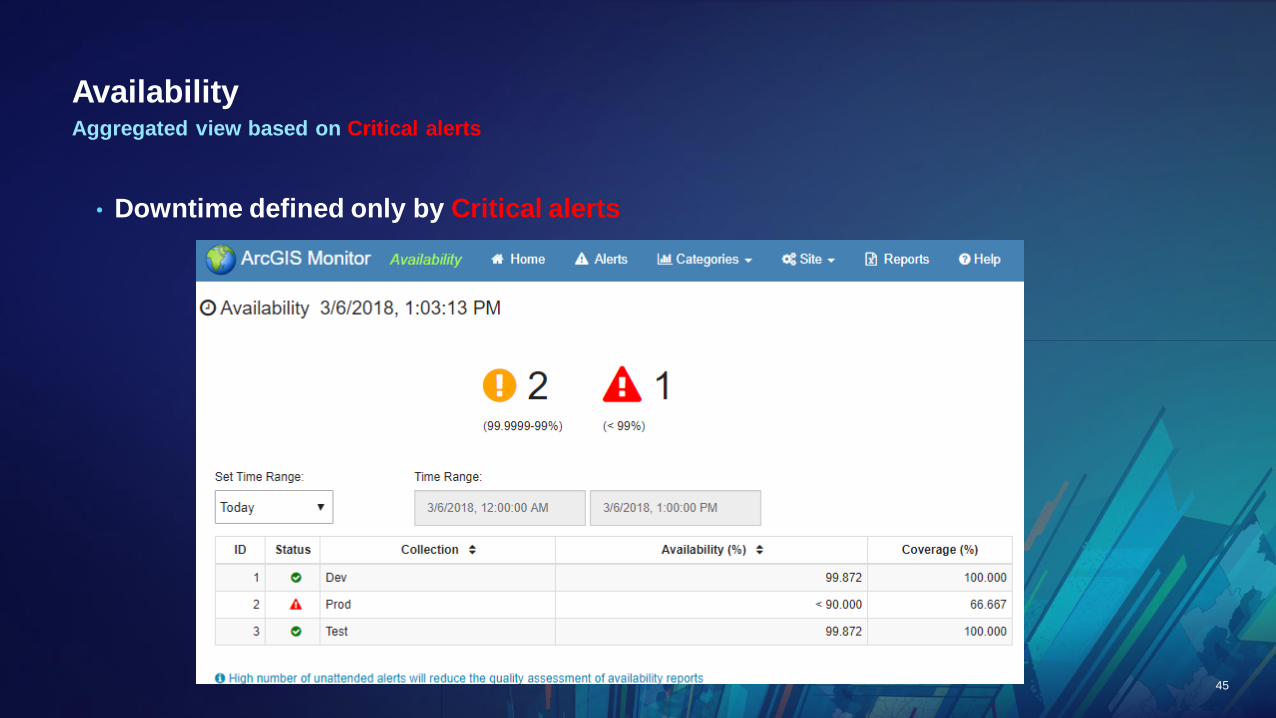
Availability
• Downtime defined only by Critical alerts
Aggregated view based on Critical alerts
45

Use case

Problems: Golf Courses points “disappeared” from a map
47
Golf Courses points
“disappeared”

48
1. Identify “suspect”
component
2. Get details

Analyze error messagesNarrow the search
49
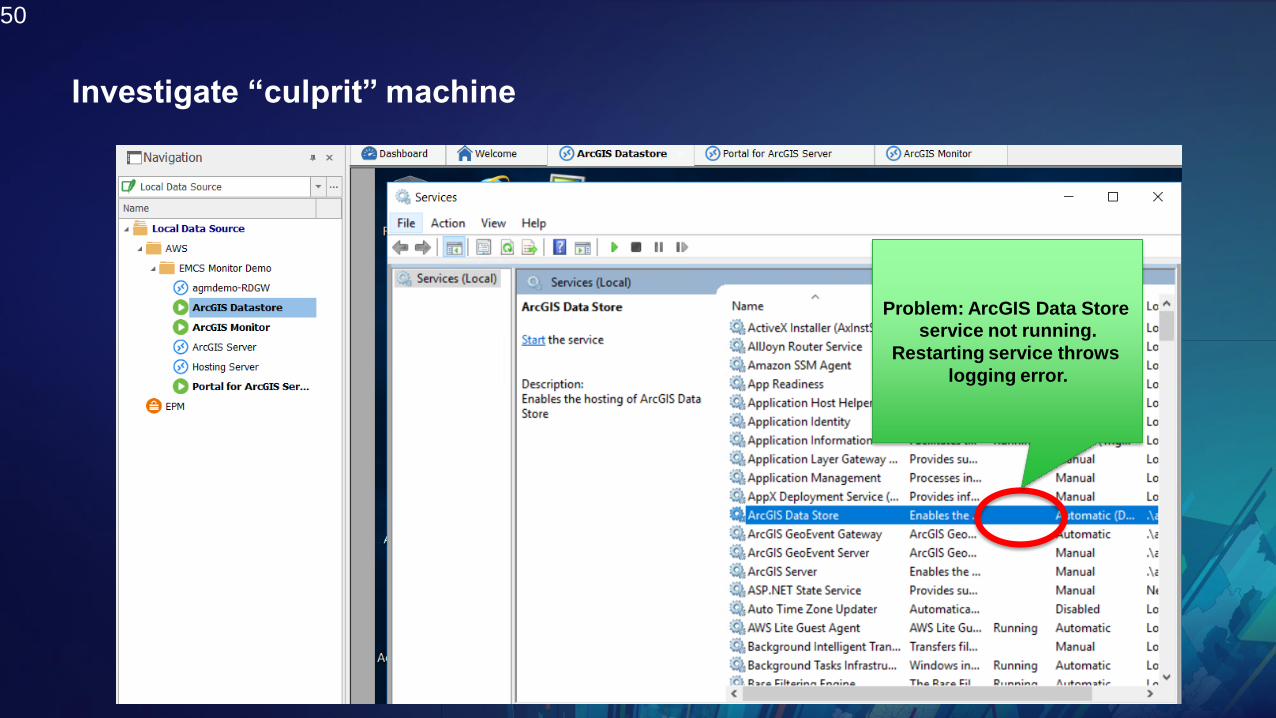
Investigate “culprit” machine
50
Problem: ArcGIS Data Store
service not running.
Restarting service throws
logging error.

Resolve: correct password and start ArcGIS Data Store service
51

Verify resolution
52

arcgismonitor.esri.com demo site as use case
Best practices
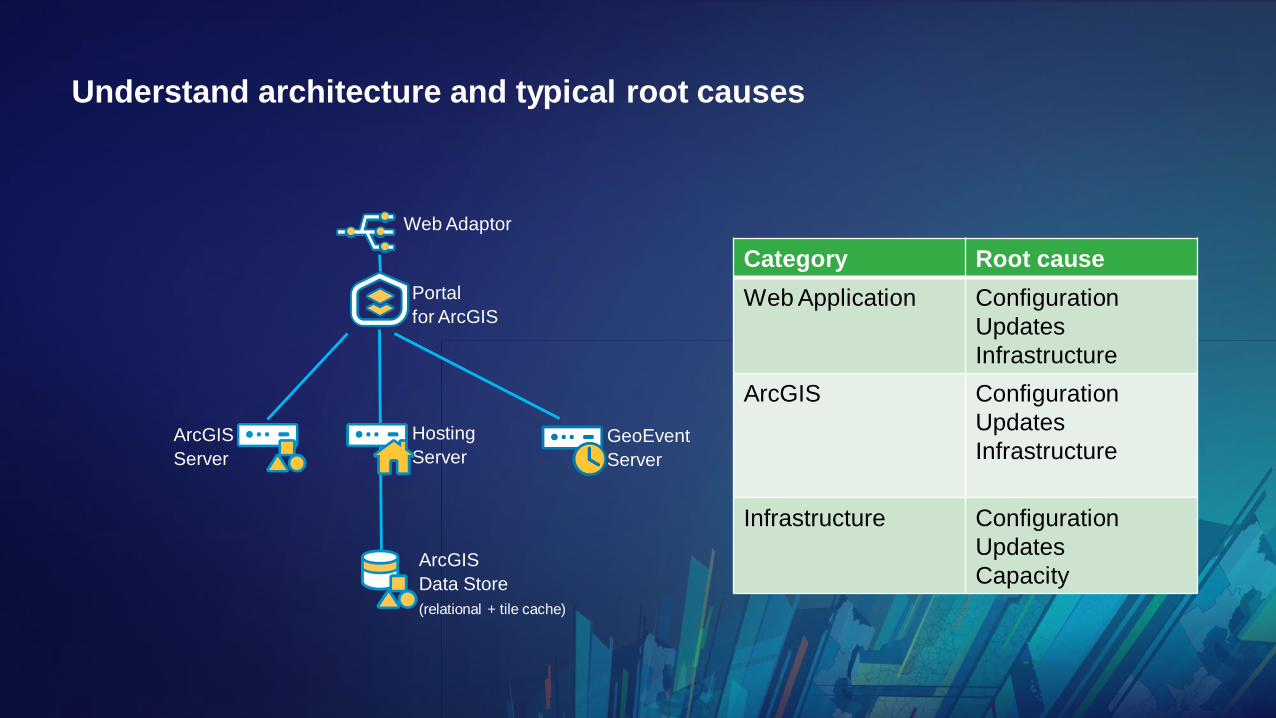
Understand architecture and typical root causes
Portal
for ArcGIS
Hosting
Server
ArcGIS
Data Store
(relational + tile cache)
Web Adaptor
GeoEvent
Server
ArcGIS
Server
Category Root cause
Web Application Configuration
Updates
Infrastructure
ArcGIS Configuration
Updates
Infrastructure
Infrastructure Configuration
Updates
Capacity

Understand Root Cause and Impact analysis: “culprits and victims”“Culprit” - the most downstream failing component
“Victims” – all upstream failing components
Portal
for ArcGIS
Hosting
Server
ArcGIS
Data Store
(relational + tile cache)
Web Adaptor
GeoEvent
Server
ArcGIS
Server
“Victims”
Portal
for ArcGIS
Hosting
Server
ArcGIS
Data Store
(relational + tile cache)
Web Adaptor
ArcGIS
Server
“Victims”
GeoEvent
Server
Example 1 Example 2
“Culprit”
“Culprit”
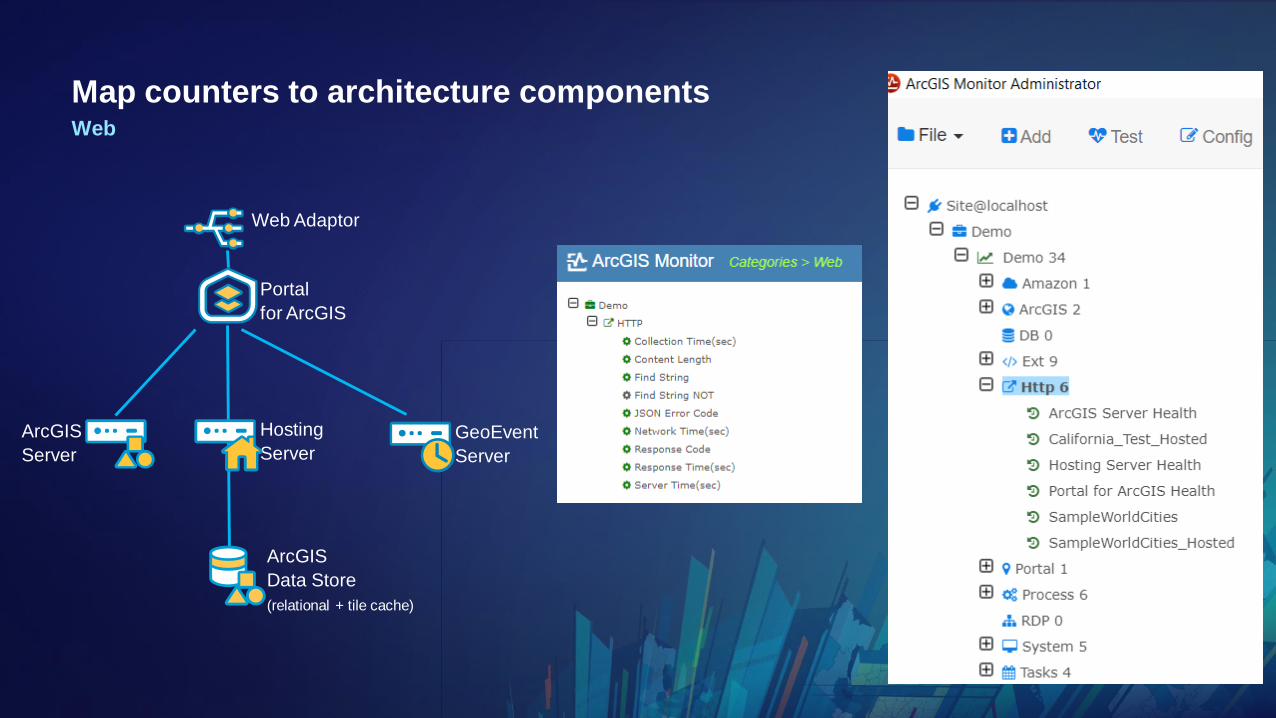
Map counters to architecture componentsWeb
Portal
for ArcGIS
Hosting
Server
ArcGIS
Data Store
(relational + tile cache)
Web Adaptor
GeoEvent
Server
ArcGIS
Server

Map counters to architecture componentsArcGIS
Portal
for ArcGIS
Hosting
Server
ArcGIS
Data Store
(relational + tile cache)
Web Adaptor
GeoEvent
Server
ArcGIS
Server

Map counters to architecture componentsInfrastructure
Portal
for ArcGIS
Hosting
Server
ArcGIS
Data Store
(relational + tile cache)
Web Adaptor
GeoEvent
Server
ArcGIS
Server

Alerts viewarcgismonitor.esri.com demo site

Start with Critical alerts

Identify “culprit” components
Portal
Data Store
ArcGIS Server
GeoEvent
Portal
Hosting Server

Map “victims” to culprit candidatesWeb “Health” are culprit indicators
Victims
Victims
Culprits
Culprits
ArcGIS Server
ArcGIS Server
PortalVictims
Data Store
Portal
Hosting Server
?
Further investigate
SampleWorldCities
performance degradation

See Us Here
• Esri Best Practices:
- Tuning, Testing, and Monitoring
WORKSHOP LOCATION
• Room 01 A/B
• Room 08
TIME FRAME
• Wednesday 7/11/2018
- 02:30 PM - 03:30 PM
• Thursday 7/12/2018
- 04:00 PM - 05:00 PM

Please Take Our Survey on the App
Download the Esri Events
app and find your event
Select the session
you attended
Scroll down to find the
feedback section
Complete answers
and select “Submit”