Embed Size (px)
Citation preview

1
The Aquatic eDNAtlas Project: Field Sampling Grid ArcGIS Online Map Guide Sharon (Parkes) Payne
November 8, 2019 General map notes:
• A Splash Screen appears each time the map opens, allowing users to view this user guide.• If you would like a user guide specifically in preparation of field work, please see the eDNA Sample Site Field Mapping User Guide.• These procedures are predominately for the western U.S. sampling grid, but can be used for the eastern U.S. sampling grid.
Overview
There are Panels along the left of the browser and tools available in the upper left-hand corner of the map under the search bar. Navigating the Map
Legend Panel | Layer List | Print Field Maps | Information |Change Base Map | Add Layer from ArcGIS Online, a URL, or a File
Filter Points | Select Points by circle, rectangle, or polygon| Geoprocessing - download points by Area of Interest | Search Bar
The attribute table is available by selecting the arrow at the bottom of the map and shows all points within the map extent by default. Occasionally, AGOL will not show the table. You can access it by opening the table from the Layer List Panel.
Navigating the Map – general tips
To zoom in and out, use the + or – buttons in the upper-left hand corner of the map or use the scroll on your mouse.
To immediately zoom out to the initial extent, click the “home” button in the upper-left hand corner of the map
2
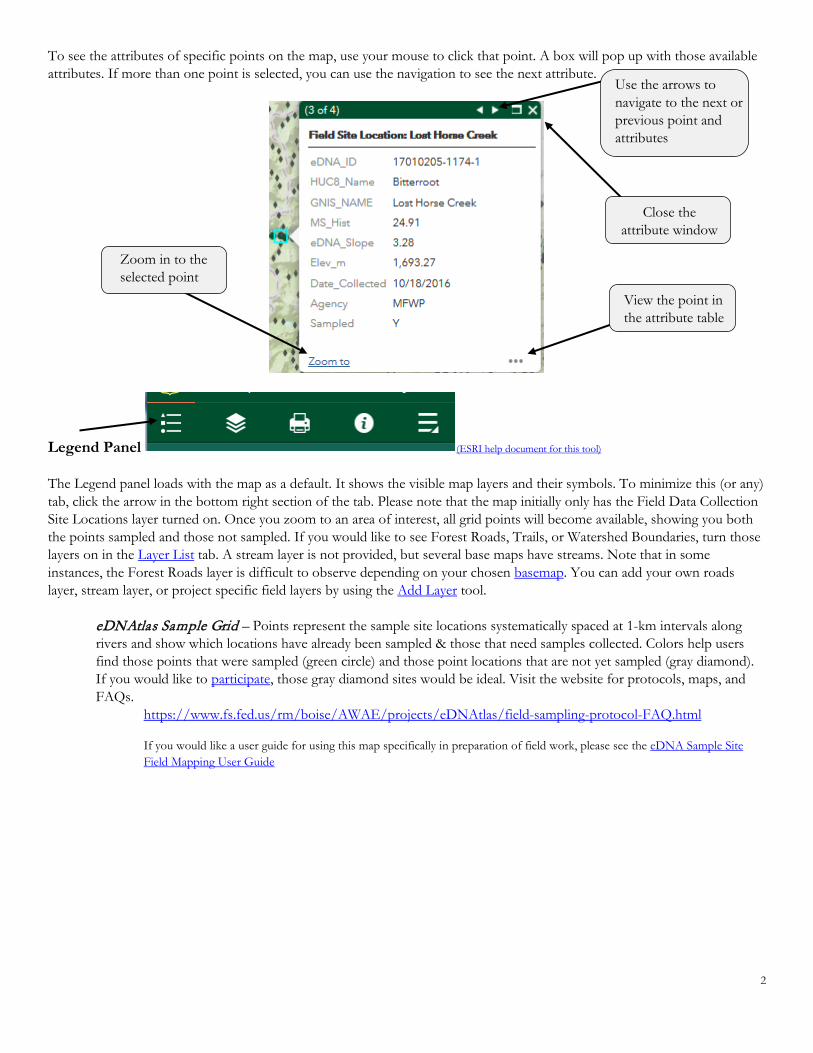
To see the attributes of specific points on the map, use your mouse to click that point. A box will pop up with those available attributes. If more than one point is selected, you can use the navigation to see the next attribute.
Legend Panel (ESRI help document for this tool) The Legend panel loads with the map as a default. It shows the visible map layers and their symbols. To minimize this (or any) tab, click the arrow in the bottom right section of the tab. Please note that the map initially only has the Field Data Collection Site Locations layer turned on. Once you zoom to an area of interest, all grid points will become available, showing you both the points sampled and those not sampled. If you would like to see Forest Roads, Trails, or Watershed Boundaries, turn those layers on in the Layer List tab. A stream layer is not provided, but several base maps have streams. Note that in some instances, the Forest Roads layer is difficult to observe depending on your chosen basemap. You can add your own roads layer, stream layer, or project specific field layers by using the Add Layer tool.
eDNAtlas Sample Grid – Points represent the sample site locations systematically spaced at 1-km intervals along rivers and show which locations have already been sampled & those that need samples collected. Colors help users find those points that were sampled (green circle) and those point locations that are not yet sampled (gray diamond). If you would like to participate, those gray diamond sites would be ideal. Visit the website for protocols, maps, and FAQs.
https://www.fs.fed.us/rm/boise/AWAE/projects/eDNAtlas/field-sampling-protocol-FAQ.html
If you would like a user guide for using this map specifically in preparation of field work, please see the eDNA Sample Site Field Mapping User Guide
Zoom in to the selected point
View the point in the attribute table
Close the attribute window
Use the arrows to navigate to the next or previous point and attributes

3
Layer List (ESRI help document for this tool)
The Layer List panel shows the current Operational Layers (Table of Contents) and allows users to turn those layers on and off as well as work individually with those layers.
The Control All Layers button in the upper-right corner of the Layer List panel controls the behavior of all of the layers in the list. Click the icon to open the menu, which allows you turn on or off all the layers, or expand or collapse all the layers. Alternatively, you can use keyboard shortcuts to do so. Press Ctrl and click the check box of the layer to turn on or off the layers in the same level. Press Ctrl and click the arrow to expand or collapse layers in the same level.
Click arrows to minimize the Legend or any panel
Use Ellipses (...) on the right side of a layer to display the layer menu.
Turn layers on and off by checking or unchecking the box to the left of the layer name.

4
• Zoom To—Sets the map extent to the extent of the layer. • Transparency—Sets the transparency for the layer. • Move up/down—Moves the layer one level up or down for this viewing session. • Enable Pop-up / Remove Pop-up—Enables or disables the pop-up for the feature layer. • View in Attribute Table—Opens the attribute table for the feature layer. • Show item details—Opens the service description or the item details page for the service or the item associated with
the layer, if available.
The layers below are provided for convenience, but do not belong to RMRS and their “zoom to” extent and symbology is not within our control.
Information about the National Forest System Roads layer can be found here - https://usfs.maps.arcgis.com/home/item.html?id=d92469ce149844b8a4a9e961ea9c901b Information about the Watershed Boundaries layer can be found here - https://usfs.maps.arcgis.com/home/item.html?id=fd68ec6f745849e79c28e44a18cdd88e
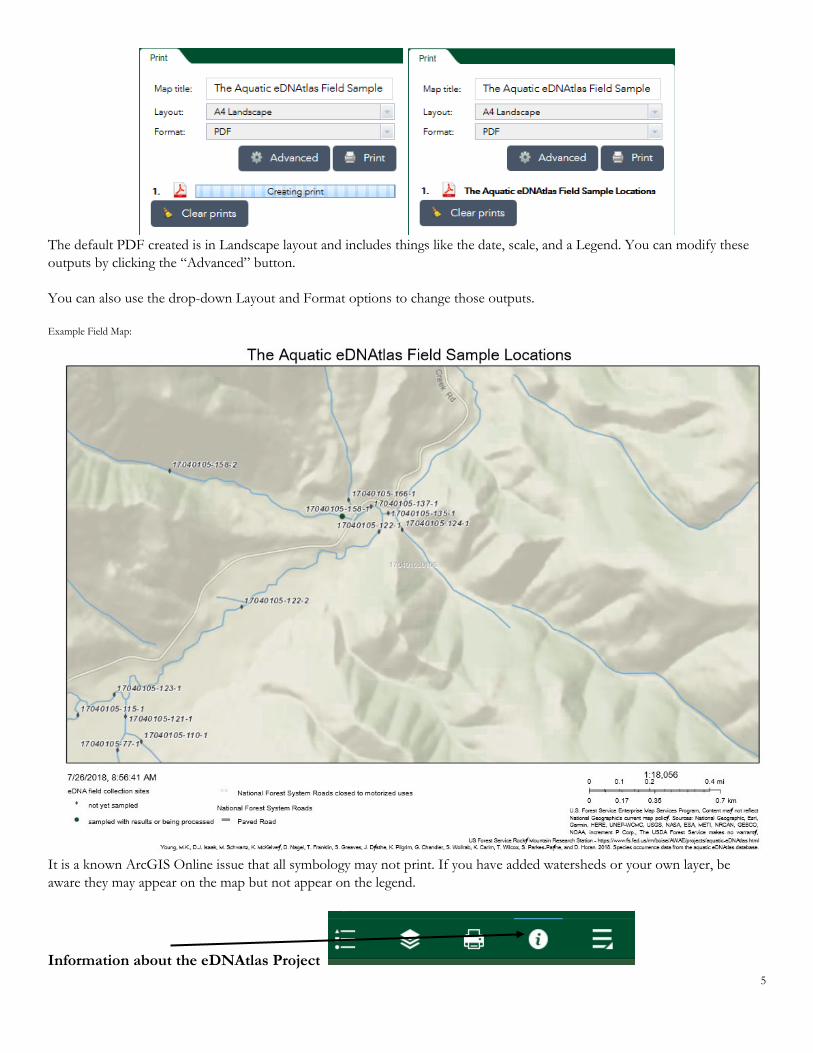
Print Once your map is modified and at the correct extent for your interests, you can print a field map that will show the sampling grid (with eDNA_ID) and any other layers you have selected or added. Opening the “Print” button will create a PDF. Once it’s available for download, it will be listed with a file name you can click to open in a new browser window. This is a temporary file, so please remember to save the PDF to your local hard drive. Note that this tool points to an ESRI print service and on occasion it takes several moments to load.
5
The default PDF created is in Landscape layout and includes things like the date, scale, and a Legend. You can modify these outputs by clicking the “Advanced” button. You can also use the drop-down Layout and Format options to change those outputs. Example Field Map:
It is a known ArcGIS Online issue that all symbology may not print. If you have added watersheds or your own layer, be aware they may appear on the map but not appear on the legend.
Information about the eDNAtlas Project

6
The Information panel contains links to the field sampling protocol and other documents, as well as the citation for this database.
The “Basemap Gallery” and the “Add Data” panels are available by clicking the “More Panels” option
Basemap Gallery (ESRI help document for this tool) Activating the Basemap Gallery panel allows you to choose a different basemap or background layer. This may be helpful as you zoom into your specific area of interest. For example, you can change the background map to a satellite image by selecting the “More Panels” option at the far right, clicking this Basemap Gallery and then scrolling down to choose the Imagery with Labels basemap.
Click the X to return to the main panels list
More panels- Basemap Gallery & Add Data Layers

7
Please note the sample points may not line up with the chosen basemap. The points are aligned with the NHD Plus version 2 NHDFlowline streams. Actual field sample locations may differ slightly depending on the ground situation and personnel collecting the samples.
Add Data Layer from a URL or ArcGIS Online Choosing the Add Data Layer button allows you to add other online layers to this map. You can 1) search the available data in ArcGIS online, or 2) enter a specific URL if you already have a web service link or a KML file, GeoRSS File or CSV file URL, or 3) upload a file from your computer. It supports shapefiles in Zip format, and CSV, GPX and GeoJSON files.
Click the icon to only search layers within the map area. Clicking it turns the icon red so you can search all layers in the scope. Click the sort icon to refine the type of search layer and sort the items.
• Click the Type drop-down list to search layers based on map service, feature service, image service, vector tile service, KML, or WMS.
• Click the Sort By drop-down list to sort items by relevance, title, owner, rating, view, or date.
To add layers by URL, click the URL tab next to the Search tab. Choose a type and enter the URL. Click Add to add the data to the map. The added layer will appear in the Layer List widget as well. The following types are supported through the URL:
• ArcGIS Server web service • WMS OGC web service • KML • GeoRSS • CSV

8
To remove layers added click LAYERS in the lower right corner of the Add Data window. In the Layers panel, click the trash can icon next to the layer to remove it.
Click BACK in the lower right corner to return to the main Add Data panel.
Note that you can’t remove the added layer without refreshing the map, but you can turn that layer off in the Layer List tab
Filter Points (ESRI help document for this tool)
The Filter Points button allows you to filter the “eDNA field collection sites” points on the map and in the attribute table by sampled or not sampled results or HUC8 watershed boundary. Note that you need to be zoomed in far enough to see both sampled and not sampled points to use the filter.
After clicking the button, use the radio button or drop-down boxes to make your choices. They may take a few moments to populate. You can also start typing to narrow down the HUC names available in the drop-down list.
Click the File tab to upload files locally. You can either drag and drop the file or browse to it. It supports shapefiles in Zip format, and CSV, KML, GPX and GeoJSON files.

9
Once you’ve chosen a HUC, click the Apply button and it will turn green. After a few moments, the map extent should zoom to those filtered features.
To remove the filter, click the apply button again and it will appear grayed out.
You can build custom filters using the option at the bottom of the Filter window. A similar process can be done using the attribute table. There is an example here.
Choose by clicking the radio button
10
The Filter window can be moved from its location if needed by clicking on the green Filter title and dragging. The window can also be closed once the filter is applied and reopened to turn it off.
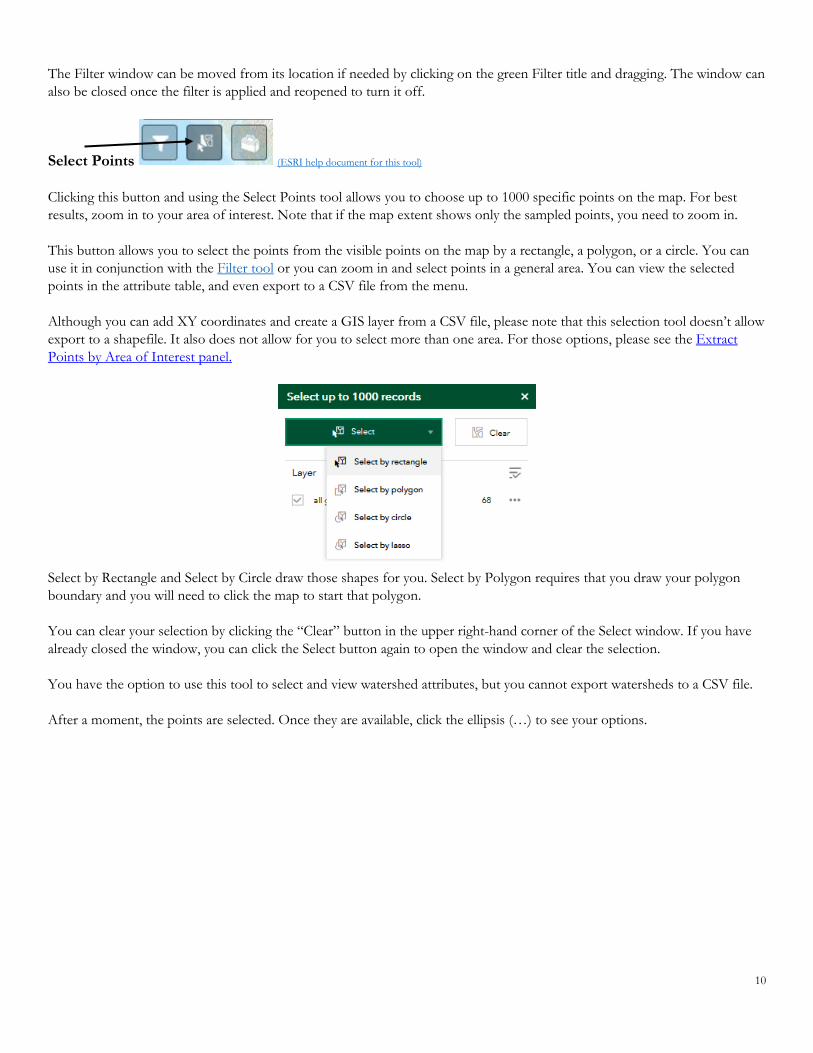
Select Points (ESRI help document for this tool)
Clicking this button and using the Select Points tool allows you to choose up to 1000 specific points on the map. For best results, zoom in to your area of interest. Note that if the map extent shows only the sampled points, you need to zoom in.
This button allows you to select the points from the visible points on the map by a rectangle, a polygon, or a circle. You can use it in conjunction with the Filter tool or you can zoom in and select points in a general area. You can view the selected points in the attribute table, and even export to a CSV file from the menu.
Although you can add XY coordinates and create a GIS layer from a CSV file, please note that this selection tool doesn’t allow export to a shapefile. It also does not allow for you to select more than one area. For those options, please see the Extract Points by Area of Interest panel.
Select by Rectangle and Select by Circle draw those shapes for you. Select by Polygon requires that you draw your polygon boundary and you will need to click the map to start that polygon.
You can clear your selection by clicking the “Clear” button in the upper right-hand corner of the Select window. If you have already closed the window, you can click the Select button again to open the window and clear the selection.
You have the option to use this tool to select and view watershed attributes, but you cannot export watersheds to a CSV file.
After a moment, the points are selected. Once they are available, click the ellipsis (…) to see your options.

11
You can view only the selected points in the attribute table by clicking the arrow at the bottom of the map to open the attribute table and choosing Options/Show Selected Records.
Geoprocessing - Extract and Download Points by Area of Interest (ESRI help document for this tool)
Clicking the Geoprocessing button brings up a tool that allows you to select an area of interest. Once you’ve made your selection, you can export the points within the area(s) of interest as a shapefile or geodatabase. Please note you will only be exporting the eDNA site locations. If you would like to download the entire GeoDatabase, including available results, you can do that here - https://www.fs.fed.us/rm/boise/AWAE/projects/eDNAtlas/edna-sampling-grid.html

12
Notes:
• You can create more than one polygon to select different areas. You can select a box around one stream and apolygon around another.
• You can select using multiple area of interest types (freehand polygons, circles, rectangles, etc.)• To use the “polygon tool”, you need to click the start point on the map and then move to the next
vertex. Double-click to complete the polygon.• To use the “freehand tool”, you need to click the mouse and drag around your area of interest and let
go of the mouse to finish the polygon.• This tool does not select line segments in the attribute table. Rather, it allows the line segments within
your area(s) of interest to be exported to a shapefile or geodatabase. To select lines to view in theattribute table, use the Select Features tool.
• An extracted Geodatabase will be in a zip file called “_ags_output.zip”. Inside the zipfolder in that zip file, thegeodatabase is called eDNAtlas_West_AGOL_SampleGridAndResults.gdb (oreDNAtlas_East_AGOL_SampleGridAndResults.gdb) with a point feature class of the same name, as would ashapefile. Although, note that some field names will be truncated in the attribute table if you choose to download ashapefile. The geodatabase feature classes and shapefiles each include ArcGIS metadata.
To remove the polygons you’ve created, click the ‘delete’ red exclamation icon.
Once you’ve selected your area(s), click the “Run” button. Depending on the size of your browser window, you may need to scroll down to see the button. After a few moments, the Output tab will be a link to an output zip file containing a shapefile or geodatabase with your selected features. This shapefile includes the metadata in an XML file. Please note that the points in the map may need to be projected to match the data for your project.
Scroll or expand the window for the Run button

13
Search Bar
Search for a stream by NHD Plus version 2 GNIS_NAME. Type your search and hit ‘enter’, or click the magnifying glass.
Searches take a moment and return up to 500 results. You can use this tool if you are not certain geographically where a stream or watershed is located. It will automatically zoom to the first result, but the search bar will have a slider to search for other results. Click another result and the map will zoom or pan to that location.
Tip: If you filter the available points to a specific HUC, the search results will be only those GNIS names within that specific HUC.
Attribute Table
The attribute tables can be opened and closed by clicking the arrow located at the bottom of the map.
You can click the Options button in the upper left-hand corner of the table to work with the attribute table.
As you zoom in on the map, the default is to filter the attribute table based on those points viewed in the map extent. It is toggled on when there is a light box around the button. Click that option to turn it off.
You can filter and select point(s) and then zoom to that location or show different columns. See the example here to create a filter.
ON
OFF

14
Field names and descriptions
Note that more detailed metadata can be found in the GeoDatabase itself or on the eDNAtlas website. FIELD eDNA_ID ►
Primary key. A unique ID for each eDNA sample point. The ID takes the form AAAAAAAA-BBB-CC, where A is the 8-digit Watershed Boundary Dataset (WBD) hydrologic unit code (HUC), B is a unique number assigned to each stream reach in the HUC, and C is a unique point on the stream reach. If you collect samples in the field, this is the number that needs to be associated with that sample site location.
FIELD HUC8 ► 8 digit unique code for each HUC from the Watershed Boundary Dataset (WBD).
FIELD HUC8_Name ► HUC name from the WBD
FIELD Site_ID ►
The unique site within each 8-digit HUC. The site ID takes the form BBB-CC, where B is a unique number assigned to each stream reach in the HUC, and C is a unique point on the stream reach.
FIELD COMID ►
Common identifier of an NHDFlowline feature (COMID code from the NHDPlus V2 dataset)
FIELD GNIS_NAME ► Feature name from Geographic Names Information System (stream name from the NHDPlus V2 dataset)
FIELD REACHCODE ►
Reach code assigned to feature (REACHCODE from the NHDPlus V2 dataset)
FIELD TotDASqKM ► Total upstream cumulative drainage area, in square kilometers, at the downstream end of the NHDFlowline feature.
FIELD DD_X ►
Geographic coordinate X in decimal degrees
FIELD DD_Y ► Geographic coordinate Y in decimal degrees
FIELD UTM_Zone ►
UTM Zone of the sample grid point
FIELD UTM_X ► UTM X coordinate of the sample grid point, unique by eDNA_ID
FIELD UTM_Y ►
UTM Y coordinate of the sample grid point, unique by eDNA_ID
FIELD FCODE ► Numeric codes for various feature attributes in the NHD Plus version 2 FCODE lookup table.
FIELD PublicLand ►
These data are from PAD-US, Protected Areas Database of the US. https://gapanalysis.usgs.gov/padus/

15
Own_Name - Land owner or holding agency (e.g. USFS, State Fish and Game, City Land, TNC) standardized for the US. See PAD-US Data Standard or geodatabase look up table for "Agency Name" for full domain descriptions. Use "Manager Name" for the best depiction of federal lands as many overlapping designations (i.e. "Designation") and ownership related data gaps (i.e. "Unknown") occur in the federal theme.
FIELD MS_Hist ► Mean summer historical flow [Mean summer flow is the average of daily flow between June 1 and September 30; Units: cubic feet per second] from Variable Infiltration Capacity (VIC) flow model.
FIELD eDNA_Slope ► Stream gradient of the reach above the sample point up to the next sample point, stream confluence, or headwater initiation point. Units: percent. Generated internally using NHDPlusV2 National Elevation Dataset data.
FIELD Elev_m ► The underlying elevation data used is from the National Elevation Dataset (NED) at 30 m resolution.
FIELD Date_Collected ► The date a previously collected sample was collected in the field as noted by the contributor. Null indicates no previous sample taken and assigned to the unique eDNA_ID.
FIELD Field_UTM_Zone ► UTM Zone of the collected sample as noted by the contributor. Null indicates either field coordinates are not in UTM or that no previous sample taken and assigned to the unique eDNA_ID.
FIELD Field_UTM_Easting ► Field X coordinate of the collected sample as noted by the contributor. Null indicates no previous sample taken and assigned to the unique eDNA_ID.
FIELD Field_UTM_Northing ► Field Y coordinate of the collected sample as noted by the contributor. Null indicates no previous sample taken and assigned to the unique eDNA_ID.
FIELD Agency ► Name of agency or group that collected the field sample.
FIELD ANCA ► Lab Sample results as tested for California floater (Anodonta californiensis/nuttaliana)
FIELD ANOR ► Lab Sample results as tested for Oregon floater (Anodonta oregonensis/kennerlyi)
FIELD ARGR ► Lab Sample results as tested for Arctic grayling (Thymallus articus)
FIELD BOTO ► Lab Sample results as tested for Boreal Toad (Anaxyrus boreas boreas)
FIELD BRKT ► Lab Sample results as tested for Brook Trout (Salvelinus fontinalis)
FIELD BRNT ► Lab Sample results as tested for Brown Trout (Salmo trutta)
FIELD BULL ► Lab Sample results as tested for Bull Trout (Salvelinus confluentus)
FIELD BURB ►
Lab Sample results as tested for Burbot (Lota lota)
FIELD CHIN ►
Lab Sample results as tested for Chinook Salmon (Oncorhynchus tshawytscha)
FIELD CHUM ► Lab Sample results as tested for Chum Salmon (Oncorhynchus keta)
FIELD CMCP ► Lab Sample results as tested for Common Carp (Cyprinus carpio)
FIELD COHO ► Lab Sample results as tested for Coho Salmon (Oncorhynchus kisutch)
FIELD DOVN ► Lab Sample results as tested for Dolly Varden (Salvelinus malma)
FIELD DRES ► Lab Sample results as tested for Dreissenid mussels (zebra/quagga) (Dreissena sp.)
FIELD 4-character species abbreviations ►
LIST OF VALUES VALUE 1 DESCRIPTION not sampled
VALUE 2 DESCRIPTION sampled, absent
VALUE 3 DESCRIPTION sampled, present
VALUE 4 DESCRIPTION sampled, being processed

16
FIELD GRIZ ► Lab Sample results as tested for Grizzly/Brown bear (Ursus arctos)
FIELD HADU ► Lab Sample results as tested for Harlequin duck (Histrionicus histrionicus)
FIELD LAKT ► Lab Sample results as tested for Lake Trout (Salvelinus namaycush)
FIELD LOMW ► Lab Sample results as tested for Loach Minnow (Rhinichthys cobitis)
FIELD MYSS ► Lab Sample results as tested for Opossum Shrimp (Mysis diluviana)
FIELD NOLS ► Lab Sample results as tested for Northern leatherside chub (Lepidomeda copei)
FIELD NOPI ► Lab Sample results as tested for Northern Pike (Esox lucius)
FIELD PALA ► Lab Sample results as tested for Pacific Lamprey (Entosphenus tridentatus)
FIELD RGCH ► Lab Sample results as tested for Rio Grande Chub (Gila pandora)
FIELD RGSU ► Lab Sample results as tested for Rio Grande sucker (Catostomus plebeius)
FIELD PYNA ► Lab Sample results as tested for Snake River physa (Physa natricina)
FIELD RMSC ► Lab Sample results as tested for Rocky Mountain Sculpin (Cottus sp.)
FIELD RMTF ► Lab Sample results as tested for Rocky Mountain Tailed Frog (Ascaphus montanus)
FIELD RNBT ► Lab Sample results as tested for Rainbow Trout/Steelhead/Redband Trout (Oncorhynchus mykiss)
FIELD RVOT ► Lab Sample results as tested for North American River Otter (Lontra canadensis)
FIELD SAPI ► Lab Sample results as tested for Sacramento Pikeminnow (Ptychocheilus grandis)
FIELD SCUL ► Lab Sample results as tested for a Cottidae marker (Any Sculpin). This refers to specific assays for detection of sculpin and does not indicate the results of multiple assays.
FIELD STGC ► Lab Sample results as tested for Sturgeon Chub (Macrhybopsis gelida)
FIELD SLMD ► Lab Sample results as tested for a Salmonidae marker (Any Salmonid). This refers to specific assays for detection of salmonid and does not indicate the results of multiple assays.
FIELD SLSC ► Lab Sample results as tested for Slimy Sculpin (Cottus cognatus)
FIELD SMBA ► Lab Sample results as tested for Smallmouth Bass (Micropterus dolomieu)
FIELD SPKD ► Lab Sample results as tested for Spikedace (Meda fulgida)
FIELD WEPS ► Lab Sample results as tested for Western Pearshell (Margaritifera falcata)
FIELD WPTL ► Lab Sample results as tested for Western Pond Turtle (Actinemys marmorata)
FIELD 4-character species abbreviations ►
LIST OF VALUES VALUE 1 DESCRIPTION not sampled
VALUE 2 DESCRIPTION sampled, absent
VALUE 3 DESCRIPTION sampled, present
VALUE 4 DESCRIPTION sampled, being processed
FIELD WSCT ► Lab Sample results as tested for Westslope Cutthroat Trout (Oncorhynchus clarkii lewisi)
FIELD YSCT ►
Lab Sample results as tested for Yellowstone Cutthroat Trout (Oncorhynchus clarkii bouvieri)

17
Filter Attribute Table by Stream Name example
Click on the arrow at the bottom of the map to open the attribute table. Note that the default is to only show those points that are within the current map extent. Unselect that option if you would like to filter all points.
Click the Options tab in the upper left-hand corner of the table and choose the Filter option.
In the Filter window, click “Add expression” and then use the field dropdown to choose GNIS_Name (String). Click the
settings button and choose the Unique option to allow a drop-down of all unique values in the attribute table for that field.

18
After a moment, click the dropdown. It will be populated with the available GNIS stream names. Choose your desired Stream and click “OK”. Both the map and the attribute table will show only the points with that GNIS name. You can click to the left of the first record in the table, move the slider bar along the right all the way to the bottom of the filtered attributes, and then click the shift key and select the last record. This will select all the points you have filtered.
Note that your mouse will change from an arrow to a pointing hand when selecting.
Once you have selected all the points you wish to export, Click the Options tab in the upper left-hand corner of the table and choose the Export Selected to CSV option.
You will be prompted to confirm that you want to export to a CSV file. Click OK.

19
You then have the option to Open or Save the file. Click OK.
Please note that there is no automatic download of the metadata with the table as there is when you download using the Extract Points by Area of Interest tool and export as a shapefile. You can find a general metadata document on the eDNAtlas website.
To remove the filter, click the X to the right of the filter expression.
If you have more questions about using the filter tool, see the ESRI help document for this tool.
Please cite downloaded data as:
Young, Michael K.; Isaak, Daniel J.; Schwartz, Michael K.; McKelvey, Kevin S.; Nagel, David E.; Franklin, Thomas W.; Greaves, Samuel E.; Dysthe, J. Caleb; Pilgrim, Kristine L.; Chandler, Gwynne L.; Wollrab, Sherry P.; Carim, Kellie J.; Wilcox, Taylor M.; Parkes-Payne, Sharon L.; Horan, Dona L. 2018. Species occurrence data from the aquatic eDNAtlas database. Fort Collins, CO: Forest Service Research Data Archive. Updated 08 November 2019. https://doi.org/10.2737/RDS-2018-0010.
Link to eDNAtlas western Sampling Grid ArcGIS Online Map
Link to the eDNAtlas eastern Sampling Grid ArcGIS Online Map
Link to the eDNAtlas Results ArcGIS Online Map for the western US
Link to the eDNAtlas Results ArcGIS Online Map for the eastern US
For use with ArcGIS Online - https://apps.fs.usda.gov/fsgisx02/rest/services/rmrs/RMRSAWAE_Aquatic_eDNAtlas_SiteLocations_01/MapServer
Questions about this User Guide, or need trouble-shooting ideas? Please contact Sharon (Parkes) Payne