Embed Size (px)
Citation preview

ArcGIS® Schematics: Automatic Schematic Generation for ArcGIS
An ESRI
® White Paper • September 2006
ESRI 380 New York St., Redlands, CA 92373-8100 USA • TEL 909-793-2853 • FAX 909-793-5953 • E-MAIL [email protected] • WEB www.esri.com

Copyright © 2006 ESRI All rights reserved. Printed in the United States of America. The information contained in this document is the exclusive property of ESRI. This work is protected under United States copyright law and other international copyright treaties and conventions. No part of this work may be reproduced or transmitted in any form or by any means, electronic or mechanical, including photocopying and recording, or by any information storage or retrieval system, except as expressly permitted in writing by ESRI. All requests should be sent to Attention: Contracts and Legal Services Manager, ESRI, 380 New York Street, Redlands, CA 92373-8100 USA. The information contained in this document is subject to change without notice.
U.S. GOVERNMENT RESTRICTED/LIMITED RIGHTS Any software, documentation, and/or data delivered hereunder is subject to the terms of the License Agreement. In no event shall the U.S. Government acquire greater than RESTRICTED/LIMITED RIGHTS. At a minimum, use, duplication, or disclosure by the U.S. Government is subject to restrictions as set forth in FAR §52.227-14 Alternates I, II, and III (JUN 1987); FAR §52.227-19 (JUN 1987) and/or FAR §12.211/12.212 (Commercial Technical Data/Computer Software); and DFARS §252.227-7015 (NOV 1995) (Technical Data) and/or DFARS §227.7202 (Computer Software), as applicable. Contractor/Manufacturer is ESRI, 380 New York Street, Redlands, CA 92373-8100 USA. ESRI, the ESRI globe logo, ArcGIS, ArcIMS, ArcPad, ArcInfo, ArcEditor, ArcView, ArcSDE, ArcMap, www.esri.com, and @esri.com are trademarks, registered trademarks, or service marks of ESRI in the United States, the European Community, or certain other jurisdictions. Other companies and products mentioned herein are trademarks or registered trademarks of their respective trademark owners.

J-8980
ESRI White Paper i
ArcGIS Schematics: Automatic Schematic Generation for ArcGIS
An ESRI White Paper Contents Page What Is Schematic?............................................................................... 1 Who Uses Schematic?........................................................................... 2 What Is ArcGIS Schematics?................................................................ 2 Key Features ......................................................................................... 3
Automatic Diagram Generation...................................................... 3 Multirepresentation ......................................................................... 3 Dynamic Interaction with GIS ........................................................ 4 Data-Driven Solution ...................................................................... 4 Customizable Algorithms ............................................................... 5 Multiple Data Source Access.......................................................... 5 Network Object Model ................................................................... 5
Access to the Geodatabase.................................................................... 5 Data Selection and Diagram Generation............................................... 6 Types of Representation ....................................................................... 7 Graphic Manipulation (Refinement Tools)........................................... 9 Configuration/Customization Tools...................................................... 9
Data Sources ................................................................................... 10 Diagram Types................................................................................ 10 Element Types ................................................................................ 10 Properties ........................................................................................ 11 Behaviors ........................................................................................ 11 Symbols........................................................................................... 11
Conclusion ............................................................................................ 12

J-8980
ArcGIS Schematics: Automatic Schematic Generation for ArcGIS
What Is Schematic? The first definition of schematic is a simplified representation of an object
or a set of objects intended to explain its structure and make the way it operates understandable. For purposes of this paper, an object is a network, and a set of objects is the internal information related to network components. A second definition of schematic is a drawing or diagram representing a set of relationships. Relationships connect nodes in the model. This is called connectivity. Another definition explains schematic as a way to represent any type of network within a symbolic system or a defined space without scaling constraints. For example, a defined space is a piece of paper where numerous pieces of information are displayed by optimizing the placement of the features. Within a schematic, there are no scale constraints (cable length, distances, etc.).
Selection of a Part of a Network in ArcMap Corresponding Schematic
ESRI White Paper
ArcGIS Schematics: Automatic Schematic Generation for ArcGIS
J-8980
Who Uses Schematic?
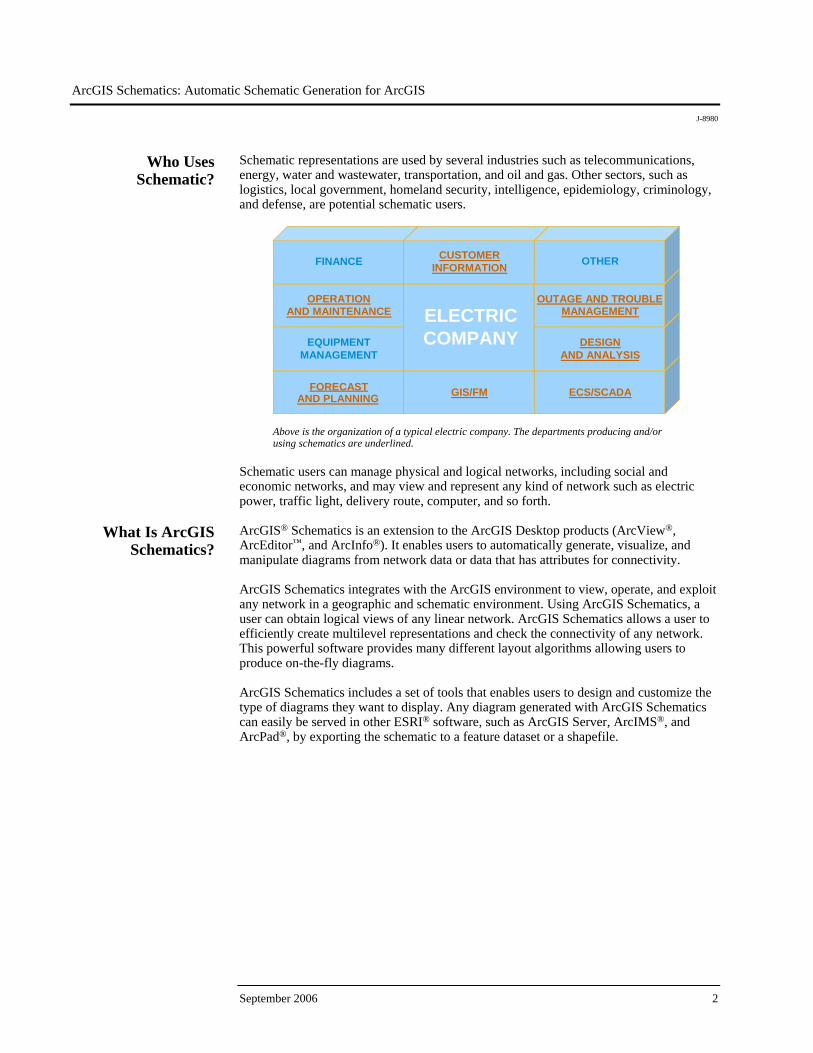
Schematic representations are used by several industries such as telecommunications, energy, water and wastewater, transportation, and oil and gas. Other sectors, such as logistics, local government, homeland security, intelligence, epidemiology, criminology, and defense, are potential schematic users.
September 2006 2
FORECAST
EQUIPMENTMANAGEMENT
OPERATION
& MAINTENANCE
GIS/FM
ELECTRICCOMPANY
ECS/SCADA
DESIGN OUTAGE & TROUBLEMANAGEMENT
FINANCE CUSTOMERINFORMATION OTHER
FORECASTAND PLANNING
EQUIPMENTMANAGEMENT
OPERATIONAND MAINTENANCE
GIS/FM
ELECTRICCOMPANY
ECS/SCADA
DESIGN
OUTAGE AND TROUBLEMANAGEMENT
FINANCE CUSTOMERINFORMATION OTHER
AND ANALYSIS
Above is the organization of a typical electric company. The departments producing and/or using schematics are underlined.
Schematic users can manage physical and logical networks, including social and economic networks, and may view and represent any kind of network such as electric power, traffic light, delivery route, computer, and so forth.
What Is ArcGIS Schematics?
ArcGIS® Schematics is an extension to the ArcGIS Desktop products (ArcView®, ArcEditor™, and ArcInfo®). It enables users to automatically generate, visualize, and manipulate diagrams from network data or data that has attributes for connectivity. ArcGIS Schematics integrates with the ArcGIS environment to view, operate, and exploit any network in a geographic and schematic environment. Using ArcGIS Schematics, a user can obtain logical views of any linear network. ArcGIS Schematics allows a user to efficiently create multilevel representations and check the connectivity of any network. This powerful software provides many different layout algorithms allowing users to produce on-the-fly diagrams. ArcGIS Schematics includes a set of tools that enables users to design and customize the type of diagrams they want to display. Any diagram generated with ArcGIS Schematics can easily be served in other ESRI® software, such as ArcGIS Server, ArcIMS®, and ArcPad®, by exporting the schematic to a feature dataset or a shapefile.

ArcGIS Schematics: Automatic Schematic Generation for ArcGIS
J-8980
From generating a smart tree diagram of a distribution electrical network, viewing the orthogonal schematic of the transmission network, then having an inside diagram of substations, ArcGIS Schematics helps engineers and technicians drill down into the network information system.
Key Features ArcGIS Schematics includes many innovative features. With features such as industry-standard customization environment and integration into the ArcGIS interface, users have a variety of powerful tools for schematic generation.
Automatic Diagram Generation
ArcGIS Schematics automatically generates geoschematic and pure schematic views from existing network data. This is the most effective way to limit the number of operations, avoid errors of manipulation, and decrease the number of tools. Compared to an interactive computer-aided drafting solution, ArcGIS Schematics speeds up the return on investment and facilitates network data updates.
Multirepresentation ArcGIS Schematics allows the viewing of the same set of network features through different representations: geographic, geoschematic, and pure schematic. Multiple representations give a better understanding of a network organization, thus speeding up any decision cycle. Multirepresentation brings the following advantages:
A synthetic display of the network architecture A quick evaluation of a network structure The ability to interact between inside plant schematics and equipment display The display of physical and logical networks
ESRI White Paper 3

ArcGIS Schematics: Automatic Schematic Generation for ArcGIS
J-8980
Electrical Substation Inside Plant Telco Fiber Cabinet Inside Plant
Dynamic Interaction
with GIS In addition to being an extension to ArcGIS Desktop, ArcGIS Schematics works with ArcSDE®, thus allowing the use of versioning. This allows the user to retrieve information through selection from schematic to geography and vice versa. ArcGIS Schematics complements geographic information system (GIS) technology in the design, construction, and management of networks because it emphasizes the location in the geographic space.
Data-Driven Solution ArcGIS Schematics is fully independent of the data model; it deals directly with the features in the geodatabase, avoiding duplication. The symbology is set by using connectivity attributes.
Different Positions of a Switch
September 2006 4

ArcGIS Schematics: Automatic Schematic Generation for ArcGIS
J-8980
Such a solution saves time and gives better quality and reliability. The schematic representation is always up to date. There are no discrepancies between the diagram and the database, making the solution a secured one. There is no need to have somebody update the paper maps by redrawing the symbols manually; all they need to do is open the diagram and print it again.
Customizable Algorithms
Different industries have different ways of representing their networks. Most companies have been generating schematics for a long time and want to use the same layout their teams are familiar with. ArcGIS Schematics offers easy-to-configure and easy-to- customize algorithms to fit all industry needs, standards of the companies, and specific needs of several departments within companies. Algorithms may also be created using a common object model (COM)-compliant programming language.
Smart Tree
Orthogonal Schema
Internal Diagram
Multiple Data Source
Access The same session of ArcGIS Schematics can deal with geodatabases and other databases, so it can manage spatial and nonspatial data. It gives access to the information system of the company and offers an integrated system managing all assets.
Network Object Model
ArcGIS Schematics manages in memory a network object model, allowing real-time management of connectivity and speeding up the process of layout display. This gives very good performance when applying algorithms.
Access to the Geodatabase
The objective of having a geodatabase is to get all information relative to the features to be represented and the geographic coordinates to display geoschematics and the connectivity between the features. ArcGIS Schematics offers three ways to access the features in the geodatabase:
The first one is to access the features through ArcMap™, read the geographic coordinates stored in the tables, then read the geometric network to get the connectivity. ArcMap is an application within ArcGIS Desktop.
The second is to access a route or a service area layer generated by ArcGIS Network
Analyst and read all the input and results, including the connectivity, to generate a diagram.
The third is to access the features through direct calls to the database and obtain the
connectivity through attributes. This method can be used when to- and from-node attributes, or any other attributes enabling the building of connectivity, are stored in the tables.
ESRI White Paper 5

ArcGIS Schematics: Automatic Schematic Generation for ArcGIS
J-8980
Data Selection and Diagram Generation
A user can select data in ArcMap to generate diagrams using ArcGIS Schematics by
Attributes Location Tracing Manual selection
Specific functions generate schematic diagrams by reading the selected features to get the object IDs then reading the geometric network or the ArcGIS Network Analyst layer to get the connectivity. Another function reads the features selected by the Utility Network Analyst tools then generates the corresponding schematic diagram. ArcGIS Schematics can also generate diagrams by accessing the database directly and reading the connectivity stored as attributes in the tables (i.e., to- and from-nodes). Thus ArcGIS Schematics is also able to generate schemas from nonspatial data. A simple example of this could be an organizational chart for a company. If there is data in a table that says that Jay, the vice president, works for Pam, the president, and Larry, the manager, works for Jay, ArcGIS Schematics can create a diagram with this relationship. This is nonspatial data being displayed that only has a spatial context when looking on the map at the location of the building in which they work or perhaps the floor plan of the building, both of which might be part of another schematic diagram. Through configuration, a diagram can be generated by mixing spatial and nonspatial data or allowing the ability to drill down between different diagrams as mentioned above.
Example of an Internal Diagram of an Electrical Substation Generated from Table Data
September 2006 6

ArcGIS Schematics: Automatic Schematic Generation for ArcGIS
J-8980
Example of a Diagram Mixing Spatial Data and Nonspatial Data
Types of Representation
ArcGIS Schematics is used to display geographic, geoschematic, and pure schematic diagrams. At the same time, the user can have different representations of the same set of features.
ESRI White Paper 7

ArcGIS Schematics: Automatic Schematic Generation for ArcGIS
J-8980
ArcGIS Schematics provides a set of algorithms to generate different types of layouts. For each algorithm, the user can change layout parameters to obtain the best data rendering.
Radial tree
September 2006 8

ArcGIS Schematics: Automatic Schematic Generation for ArcGIS
J-8980
All algorithms can be applied on a subpart of a diagram. Thus, several algorithms can be used on the same diagram to get a better display.
Backbone + Orthogonal Smart Tree + Orthogonal
Graphic
Manipulation (Refinement Tools)
An automatically generated diagram can be refined at any time by using a set of refinement tools. These tools allow features to be translated, rotated, and scaled; colors changed; and so forth, independently or by group. The main functions are listed below.
Intelligent subnetwork movement Subnetwork collapse and expansion Size modification of symbol and text Node bypassing Parallelism Vertical and horizontal node alignment
Configuration/
Customization Tools ArcGIS Schematics is delivered with a set of tools dedicated to the configuration and customization of applications called ArcGIS Schematics Designer. This user-friendly graphical user interface allows the administrator to define the working environment of an application: the project. It acts as the central point where access is gained to other objects in the system. The project provides access to the schematic components that an application manages such as data sources, diagram types, element types, properties, behaviors, and so forth. A project and its associated characteristics can be created and defined through ArcGIS Schematics Designer or by programming with a COM-compliant programming language.
ESRI White Paper 9

ArcGIS Schematics: Automatic Schematic Generation for ArcGIS
J-8980
ArcGIS Schematics Designer
Data Sources Most of the time, organizations managing networks deal with sets of databases. ArcGIS
Schematics allows connection to various data sources. Thus, a schematic can be generated not only from the geodatabase but also from any other data source providing information such as inside plant or logical connectivity.
Diagram Types A network is made up of junctions and edges. These features are displayed in different generic structures called diagrams. A diagram type is a template that brings together diagrams that have common characteristics. The diagram type defines what feature classes (element types) will be represented in diagrams of that type. For example, an electric company managing several networks can define diagram types for its high-voltage, medium-voltage, and low-voltage networks and representation of their stations and substations. In the ArcGIS Schematics Designer picture above, there are three diagram types defined.
Element Types An element type is equivalent to a feature type. It is defined by a name, its class, and a query returning all occurrences, attributes, and properties. Schematic manages two types of objects:
Node (or junction) Link (or edge)
A node is a vertex in a network graph. It is represented by a symbol and may be assigned various attributes such as graphic (color, fill style, etc.), geometric (scaling, rotation, etc.), or visual (visibility, highlighting, etc.). Nodes can have geographic, geoschematic, or graph-based coordinates. A link is an edge in a network graph. It is represented either by a direct single line segment or by several line segments passing through one or several link points. A link
September 2006 10

ArcGIS Schematics: Automatic Schematic Generation for ArcGIS
J-8980
represents the connectivity between two nodes. It can represent physical or logical connections.
Properties Properties are used to define the characteristics of a group of objects that have an impact on the graphic representation of a network. The overall state of a network is determined by the values of the existing set of properties at a given time. A label displayed either directly on the objects it applies to or inside a flag associated with these objects can represent any property.
Flag Label Ports
Behaviors When a behavior is defined, it specifies how the application will respond to end user
actions on one of the application objects. Behavior is a way to assign commands or specific functions to objects. Behavior can be applied on the following objects: diagram types, element types, and legend (a legend is comparable to the table of contents in ArcMap).
Symbols ArcGIS Schematics automatically utilizes existing ArcMap symbology. In some cases, the user needs to define specific symbols for a schematic. This is generally the case when defining symbols that have multiple connection slots. ArcGIS Schematics provides a symbol editor to do this.
1
3
2
4
Example of a Symbol Created with ArcGIS Schematics Symbol Editor
ESRI White Paper 11

ArcGIS Schematics: Automatic Schematic Generation for ArcGIS
J-8980
September 2006 12
Conclusion ArcGIS Schematics provides users with the ability to view their data, network or tabular, through various representations related to their specific industry. ArcGIS Schematics is integrated with the ArcGIS Desktop products (ArcInfo, ArcEditor, ArcView) for interoperability and advanced schematic capabilities. ArcGIS Schematics gives technicians and engineers the ability to generate diagrams from existing data through different types of queries. It provides all the tools needed to produce diagrams by drilling down the information system for outside and inside plants. All algorithms and refinement tools provide the power to build the diagrams to fit users' requirements.

Australia www.esriaustralia.com.au
Belgium/Luxembourg www.esribelux.com
Bulgaria www.esribulgaria.com
Canada www.esricanada.com
Chile www.esri-chile.com
China (Beijing) www.esrichina-bj.cn
China (Hong Kong) www.esrichina-hk.com
Finland www.esri-finland.com
France www.esrifrance.fr
Germany/Switzerland www.esri-germany.de www.esri-suisse.ch
Hungary www.esrihu.hu
India www.esriindia.com
Indonesia 62-21-527-1023
Italy www.esriitalia.it
Japan www.esrij.com
Korea www.esrikr.co.kr
Malaysia www.esrisa.com.my
Netherlands www.esrinl.com
Poland www.esripolska.com.pl
Portugal www.esri-portugal.pt
No. GS-35F-5086H
Printed in USA
ESRI International Offices
ESRI Regional Offices
Olympia 360-754-4727
St. Louis 636-949-6620
Minneapolis 651-454-0600
Philadelphia 610-644-3374
Boston 978-777-4543
Washington, D.C. 703-506-9515
Charlotte 704-541-9810
San Antonio 210-499-1044
Denver 303-449-7779
California 909-793-2853 ext. 1-1906
Romania www.esriro.ro
Singapore www.esrisa.com
Spain www.esri-es.com
Sweden www.esri-sweden.com
Thailand www.esrith.com
United Kingdom www.esriuk.com
Venezuela www.esriven.com
1-800-GIS-XPRT (1-800-447-9778)
www.esri.com
Locate an ESRI value-added reseller near you at
www.esri.com/resellers
Outside the United States, contact your local ESRI distributor. For the number of your distributor, call ESRI at 909-793-2853, ext. 1-1235, or visit our Web site at
www.esri.com/distributors
For More Information
ESRI 380 New York Street Redlands, California 92373-8100 USA
Phone: 909-793-2853Fax: 909-793-5953 E-mail: [email protected]
For more than 35 years, ESRI has
been helping people make better
decisions through management
and analysis of geographic
information. A full-service GIS
company, ESRI offers a framework
for implementing GIS technology
and business logic in any
organization from personal GIS on
the desktop to enterprise-wide GIS
servers (including the Web) and
mobile devices. ESRI GIS solutions
are flexible and can be customized
to meet the needs of our users.