Embed Size (px)
Citation preview
Architecting System Performance all slidesby Gerrit Muller
TNO-ESI
Abstract
Architecting System Performance applies and elaborates the course ArchitecturalReasoning Using Conceptual Modeling to architect performance of systems. Weteach an architecting method based on many views and fast iteration of the views.Visual models, functional models, and mathematical models in all views are themeans to communicate about the system, to discuss specification and designchoices, to reason about consequences, and to make decisions.
Distribution
This article or presentation is written as part of the Gaudíproject. The Gaudí project philosophy is to improveby obtaining frequent feedback. Frequent feedback ispursued by an open creation process. This documentis published as intermediate or nearly mature version toget feedback. Further distribution is allowed as long asthe document remains complete and unchanged.
October 20, 2017status: preliminarydraftversion: 0.4
design space
resource managementprocess, transport, store, in/out
internal logisticsconcurrency, processes
processingalgorithms, machining, ...
Devilish details in design space may have large impact on performance.
Many detailed design decisions determine system performance.
system
performance

Architecting System Performance; Course Overviewby Gerrit Muller TNO-ESI, University College of South East Norway
e-mail: [email protected]
Abstract
Course overview of the course Architecting System Performance.
Distribution
This article or presentation is written as part of the Gaudí project. The Gaudí projectphilosophy is to improve by obtaining frequent feedback. Frequent feedback is pursued by anopen creation process. This document is published as intermediate or nearly mature versionto get feedback. Further distribution is allowed as long as the document remains completeand unchanged.
October 20, 2017status: preliminarydraftversion: 0.3
1. Course introduction
4. Connecting breadth and depth
3. Course didactics
2. Managing system performance
5. Performance Modeling
6. Level of Abstraction
7. Visualizing Dynamic Behavior
8. Emerging Behaviour
13. Reasoning Approach
14. Defining Performance
15. Measuring Performance
12. Model Analysis
11. Applications and Variations
9. Budgeting
16. Resource Management
17. Greedy and Lazy Pattern
10. Modeling Paradigms
18.Scheduling
19. Robust Performance
time-oriented performance
20. Bloating, Waste, and Value

Nuggets Architecting System Performance
1. Course introduction
4. Connecting breadth and depth
3. Course didactics
2. Managing system performance
5. Performance Modeling
6. Level of Abstraction
7. Visualizing Dynamic Behavior
8. Emerging Behaviour
13. Reasoning Approach
14. Defining Performance
15. Measuring Performance
12. Model Analysis
11. Applications and Variations
9. Budgeting
16. Resource Management
17. Greedy and Lazy Pattern
10. Modeling Paradigms
18.Scheduling
19. Robust Performance
time-oriented performance
20. Bloating, Waste, and Value
Architecting System Performance; Course Overview3 Gerrit Muller
version: 0.3October 20, 2017
ASPCOnuggets

Assignments in Face-to-Face Module
supersystem system subsystem
1. sketch the problemgoal use case
key performance
parameters
main
concepts
critical
technologies
2. make conceptual model of the current
situation
· model dynamic behavior
· model 0-order kpp using functions (as
simple as possible)
· quantify contribution to kpp using
observed data
3. explore customer and business relevance
· develop story
· model workflow and performance
· model customer value as function of kpp
4. make conceptual model of potential
solutions
· model the foreseen solution
· model & compare 2 alternative solutions
5. list questions and uncertainties, reformulate problem and goal, and formulate gaps and options
6. develop an elevator pitch to report you findings and recommendations to management
0. elevator case
Architecting System Performance; Course Overview4 Gerrit Muller
version: 0.3October 20, 2017MAOassignments

Architecting System Performance; Course Materialby Gerrit Muller TNO-ESI, University College of South East Norway
e-mail: [email protected]
Abstract
Listing the course material for Architecting System Performance
Distribution
This article or presentation is written as part of the Gaudí project. The Gaudí projectphilosophy is to improve by obtaining frequent feedback. Frequent feedback is pursued by anopen creation process. This document is published as intermediate or nearly mature versionto get feedback. Further distribution is allowed as long as the document remains completeand unchanged.
October 20, 2017status: plannedversion: 0.1
logo TBD

Colofon
The ASPTM
course is partially derived from the
EXARCH course developed at Philips CTT by
Ton Kostelijk and Gerrit Muller.
Extensions and additional slides have been
developed at ESI by Teun Hendriks, Roland
Mathijssen and Gerrit Muller.
Architecting System Performance; Course Material6 Gerrit Muller
version: 0.1October 20, 2017
PERFcolofon

Elevator: Hands-on Intro to Performance Modeling
core
Physical Models of an Elevator
http://www.gaudisite.nl/info/ElevatorPhysicalModel.info.html
optional
Teaching conceptual modeling at multiple system levels using multiple views
http://www.gaudisite.nl/CIRP2014_Muller_TeachingConceptualModeling.pdf
Understanding the human factor by making understandable visualizations
http://www.gaudisite.nl/info/UnderstandingHumanFactorVisualizations.info.html
Architecting System Performance; Course Material7 Gerrit Muller
version: 0.1October 20, 2017
ASPmaterialElevator

Course Didactics
core
Architecting System Performance; Course Didactics
http://www.gaudisite.nl/info/ASPcourseDidactics.info.html
optional
DSRP: https://en.wikipedia.org/wiki/DSRP
Assumptions: “Systems Engineering and Critical Reflection: The Application of
Brookfield and Goffman to the Common Experiences of Systems Engineers” by
Chucks Madhav; proceedings of INCOSE 2016, in Edinburgh, GB
70/20/10:
http://charles-jennings.blogspot.nl/
https://www.trainingindustry.com/wiki/entries/the-702010-model-for-learning-and-
development.aspx
http://jarche.com/2015/11/the-bridge-from-education-to-experience/
Reflection: “The Reflective Practitioner: How Professionals Think In Action” by
Donald Schon, ISBN-10: 0465068782, Basic Books USA
Assumptions and beliefs:
https://pivotalthinking.wordpress.com/tag/ladder-of-inference/
http://stwj.systemswiki.org/?p=1120
Architecting System Performance; Course Material8 Gerrit Muller
version: 0.1October 20, 2017
ASPmaterialDidactics

Greedy and Lazy Patterns
core
Architecting System Performance; Greedy and Lazy Patterns
http://gaudisite.nl/info/ASPgreedyAndLazy.info.html
optional
Fundamentals of Technology
http://gaudisite.nl/MAfundamentalsOfTechnologyPaper.pdf
Architecting System Performance; Course Material9 Gerrit Muller
version: 0.1October 20, 2017
ASPmaterialGreedyLazy

Measuring
core
Architecting System Performance; Measuring
http://www.gaudisite.nl/info/ASPmeasuring.info.html
optional
Performance Method Fundamentals
http://www.gaudisite.nl/PerformanceMethodFundamentalsPaper.pdf
Measurement issues; From gathering numbers to gathering knowledge by Ton
Kostelijk http://www.gaudisite.nl/MeasurementExecArchSlides.pdf
Modeling and Analysis: Measuring
http://www.gaudisite.nl/MAmeasuringPaper.pdf
Exploring an existing code base: measurements and instrumentation
http://www.gaudisite.nl/info/ExploringByMeasuringInstrumenting.info.html
Architecting System Performance; Course Material10 Gerrit Muller
version: 0.1October 20, 2017
ASPmaterialMeasuring

Architecting System Performance; Managing SystemPerformance
by Gerrit Muller TNO-ESI, University College of South East Norwaye-mail: [email protected]
www.gaudisite.nl
Abstract
This presentation presents the ideas behind the course Architecting SystemPerformance. A number of frameworks and mental models show the context ofthis course and the approach to performance advocated in this course.
Distribution
This article or presentation is written as part of the Gaudí project. The Gaudí projectphilosophy is to improve by obtaining frequent feedback. Frequent feedback is pursued by anopen creation process. This document is published as intermediate or nearly mature versionto get feedback. Further distribution is allowed as long as the document remains completeand unchanged.
October 20, 2017status: preliminarydraftversion: 0.2
understanding exploration optimization verification
Explorative
what is needed?
what can be achieved?Defensive
what are the risks?
will the system perform well?
how to mitigate shortcomings?

Architecture Top View
customer value
proposition
business
proposition
system
requirements
system design
drives drives
drive
s
en
ab
les
enables enab
les
Architecting System Performance; Managing System Performance12 Gerrit Muller
version: 0.2October 20, 2017
ARCVtopView

Performance Playing Field
customer value
proposition
business
proposition
system
requirements
system designdrives dr
ives
drive
s
en
ab
les
enables enab
les
consumer experience
enterprise performance:
enterprise productivity
enterprise throughput
enterprise response time
competitiveness
service response time
service cost
system performance:
system productivity
system throughput
system response time
technical concepts for:
resource management
internal logistics
processing
Performance attributes
require means for analysis
evaluation, and creation of
structure (parts and interfaces)
and dynamic behavior (functions)
at all levels.
Hence, we need conceptual
modeling at all levels.
Architecting System Performance; Managing System Performance13 Gerrit Muller
version: 0.2October 20, 2017
ASPCIplayingField

What and Why to Model
business
key drivers
risks
customer
key drivers
risks
business as
usual
(no modeling)
obvious
historic data
competitive data
modelingfeasibility
communication
risk mitigation
exploration
validation
purpose and type of model
depend on project life cycle
type of model and views
depend on purpose
how well is the customer served?
how credible becomes the solution?
how much are time and effort reduced?
how much is the risk reduced?
how much is the solution improved?
how much effort is needed to create model(s)?
how much effort is needed to use and maintain model(s)?
how much time is needed to obtain useful result?
decision factors:
accuracy of model
credibility of results
level of abstraction
working range
calibration of model
robustness of model
time to first results and feedback
effort
evolvability
(adaptation to new questions)
Architecting System Performance; Managing System Performance14 Gerrit Muller
version: 0.2October 20, 2017
MAOwhyWhatWhen

Modeling Evolves over Time
understanding exploration optimization verification
project
phase
purpose of
the model
type of the
modeldetermines determines
Architecting System Performance; Managing System Performance15 Gerrit Muller
version: 0.2October 20, 2017
ASPCOwhyModeling
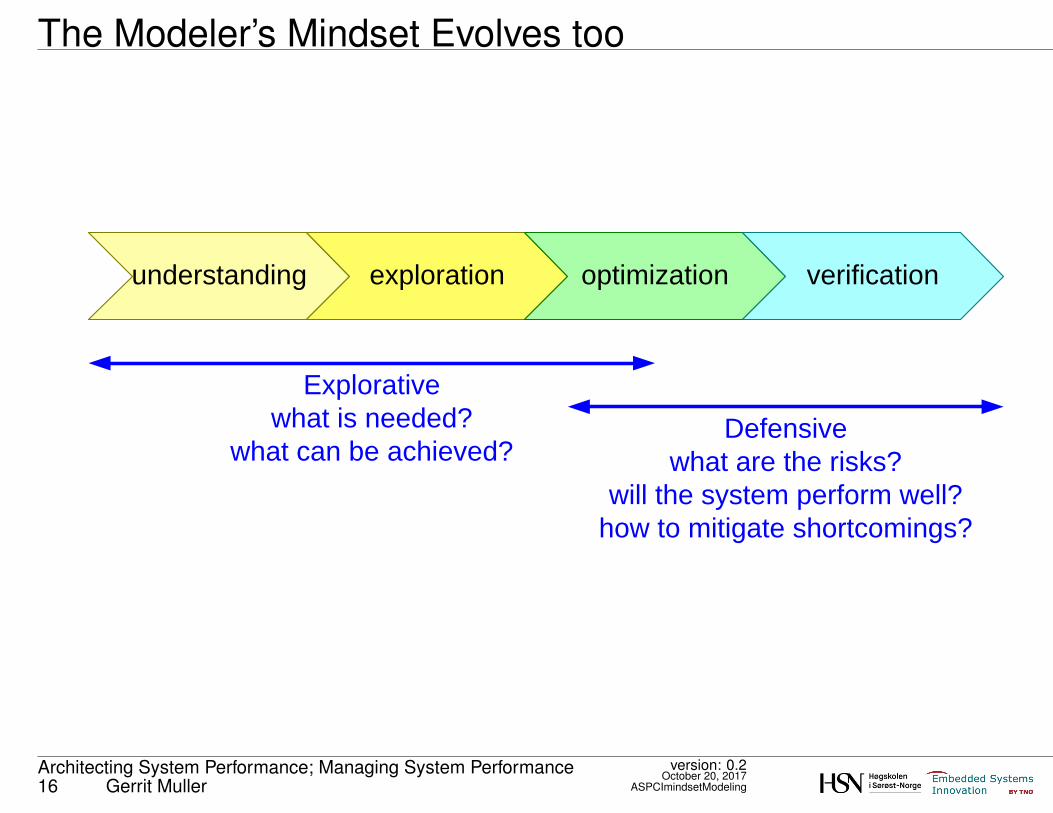
The Modeler’s Mindset Evolves too
understanding exploration optimization verification
Explorative
what is needed?
what can be achieved?Defensive
what are the risks?
will the system perform well?
how to mitigate shortcomings?
Architecting System Performance; Managing System Performance16 Gerrit Muller
version: 0.2October 20, 2017
ASPCImindsetModeling

The Architect Can Be ”Out of Phase”
understanding exploration optimization verification
Explorative
what is needed?
what can be achieved?Defensive
what are the risks?
will the system perform well?
how to mitigate shortcomings?
mindset of most
stakeholders
mindset of
architect
“look ahead”
Architecting System Performance; Managing System Performance17 Gerrit Muller
version: 0.2October 20, 2017
ASPCIoutOfPhase

10 Fundamental Recommendations
objectives
principles recommendations
Time-box
Iterate
Multi-view
Measure and validate
Quantify early
Visualize
System and its context
Analysis of accuracy and
credibility
(Simple) mathematical models
Multiple levels of abstraction
use feedback
work incremental
work evolutionary
support communication
facilitate reasoning
support decision making
be explicit
make issues tangible
create
maintain
understanding
insight
overview
translate into
translate into
help to
achieve
Architecting System Performance; Managing System Performance18 Gerrit Muller
version: 0.2October 20, 2017
MAOrecommendations

Iterative Performance Management during Development
determine most
important and critical
requirements
model
analyse constraints
and design options
simulate
build proto
measure
evaluate
analyse
Architecting System Performance; Managing System Performance19 Gerrit Muller
version: 0.2October 20, 2017
EAAspiral

Managing Performance during Product Development
incomplete
understanding
calibration
input
100
1000
time
design
robustness
problem
worse
better
degrading
performance
measurement
design
estimate and
uncertainty
specification
finished
product
Architecting System Performance; Managing System Performance20 Gerrit Muller
version: 0.2October 20, 2017
BWMAquantificationInTime

Quantification Steps
order of magnitude
guestimates
calibrated estimates
10
50 200
30 300
10030 300
70 140
90 115
feasibilitymeasure,
analyze,
simulate
back of the
envelope
benchmark,
spreadsheet
calculation
99.999 100.001cycle
accurate
Architecting System Performance; Managing System Performance21 Gerrit Muller
version: 0.2October 20, 2017
BWMAquantificationSteps

Architecting System Performance; Course Didacticsby Gerrit Muller TNO-ESI, University College of South East Norway
e-mail: [email protected]
Abstract
The didactics behind a course like Architecting System Performance is achallenge, because the learning goals relate mostly to attitude and ways ofthinking. At the same time, the material covers methods, techniques, tools, andconcepts, which may lure participants in mechanistic approaches. Core in thedidactic approach is reflection. This presentation offers some ”thinking models” toassist reflection.
Distribution
This article or presentation is written as part of the Gaudí project. The Gaudí projectphilosophy is to improve by obtaining frequent feedback. Frequent feedback is pursued by anopen creation process. This document is published as intermediate or nearly mature versionto get feedback. Further distribution is allowed as long as the document remains completeand unchanged.
October 20, 2017status: preliminarydraftversion: 0.1
team 1
team 2team 3
team 4
flips team 1flips team 4
flips team 2flips team 3
reflection
wall
mental switch
from problem/system
to “meta”
how, what, why?

Competence Requires Various Learning Styles
Knowledge
Skills
Ability
Attitude
assig
nm
en
ts
pra
ctice
teacher/coach
participant
lectu
rin
g
exe
rcis
es
co
ach
ing
refle
ctio
n
what how who
Architecting System Performance; Course Didactics23 Gerrit Muller
version: 0.1October 20, 2017
AACLcompetenceProgram

Bloom’s Taxonomy and Higher Order Thinking Skills
remembering
understanding
applying
analyzing
evaluating
creating Higher Order Thinking Skills
more difficult to teach
more valuable
takes time to develop
Lower Order Thinking Skills
people can acquire them fast
must be mastered before,
however when missing
can be acquired fast
Architecting System Performance; Course Didactics24 Gerrit Muller
version: 0.1October 20, 2017
ASPCDbloomsTaxonomy

Course Assumption:
This course focuses on Higher Order Thinking Skills.
We assume
that you have appropriate knowledge
and
that you are able to find and absorb
required specific knowledge fast.
Architecting System Performance; Course Didactics25 Gerrit Muller
version: 0.1October 20, 2017
ASPCDknowledgeAndLOTS

Problem-Based Learning Using Reflection
experiencing
reflecting
generalizing
applying
source: Kolb's learning cyclehttp://www.infed.org/biblio/b-explrn.htm
analyzing
interpreting
explaining
observing
conceptualizing
testing
Architecting System Performance; Course Didactics26 Gerrit Muller
version: 0.1October 20, 2017
RASAcycle

Role of Experience in Learning
10: Education
70: Experience
20: Exposure
70:20:10 learning model
Modeling
Coaching
Scaffolding
Articulation
Reflection
Exploration
https://en.wikipedia.org/wiki/
Cognitive_apprenticeship
Architecting System Performance; Course Didactics27 Gerrit Muller
version: 0.1October 20, 2017
ASPCD702010

DSRP Model
Making Distinctions identityDistinction
other
A not A
Organizing Systems
System
Recognizing RelationshipsRelation
Taking Perspectives
Perspective
Architecting System Performance; Course Didactics28 Gerrit Muller
version: 0.1October 20, 2017
ASPCDdsrpModel

Separate Reflection Wall
team 1
team 2team 3
team 4
flips team 1flips team 4
flips team 2flips team 3
reflection
wall
mental switch
from problem/system
to “meta”
how, what, why?
Architecting System Performance; Course Didactics29 Gerrit Muller
version: 0.1October 20, 2017
ASPCDroomLayout

Scope and Topic of Reflection
principle
process or
method
procedure or
technique
organization
project
team
individual
operational or
life cycle context
system of
interest
component
or function
of interest
tool or
notation
technical psychosocial means
Architecting System Performance; Course Didactics30 Gerrit Muller
version: 0.1October 20, 2017
RASAscope

The Role of Assumptions and Beliefs in Thinking
observe data
select data
add meaning
make assumptions
draw conclusions
adopt beliefs
take actions
reflexive loop
beliefs influence
what we observe
after https://pivotalthinking.files.wordpress.com/2011/11/plain-inference.png
The “Ladder of Inference” originally
proposed by Chris Argyris and developed
by Peter Senge and his colleagues [The
Fifth Discipline Fieldbook] illustrates how
these biases can be built into our thinking.
https://pivotalthinking.wordpress.com/tag/ladder-
of-inference/
Architecting System Performance; Course Didactics31 Gerrit Muller
version: 0.1October 20, 2017
ASPCDladderOfInference

Architecting System Performance; Connecting Breadth andDepth
by Gerrit Muller TNO-ESI, University College of South East Norwaye-mail: [email protected]
www.gaudisite.nl
Abstract
System Performance plays a crucial role in the customer value proposition and thebusiness proposition. Minor details deep down into the system may have a largeimpact on system performance, and hence on both value propositions. Challengein architecting system performance is to connect both worlds, which are mentallyfar apart.
Distribution
This article or presentation is written as part of the Gaudí project. The Gaudí projectphilosophy is to improve by obtaining frequent feedback. Frequent feedback is pursued by anopen creation process. This document is published as intermediate or nearly mature versionto get feedback. Further distribution is allowed as long as the document remains completeand unchanged.
October 20, 2017status: preliminarydraftversion: 0
100
101
106
105
104
103
102
107
nu
mb
er
of
de
tails
stre
tch
engi
nee
r
stre
tch
syst
em
arch
itec
t
stre
tch
sen
ior
engi
nee
r
100 10 1

Organizational Problem: Disconnect
Customer
objectives
Application Functional Conceptual Realisation
Ho
w c
an
the
pro
du
ct b
e re
aliz
ed
Wh
at a
re th
e c
ritica
l de
cis
ion
sWhat does Customer need
in Product and Why?
system
requirements
design
decisions
parts
connections
lines of code
and growing every year....
gap
Architecting System Performance; Connecting Breadth and Depth33 Gerrit Muller
version: 0October 20, 2017RATWdisconnect

Architect: Connecting Problem and Technical Solution
Customer
objectives
Application Functional Conceptual Realisation
How can the product be realized
What are the critical decisions
What does Customer need
in Product and Why?
100
101
106
105
104
103
102
107
system
requirements
design
decisions
parts
connections
lines of code
nu
mb
er
of
de
tails
and growing every year....108
Architecting System Performance; Connecting Breadth and Depth34 Gerrit Muller
version: 0October 20, 2017
RATWbreadthAndDepth

Major Bottleneck: Mental Dynamic Range
100
101
106
105
104
103
102
107
nu
mb
er
of
de
tails
stre
tch
engi
nee
r
stre
tch
syst
em
arch
itec
t
stre
tch
sen
ior
engi
nee
r
100 10 1
Architecting System Performance; Connecting Breadth and Depth35 Gerrit Muller
version: 0October 20, 2017
RATWmentalDynamicRange

Breadth
System of
Interest
supporting systems
train plan maintain
surrounding systems
supply receive manage
stakeholders
concerns
needs
interests
regulations
processes
procedures
Architecting System Performance; Connecting Breadth and Depth36 Gerrit Muller
version: 0October 20, 2017
CBADbreadth

Depth
design space
resource managementprocess, transport, store, in/out
internal logisticsconcurrency, processes
processingalgorithms, machining, ...
Devilish details in design space may have large impact on performance.
Many detailed design decisions determine system performance.
system
performance
Architecting System Performance; Connecting Breadth and Depth37 Gerrit Muller
version: 0October 20, 2017
ASPBDdepth

Modeling and Analysis; Performance Modelingby Gerrit Muller TNO-ESI, University College of South East Norway
e-mail: [email protected]
Abstract
Principles and concepts of modeling performance.
Distribution
This article or presentation is written as part of the Gaudí project. The Gaudí projectphilosophy is to improve by obtaining frequent feedback. Frequent feedback is pursued by anopen creation process. This document is published as intermediate or nearly mature versionto get feedback. Further distribution is allowed as long as the document remains completeand unchanged.
October 20, 2017status: preliminarydraftversion: 0
empirical model tmove elevator
Empirical model: a model based on
observations and measurements.
An empirical model describes the
observations.
An empirical model provides no
understanding.
10
20
5
15
10
30floors
meters
tmove = a * n + b
ba
First principle model: a model based
on theoretical principles.
A first principle model explains the
desired property from first principles
from the laws of physics.
A first principle model requires values
for incoming parameters to calculate
results.
first principle model ttop floor elevator
s
t
v
t
a
tta tatv
v = dS
dta =
dv
dtj =
da
dt
Position in case of uniform acceleration:
St = S0 + v0t + a0t21
2
ttop floor = ta + tv + ta
ta = vmax / amax
S(ta) = 1
2* amax * ta
2
Slinear = Stop floor - 2 * S(ta)
tv = Slinear / vmax

Empirical versus First Principle Models
empirical model tmove elevator
Empirical model: a model based on
observations and measurements.
An empirical model describes the
observations.
An empirical model provides no
understanding.
10
20
5
15
10
30floors
meters
tmove = a * n + b
ba
First principle model: a model based
on theoretical principles.
A first principle model explains the
desired property from first principles
from the laws of physics.
A first principle model requires values
for incoming parameters to calculate
results.
first principle model ttop floor elevator
s
t
v
t
a
tta tatv
v = dS
dta =
dv
dtj =
da
dt
Position in case of uniform acceleration:
St = S0 + v0t + a0t21
2
ttop floor = ta + tv + ta
ta = vmax / amax
S(ta) = 1
2* amax * ta
2
Slinear = Stop floor - 2 * S(ta)
tv = Slinear / vmax
Modeling and Analysis; Performance Modeling39 Gerrit Muller
version: 0October 20, 2017
MAPMempirical

Conceptual = Hybrid of Empirical and First Principle
conceptual model tmove elevator
Conceptual model: a model
explaining observations and
measurements using some first
principles.
A conceptual model is a hybrid of
empirical and first principle models;
simple enough to understand and to
reason, realistic enough to make
sense.
10
20
5
15
10
30floors
meters
tmove = vmax * n + bstart/stop
bstart/stop
a
s
t
v
t
a
tta tatj tj tj tj
S1 S4S0 S2S3 S5
bstart/stop = f(acceleration, jerk)
Modeling and Analysis; Performance Modeling40 Gerrit Muller
version: 0October 20, 2017MAPMconceptual

From Zero to Higher Order Formulas
0th order main function
main parameters
most simple
order of magnitude
1st order add most significant
secondary contributions
improved estimation
2nd
order add next level of
contributions
more accurate, understanding
constant velocity
ttop floor = Stop floor / vmax
constant acceleration
ttop floor = Stop floor / vmax
- amax * ta2/ vmax + 2 * vmax / amax
constant jerk
ttop floor ~= Stop floor / vmax - amax * ta2/ vmax
+ 2 * vmax / amax + 2 * amax / jmax
Modeling and Analysis; Performance Modeling41 Gerrit Muller
version: 0October 20, 2017
MAPMorders
Architecting System Performance; Level of Abstractionby Gerrit Muller TNO-ESI, University College of South East Norway
e-mail: [email protected]
Abstract
A recurring question in modeling and perfromance analysis is when to stopdigging. What level of detail is needed to achieve acceptable performance? Whatlevel of abstraction result in credible and sufficiently accurate results? How tocope with many levels of abstraction?
Distribution
This article or presentation is written as part of the Gaudí project. The Gaudí projectphilosophy is to improve by obtaining frequent feedback. Frequent feedback is pursued by anopen creation process. This document is published as intermediate or nearly mature versionto get feedback. Further distribution is allowed as long as the document remains completeand unchanged.
October 20, 2017status: preliminarydraftversion: 0
nu
mb
er
of
de
tails
100
101
106
105
104
103
102
107
108
109
performance definition
elaborated use cases
performance models
budgets and
measurements
component designs
killing details
key performance
ela
bo
ratio
n, d
esig
n a
nd
en
gin
ee
rin
g
sim
plif
ica
tio
n, a
bstr
actio
n
systems
multidisciplinary
monodisciplinary

Level of Abstraction Single System
100
101
106
105
104
103
102
107
static system definition
monodisciplinary
nu
mb
er o
fd
etai
ls
system
requirements
multidisciplinary
design
Architecting System Performance; Level of Abstraction43 Gerrit Muller
version: 0October 20, 2017
RAPpyramid

From system to Product Family or Portfolio
nu
mb
er
of
de
tails
system
multidisciplinary
monodisciplinary
100
101
106
105
104
103
102
107
100
101
106
105
104
103
102
107
108
109
systems
multidisciplinary
monodisciplinary
system portfolio
increase
Architecting System Performance; Level of Abstraction44 Gerrit Muller
version: 0October 20, 2017
DRALpyramidGrowth

Product Family in Context
100
106
103
109
systems
multidisciplinary design
parts, connections, lines of code
103
109
106
stakeholders
enterprise
enterprise contextn
um
be
r o
f
de
tails
Architecting System Performance; Level of Abstraction45 Gerrit Muller
version: 0October 20, 2017
RAPdiabolo

The seemingly random exploration path
leve
l of
det
ail
106
105
104
103
10
102
subject
1/20
2/19
3/184
5
6
7
9
10
11 12
13
14
15
16
178
thinking path
of an architect
during
a few minutes
up to 1 day
Architecting System Performance; Level of Abstraction46 Gerrit Muller
version: 0October 20, 2017
BWMAexplorationPath

Coverage of problem and solution space
covered or touched by architects
covered by engineers and experts
leve
l of
det
ailsubjects
Architecting System Performance; Level of Abstraction47 Gerrit Muller
version: 0October 20, 2017BWMAcoverage

Many Levels of Abstraction
nu
mb
er
of
de
tails
100
101
106
105
104
103
102
107
108
109
performance definition
elaborated use cases
performance models
budgets and
measurements
component designs
killing details
key performance
ela
bo
ratio
n, d
esig
n a
nd
en
gin
ee
rin
g
sim
plif
ica
tio
n, a
bstr
actio
n
systems
multidisciplinary
monodisciplinary
Architecting System Performance; Level of Abstraction48 Gerrit Muller
version: 0October 20, 2017
ASPLAlevels

Fidelity Properties
nu
mb
er
of
de
tails
100
101
106
105
104
103
102
107
108
109
systems
multidisciplinary
monodisciplinary
high fidelitylarge effort
slow
low fidelitylow effort
fast
stake-
holders
enterprise
enterprise context
what fidelity is needed for:
planning
training
validation
design exploration?
what configurations do we need?
what can we afford?
Architecting System Performance; Level of Abstraction49 Gerrit Muller
version: 0October 20, 2017ASPLAproperties

Visualizing Dynamic Behaviorby Gerrit Muller TNO-ESI, University College of South East Norway
e-mail: [email protected]
Abstract
Dynamic behavior manifests itself in many ways. Architects need multiple comple-mentary visualizations to capture dynamic behavior effectively. Examples arecapturing information, material, or energy flow, state, time, interaction, or commu-nication.
Distribution
This article or presentation is written as part of the Gaudí project. The Gaudí projectphilosophy is to improve by obtaining frequent feedback. Frequent feedback is pursued by anopen creation process. This document is published as intermediate or nearly mature versionto get feedback. Further distribution is allowed as long as the document remains completeand unchanged.
October 20, 2017status: preliminarydraftversion: 0
robot
prealign
clean
master
prefill
clean wafer
0 100b 200b
run
ED
P/L
RP
ho
ok u
p c
oile
d tu
bin
g/w
ire
line
fun
ctio
n a
nd
se
al te
st
run
co
iled
tu
bin
g/w
ire
line
asse
mb
ly a
nd
te
st
run
ris
ers
retr
ieve
co
iled
tu
bin
g/w
ire
line
ho
ok u
p S
FT
an
d T
F
retr
ieve S
FT
an
d T
F
retr
ieve
ris
ers
retr
ieve
ED
P/L
RP
actual workover operation
48 hrs
24 48 72 96
hours
dis
asse
mb
ly
preparation 36 hrs finishing 27 hrs
stop productionresume
productiondeferred operation 62 hrs
mo
ve
ab
ove
we
ll
mo
ve
aw
ay fro
m w
ell
RO
V a
ssis
ted
co
nn
ect
assembly,
functional test
run
EDP/LRP
run risers
hook up SFT
and TF
hook up coil
tubing and
wireline BOP
system function
and connection
seal test
run coil tubing
and wireline
retrieve coil
tubing and
wireline BOP
retrieve SFT and
TF
retrieve risers
retrieve
EDP/LRP
perform
workover
operations
move above wellmove away from
well
disassembly
3
2
1
4
5
7
6
unhook coil
tubing and
wireline BOP
12
11
10
9
7
8
ROV assisted
connect
ROV assisted
disconnect
Gz
Gx
Gy
RF
TETR
typical TE:
5..50ms
transmit receive
functional flow
9 101 2 3 4 5 6 7 8
call family doctor
visit family doctor
call neurology department
visit neurologist
call radiology department
examination itself
diagnosis by radiologist
report from radiologist to
neurologist
visit neurologist
19 2011 12 13 14 15 16 17 18 21 22 23 24 25
days
alarm mode
pre-alarm mode
operating
event reset
acknowledge
alarm handled
idle
start
Information Transformation Flow
Concrete “Cartoon” Workflow
Timeline of Workflow
Timeline and Functional
Flow
Swimming Lanes
Concurrency and Interaction
Signal Waveforms
State Diagram
Abstract
Workflow
get
sensor
data
transform
into image
get
sensor
data
transform
into image
fuse
sensor
images
detect
objects
classify
objects
update
world
model
get
external
data
analyze
situation
get goal
trajectory
get GPS
data
get v, a
calculate
GPS
location
estimate
location
update
location
world model
determine
next step
location
objects
vessel or
platform
rig
vessel or
platform
EDP
LRP
riser
XT
well
TF
SFT
well
head
WOCS
rig
vessel or
platform
EDP
LRP
riser
XT
well
TF
SFT
well
head
WOCS
rig
vessel or
platform
EDP
LRP
riser
XT
well
TF
SFT
well
head
WOCS
rig
vessel or
platform
EDP
LRP
TF
SFT
WOCS
XT
well
well
head
rig
vessel or
platform
EDP
LRP
riser
XT
well
TF
SFT
well
head
WOCS
ROV
ROV
rig
vessel or
platform
EDP
LRP
TF
SFT
WOCS
XT
well
well
head
rigTF
SFT
WOCS
XT
well
well
head
EDP
LRP
rig
vessel or
platform
TF
SFT
WOCS
XT
well
well
head
EDP
LRP
vessel or
platform
rigTF
SFT
WOCS
XT
well
well
head
EDP
LRP
vessel or
platform
rig
TF
SFT WOCS
XT
well
well
head
EDP
LRP
ROV
1 2 3 4 5 6
7 8 11 12
vessel or
platform
rig
TF
SFT WOCS
XT
well
well
head
LRP
9
EDP
vessel or
platform
rigTF
SFT
WOCS
XT
well
well
head
LRP
10
EDP
Information Centric Processing
Diagram
Flow of Light
illuminatorlaser
sensor
pulse-freq, bw,
wavelength, ..uniformity
lens
wafer
reticle
aerial image
NA
abberations
transmission
raw
image
resized
imageenhanced
image
grey-
value
image
view-
port
gfx
text
retrieve enhance inter-polate
lookup merge display

Overview of Visualizations of Dynamic Behavior
robot
prealign
clean
master
prefill
clean wafer
0 100b 200b
run
ED
P/L
RP
ho
ok u
p c
oile
d tu
bin
g/w
ire
line
fun
ctio
n a
nd
se
al te
st
run
co
iled
tu
bin
g/w
ire
line
asse
mb
ly a
nd
te
st
run
ris
ers
retr
ieve
co
iled
tu
bin
g/w
ire
line
ho
ok u
p S
FT
an
d T
F
retr
ieve S
FT
an
d T
F
retr
ieve
ris
ers
retr
ieve
ED
P/L
RP
actual workover operation
48 hrs
24 48 72 96
hours
dis
asse
mb
ly
preparation 36 hrs finishing 27 hrs
stop productionresume
productiondeferred operation 62 hrs
mo
ve
ab
ove
we
ll
mo
ve
aw
ay fro
m w
ell
RO
V a
ssis
ted
co
nn
ect
assembly,
functional test
run
EDP/LRP
run risers
hook up SFT
and TF
hook up coil
tubing and
wireline BOP
system function
and connection
seal test
run coil tubing
and wireline
retrieve coil
tubing and
wireline BOP
retrieve SFT and
TF
retrieve risers
retrieve
EDP/LRP
perform
workover
operations
move above wellmove away from
well
disassembly
3
2
1
4
5
7
6
unhook coil
tubing and
wireline BOP
12
11
10
9
7
8
ROV assisted
connect
ROV assisted
disconnect
Gz
Gx
Gy
RF
TETR
typical TE:
5..50ms
transmit receive
functional flow
9 101 2 3 4 5 6 7 8
call family doctor
visit family doctor
call neurology department
visit neurologist
call radiology department
examination itself
diagnosis by radiologist
report from radiologist to
neurologist
visit neurologist
19 2011 12 13 14 15 16 17 18 21 22 23 24 25
days
alarm mode
pre-alarm mode
operating
event reset
acknowledge
alarm handled
idle
start
Information Transformation Flow
Concrete “Cartoon” Workflow
Timeline of Workflow
Timeline and Functional
Flow
Swimming Lanes
Concurrency and Interaction
Signal Waveforms
State Diagram
Abstract
Workflow
get
sensor
data
transform
into image
get
sensor
data
transform
into image
fuse
sensor
images
detect
objects
classify
objects
update
world
model
get
external
data
analyze
situation
get goal
trajectory
get GPS
data
get v, a
calculate
GPS
location
estimate
location
update
location
world model
determine
next step
location
objects
vessel or
platform
rig
vessel or
platform
EDP
LRP
riser
XT
well
TF
SFT
well
head
WOCS
rig
vessel or
platform
EDP
LRP
riser
XT
well
TF
SFT
well
head
WOCS
rig
vessel or
platform
EDP
LRP
riser
XT
well
TF
SFT
well
head
WOCS
rig
vessel or
platform
EDP
LRP
TF
SFT
WOCS
XT
well
well
head
rig
vessel or
platform
EDP
LRP
riser
XT
well
TF
SFT
well
head
WOCS
ROV
ROV
rig
vessel or
platform
EDP
LRP
TF
SFT
WOCS
XT
well
well
head
rigTF
SFT
WOCS
XT
well
well
head
EDP
LRP
rig
vessel or
platform
TF
SFT
WOCS
XT
well
well
head
EDP
LRP
vessel or
platform
rigTF
SFT
WOCS
XT
well
well
head
EDP
LRP
vessel or
platform
rig
TF
SFT WOCS
XT
well
well
head
EDP
LRP
ROV
1 2 3 4 5 6
7 8 11 12
vessel or
platform
rig
TF
SFT WOCS
XT
well
well
head
LRP
9
EDP
vessel or
platform
rigTF
SFT
WOCS
XT
well
well
head
LRP
10
EDP
Information Centric Processing
Diagram
Flow of Light
illuminatorlaser
sensor
pulse-freq, bw,
wavelength, ..uniformity
lens
wafer
reticle
aerial image
NA
abberations
transmission
raw
image
resized
imageenhanced
image
grey-
value
image
view-
port
gfx
text
retrieve enhance inter-polate
lookup merge display
Visualizing Dynamic Behavior51 Gerrit Muller
version: 0October 20, 2017
VDBoverview

Example Functional Model of Information Flow
get
sensor
data
transform
into image
get
sensor
data
transform
into image
fuse
sensor
images
detect
objects
classify
objects
update
world
model
get
external
data
analyze
situation
get goal
trajectory
get GPS
data
get v, a
calculate
GPS
location
estimate
location
update
location
world model
determine
next step
location
objects
Visualizing Dynamic Behavior52 Gerrit Muller
version: 0October 20, 2017
BSEARfunctionalModel

”Cartoon” Workflow
vessel or
platform
rig
vessel or
platform
EDP
LRP
riser
XT
well
TF
SFT
well
head
WOCS
rig
vessel or
platform
EDP
LRP
riser
XT
well
TF
SFT
well
head
WOCS
rig
vessel or
platform
EDP
LRP
riser
XT
well
TF
SFT
well
head
WOCS
rig
vessel or
platform
EDP
LRP
TF
SFT
WOCS
XT
well
well
head
rig
vessel or
platform
EDP
LRP
riser
XT
well
TF
SFT
well
head
WOCS
ROV
ROV
rig
vessel or
platform
EDP
LRP
TF
SFT
WOCS
XT
well
well
head
rigTF
SFT
WOCS
XT
well
well
head
EDP
LRP
rig
vessel or
platform
TF
SFT
WOCS
XT
well
well
head
EDP
LRP
vessel or
platform
rigTF
SFT
WOCS
XT
well
well
head
EDP
LRP
vessel or
platform
rig
TF
SFT WOCS
XT
well
well
head
EDP
LRP
ROV
1 2 3 4 5 6
7 8 11 12
vessel or
platform
rig
TF
SFT WOCS
XT
well
well
head
LRP
9
EDP
vessel or
platform
rigTF
SFT
WOCS
XT
well
well
head
LRP
10
EDP
Visualizing Dynamic Behavior53 Gerrit Muller
version: 0October 20, 2017
SSMEtypicalWorkoverOperationCartoon
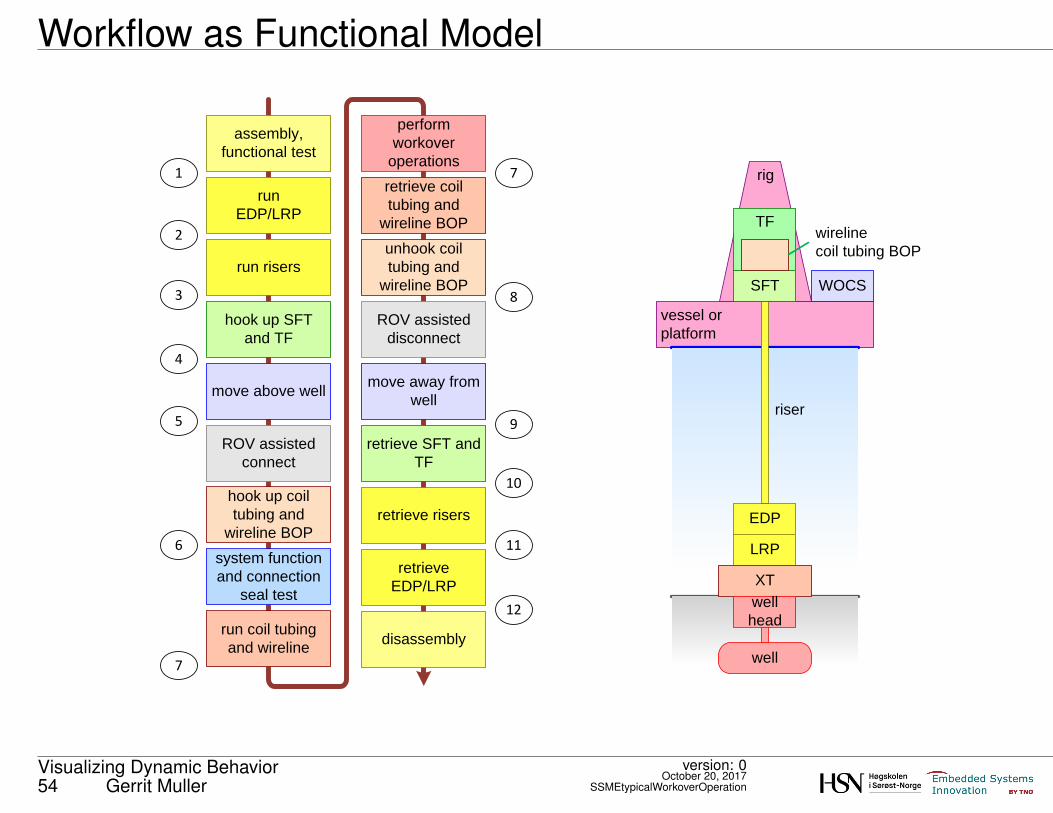
Workflow as Functional Model
rig
vessel or
platform
assembly,
functional test
run
EDP/LRP
run risers
hook up SFT
and TF
hook up coil
tubing and
wireline BOPEDP
LRP
riser
XT
well
TF
SFT
wireline
coil tubing BOP
well
head
WOCS
system function
and connection
seal test
run coil tubing
and wireline
retrieve coil
tubing and
wireline BOP
retrieve SFT and
TF
retrieve risers
retrieve
EDP/LRP
perform
workover
operations
move above wellmove away from
well
disassembly
3
2
1
4
5
7
6
unhook coil
tubing and
wireline BOP
12
11
10
9
7
8
ROV assisted
connect
ROV assisted
disconnect
Visualizing Dynamic Behavior54 Gerrit Muller
version: 0October 20, 2017
SSMEtypicalWorkoverOperation

Workflow as Timeline
run
ED
P/L
RP
ho
ok u
p c
oile
d tu
bin
g/w
ire
line
fun
ctio
n a
nd
se
al te
st
run
co
iled
tu
bin
g/w
ire
line
asse
mb
ly a
nd
te
st
run
ris
ers
retr
ieve
co
iled
tu
bin
g/w
ire
line
ho
ok u
p S
FT
an
d T
F
retr
ieve
SF
T a
nd
TF
retr
ieve
ris
ers
retr
ieve
ED
P/L
RP
actual workover operation
48 hrs
24 48 72 96
hours
dis
asse
mb
ly
assumptions:
running and retrieving risers: 50m/hr
running and retrieving coiled tubing/wireline: 100m/hr
depth: 300m
preparation 36 hrs finishing 27 hrs
stop productionresume
productiondeferred operation 62 hrs
mo
ve
ab
ove
we
ll
mo
ve
aw
ay fro
m w
ell
RO
V a
ssis
ted
co
nn
ect
Visualizing Dynamic Behavior55 Gerrit Muller
version: 0October 20, 2017
SSMEtypicalWorkoverOperationTimeline

Swimming Lane Example
robot
prealign
clean
master
prefill
clean wafer
0 100b 200b
Visualizing Dynamic Behavior56 Gerrit Muller
version: 0October 20, 2017
REPLIcellTimeLineSimplified

Example Signal Waveforms
Gz
Gx
Gy
RF
TETR
Gy=0 Gy=127
imaging =
repeating similar pattern
many times
typical TE:
5..50ms
transmit receive
Visualizing Dynamic Behavior57 Gerrit Muller
version: 0October 20, 2017
MRimaging

Example Time Line with Functional Model
functional flow
9 101 2 3 4 5 6 7 8
call family doctor
visit family doctor
call neurology department
visit neurologist
call radiology department
examination itself
diagnosis by radiologist
report from radiologist to
neurologist
visit neurologist
19 2011 12 13 14 15 16 17 18 21 22 23 24 25
days
Visualizing Dynamic Behavior58 Gerrit Muller
version: 0October 20, 2017
MRendToEndTimeLine

Information Centric Processing Diagram
raw
image
resized
imageenhanced
image
grey-
value
image
view-
port
gfx
text
retrieve enhance inter-polate
lookup merge display
Visualizing Dynamic Behavior59 Gerrit Muller
version: 0October 20, 2017
MICVprocessingCachedPixmaps

Example State Diagram
alarm mode
pre-alarm mode
operating
event reset
acknowledge
alarm handled
idle
start
Visualizing Dynamic Behavior60 Gerrit Muller
version: 0October 20, 2017VDBstateDiagram

Flow of Light (Physics)
illuminatorlaser
sensor
pulse-freq, bw,
wavelength, ..uniformity
lens
wafer
reticle
aerial image
NA
abberations
transmission
Visualizing Dynamic Behavior61 Gerrit Muller
version: 0October 20, 2017
TSAITphysicsView

Dynamic Behavior is Multi-Dimensional
How does the system work and operate?
Functions describe what rather than how.
Functions are verbs.
Input-Process-Output paradigm.
Multiple kinds of flows:
physical (e.g. hydrocarbons, goods, energy)
information (e.g. measurements, signals)
control
Time, events, cause and effect
Concurrency, synchronization, communication
multi-dimensional
information and
dynamic behavior
Visualizing Dynamic Behavior62 Gerrit Muller
version: 0October 20, 2017VDBkeyPhrases

Modeling and Analysis: Emerging Behaviorby Gerrit Muller TNO-ESI, University College of South East Norway
e-mail: [email protected]
Abstract
The essence of a system is that the parts together can do more than the separateparts. The interaction of the parts results in behavior and properties that cannotbe seen as beloning to individual parts. We call this type of behavior ”emergingbehavior”.
Distribution
This article or presentation is written as part of the Gaudí project. The Gaudí projectphilosophy is to improve by obtaining frequent feedback. Frequent feedback is pursued by anopen creation process. This document is published as intermediate or nearly mature versionto get feedback. Further distribution is allowed as long as the document remains completeand unchanged.
October 20, 2017status: preliminarydraftversion: 0
goal of design
risk side-effect
mitigated
risk side-effect
foreseen
foreseen, but
underestimated
unforeseen
undesired desired

Emergence is Normal and Everywhere
emergent behavior and properties =
function of
dynamic interaction between
parts in the system and
context of the system
examples
· flying and stalling of an airplane
· Tacoma bridge resonance
Modeling and Analysis: Emerging Behavior64 Gerrit Muller
version: 0October 20, 2017MAEBemergence

Emergence, Desire, and Foreseeing
goal of design
risk side-effect
mitigated
risk side-effect
foreseen
foreseen, but
underestimated
unforeseen
undesired desired
Modeling and Analysis: Emerging Behavior65 Gerrit Muller
version: 0October 20, 2017
MAEBmatrix

Modeling and Analysis: Budgetingby Gerrit Muller TNO-ESI, HSN-NISE
e-mail: [email protected]
Abstract
This presentation addresses the fundamentals of budgeting: What is a budget,how to create and use a budget, what types of budgets are there. What is therelation with modeling and measuring.
Distribution
This article or presentation is written as part of the Gaudí project. The Gaudí projectphilosophy is to improve by obtaining frequent feedback. Frequent feedback is pursued by anopen creation process. This document is published as intermediate or nearly mature versionto get feedback. Further distribution is allowed as long as the document remains completeand unchanged.
October 20, 2017status: preliminarydraftversion: 1.0
budgetdesign
estimates;simulations
V4aa
IO
micro benchmarks
aggregated functions
applications
measurements existing system
model
tproc
tover
+
tdisp
tover
+
+
spec
SRStboot 0.5s
tzap 0.2s
measurements new (proto)
systemform
micro benchmarks
aggregated functions
applications
profiles
traces
tuning
10
20
30
5
20
25
55
tproc
tover
tdisp
tover
Tproc
Tdisp
Ttotal
feedback
can be more complex
than additions

Budgeting
content of this presentation
What and why of a budget
How to create a budget (decomposition, granularity, inputs)
How to use a budget
Modeling and Analysis: Budgeting67 Gerrit Muller
version: 1.0October 20, 2017
MABUcontent

What is a Budget?
A budget is
a quantified instantation of a model
A budget can
prescribe or describe the contributions
by parts of the solution
to the system quality under consideration
Modeling and Analysis: Budgeting68 Gerrit Muller
version: 1.0October 20, 2017
MABUbudget

Why Budgets?
• to make the design explicit
• to provide a baseline to take decisions
• to specify the requirements for the detailed designs
• to have guidance during integration
• to provide a baseline for verification
• to manage the design margins explicitly
Modeling and Analysis: Budgeting69 Gerrit Muller
version: 1.0October 20, 2017
MABUgoals

Visualization of Budget Based Design Flow
budgetdesign
estimates;simulations
V4aa
IO
micro benchmarks
aggregated functions
applications
measurements existing system
model
tproc
tover
+
tdisp
tover
+
+
spec
SRStboot 0.5s
tzap 0.2s
measurements new (proto)
systemform
micro benchmarks
aggregated functions
applications
profiles
traces
tuning
10
20
30
5
20
25
55
tproc
tover
tdisp
tover
Tproc
Tdisp
Ttotal
feedback
can be more complex
than additions
Modeling and Analysis: Budgeting70 Gerrit Muller
version: 1.0October 20, 2017
EAAbudget
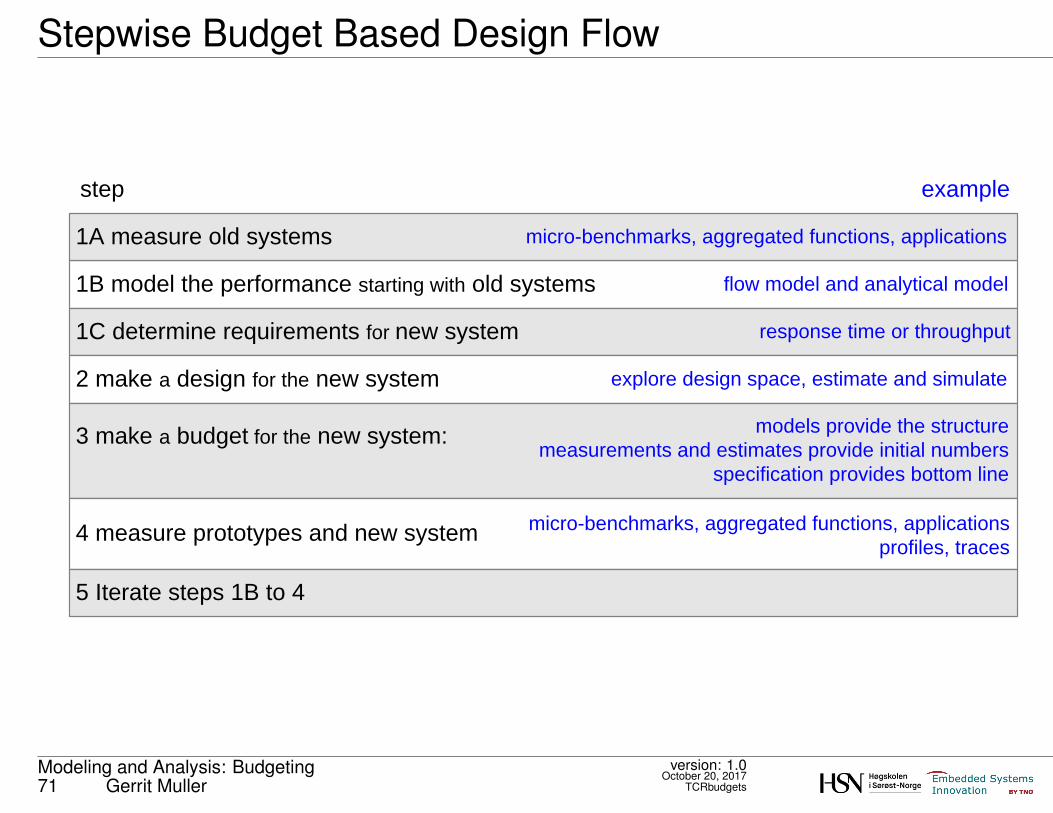
Stepwise Budget Based Design Flow
1B model the performance starting with old systems
1A measure old systems
1C determine requirements for new system
2 make a design for the new system
3 make a budget for the new system:
4 measure prototypes and new system
flow model and analytical model
micro-benchmarks, aggregated functions, applications
response time or throughput
explore design space, estimate and simulate
step example
models provide the structure
measurements and estimates provide initial numbers
specification provides bottom line
micro-benchmarks, aggregated functions, applications
profiles, traces
5 Iterate steps 1B to 4
Modeling and Analysis: Budgeting71 Gerrit Muller
version: 1.0October 20, 2017
TCRbudgets

Budgets Applied on Waferstepper Overlay
process
overlay
80 nm
reticule
15 nm
matched
machine
60 nm
process
dependency
sensor
5 nm
matching
accuracy
5 nm
single
machine
30 nm
lens
matching
25 nm
global
alignment
accuracy
6 nm
stage
overlay
12 nm
stage grid
accuracy
5 nm
system
adjustment
accuracy
2 nm
stage Al.
pos. meas.
accuracy
4 nm
off axis pos.
meas.
accuracy
4nm
metrology
stability
5 nm
alignment
repro
5 nm
position
accuracy
7 nm
frame
stability
2.5 nm
tracking
error phi
75 nrad
tracking
error X, Y
2.5 nm
interferometer
stability
1 nm
blue align
sensor
repro
3 nm
off axis
Sensor
repro
3 nm
tracking
error WS
2 nm
tracking
error RS
1 nm
Modeling and Analysis: Budgeting72 Gerrit Muller
version: 1.0October 20, 2017
ASMLoverlayBudget

Budgets Applied on Medical Workstation Memory Use
shared code
User Interface process
database server
print server
optical storage server
communication server
UNIX commands
compute server
system monitor
application SW total
UNIX Solaris 2.x
file cache
total
obj data
3.0
3.2
1.2
2.0
2.0
0.2
0.5
0.5
12.6
bulk data
12.0
3.0
9.0
1.0
4.0
0
6.0
0
35.0
code
11.0
0.3
0.3
0.3
0.3
0.3
0.3
0.3
0.3
13.4
total
11.0
15.3
6.5
10.5
3.3
6.3
0.5
6.8
0.8
61.0
10.0
3.0
74.0
memory budget in Mbytes
Modeling and Analysis: Budgeting73 Gerrit Muller
version: 1.0October 20, 2017
RVmemoryBudgetTable

Power Budget Visualization for Document Handler
paper path
scannerand feeder
procedé
UI and control
finisher
paper input module
power
supplies
sca
nn
er
fee
de
r
UI a
nd
co
ntr
ol
coolingpower supplies
paper path
procedé fin
ish
er
pa
pe
r
inp
ut
mo
du
le
size
proportional
to power
physical
layout
legend
cooling
Modeling and Analysis: Budgeting74 Gerrit Muller
version: 1.0October 20, 2017
MDMpowerProportions

Alternative Power Visualization
power supplies
cooling
UI and control
paper path
paper input module
finisher paper
procedé
electricalpower
heat
Modeling and Analysis: Budgeting75 Gerrit Muller
version: 1.0October 20, 2017
MDMpowerArrows

Evolution of Budget over Time
fact finding through details
aggregate to end-to-end performance
search for appropriate abstraction level(s)
from coarse guesstimate
to reliable prediction
from typical case
to boundaries of requirement space
from static understanding
to dynamic understanding
from steady state
to initialization, state change and shut down
from old system
to prototype
to actual implementation
time
start later only if needed
Modeling and Analysis: Budgeting76 Gerrit Muller
version: 1.0October 20, 2017MABUincrements

Potential Applications of Budget based design
• resource use (CPU, memory, disk, bus, network)
• timing (response, latency, start up, shutdown)
• productivity (throughput, reliability)
• Image Quality parameters (contrast, SNR, deformation, overlay, DOF)
• cost, space, time
Modeling and Analysis: Budgeting77 Gerrit Muller
version: 1.0October 20, 2017
MDMbudgetApplications

What kind of budget is required?
static
is the budget based on
wish, empirical data, extrapolation,
educated guess, or expectation?
typical case
global
approximate
dynamic
worst case
detailed
accurate
Modeling and Analysis: Budgeting78 Gerrit Muller
version: 1.0October 20, 2017
MDMbudgetTypes

Summary of Budgeting
A budget is a quantified instantiation of a model
A budget can prescribe or describe the contributions by parts of the solution
to the system quality under consideration
A budget uses a decomposition in tens of elements
The numbers are based on historic data, user needs, first principles and
measurements
Budgets are based on models and estimations
Budget visualization is critical for communication
Budgeting requires an incremental process
Many types of budgets can be made; start simple!
Modeling and Analysis: Budgeting79 Gerrit Muller
version: 1.0October 20, 2017
MABUsummary

Colophon
The Boderc project contributed to Budget Based
Design. Especially the work of
Hennie Freriks, Peter van den Bosch (Océ),
Heico Sandee and Maurice Heemels (TU/e, ESI)
has been valuable.
Modeling and Analysis: Budgeting80 Gerrit Muller
version: 1.0October 20, 2017
MABUcolofon

Modeling and Analysis; Modeling Paradigmsby Gerrit Muller TNO-ESI, University College of South East Norway
e-mail: [email protected]
Abstract
The word modeling is used for a wide variety of modeling approaches. Theseapproaches differ in purpose, level of detail, effort, stakeholders, degree offormaility, and tool support.
Distribution
This article or presentation is written as part of the Gaudí project. The Gaudí projectphilosophy is to improve by obtaining frequent feedback. Frequent feedback is pursued by anopen creation process. This document is published as intermediate or nearly mature versionto get feedback. Further distribution is allowed as long as the document remains completeand unchanged.
October 20, 2017status: plannedversion: 0
Conceptual system modeling
SysML
Design for 6 sigma
Conceptual information modeling
Design Framework
Matlab
CAD
Formal specification and design
(model checkers)
architecting
formal capture of structure and behavior
quality improvement in repeatable environments
understanding and formalizing information
capturing and tracing architecture decisions
modeling and analyzing designs and algorithms
mechanical and electrical design
verification
understanding, evaluating, creating
reasoning, communicating, decision making
simulation and code generation
interoperates with dedicated analysis,
e.g. thermal, structural
integrating other tools
simulating
paradigm purpose
black box oriented

Human Thinking and Tools
10 0
10 6 10 3
10 9
10 3
10 9
10 6
num
ber o
f de
tails
systems
multi-disciplinary design
parts, connections, lines of code
stakeholders
enterprise
enterprise context
tools to manage large amounts of
information
human overview
e.g. Doors Core
Modeling and Analysis; Modeling Paradigms82 Gerrit Muller
version: 0October 20, 2017
KDAWStoolsDiabolo

Formality Levels in Pyramids
100
101
106
105
104
103
102
107
mono-
disciplinary
multi-
disciplinary
system
nu
mb
er
of
de
tails
more formal, more rigorous
less formal,
communication-
oriented
generated/
instantiated
machine
readable
well defined
repeatable
reusable
heterogeneous
uncertainties, unknowns
variable backgrounds, concerns
SysML
DOORS
IDEF0
108
109
Modeling and Analysis; Modeling Paradigms83 Gerrit Muller
version: 0October 20, 2017
TBSApyramidFormality

Modeling Paradigms
Conceptual system modeling
SysML
Design for 6 sigma
Conceptual information modeling
Design Framework
Matlab
CAD
Formal specification and design
(model checkers)
architecting
formal capture of structure and behavior
quality improvement in repeatable environments
understanding and formalizing information
capturing and tracing architecture decisions
modeling and analyzing designs and algorithms
mechanical and electrical design
verification
understanding, evaluating, creating
reasoning, communicating, decision making
simulation and code generation
interoperates with dedicated analysis,
e.g. thermal, structural
integrating other tools
simulating
paradigm purpose
black box oriented
Modeling and Analysis; Modeling Paradigms84 Gerrit Muller
version: 0October 20, 2017MAMPparadigms

Modeling and Analysis: Applications and Variationsby Gerrit Muller TNO-ESI, University College of South East Norway
e-mail: [email protected]
Abstract
Models are used for a wide variation of purposes. Stakeholders can get confusedbetween ”reality” and the virtual counterparts. In practice, many hybrids between”real” and virtual systems exist. For example, planning and training systems usingreal algorithms and data, and physical systems using a world model for situationawareness.
Distribution
This article or presentation is written as part of the Gaudí project. The Gaudí projectphilosophy is to improve by obtaining frequent feedback. Frequent feedback is pursued by anopen creation process. This document is published as intermediate or nearly mature versionto get feedback. Further distribution is allowed as long as the document remains completeand unchanged.
October 20, 2017status: preliminarydraftversion: 0.1
“real” world
system-
of-interest
subsystem
systemsystem
stakeholders
environment
hardware
component
software
component
mutually interacting
consisting of
virtual world
system-
of-interest
subsystem
systemsystem
stakeholdersenvironment
hardware
component
software
component
mutually interacting
consisting of
“real” world; testing
system-of-
interest
subsystem
systemsystem
stakeholders
environment
hardware
component
software
component
mutually interacting
consisting of
virtual world; HIL
system-
of-interest
subsystem
systemsystem
environment
hardware
component
software
component
mutually interacting
consisting of
virtual world; SIL
system-
of-interest
subsystem
systemsystem
environment
hardware
component
software
component
mutually interacting
consisting of
agentts
stakeholders
agentts
stakeholders
agentts
simulation in context
system-
of-interest
subsystem
systemsystem
environment
hardware
component
software
component
consisting of
data
data
data data data
data
stakeholders
mutually interacting

Model Applications and Variations
developmentverification
validationoperation
understanding
exploration
optimization
test data
comparison
trouble shooting
mission planning
training
health monitoring
in system
situation awareness
planning
training
health monitoring
sales
acquisition
capability analysis
evolvability
all phases repeat
with same needs
Systems of Systems
apply all
asynchronously
Modeling and Analysis: Applications and Variations86 Gerrit Muller
version: 0.1October 20, 2017
MAVCmodelVariations

Spectrum from Real to Virtual Systems
“real” world
system-
of-interest
subsystem
systemsystem
stakeholders
environment
hardware
component
software
component
mutually interacting
consisting of
virtual world
system-
of-interest
subsystem
systemsystem
stakeholdersenvironment
hardware
component
software
component
mutually interacting
consisting of
“real” world; testing
system-of-
interest
subsystem
systemsystem
stakeholders
environment
hardware
component
software
component
mutually interacting
consisting of
virtual world; HIL
system-
of-interest
subsystem
systemsystem
environment
hardware
component
software
component
mutually interacting
consisting of
virtual world; SIL
system-
of-interest
subsystem
systemsystem
environment
hardware
component
software
component
mutually interacting
consisting of
agentts
stakeholders
agentts
stakeholders
agentts
simulation in context
system-
of-interest
subsystem
systemsystem
environment
hardware
component
software
component
consisting of
data
data
data data data
data
stakeholders
mutually interacting
Modeling and Analysis: Applications and Variations87 Gerrit Muller
version: 0.1October 20, 2017
MAPMvirtuality
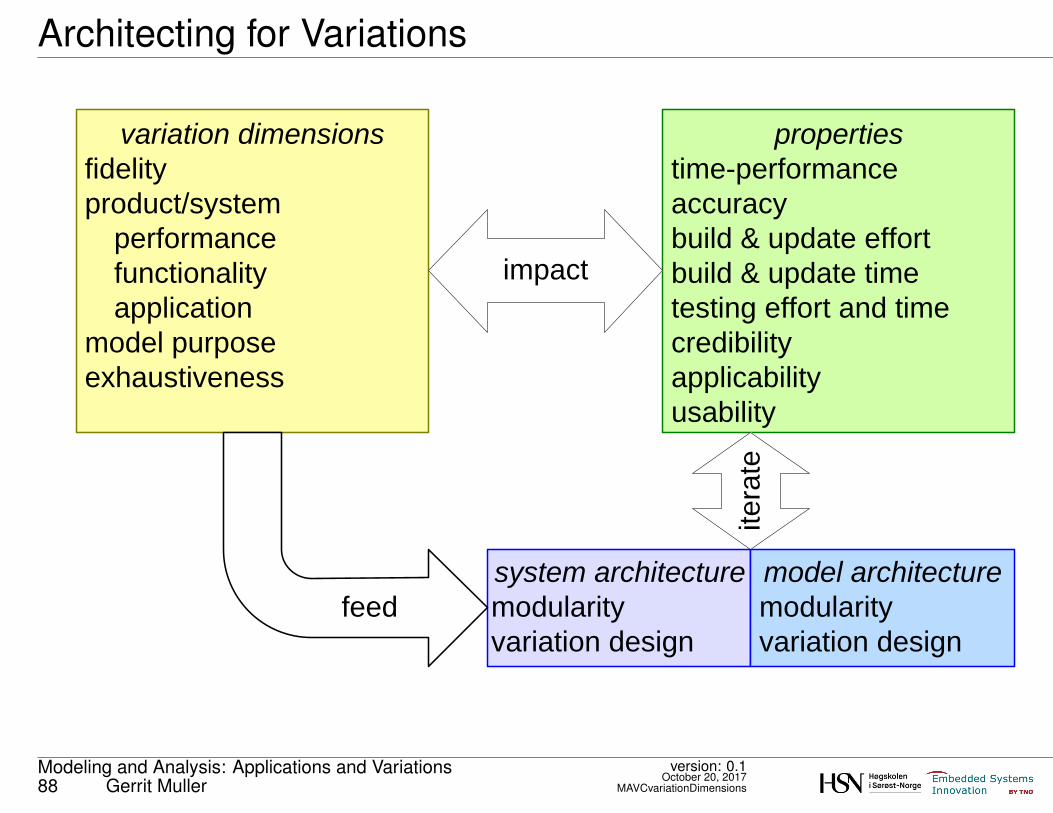
Architecting for Variations
variation dimensions
fidelity
product/system
performance
functionality
application
model purpose
exhaustiveness
properties
time-performance
accuracy
build & update effort
build & update time
testing effort and time
credibility
applicability
usability
impact
system architecture
modularity
variation design
model architecture
modularity
variation design
feed
ite
rate
Modeling and Analysis: Applications and Variations88 Gerrit Muller
version: 0.1October 20, 2017
MAVCvariationDimensions

Modeling and Analysis: Model Analysisby Gerrit Muller TNO-ESI, HBV-NISE
e-mail: [email protected]
Abstract
Models only get value when they are actively used. We will focus in this presen-tation on analysis aspects: accuracy, credibility, sensitivity, efficiency, robustness,reliability and scalability.
Distribution
This article or presentation is written as part of the Gaudí project. The Gaudí projectphilosophy is to improve by obtaining frequent feedback. Frequent feedback is pursued by anopen creation process. This document is published as intermediate or nearly mature versionto get feedback. Further distribution is allowed as long as the document remains completeand unchanged.
October 20, 2017status: plannedversion: 1.0
varying inputsvarying circumstances
varying design optionsvarying realizations
specification changes
and ripple through
model(s)
working rangeworst case behaviorexceptional behavior
accuracycredibilityworking range
sensitivityrobustnessefficiency
model
applicability
design
quality
design
understanding
exploration
optimization
verification
life cycleperformance
reliability
scalabilityother system qualities
specification
feasibility
use cases
worst case
exceptions
change cases

What Comes out of a Model
varying inputsvarying circumstances
varying design optionsvarying realizations
specification changes
and ripple through
model(s)
working rangeworst case behaviorexceptional behavior
accuracycredibilityworking range
sensitivityrobustnessefficiency
model
applicability
design
quality
design
understanding
exploration
optimization
verification
life cycleperformance
reliability
scalabilityother system qualities
specification
feasibility
use cases
worst case
exceptions
change cases
Modeling and Analysis: Model Analysis90 Gerrit Muller
version: 1.0October 20, 2017
MAANaspects

Applicability of the Model
model(s)
accuracycredibilityworking range
facts
measurements
assumptions
abstraction
usage context
specifications
designs
realizations
+-
12
input
accuracy
credibility
abstraction
credibility
working range
model realization
credibility
propagation
ab
stra
ctio
n
Modeling and Analysis: Model Analysis91 Gerrit Muller
version: 1.0October 20, 2017
MAANmodelApplicability

How to Determine Applicability
simple and small models1. Estimate accuracy of results
2. Identify top 3 credibility risks
3. Identify relevant working range risks
identify biggest uncertainties in
inputs, abstractions and realization
identify required (critical) working ranges and
compare with model working range
based on most significant inaccuracies of inputs
and assumed model propagation behavior
try out modelsbe aware of accuracy, credibility and working range
substantial modelssystematic analysis and documentation of accuracy,
credibility and working range
Modeling and Analysis: Model Analysis92 Gerrit Muller
version: 1.0October 20, 2017
MAANapplicabilityHowTo

Common Pitfalls
discrete events in continuous world
(too) systematic input data
fragile model
self fulfilling prophecy
discretization artefacts
e.g. stepwise simulations
random data show different behavior
e.g. memory fragmentation
small model change results in large shift in results
price erosions + cost increase (inflation) -> bankruptcy
Modeling and Analysis: Model Analysis93 Gerrit Muller
version: 1.0October 20, 2017
MAANpitfalls
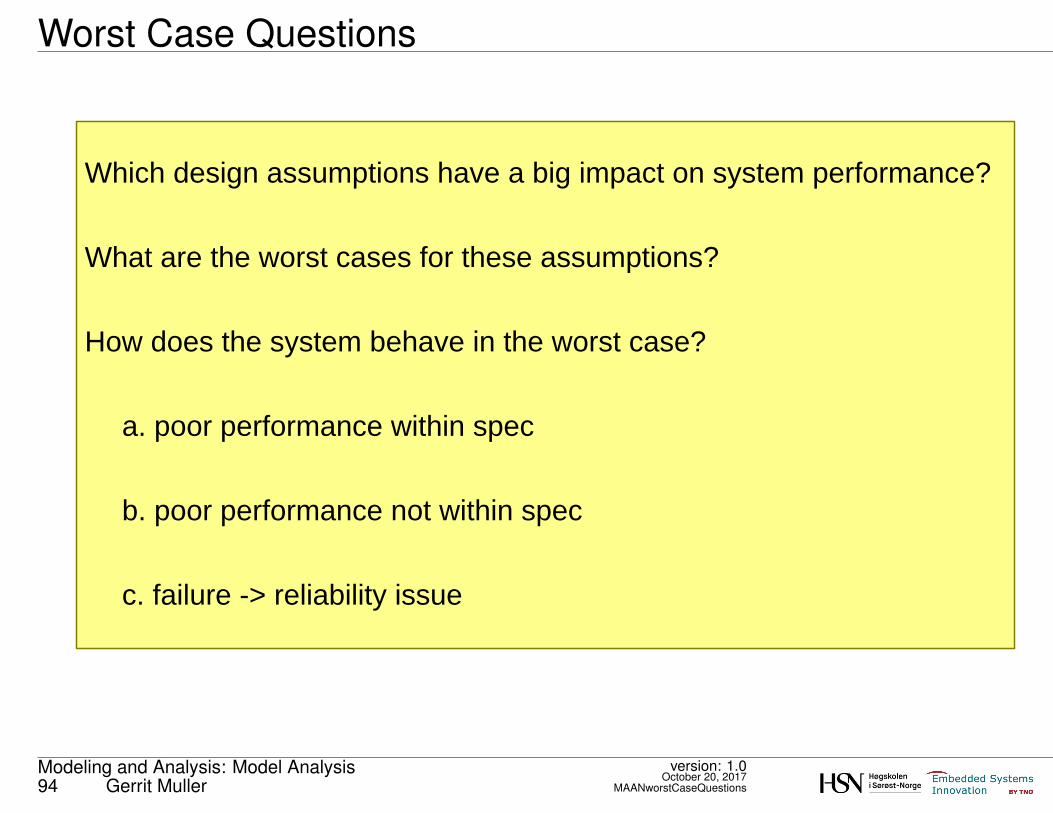
Worst Case Questions
Which design assumptions have a big impact on system performance?
What are the worst cases for these assumptions?
How does the system behave in the worst case?
a. poor performance within spec
b. poor performance not within spec
c. failure -> reliability issue
Modeling and Analysis: Model Analysis94 Gerrit Muller
version: 1.0October 20, 2017
MAANworstCaseQuestions

FMEA-like Analysis Techniques
potential hazardssafetyhazard analysis
reliabilityFMEA
failure modes
exceptional cases
security vulnerability risks
damage
effects
consequences
measures
measures
measures
maintainability change cases impact, effort, time
performance worst cases system behavior decisions
(systematic)
brainstorm
improvespec, design,
process,
procedure, ...
analysis and
assessmentprobability
severity
propagation
decisions
Modeling and Analysis: Model Analysis95 Gerrit Muller
version: 1.0October 20, 2017
MAANfmeaLikeAnalysis

Brainstorming Phases
wave 1: the obvious
wave 2: more of the same
wave 3: the exotic, but potentially important
don't stop too early with brainstorming!
Modeling and Analysis: Model Analysis96 Gerrit Muller
version: 1.0October 20, 2017MAANbrainstorm

Different Viewpoints for Analysis
life cycle context
systemusage context
new product
e.g. WoW extension
merger
automated access
new functions
new interfaces
new media
new standards
cache/memory trashing
garbage collection
critical sections
local peak loads
intermittent HW failure
power failure
network failure
new SW release
roll back to old SW release
Modeling and Analysis: Model Analysis97 Gerrit Muller
version: 1.0October 20, 2017MAANviewpoints

Modeling and Analysis: Reasoning Approachby Gerrit Muller TNO-ESI, HSN-NISE
e-mail: [email protected]
Abstract
We make models to facilitate decision making. These decisions range frombusiness decisions, such as Service Level Agreements, to requirements, and todetailed design decisions. The space of decisions is huge and heterogeneous.The proposed modeling approach is to use multiple small and simple models. Inthis paper we discuss how to reason by means of multiple models.
Distribution
This article or presentation is written as part of the Gaudí project. The Gaudí projectphilosophy is to improve by obtaining frequent feedback. Frequent feedback is pursued by anopen creation process. This document is published as intermediate or nearly mature versionto get feedback. Further distribution is allowed as long as the document remains completeand unchanged.
October 20, 2017status: preliminarydraftversion: 1.0 life cycle context
systemusage contextenterprise&users black box view design
m
a
d
d
d
dd
d
d
d
d
d
a
a
a
aa
aa
m
mm
m
m
m
m
m
m
m
m
d
d
d d
d
d
a
a
a
a
a
a
d
d
a
d
a
a
a
a
a a
d
d
d
d
dd
d
aa a
aa
ii
i
i
i i
i
i
i
i
i
i
i
i
a
i
d
m
legend
assumption
input e.g.
measurement
decision
model

Purpose of Modeling
facts from investigation
measurements
assumptions
uncertainties
unknowns
errors
modeling
analysis
resultsdecisionmaking
accuracy
working range
credibility
risk
customer satisfaction
time, cost, effort
profit margin
How to use multiple models to facilitate decisions?
How to get from many fragments to integral insight?
How many models do we need?
At what quality and complexity levels ?
specification
verification
decisions
Modeling and Analysis: Reasoning Approach99 Gerrit Muller
version: 1.0October 20, 2017
MAREpurpose

Graph of Decisions and Models
life cycle context
systemusage contextenterprise&users black box view design
m
a
d
d
d
dd
d
d
d
d
d
a
a
a
aa
aa
m
mm
m
m
m
m
m
m
m
m
d
d
d d
d
d
a
a
a
a
a
a
d
d
a
d
a
a
a
a
a a
d
d
d
d
dd
d
aa a
aa
ii
i
i
i i
i
i
i
i
i
i
i
i
a
i
d
m
legend
assumption
input e.g.
measurement
decision
model
Modeling and Analysis: Reasoning Approach100 Gerrit Muller
version: 1.0October 20, 2017
MAREgraph

Example Graph for Web Shop
life cycle context
systemusage contextenterprise&users black box view design
a
i
d
m
legend
assumption
input e.g.
measurement
decision
model
customerinterest
customerbehavior
financial
personnel
running cost
maintenanceeffort
initial cost
load
throughput
response time
CPU load
network load
storage capacity
transactions
picture cacheinformation
transactionspeed
transactionCPU
access time
overhead
market share
marketpenetration
margin
SLAresource
dimensionsing
salary
servicecost
workflow
changes
#products
CPU budget
memory budget
elapsed
time
budget
Modeling and Analysis: Reasoning Approach101 Gerrit Muller
version: 1.0October 20, 2017
MAREgraphWebShop
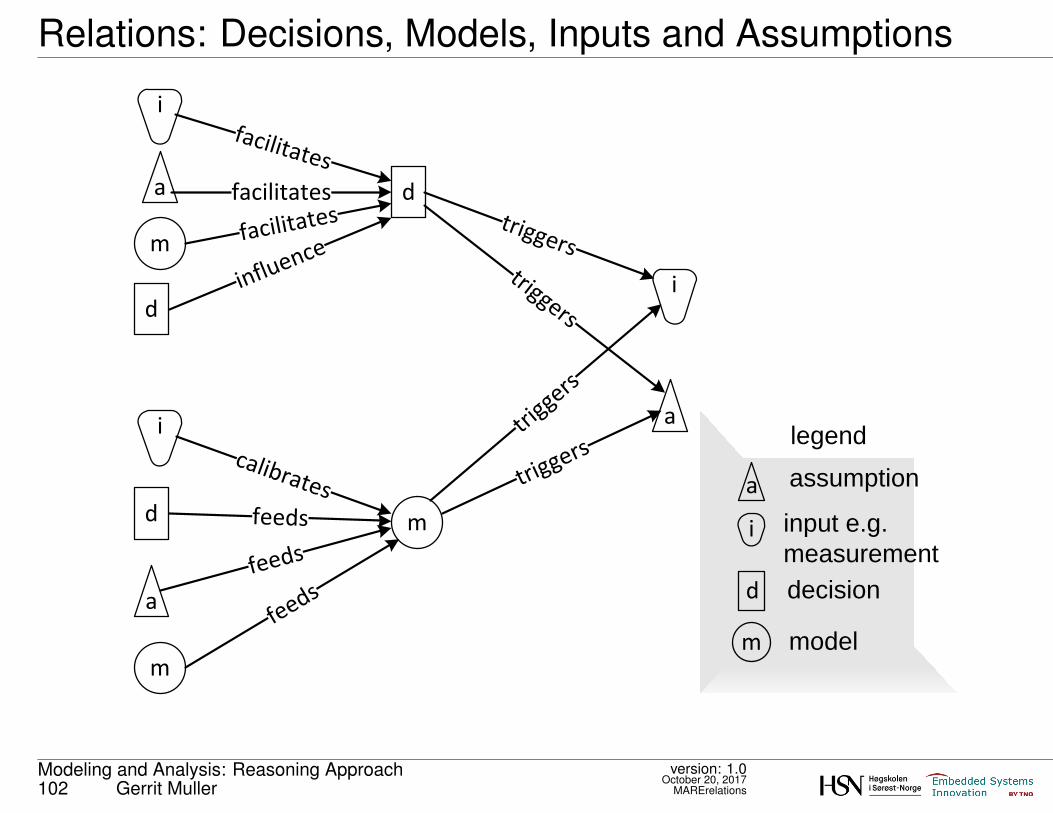
Relations: Decisions, Models, Inputs and Assumptions
m
d
d
a
i
a
i
d
m
legend
assumption
input e.g.
measurement
decision
model
facilitates
calibratesfeeds
feedsm
m
feeds
a
i
facilitates
facilitates
dinflu
ence
trigger
striggers
i
a
triggerstriggers
Modeling and Analysis: Reasoning Approach102 Gerrit Muller
version: 1.0October 20, 2017
MARErelations

Reasoning Approach
1. Explore usage context, life cycle context and system
t3. Make main Threads-of-
Reasoning SMART
t2. Determine main Threads-
of-Reasoning
t4. Identify "hottest" issues
b2b. Investigate facts
b2a. "Play" with models
b2c. Identify assumptions
top-down bottom-up
6. Capture overview, results and decisions
learn
7. Iterate and validate
all steps time-boxed between 1 hour and a few daysearly in
project
later in
project
t5. Model hottest,
non-obvious, issues
b3. Model significant,
non-obvious, issues
Modeling and Analysis: Reasoning Approach103 Gerrit Muller
version: 1.0October 20, 2017
MAREmethod

Frequency of Assumptions, Decisions and Modeling
a
i
d
m
legend
assumption
input e.g.
measurement
decision
model
100
106
104
102
i
implicit
(trivial?)
explicit
very simple
smallkey
substantial
m
d
a
d
a
m
d
mtry-outs
Modeling and Analysis: Reasoning Approach104 Gerrit Muller
version: 1.0October 20, 2017MAREfrequency
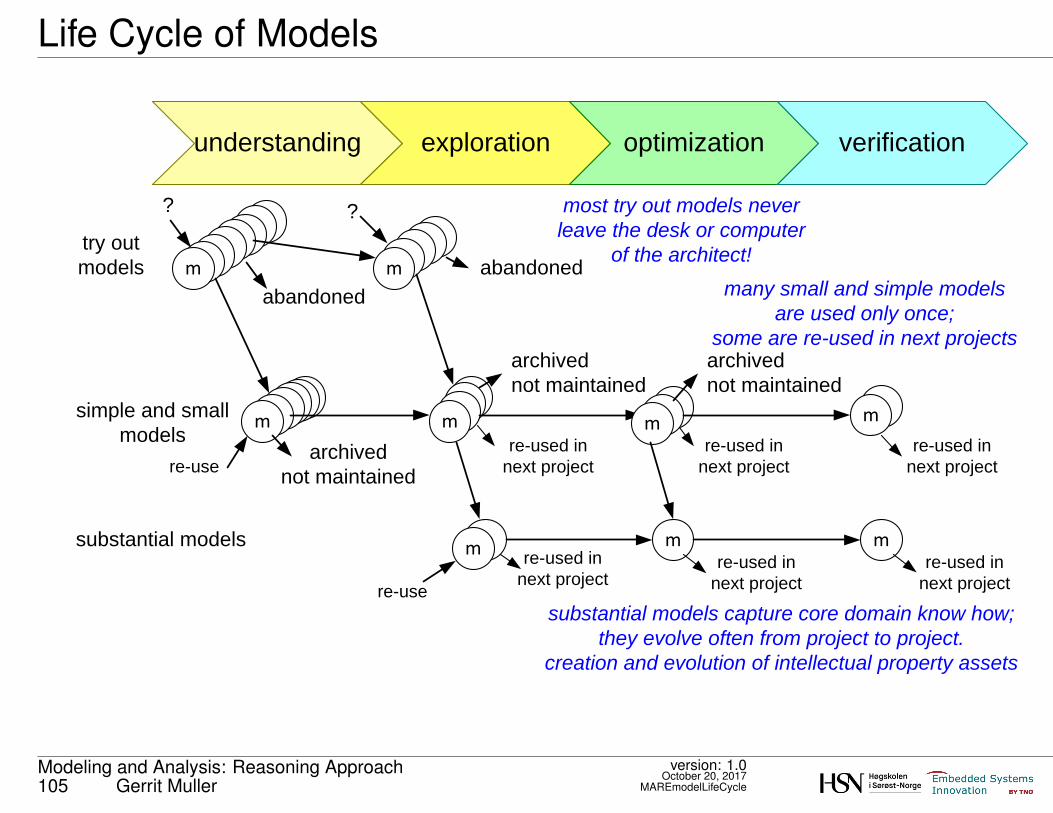
Life Cycle of Models
m
m
mm
mmm
mmmm
mmm mmm
understanding exploration optimization verification
try out
models m mm
mmm mm
m
m
m m
abandoned
abandoned
m
m
archived
not maintained
simple and small
models
substantial models
m
? ? most try out models never
leave the desk or computer
of the architect!
archived
not maintained
archived
not maintained
re-used in
next project
re-used in
next project
re-used in
next project
re-used in
next project
re-used in
next project
re-used in
next project
many small and simple models
are used only once;
some are re-used in next projects
substantial models capture core domain know how;
they evolve often from project to project.
creation and evolution of intellectual property assets
re-use
re-use
Modeling and Analysis: Reasoning Approach105 Gerrit Muller
version: 1.0October 20, 2017
MAREmodelLifeCycle

Examples of Life Cycle of Models
understanding exploration optimization verification
try out
models
simple and small
models
substantial models
(IP assets)
load/cost
load/cost
peak impact
customer
global
distribution
web server
performance
global
customer
demographics
function
mix
webshop
benchmark
suite
load/stress
test suiteintegral
load
model
Modeling and Analysis: Reasoning Approach106 Gerrit Muller
version: 1.0October 20, 2017
MAREmodelLifeCycleExample

Architecting System Performance; Defining Performanceby Gerrit Muller TNO-ESI, University College of South East Norway
e-mail: [email protected]
Abstract
Performance is a broad term. Each domain has its own key performance param-eters. Performance can be used to indicate time-oriented performance, such asresponse time, throughput, or productivity. However, more broadly, it may beused for aspects like image quality, spatial performance (f.i. positioning accuracy),energy or power properties, sensitivity and specificity of algorithms, or reliabilityand availability.
Distribution
This article or presentation is written as part of the Gaudí project. The Gaudí projectphilosophy is to improve by obtaining frequent feedback. Frequent feedback is pursued by anopen creation process. This document is published as intermediate or nearly mature versionto get feedback. Further distribution is allowed as long as the document remains completeand unchanged.
October 20, 2017status: preliminarydraftversion: 0.1
time-oriented
response time
latency
throughput
productivity
spatial
positioning accuracy
working envelope
range
turning cycle
energy/power
energy consumption
range
standby time
maximum power
heat release
cooling capacity
algorithmic
sensitivity
specificity
accuracy
coverage
image quality
sharpness
contrast
color consistency
color rendition
streakiness
uniformity
reliability
MTBF
MTTR
uptime
unscheduled breaks

Performance Attributes
time-oriented
response time
latency
throughput
productivity
spatial
positioning accuracy
working envelope
range
turning cycle
energy/power
energy consumption
range
standby time
maximum power
heat release
cooling capacity
algorithmic
sensitivity
specificity
accuracy
coverage
image quality
sharpness
contrast
color consistency
color rendition
streakiness
uniformity
reliability
MTBF
MTTR
uptime
unscheduled breaks
Architecting System Performance; Defining Performance108 Gerrit Muller
version: 0.1October 20, 2017
ASPDPperformanceAttributes

Defining Performance
performance is a function of:
context
perception
circumstances
operation of interest
system of interest
specification
design
configuration
version
history
scenario
use case1
1a
use case in this context is rich (includes quantifications) and
broad (covers the operation of interest, not a single function)
generic, valid for the class of systems
normal and special cases
(worst case, degraded, exceptions, …)
instance specific
depends on individual human characteristics
Architecting System Performance; Defining Performance109 Gerrit Muller
version: 0.1October 20, 2017
ASPDPdefiningPerformance

Example EV Range Definition
0
20
40
60
80
100
120
0 200 400 600 800 1000 1200
Sp
ee
d,
km
/h
Time, s
New European Drive Cycle
http://en.wikipedia.org/wiki/New_European_Driving_Cycle#/media/File:New_European_Driving_Cycle.svg
Published under GFDL, thanks to Orzetto
Electric Vehicle
Driving Range
Range = f(
v(t),
Circumstances,
Driving style,
Car load,
Charging state,
Battery age)
A quantified Use Case
defines under what
circumstances the EV will
achieve the specified
range.
0
20
40
60
80
100
120
1200
Time, s
10008006004002000
Sp
ee
d k
m/h
Architecting System Performance; Defining Performance110 Gerrit Muller
version: 0.1October 20, 2017
SAFMdriveCycleExample

End-to-End Performance
tend-to-end = thuman activities + twait + televator handling + tmove
tmovetelevator
handling 1
televator
handling 2
thuman
activities in
thuman
activities outtwait
press
button
arrive at
destination
floor
walk in walk out
nett moving
time
nett elevator time
end-to-end time
The end-to-end performance is the relevant performance as the
stakeholder experiences it: from initial trigger to final result.
Architecting System Performance; Defining Performance111 Gerrit Muller
version: 0.1October 20, 2017MAPMendToEnd

Architecting System Performance; Measuringby Gerrit Muller TNO-ESI, University College of South East Norway
e-mail: [email protected]
Abstract
Measuring is an essential part of architecting performance. Measurementsprovide quantified insight in actual behavior and performance. In this presen-tation, we discuss measuring, benchmarking, and instrumentation.
Distribution
This article or presentation is written as part of the Gaudí project. The Gaudí projectphilosophy is to improve by obtaining frequent feedback. Frequent feedback is pursued by anopen creation process. This document is published as intermediate or nearly mature versionto get feedback. Further distribution is allowed as long as the document remains completeand unchanged.
October 20, 2017status: preliminarydraftversion: 0
typical small testprogram
create steady state
ts = timestamp()
for(i=0;i<1M;i++) do something
te = timestamp()
duration = ts - te
small test programs
HW support
(computing) hardware
operating system
services
applicationsinstrumentation
small test programs
test suite
task manager
perfmon
ps, vmstat
small test programs
tools
OIT
visual inspection
small test programs
heapviewer
OS
me
mo
ry
instr
um
en
tatio
n
processing
parametrized
processing

Performance Attributes in the Benchmark Stack
CPU
cache
memory
bus
..
(computing) hardware
typical values
interference
variation
boundaries
operating system
services
applications
network transfer
database access
database query
services/functions
duration
CPU time
footprint
cache
end-to-end
function
duration
services
interrupts
task switches
OS services
CPU time
footprint
cache
latency
bandwidth
efficiency
interrupt
task switch
OS services
duration
footprint
interrupts
task switches
OS services
tools
locality
density
efficiency
overhead
Architecting System Performance; Measuring113 Gerrit Muller
version: 0October 20, 2017
EBMIbenchmarkStack

Performance as Function of the Layers
hardware
operating system
services
applications
tools
system performance = f( ,
,
,
,
)
wh
at is
use
d?
ho
w o
ften
?
ho
w m
uch
d
oes
it c
ost
?
Architecting System Performance; Measuring114 Gerrit Muller
version: 0October 20, 2017
EBMIperformanceFormula

Example µBenchmarks for Software
object creation
object destructionmethod invocation
component creation
component destruction
open connection
close connection
method invocationsame scope
other context
start session
finish session
perform transaction
query
transfer data
function call
loop overhead
basic operations (add, mul, load, store)
infrequent operations,
often time-intensive
often repeated
operations
database
network,
I/O
high level
construction
low level
construction
basic
programming
memory allocation
memory free
task, thread creationOS task switch
interrupt response
HW cache flush
low level data transfer
power up, power down
boot
Architecting System Performance; Measuring115 Gerrit Muller
version: 0October 20, 2017
RVuTimingBenchmarks

Measurement Errors and Accuracy
system
under study
measurement
instrument
measured signal
noise resolution
value
measurement
error
time
valu
e
+ε1
calibrationoffset
characteristics
measurements have
stochastic variations and
systematic deviations
resulting in a range
rather than a single value
-ε2
+ε1-ε2
Architecting System Performance; Measuring116 Gerrit Muller
version: 0October 20, 2017
MAMEmeasurementError

Be Aware of Error Propagation
tduration = tend - tstart
tend
tstart = 10 +/- 2 µs
= 14 +/- 2 µs
tduration = 4 +/- ? µs
systematic errors: add linear
stochastic errors: add quadratic
Architecting System Performance; Measuring117 Gerrit Muller
version: 0October 20, 2017
MAMEerrorPropagation

Intermezzo Modeling Accuracy
Measurements have
stochastic variations and systematic deviations
resulting in a range rather than a single value.
The inputs of modeling,
"facts", assumptions, and measurement results,
also have stochastic variations and systematic deviations.
Stochastic variations and systematic deviations
propagate (add, amplify or cancel) through the model
resulting in an output range.
Architecting System Performance; Measuring118 Gerrit Muller
version: 0October 20, 2017MAMEintermezzo

Tools and Instruments in the Benchmark Stack
typical small testprogram
create steady state
ts = timestamp()
for(i=0;i<1M;i++) do something
te = timestamp()
duration = ts - te
small test programs
HW support
(computing) hardware
operating system
services
applicationsinstrumentation
small test programs
test suite
task manager
perfmon
ps, vmstat
small test programs
tools
OIT
visual inspection
small test programs
heapviewer
OS
me
mo
ry
instr
um
en
tatio
n
processing
parametrized
processing
Architecting System Performance; Measuring119 Gerrit Muller
version: 0October 20, 2017
EBMIbenchmarkPositions

Architecting System Performance; Resource Managementby Gerrit Muller TNO-ESI, University College of South East Norway
e-mail: [email protected]
Abstract
The management of the resources largely determines system performance. Thisdocument discusses concepts related to resource management, such as caching,concurrency, and scheduling.
Distribution
This article or presentation is written as part of the Gaudí project. The Gaudí projectphilosophy is to improve by obtaining frequent feedback. Frequent feedback is pursued by anopen creation process. This document is published as intermediate or nearly mature versionto get feedback. Further distribution is allowed as long as the document remains completeand unchanged.
October 20, 2017status: preliminarydraftversion: 0.1
present
process or
compute
communicate
store
acquire
output
process
transport
store
input
virtual physical
raw
materialfetch
store
transport process transport process delivertransport
store store
product

Generic Resource Model
present
process or
compute
communicate
store
acquire
output
process
transport
store
input
virtual physical
raw
materialfetch
store
transport process transport process delivertransport
store store
product
Architecting System Performance; Resource Management121 Gerrit Muller
version: 0.1October 20, 2017
ASPRMgenericResources

Design Considerations for Resource Management
Performance depends on resource utilization and management.
The design of the logistics, how does EMI1 flow through the resources,
is critical.
Critical design aspects are:
· concurrency (parallelism, pipelining)
· granularity of EMI
· scheduling (allocation of resources)
1Energy Material Information
Architecting System Performance; Resource Management122 Gerrit Muller
version: 0.1October 20, 2017
ASPRMdesign

Granularity as Key Design Choice
video frame
video line
pixel
unit of
synchronization
unit of
buffering
==
or
<>
==
or
<>
unit of
processing
==
or
<>
unit of
I/O
fine grain:
flexible
high overhead
coarse grain:
rigid
low overhead
Architecting System Performance; Resource Management123 Gerrit Muller
version: 0.1October 20, 2017
EACgranularity

Size versus Performance Trade off
ran
do
m d
ata
pro
ce
ssin
g
pe
rfo
rma
nce
in o
ps/s
data set sizein bytes
103
106
109
1012
1015
L1
cache
L3
cache
main
memory
hard
disk
disk
farm
robotized
media
109
103
106
fast technology
small
expensive
small capacity
large capacity
slow technology
large
low cost
staircase effect:
performance and
size are non-linear
with thresholds example data storage technology
Architecting System Performance; Resource Management124 Gerrit Muller
version: 0.1October 20, 2017
ASPRMsizeVsPerformance

Pipeline pattern
production line = pipeline
car ncar n+1car n+2car n+3
lean uses the notion of tact
f.i. every 10 minutes the products
move to the next workspot
throughput = products/time
tproduction 1 car = tin - tout
Architecting System Performance; Resource Management125 Gerrit Muller
version: 0.1October 20, 2017
ASPRMproductionPipeline
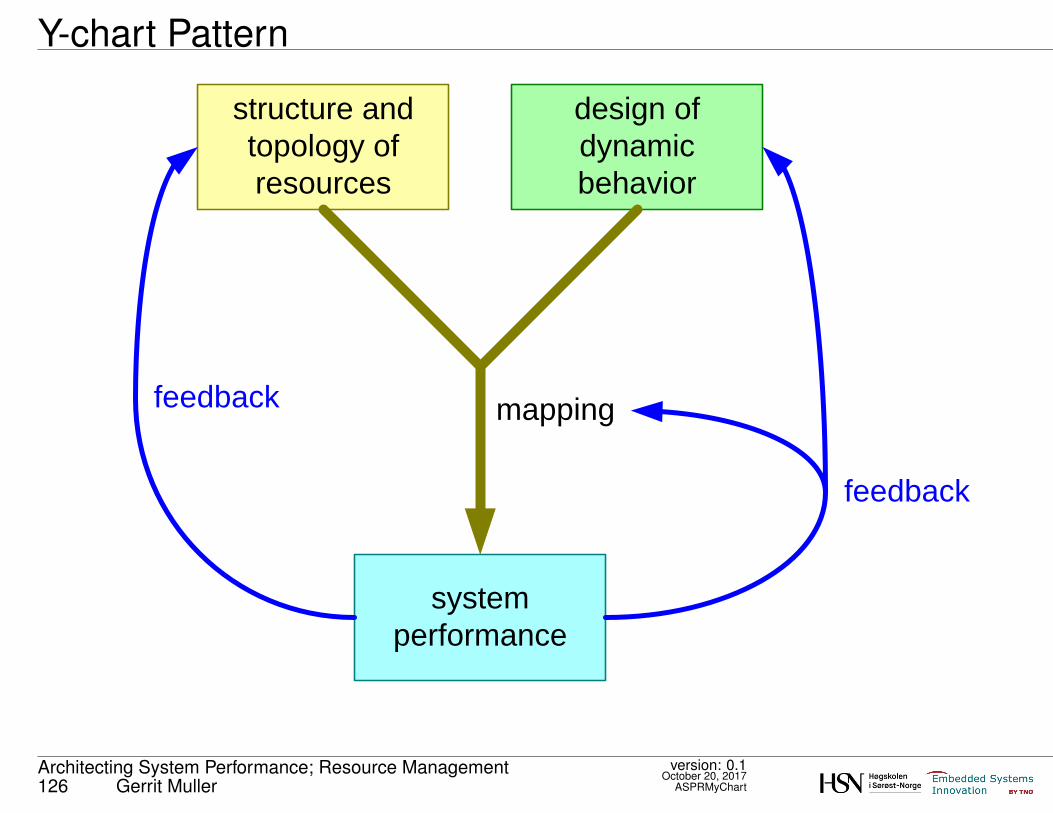
Y-chart Pattern
structure and
topology of
resources
design of
dynamic
behavior
system
performance
mapping
feedback
feedback
Architecting System Performance; Resource Management126 Gerrit Muller
version: 0.1October 20, 2017
ASPRMyChart

Performance Pitfalls and Resource Management
Overhead (control, handling)
Starvation (underrun)
Saturation/stagnation (overrun)
Variation (duration, quality)
Serialization
Interference with other work
Unnecessary conversions or adaptations
Architecting System Performance; Resource Management127 Gerrit Muller
version: 0.1October 20, 2017
ASPRMpitfalls

Architecting System Performance; Greedy and LazyPatterns
by Gerrit Muller TNO-ESI, University College of South East Norwaye-mail: [email protected]
www.gaudisite.nl
Abstract
Greedy and lazy are two opposite patterns in performance design. An extremeapplication of both patterns is start-up, where greedy starts as much as possible,and lazy as little as possible.
Distribution
This article or presentation is written as part of the Gaudí project. The Gaudí projectphilosophy is to improve by obtaining frequent feedback. Frequent feedback is pursued by anopen creation process. This document is published as intermediate or nearly mature versionto get feedback. Further distribution is allowed as long as the document remains completeand unchanged.
October 20, 2017status: preliminarydraftversion: 0.1
logo TBD

Greedy and Lazy Patterns
lazy
(on demand, pull)
greedy
(push, forecast)
what
benefits
do nothing until someone needs it
no resource usage unless needed
prepare time consuming operations,
when resources are idle
results are available immediately
some resource use is wastedtime to result depends on execution
time
disadvantages
when default to achieve required performance
(explore other concepts too!)
this pattern applies to all domains (IT, goods flow, energy)
Architecting System Performance; Greedy and Lazy Patterns129 Gerrit Muller
version: 0.1October 20, 2017
ASPGLpatterns

Start up of Systems as Example
initial
running
operating
start system
start operation
How much time does it take
to start a laptop with Windows?
How much time does it take
to start an application (e.g. Word)?
Architecting System Performance; Greedy and Lazy Patterns130 Gerrit Muller
version: 0.1October 20, 2017
ASPGLstartup

Example from Cloud Applications
data
base
server
web
server
client client
network
network
client
screen screen screen
presentation
computation
communication
storage
legend
Architecting System Performance; Greedy and Lazy Patterns131 Gerrit Muller
version: 0.1October 20, 2017
MAFTgenericBlockDiagram

Caching Pattern (Physical Grab Stock)
design parameters
caching algorithm
storage location
cache size
chunk size
format
performance issues
long latency (mass) storage
long latency communication
overhead communication
resource intensive processing
solution patterns
low latency
less communication
large chunks (less overhead)
processing once (keep results)
frequently used subset
in fast local storage
Architecting System Performance; Greedy and Lazy Patterns132 Gerrit Muller
version: 0.1October 20, 2017
ASPGLwhyCaching
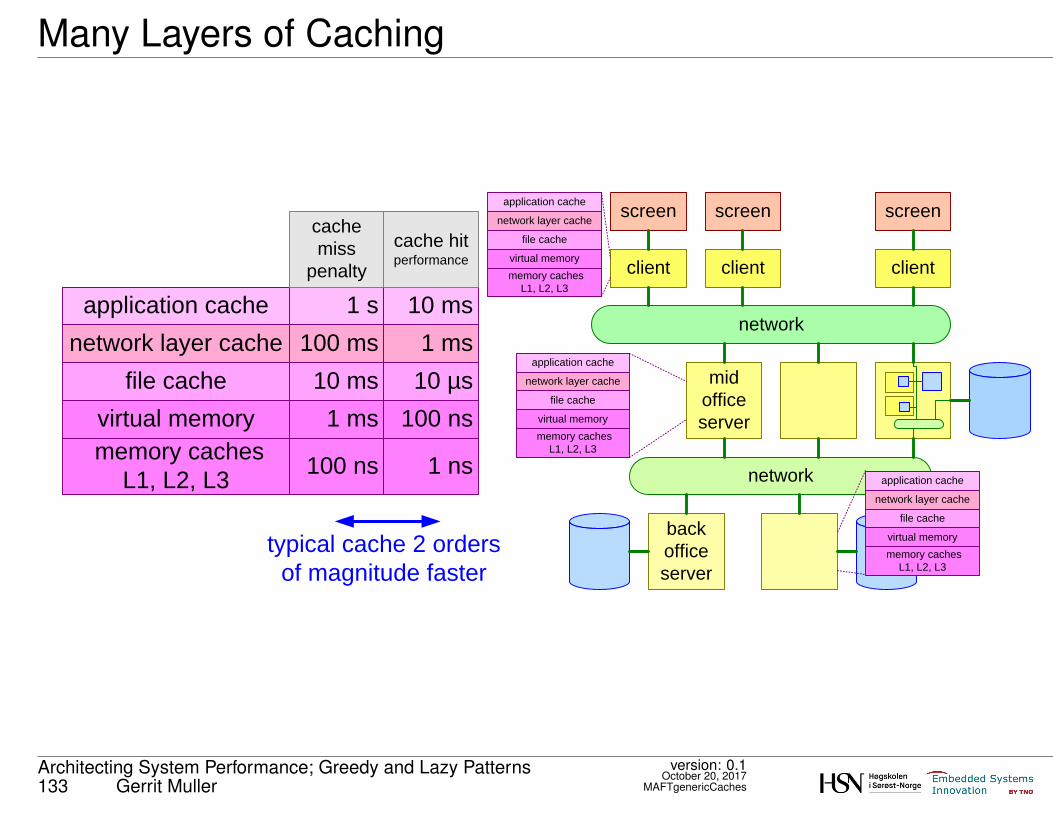
Many Layers of Caching
back
office
server
mid
office
server
client client
network
network
client
screen screen screen
network layer cache
file cache
application cache
memory caches
L1, L2, L3
virtual memory
100 ms
10 ms
1 s
100 ns
1 ms
cache
miss
penalty
1 ms
10 µs
10 ms
1 ns
100 ns
cache hit performance
network layer cache
file cache
application cache
memory caches
L1, L2, L3
virtual memory
network layer cache
file cache
application cache
memory caches
L1, L2, L3
virtual memory
network layer cache
file cache
application cache
memory caches
L1, L2, L3
virtual memorytypical cache 2 orders
of magnitude faster
Architecting System Performance; Greedy and Lazy Patterns133 Gerrit Muller
version: 0.1October 20, 2017
MAFTgenericCaches

Disadvantages of Caching Pattern
robustness for application changes
ability to benefit from technology improvements
robustness for changing context (e.g. scalability)
robustness for concurrent applications
failure modes in exceptional user space
These patterns increase complexity and coupling.
Use only when necessary for performance.
Architecting System Performance; Greedy and Lazy Patterns134 Gerrit Muller
version: 0.1October 20, 2017
ASPGLcachingRisks
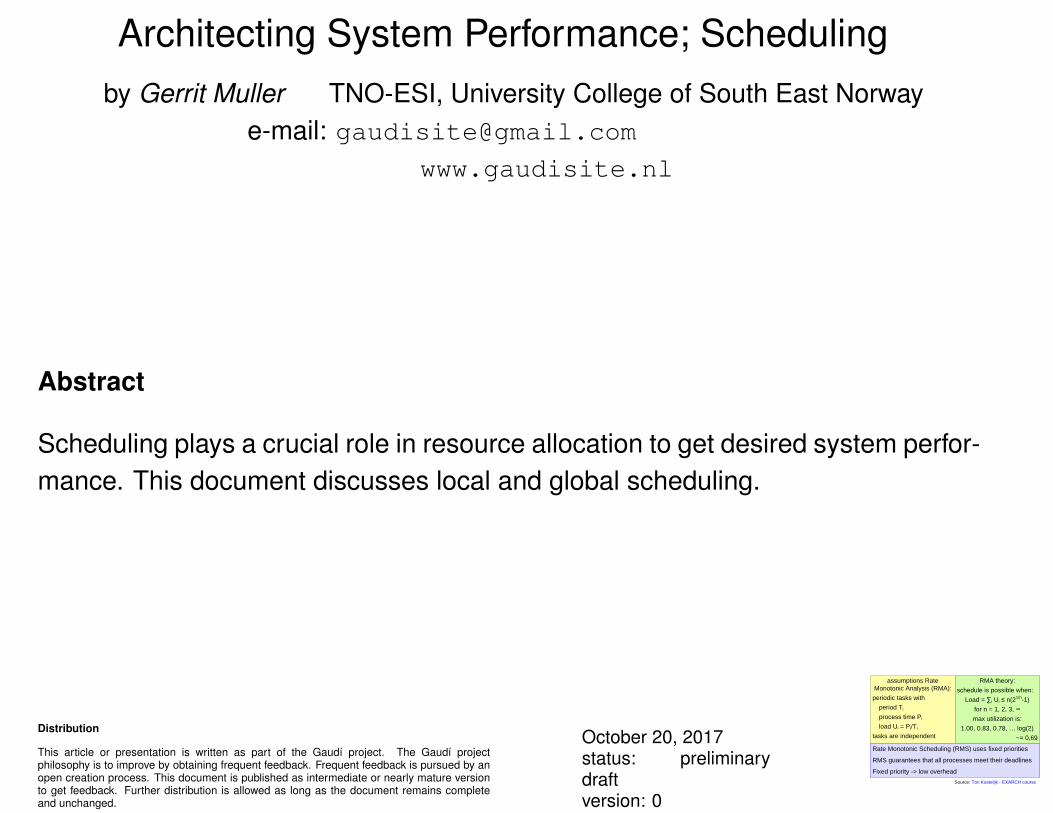
Architecting System Performance; Schedulingby Gerrit Muller TNO-ESI, University College of South East Norway
e-mail: [email protected]
Abstract
Scheduling plays a crucial role in resource allocation to get desired system perfor-mance. This document discusses local and global scheduling.
Distribution
This article or presentation is written as part of the Gaudí project. The Gaudí projectphilosophy is to improve by obtaining frequent feedback. Frequent feedback is pursued by anopen creation process. This document is published as intermediate or nearly mature versionto get feedback. Further distribution is allowed as long as the document remains completeand unchanged.
October 20, 2017status: preliminarydraftversion: 0
assumptions Rate
Monotonic Analysis (RMA):
periodic tasks with
period Ti
process time Pi
load Ui = Pi/Ti
tasks are independent
RMA theory:
schedule is possible when:
Load = ∑i Ui ≤ n(21/n
-1)
for n = 1, 2, 3, ∞
max utilization is:
1.00, 0.83, 0.78, … log(2)
~= 0,69
Source: Ton Kostelijk - EXARCH course
Rate Monotonic Scheduling (RMS) uses fixed priorities
RMS guarantees that all processes meet their deadlines
Fixed priority -> low overhead

Single Resource Scheduling
Scheduling of time critical operations on a single
resource:
· Earliest Deadline First
optimal
complex to realize
· Rate Monotonic Scheduling
no full utilization
simple to realize
Architecting System Performance; Scheduling136 Gerrit Muller
version: 0October 20, 2017
ASPSCintro

Earliest Deadline First
• Constraints
• Determine deadlines in Absolute time (CPU cycles or msec, etc.)
• Assign priorities Process that has the earliest deadline
gets the highest priority
(no need to look at other processes)
Smart mechanism needed
for Real-Time determination of deadlines
Pre-emptive scheduling needed
EDF = Earliest Deadline First
Earliest Deadline based scheduling
for (a-)periodic Processing
The theoretical limit for any number of processes
is 100% and so the system is schedulable.
Architecting System Performance; Scheduling137 Gerrit Muller
version: 0October 20, 2017
PHRTedfPriorityAssignment

Exercise Earliest Deadline First (EDF)
Calculate loads and determine thread activity (EDF)
Source: Ton Kostelijk - EXARCH course
Suppose at t=0, all threads are ready to process the arrived trigger.
0 9 15 18 23
Thread 1
Thread 2
Thread 3
Thread Period = deadline Processing Load
Thread 1 9 3 33.3%
Thread 2 15 5
Thread 3 23 5
Architecting System Performance; Scheduling138 Gerrit Muller
version: 0October 20, 2017
PHRTexerciseEDF

Rate Monotonic Scheduling
• Constraints
• Determine deadlines (period) in terms of Frequency or Period (1/F)
• Assign priorities Highest frequency (shortest period)
==> Highest priority
Independent activities
Periodic
Constant CPU cycle consumption
Assumes Pre-emptive scheduling
RMS = Rate Monotonic Scheduling
Priority based scheduling for Periodic Processing
of tasks with a guaranteed CPU - load
Architecting System Performance; Scheduling139 Gerrit Muller
version: 0October 20, 2017
PHRTrmsPriorityAssignment

Exercise Rate Monotonic Scheduling (RMS)
Calculate loads and determine thread activity (RMS)
Source: Ton Kostelijk - EXARCH course
Suppose at t=0, all threads are ready to process the arrived trigger.
0 9 15 18 23
Thread 1
Thread 2
Thread 3
Thread Period = deadline Processing Load
Thread 1 9 3 33.3%
Thread 2 15 5
Thread 3 23 5
Architecting System Performance; Scheduling140 Gerrit Muller
version: 0October 20, 2017
PHRTexerciseRMS

RMS-RMA Theory
assumptions Rate
Monotonic Analysis (RMA):
periodic tasks with
period Ti
process time Pi
load Ui = Pi/Ti
tasks are independent
RMA theory:
schedule is possible when:
Load = ∑i Ui ≤ n(21/n
-1)
for n = 1, 2, 3, ∞
max utilization is:
1.00, 0.83, 0.78, … log(2)
~= 0,69
Source: Ton Kostelijk - EXARCH course
Rate Monotonic Scheduling (RMS) uses fixed priorities
RMS guarantees that all processes meet their deadlines
Fixed priority -> low overhead
Architecting System Performance; Scheduling141 Gerrit Muller
version: 0October 20, 2017
ASPRMrms

Answer EDF Exercise
Answers: loads and thread activity (EDF)
Source: Ton Kostelijk - EXARCH course
0 9 15 18 23
Thread 1
Thread 2
Thread 3
Thread Period = deadline Processing Load
Thread 1 9 3 33.3%
Thread 2 15 5 33.3%
Thread 3 23 5 21.7%
88.3%
Architecting System Performance; Scheduling142 Gerrit Muller
version: 0October 20, 2017
PHRTexerciseEDFanswer

Answer RMS Exercise
Answers: loads and thread activity (RMS)
Source: Ton Kostelijk - EXARCH course
0 9 15 18 23
Thread 1
Thread 2
Thread 3
Thread Period = deadline Processing Load
Thread 1 9 3 33.3%
Thread 2 15 5 33.3%
Thread 3 23 5 21.7%
88.3%
3 3 3
5
1 3
3 2
-1 ??
Architecting System Performance; Scheduling143 Gerrit Muller
version: 0October 20, 2017
PHRTexerciseRMSanswer

From Simple-Local to Complex-Global
A perspective on dynamic behavior is to view the system
as set of periodic behaviors.
Periodic behavior is easier to model and analyze, e.g.
using RMS and RMA.
Modern systems and Systems of Systems consists of
complex networks of concurrent resources.
Typically, a combination of more advanced global
scheduling is combined with simple local scheduling.
Architecting System Performance; Scheduling144 Gerrit Muller
version: 0October 20, 2017
ASPSCglobal
Architecting System Performance; Robust Performanceby Gerrit Muller TNO-ESI, University College of South East Norway
e-mail: [email protected]
Abstract
Performance should be robust. The performance should be reproducable and itshould be well-behaving in extreme conditions.
Distribution
This article or presentation is written as part of the Gaudí project. The Gaudí projectphilosophy is to improve by obtaining frequent feedback. Frequent feedback is pursued by anopen creation process. This document is published as intermediate or nearly mature versionto get feedback. Further distribution is allowed as long as the document remains completeand unchanged.
October 20, 2017status: preliminarydraftversion: 0.2
# o
f ca
se
s
performance
smaller is betterwhat causes
this variation?
performance measurements
in standardized conditions
what causes
these outlyers?
Poorly understood variations require analysis

Variations are Suspect
# o
f ca
se
s
performance
smaller is betterwhat causes
this variation?
performance measurements
in standardized conditions
what causes
these outlyers?
Poorly understood variations require analysis
Architecting System Performance; Robust Performance146 Gerrit Muller
version: 0.2October 20, 2017
ASPRPvariation

Coping with Disturbances
time
pe
rfo
rma
nce
sm
alle
r is
be
tte
rHow does the system respond to disturbances?
How quickly does it recover?
How far does performance degrade?
steady state
performance
de
gra
da
tio
n
recovery time recovery timed
eg
rad
atio
n
disturbance disturbance
Architecting System Performance; Robust Performance147 Gerrit Muller
version: 0.2October 20, 2017
ASPRPdisturbances

Measure to Validate Working Range
load
tr
working
range
tmax
working
range
desired
linear
behavior
A system design assumption is often:
the performance of this function
{ is constant | is linear | doesn't exceed x | ...}
The working range is the interval where this
assumption holds
Architecting System Performance; Robust Performance148 Gerrit Muller
version: 0.2October 20, 2017
MAANworkingRange

Validate Understanding of System Performance
Characterize the system
Stress testing
Load testing
(Accelerated) Lifetime testing
where does the design fail?
(go beyond specified limits)
keep the system in heavy load condition
observe how it keeps performing
measure variations
age the system
observe how it keeps performing
use the system in varying conditions
measure performance
as function of the conditions
Architecting System Performance; Robust Performance149 Gerrit Muller
version: 0.2October 20, 2017ASPRPvalidation

Bloating, Waste, and Valueby Gerrit Muller TNO-ESI, University College of South East Norway
e-mail: [email protected]
Abstract
A threat to performance is the combination of feature creep and technical debt.This combination causes bloating of the design. In Lean terms, the combinationcauses waste. A crucial question is where is the value, and is the value in balancewith the potential degradation of performance.
Distribution
This article or presentation is written as part of the Gaudí project. The Gaudí projectphilosophy is to improve by obtaining frequent feedback. Frequent feedback is pursued by anopen creation process. This document is published as intermediate or nearly mature versionto get feedback. Further distribution is allowed as long as the document remains completeand unchanged.
October 20, 2017status: plannedversion: 0
logo TBD

From Feature Creep to Performance Problems
maturing of
systems
increasing
number of
features
(feature creep)
technical debt
bloating of
design
increase in
resource
usage
performance
problems
design
complexity
lack of
overview
insight
understanding
loss of knowledge
time effort gain
by taking
shortcuts
Bloating, Waste, and Value151 Gerrit Muller
version: 0October 20, 2017
BWVfeatureCreep

Technical Debt
Technical Debt is a metaphor used within the software
industry to communicate the consequences of pragmatic
design decisions deviating from the intended design of a
system
from: http://gaudisite.nl/INCOSE2016_Callister_Andersson_SMARTtechnicalDebt.pdf
based on Cunningham http://c2.com/doc/oopsla92.html
Bloating, Waste, and Value152 Gerrit Muller
version: 0October 20, 2017
BWVtechnicalDebt

Value versus Performance Degradation
increasing number of features
(feature creep)
technical debt
bloating of
design
increase in
resource
usage
performance
problems
design
complexity
lack of
overview
insight
understandingtime effort gain by taking
shortcuts
Are benefits (value) in balance with the costs (such as performance degradation)?
Bloating, Waste, and Value153 Gerrit Muller
version: 0October 20, 2017
BWVvalueEvaluation

Exploring bloating: main causes
overhead
value
legenda
core
function
po
or
de
sig
n (
"ho
w")
po
or
sp
ecific
atio
n (
"wh
at"
)
do
gm
atic r
ule
sfo
r in
sta
nce
fin
e g
rain
CO
M in
terf
ace
s
genericity
configurability
provisions for
future
support for
unused legacy
code
Bloating, Waste, and Value154 Gerrit Muller
version: 0October 20, 2017
EASRTbloating
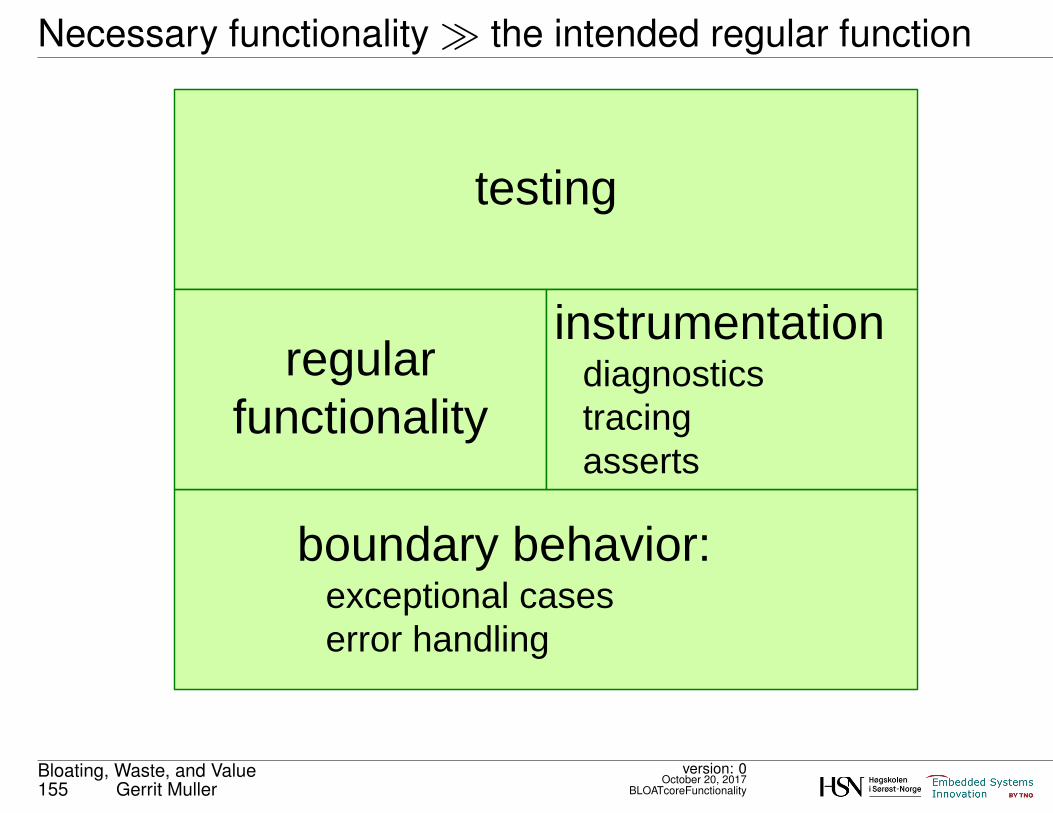
Necessary functionality � the intended regular function
testing
boundary behavior:exceptional cases
error handling
regular
functionality
instrumentationdiagnostics
tracing
asserts
Bloating, Waste, and Value155 Gerrit Muller
version: 0October 20, 2017
BLOATcoreFunctionality

The danger of being generic: bloating
after refactoring
specific
implementations
without a priori re-use
generic design from
scratch
lots of if-then-else
lots of configuration
options
lots of stubs
lots of best guess
defaults
over-generic class
lots of
config
over-
rides
lots of
config
over-
rides
lots of
config
over-
rides
toolbox
side
client
side
in retrospect common
(duplicated) code
"Real-life" example: redesigned Tool super-class and descendants, ca 1994
Bloating, Waste, and Value156 Gerrit Muller
version: 0October 20, 2017
GDbloatingVisualized

Shit propagation via copy paste
needed code
repair code
needed code
bad code
new needed
codecode not
relevant for new
function
new bad
code
copy pastemodify
bad code
Bloating, Waste, and Value157 Gerrit Muller
version: 0October 20, 2017
BLOATshitPropagation

Example of shit propagation
Class Old:
capacity = startCapacity
values = int(capacity)
size = 0
def insert(val):
values[size]=val
size+=1
if size>capacity:
capacity*=2
relocate(values,
capacity)
Class New:
capacity = 1
values = int(capacity)
size = 0
def insert(val):
values[size]=val
size+=1
capacity+=1
relocate(values,
capacity)
Class DoubleNew:
capacity = 1
values = int(capacity)
size = 0
def insert(val):
values[size]=val
size+=1
capacity+=1
relocate(values,
capacity)
def insertBlock(v,len):
for i=1 to len:
insert(v[i])
copy paste
copy paste
Bloating, Waste, and Value158 Gerrit Muller
version: 0October 20, 2017
BLOATshitPropagationExample

Bloating causes more bloating
overhead
value
legenda
core
functionality
support for
unused legacy
code
po
or
de
sig
n (
"ho
w")
do
gm
atic r
ule
sfo
r in
sta
nce
fin
e g
rain
CO
M in
terf
ace
s
po
or
sp
ecific
atio
n (
"wh
at"
)
core
functionality
genericity
configurability
provisions for
future
support for
unused legacy
code
po
or
de
sig
n (
"ho
w")
do
gm
atic r
ule
sfo
r in
sta
nce
fin
e g
rain
CO
M in
terf
ace
s
po
or
sp
ecific
atio
n (
"wh
at"
)
core
functionality
genericity
configurability
provisions for
future
support for
unused legacy
code
po
or
de
sig
n (
"ho
w")
do
gm
atic r
ule
sfo
r in
sta
nce
fin
e g
rain
CO
M in
terf
ace
s
po
or
sp
ecific
atio
n (
"wh
at"
)
core
functionality
genericity
configurability
provisions for
future
support for
unused legacy
code
po
or
de
sig
n (
"ho
w")
do
gm
atic r
ule
sfo
r in
sta
nce
fin
e g
rain
CO
M in
terf
ace
s
po
or
sp
ecific
atio
n (
"wh
at"
)
decomposition overheadpoor
design
poor
spec
dogmatic
rules
support for unused legacy code
genericity configurability provisions for
Bloating, Waste, and Value159 Gerrit Muller
version: 0October 20, 2017
EASRTbloatingCausesBloating

Causes even more bloating...
overhead
value
legenda
core
functionality
genericity
configurability
provisions for
future
support for
unused legacy
code
po
or
de
sig
n (
"ho
w")
do
gm
atic r
ule
sfo
r in
sta
nce
fin
e g
rain
CO
M in
terf
ace
s
po
or
sp
ecific
atio
n (
"wh
at"
)
core
functionality
genericity
configurability
provisions for
future
support for
unused legacy
code
po
or
de
sig
n (
"ho
w")
do
gm
atic r
ule
sfo
r in
sta
nce
fin
e g
rain
CO
M in
terf
ace
s
po
or
sp
ecific
atio
n (
"wh
at"
)
core
functionality
genericity
configurability
provisions for
future
support for
unused legacy
code
po
or
de
sig
n (
"ho
w")
do
gm
atic r
ule
sfo
r in
sta
nce
fin
e g
rain
CO
M in
terf
ace
s
po
or
sp
ecific
atio
n (
"wh
at"
)
core
functionality
genericity
configurability
provisions for
future
support for
unused legacy
code
po
or
de
sig
n (
"ho
w")
do
gm
atic r
ule
sfo
r in
sta
nce
fin
e g
rain
CO
M in
terf
ace
s
po
or
sp
ecific
atio
n (
"wh
at"
)
decomposition overheadpoor
design
poor
spec
dogmatic
rules
support for unused legacy code
genericity configurability provisions for
performance, resource
optimization
poor
design
poor
spec
dogmatic
rules
support for unused legacy code
genericity configurability provisions for
Bloating causes performance
and resource problems.
Solution: special measures:
memory pools, shortcuts, ...
Bloating, Waste, and Value160 Gerrit Muller
version: 0October 20, 2017
EASRTbloatingCausesBloatingMore