Embed Size (px)
Citation preview
Architectural Graphics Competencies in Interior Design: A Comparison of Professional and Student Usage
Carol Lea Hoffman University of Alabama, University, Alabama
Introduction Architectural graphics are important to
the interior designer for two reasons. First, an interior designer needs to test new design concepts graphically. When a designer can see how an idea looks, he or she can decide if it should be retained as is, refined, or discarded. Second, an interior designer’s living is derived by sell- ing design ideas to clients. Words are often inadequate to the task; a client needs to see as well as hear what the designer has in mind. Using graphics promotes communication and, if the designer uses the graphic language well, a sale.
Interior design educators have included architectural graphics competencies in previous professional surveys. Trick (1978) surveyed educators and practicing in- terior designers to determine which pro- fessional skills should be emphasized in competency-based interior design curricu- la. Most graphics competencies received ratings nearest 4 (“important”) on a 5 - point Likert scale (“not important” to “essential”). Benhamou (1980) conducted a study that examined the frequencies with which practicing designers used the academic subjects they studied in col- lege and the frequencies with which they performed specific professional activities. Architectural graphics skills, especially drafting floor plans, rated high in both studies. Myers (1982) surveyed educators and practitioners to determine which competencies neophyte interior designers should master before beginning profes- sional practice. When the top 30 compe- tencies were ranked according to educator and practitioner responses, drafting topped the list.
If graphics skills are as important as the Trick, Benhamou, and Myers studies indicate, it is somewhat surprising to find that many interior design students take
only a n introductory course or two in the subject. The University of Alabama, for example, offers two: Construction Drawing and Presentation Methods. Where this is so, educators should struc- ture these courses to use the limited time available to best advantage. To that end, they need to know which graphics compe- tencies their upperclass students and grad- uates use most frequently.
Purpose of the Study The purpose of this study was to de-
termine, by comparing the responses of interior design students and practitioners, how closely the competencies required in college courses reflected those used in actual practice. Specific objectives were the following:
1 . ‘To determine the frequency with which senior interior design students used architectural graphics competencies in their upperclass interior design courses.
2. To determine the frequency with which practicing designers used the same graphics competencies in the course of their professional activities.
3. To determine whether the differ- ence between the means of the two groups was significant.
Description of the Sample The professional sample for this study
included: (a) professional and associate members of the Alabama Chapter of the American Society of Interior Designers (ASID), and (b) board members, profes- sional members, and other contract de- signers affiliated with the Georgia Chapter of the Institute of Business Designers (IBD). Of the 118 Alabama ASID mem- bers surveyed, 86 (72.9%) returned their questionnaires; 76 (68.5%) of the 1 1 1 designers on the Georgia IBD mailing list returned theirs.
The student sample for the study in- cluded senior interior design students whose interior design programs were in three different colleges or departments: home economics (University of Alabama), art (University of Georgia), and archi- tecture (Auburn University). Of the 72 seniors surveyed, 63 (87.5%) returned their questionnaires.
Description of the Survey Instrument
Architectural drawing textbooks and graphics manuals were examined to de- termine the range of competencies that could appear in an architectural graphics skills questionnaire. Then, a trial survey instrument, containing 73 competency statements and 6 demographic questions, was pilot tested by graduate students en- rolled in the interior design program at the University of Alabama. To correct ambiguities revealed by the pilot study, several competency statements were re- worded, and one illustration was revised and redrawn.
In its final form, the questionnaire had eight pages: a front cover, a back cover, and six pages of text. On page 1 of the text, respondents were asked to read the list of competencies and indicate how frequently they used each one, using the following 5-point Likert scale:
5 ALMOST ALWAYS
4 OFTEN
3 SOMETIMES
2 SELDOM
1 ALMOST NEVER
(Almost every project requires it.)
(About 3 out of 4 projects require it.)
(About 2 out of 4 projects require it.)
(About 1 out of 4 projects require it.)
(Almost no projects require it.)
14 K Copyright, 1983, Interior Design Educators Council Journal of Interior Design Education and Research, 9 ( I ) 14-19
Pages 1 through 5 listed the 73 architec- tural graphics competencies. Fourteen il- lustrations were interspersed with the competency statements to clarify the text and add visual interest to the question- naire. Page 6 requested demographic information.
Both the format of the survey instru- ment and actual survey procedures fol- lowed Dillman's (1978) Total Design Method for mail surveys. Due to bud- getary limitations, however, only one follow-up was directed to nonrespondents, rather than the three Dillman recom- mended.
Copies of the questionnaire were dis- tributed to practitioners at the annual convention of the Alabama Chapter of ASID held in Gulf Shores, Alabama, on October 31, 1981, and at a monthly meet- ing at the Georgia Chapter of IBD held in Atlanta, Georgia, on December 1, 1981. In February, 1982, ASID and IBD mem- bers not attending the two aforemen- tioned meetings were surveyed by mail. Students were surveyed during the month of March in the classrooms of their re- spective universities.
Description of the Professional Sample
Almost half (44.2%) of the profession- al respondents worked for interior de- sign firms, and about an eighth (12.9%) worked for architectural firms. A small percentage (4.9%) worked for combina- tion interior design and architectural firms. Less than 5% were self employed: 1.8% owned their own design firms, and 3.1 To free-lanced. Almost a quarter (24.5%) worked in stores or showrooms: 14.7% for retail stores offering design services, 8.0% for contract furnishings dealers, and 1.8% for manufacturers or wholesalers of interior furnishings. The remaining 8.6% were employed by other kinds of businesses requiring design ser- vices (e.g., large corporations, design and construction firms).
Almost half of the practicing interior designers (47.5%) did contract work ex- clusively, and an additional 17.9% did contract work three-fourths of the time. Thirteen percent divided their practice equally between contract and residential work. Only 21.0% stated that the bulk of their business was residential - 17.9% stating three-fourths residential, and 3.1 Vo
stating all residential. One respondent (.6% of those surveyed) reported resi- dential-contact percentages that differed from the listed choices.
Over a third (34.4%) of the practitioners worked in firms consisting of two to three designers, and about a fourth (25.2%) in one-person firms. Sixteen percent worked in large firms with more than ten designers, 15.3% in firms of four to five designers, and 9.2% in firms of six to ten designers.
There was a positive correlation be- tween the percentages of responses and the length of time employed in the field. The largest percentage of respondents (36.6%) worked in the design field over ten years, 23.6% worked for six to ten years, 16.1% for four to five years, 13.7% for two to three years, and 9.9% for a year or less.
Professional respondents were well educated. Over three-fourths (79.0%) of the practitioners surveyed were graduates of four- or five-year baccalaureate pro- grams in design. Six and two-tenths per- cent were graduates of three-year design programs, 5.6% of master-level design programs, 4.9% of two-year design pro- grams, and 2.5% from high school. One and nine-tenths percent were graduates of baccalaureate programs other than interior design.
Over half of the professional subjects (56.2%) worked in firms or departments that employed no drawing specialists (i.e., draftsmen, renderers or graphic artists), but 43.8% of the respondents worked in firms that did employ them. Finding graphics specialists in so many firms re- vealed possible bias in the practitioner data, so multiple t tests were employed to determine if there were significant differ- ences @< .005) between the mean scores of the two groups of professional subjects. There were, indeed, differences, but they were not the differences expected. With- out exception, interior designers work- ing in firms that employed graphics special- ists used the entire spectrum of drawing competencies more, not less, than in- terior designers working in firms without specialists.
Data Analysis After the responses of the two groups
were collected, coded, and keypunched, they were analyzed statistically to deter- mine if significant differences existed.
The data analysis consisted of four sta- tistical tests: frequencies, reliability, Hotel- ling's 72, and multiple t's.
The subprogram FREQUENCIES from the Update 7-9 version of the Statistical Package for the Social Sciences (SPSS) was used to compute the arithmetic means of practitioner and student responses. As illustrated in Table 1 , 31 (42.5%) and 40 (54.8%) of the 73 competency mean scores computed for practitioners and students, respectively, fell between 3.000 and 5.000. Thus, the respondents used roughly half of the architectural graphics competencies for the majority of their interior design projects. The other half of the competencies were used seldom, if at all.
Eleven (15.1%) and 16 (21.9%) of the 73 competencies had mean scores of 4.000 and above, suggesting that professional and student respondents, respectively, used these skills in about three-fourths of their projects. As might be expected, three of the most frequently used compe- tencies involved floor plans: Reading and interpreting floor plans, Sketching floor plans, and Drafting floor plans. Three others concerned lettering and general drafting: Drawing to scale, Dimension- ing, and Lettering freehand with pencils. Students included a fourth: Laying out and lettering title blocks. Other compe- tencies ranked high by both groups con- cerned interior elevations: Sketching ele- vations, and Reading and interpreting in- terior elevations. Practitioners also includ- ed Reading and interpreting elevations of doors and windows; students included Drafting elevations of interior walls. Four competencies involving perspective draw- ing received mean scores of 4.000 and above from students: Sketching objects or architectural spaces in perspective, Con- structing 2-point perspective drawings, Constructing 1-point perspective draw- ings, and Constructing rendered perspec- tive drawings. The remaining competencies given high ratings were: Reading and in- terpreting reflected ceiling plans, by prac- titioners, and Sketching bubble diagrams, by students.
At the other end of the continuum were the competencies with mean scores less than 2.000. Practitioners almost never used eleven (1 5.1 070) competencies; stu- dents, thirteen (17.8%). The drafting competencies receiving low mean scores were not unexpected, since professionals
15
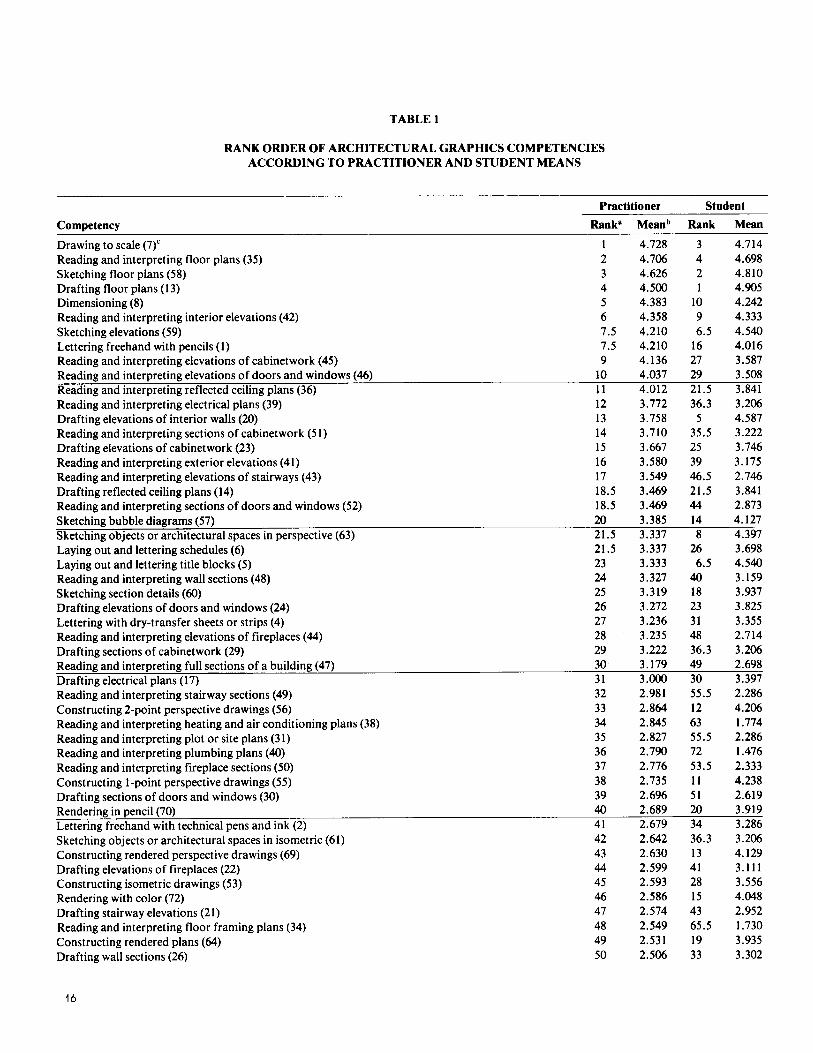
TABLE 1
RANK ORDER OF ARCHITECTURAL GRAPHICS COMPETENCIES ACCORDING TO PRACTITIONER AND STUDENT MEANS
Student Practitioner Competency RankP
Drawing to scale (7)' Reading and interpreting floor plans (35) Sketching floor plans (58) Drafting floor plans (13) Dimensioning (8) Reading and interpreting interior elevations (42) Sketching elevations (59) Lettering freehand with pencils (1) Reading and interpreting elevations of cabinetwork (45) Reading and interpreting elevations of doors and windows (46) Reading and interpreting reflected ceiling plans (36) Reading and interpreting electrical plans (39) Drafting elevations of interior walls (20) Reading and interpreting sections of cabinetwork ( 5 1) Drafting elevations of cabinetwork (23) Reading and interpreting exterior elevations (41) Reading and interpreting elevations of stairways (43) Drafting reflected ceiling plans (14) Reading and interpreting sections of doors and windows (52)
1 2 3 4 5 6 7.5 7.5 9
10 11 12 13 14 15 16 17 18.5 18.5
Sketchinn bubble diagrams 157) Sketching objects or architectural spaces in perspective (63) Laying out and lettering schedules (6) Laying out and lettering title blocks (5) Reading and interpreting wall sections (48) Sketching section details (60) Drafting elevations of doors and windows (24) Lettering with dry-transfer sheets or strips (4) Reading and interpreting elevations of fireplaces (44) Drafting sections of cabinetwork (29) Reading and interpreting full sections of a building (47) Drafting electrical plans (17) Reading and interpreting stairway sections (49) Constructing 2-point perspective drawings (56) Reading and interpreting heating and air conditioning plans (38) Reading and interpreting plot or site plans (31) Reading and interpreting plumbing plans (40) Reading and interpreting fireplace sections (50) Constructing 1-point perspective drawings (55) Drafting sections of doors and windows (30) Rendering in pencil (70) Lettering freehand with technical pens and ink (2) Sketching objects or architectural spaces in isometric (61) Constructing rendered perspective drawings (69) Drafting elevations of fireplaces (22) Constructing isometric drawings (53) Rendering with color (72) Drafting stairway elevations (21) Reading and interpreting floor framing plans (34) Constructing rendered plans (64) Drafting wall sections (26)
Meanb Rank 4.728 3 4.706 4 4.626 2 4.500 1 4.383 10 4.358 9 4.210 6.5 4.210 16 4.136 27 4.037 4.012 3.772 3.758 3.710 3.667 3.580 3.549 3.469 3.469
20 3.385 21.5 3.337 21.5 3.337 23 3.333 24 3.327 25 3.319 26 3.272 27 3.236 28 3.235 29 3.222 30 31 32 33 34 35 36 37 38 39 40 41 42 43 44 45 46 47 48 49 50
3.179 3.000 2.981 2.864 2.845 2.827 2.790 2.776 2.735 2.696 2.689 2.679 2.642 2.630 2.599 2.593 2.586 2.574 2.549 2.531 2.506
29 21.5 36.3 5
35.5 25 39 46.5 21.5 44 14 8
26 6.5
40 18 23 31 48 36.3 49 30 55.5 12 63 55.5 72 53.5 11 51 20 3.919 34 3.286 36.3 13 41 28 15 43 65.5 19 33
3.206 4.129 3.111 3.556 4.048 2.952 1.730 3.935 3.302
Mean 4.714 4.698 4.810 4.905 4.242 4.333 4.540 4.016 3.587 3.508 3.841 3.206 4.587 3.222 3.746 3.175 2.746 3.841 2.873 4.127 4.397 3.698 4.540 3.159 3.937 3.825 3.355 2.714 3.206 2.698 3.397 2.286 4.206 1.774 2.286 1.476 2.333 4.238 2.619
-
-
16
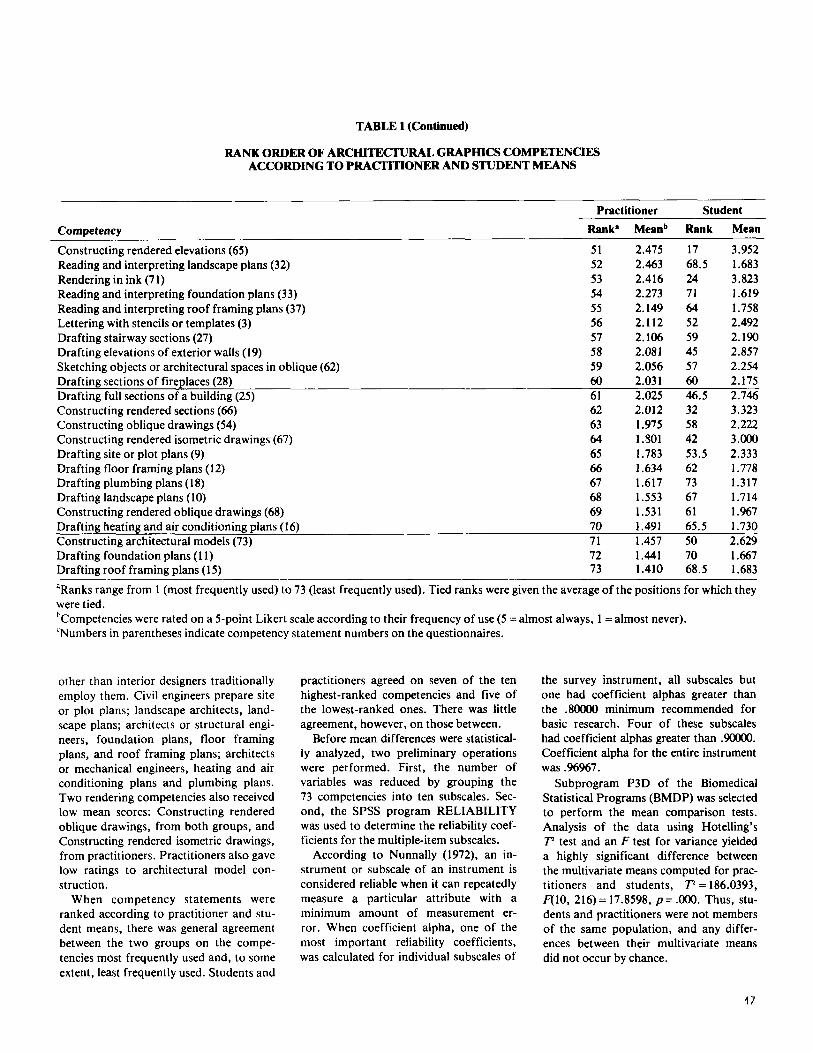
TABLE 1 (Continued)
RANK ORDER OF ARCHITECTURAL GRAPHICS COMPETENCIES ACCORDING TO PRACTITIONER AND STUDENT MEANS
Practitioner Student Rank. Meanb Rank Mean Competency
Constructing rendered elevations (65) 51 2.475 17 3.952 Reading and interpreting landscape plans (32) 52 2.463 68.5 1.683 Rendering in ink (71) 53 2.416 24 3.823 Reading and interpreting foundation plans (33) 54 2.273 71 1.619 Reading and interpreting roof framing plans (37) 55 2.149 64 1.758 Lettering with stencils or templates (3) 56 2.112 52 2.492
Drafting elevations of exterior walls (19) 58 2.081 45 2.857 Sketching objects or architectural spaces in oblique (62) 59 2.056 57 2.254 Drafting sections of fireplaces (28) 60 2.031 60 2.175 Drafting full sections of a building (25) 61 2.025 46 .5 2.746
-
Drafting stairway sections (27) 57 2.106 59 2.190
Constructing rendered sections (66) Constructing oblique drawings (54) Constructing rendered isometric drawings (67) Drafting site or plot plans (9) Drafting floor framing plans (12) Drafting plumbing plans (1 8) Drafting landscape plans (10) Constructing rendered oblique drawings (68) Drafting heating and air conditioning plans (16) Constructing architectural models (73) Drafting foundation plans (1 1) Drafting roof framing plans (1 5)
62 63 64 65 66 67 68 69 70 71 -
2.012 1.975 1.301 1.783 1.634 1.617 1.553 1.531 1.491 1.457
32 3.323 58 2.222 42 3.000 53.5 2.333 62 1.778 73 1.317 67 1.714 61 1 .%7 65.5 1.730 50 2.629
1.667 72 73 1.410 68.5 1.683
1 . 4 4 1 70
aRanks range from 1 (most frequently used) to 73 (least frequently used). Tied ranks were given the average of the positions for which they were tied. bCompetencies were rated on a 5-point Likert scale according to their frequency of use (5 =almost always, 1 =almost never). ‘Numbers in parentheses indicate competency statement numbers on the questionnaires.
other than interior designers traditionally employ them. Civil engineers prepare site or plot plans; landscape architects, land- scape plans; architects or structural engi- neers, foundation plans, floor framing plans, and roof framing plans; architects or mechanical engineers, heating and air conditioning plans and plumbing plans. Two rendering competencies also received low mean scores: Constructing rendered oblique drawings, from both groups, and Constructing rendered isometric drawings, from practitioners. Practitioners also gave low ratings to architectural model con- struction.
When competency statements were ranked according to practitioner and stu- dent means, there was general agreement between the two groups on the compe- tencies most frequently used and, to some extent, least frequently used. Students and
practitioners agreed on seven of the ten highest-ranked competencies and five of the lowest-ranked ones. There was little agreement, however, on those between.
Before mean differences were statistical- ly analyzed, two preliminary operations were performed. First, the number of variables was reduced by grouping the 73 competencies into ten subscales. Sec- ond, the SPSS program RELIABILITY was used to determine the reliability coef- ficients for the multiple-item subscales.
According to Nunnally (1972). an in- strument or subscale of an instrument is considered reliable when it can repeatedly measure a particular attribute with a minimum amount of measurement er- ror. When coefficient alpha, one of the most important reliability coefficients, was calculated for individual subscales of
the survey instrument, all subscales but one had coefficient alphas greater than the .8oooO minimum recommended for basic research. Four of these subscales had coefficient alphas greater than .90000. Coefficient alpha for the entire instrument was .96%7.
Subprogram P3D of the Biomedical Statistical Programs (BMDP) was selected to perform the mean comparison tests. Analysis of the data using Hotelling’s T test and an F test for variance yielded a highly significant difference between the multivariate means computed for prac- titioners and students, 71 = 186.0393,
dents and practitioners were not members of the same population, and any differ- ences between their multivariate means did not occur by chance.
F(10, 216)= 17.8598, p=.ooO. Thus, stu-
17
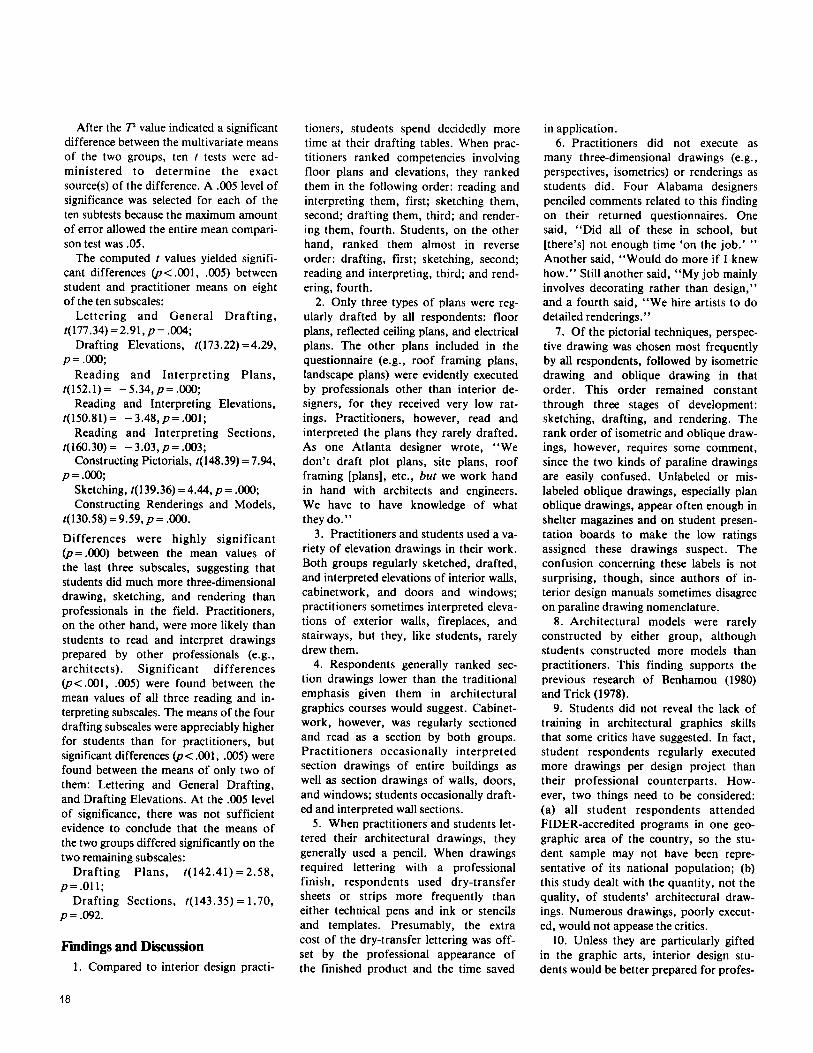
After the T value indicated a significant difference between the multivariate means of the two groups, ten t tests were ad- ministered to determine the exact source(s) of the difference. A .005 level of significance was selected for each of the ten subtests because the maximum amount of error allowed the entire mean compari- son test was .05.
The computed t values yielded signifi- cant differences @< .001, .005) between student and practitioner means on eight of the ten subscales:
Lettering and General Drafting, t(177.34)=2.91,~= .004;
Drafting Elevations, t(173.22) =4.29, p=.OOO;
Reading and Interpreting Plans,
Reading and Interpreting Elevations,
Reading and Interpreting Sections,
Constructing Pictorials, t(148.39) = 7.94,
Sketching, t(139.36) =4.44, p = .OOO; Constructing Renderings and Models,
t(130.58)=9.59,p=.O.
Differences were highly significant @= .OOO) between the mean values of the last three subscales, suggesting that students did much more three-dimensional drawing, sketching, and rendering than professionals in the field. Practitioners, on the other hand, were more likely than students to read and interpret drawings prepared by other professionals (e.g., architects). Significant differences @<.001, .005) were found between the mean values of all three reading and in- terpreting subscales. The means of the four drafting subscales were appreciably higher for students than for practitioners, but significant differences @ < .001, .005) were found between the means of only two of them: Lettering and General Drafting, and Drafting Elevations. At the .005 level of significance, there was not sufficient evidence to conclude that the means of the two groups differed significantly on the two remaining subscales:
Drafting Plans, t(142.41) =2.58, p=.o11;
Drafting Sections, t(143.35) = 1.70, p = .092.
t(152.1)= -5.34,p=.OOO;
t(150.81) = - 3.48, p = .001;
t(160.30)= -3.03,~=.003;
p=.OOO;
Findings and Discussion 1 . Compared to interior design practi-
tioners, students spend decidedly more time at their drafting tables. When prac- titioners ranked competencies involving floor plans and elevations, they ranked them in the following order: reading and interpreting them, first; sketching them, second; drafting them, third; and render- ing them, fourth. Students, on the other hand, ranked them almost in reverse order: drafting, first; sketching, second; reading and interpreting, third; and rend- ering, fourth.
2. Only three types of plans were reg- ularly drafted by all respondents: floor plans, reflected ceiling plans, and electrical plans. The other plans included in the questionnaire (e.g., roof framing plans, landscape plans) were evidently executed by professionals other than interior de- signers, for they received very low rat- ings. Practitioners, however, read and interpreted the plans they rarely drafted. As one Atlanta designer wrote, “We don’t draft plot plans, site plans, roof framing [plans], etc., but we work hand in hand with architects and engineers. We have to have knowledge of what they do.”
3. Practitioners and students used a va- riety of elevation drawings in their work. Both groups regularly sketched, drafted, and interpreted elevations of interior walls, cabinetwork, and doors and windows; practitioners sometimes interpreted eleva- tions of exterior walls, fireplaces, and stairways, but they, like students, rarely drew them.
4. Respondents generally ranked sec- tion drawings lower than the traditional emphasis given them in architectural graphics courses would suggest. Cabinet- work, however, was regularly sectioned and read as a section by both groups. Practitioners occasionally interpreted section drawings of entire buildings as well as section drawings of walls, doors, and windows; students occasionally draft- ed and interpreted wall sections.
5 . When practitioners and students let- tered their architectural drawings, they generally used a pencil. When drawings required lettering with a professional finish, respondents used dry-transfer sheets or strips more frequently than either technical pens and ink or stencils and templates. Presumably, the extra cost of the dry-transfer lettering was off- set by the professional appearance of the finished product and the time saved
in application. 6. Practitioners did not execute as
many three-dimensional drawings (e.g., perspectives, isometrics) or renderings as students did. Four Alabama designers penciled comments related to this finding on their returned questionnaires. One said, “Did all of these in school, but [there’s] not enough time ‘on the job.’ ” Another said, “Would do more if 1 knew how.” Still another said, “My job mainly involves decorating rather than design,” and a fourth said, “We hire artists to do detailed renderings.”
7. Of the pictorial techniques, perspec- tive drawing was chosen most frequently by all respondents, followed by isometric drawing and oblique drawing in that order. This order remained constant through three stages of development: sketching, drafting, and rendering. The rank order of isometric and oblique draw- ings, however, requires some comment, since the two kinds of paraline drawings are easily confused. Unlabeled or mis- labeled oblique drawings, especially plan oblique drawings, appear often enough in shelter magazines and on student presen- tation boards to make the low ratings assigned these drawings suspect. The confusion concerning these labels is not surprising, though, since authors of in- terior design manuals sometimes disagree on paraline drawing nomenclature.
8. Architectural models were rarely constructed by either group, although students constructed more models than practitioners. This finding supports the previous research of Benhamou (1980) and Trick (1978).
9. Students did not reveal the lack of training in architectural graphics skills that some critics have suggested. In fact, student respondents regularly executed more drawings per design project than their professional counterparts. How- ever, two things need to be considered: (a) all student respondents attended FIDER-accredited programs in one geo- graphic area of the country, so the stu- dent sample may not have been repre- sentative of its national population; (b) this study dealt with the quantity, not the quality, of students’ architectural draw- ings. Numerous drawings, poorly execut- ed, would not appease the critics.
10. Unless they are particularly gifted in the graphic arts, interior design stu- dents would be better prepared for profes-
18
sional practice if they constructed fewer time-consuming renderings and, in the time saved, developed competencies the profession considered more important (e.g., business competencies’).
Assessment of the Study Although this study provided useful
information concerning the design com- munity’s use of architectural graphics, additional research on the subject might prove beneficial. Any future research, however, should be conducted with larg- er student and practitioner samples drawn from a wider range of geographic areas.
Hotelling’s 72 test provided some sta- tistical information concerning the dif- ference between the multivariate means of the two groups. Additional informa- tion could be gained, however, from a more sophisticated multivariate analysis of variance (MANOVA) procedure, such as discriminant-function analysis.
Despite its limitations, the study ac- complished its stated purpose: It deter- mined and then compared the frequencies
with which interior design students and practicing interior designers used archi- tectural graphics skills in their respective projects. The study seems to have served an incidental purpose as well. Judged by the encouraging rate of response to the survey, both students and practitioners appreciated the opportunity to express their opinions concerning the graphics skills of their trade. As one Atlanta de- signer put it, “It’s gratifying to know people in the design schools are concerned with the state of professional practice in the area of graphics and drafting prac- tices. . . . There are only two things which leave a lasting impression of a designer’s professionalism: the completed project and the drawings prepared for that project. ”
References Benhamou. R. Professional practices in interior
design: Frequency profiles and their relation to interior design education. Journal of Interior De- sign Education and Research, 1980,6(2). 16-21.
Dillman, D. A. Mail and telephone surveys: The total design method. New York: Wiley & Sons, 1978.
Myers, C. Entry level competencies needed by in- terior designers. Journal OJ Interior Design Educa- tion and Research, 1982, &‘(I), 19-24.
Nunnally, J. C. Psychometric fheory (2nd ed.). New York: McCraw-Hill, 1972.
Trick, S. S . Identification of goals and assessment criteria for competency based professional edu- cation in interior design (Master’s thesis, Univer- sity of Alabama, 1978).
Wayman, W. S . . Jr., & Wayman. P. S. What stu- dents in accredited interior design programs learn about business. Journal OJ Interior Design Edu- cation and Research, 1982,8(1). 25-27.
Weber, M. Importance of inclusion of business competencies in the interior design curriculum. Journal of Interior Design Education and Re- search, 1979/1980.5(2), 6(1), 66-68.
‘Weber (1979/1980) found that interior design edu- cators and practitioners considered business compe- tencies important. but Wayman and Wayman (1982) found that few interior design students were re- quired to take business cnurses. The findings of the Weber study plus the findings of this study on architectural graphics competencies suggest that practicing designers arc more businesspersons than renderers.
19