Embed Size (px)
Citation preview
94
ARCHITECTURAL STYLE SELECTION
Software Architecture Design process considers many candidate
designs from which few will be eliminated immediately and others will be
considered for evaluation. The toughest task of software architect is selecting
the appropriate design from these competing designs for the software to be
developed. This chapter proposes a hybrid model to evaluate the candid
architectural styles with respect to quality attributes. The set of candid
architectural styles are derived from the mapping of architectural styles with
vastu mandalas. The brief description about vastu mandalas and their
mappings are presented in this chapter.
5.1 VASTU VEETHIS, MANDALAS AND LOKAS
Vastu is an art of living from which one can derive maximum benefits.
It is based on the effects of natural forces and elements. Vastu Vidya is the
study of effective utilization of natural elements in the living place. Vastu
Shastra deals with the dos and don’ts in Vastu Vidya. If a person has an in-
depth knowledge of Vastu Vidya, he can change the Vastu according to his
requirements. The origin of vastu, the two design patterns of vastu and the
mandalas which act as the base for the vastu are explained in the chapter 2.
Vastu consists of Central energy that is termed as central object,
Veethis, Mandalas and lokas. Veethis means layer or loop or level of energy.
Mandala consists of these veethis with or without the central object. Loka
consists of mandalas with central object or without central object [77].
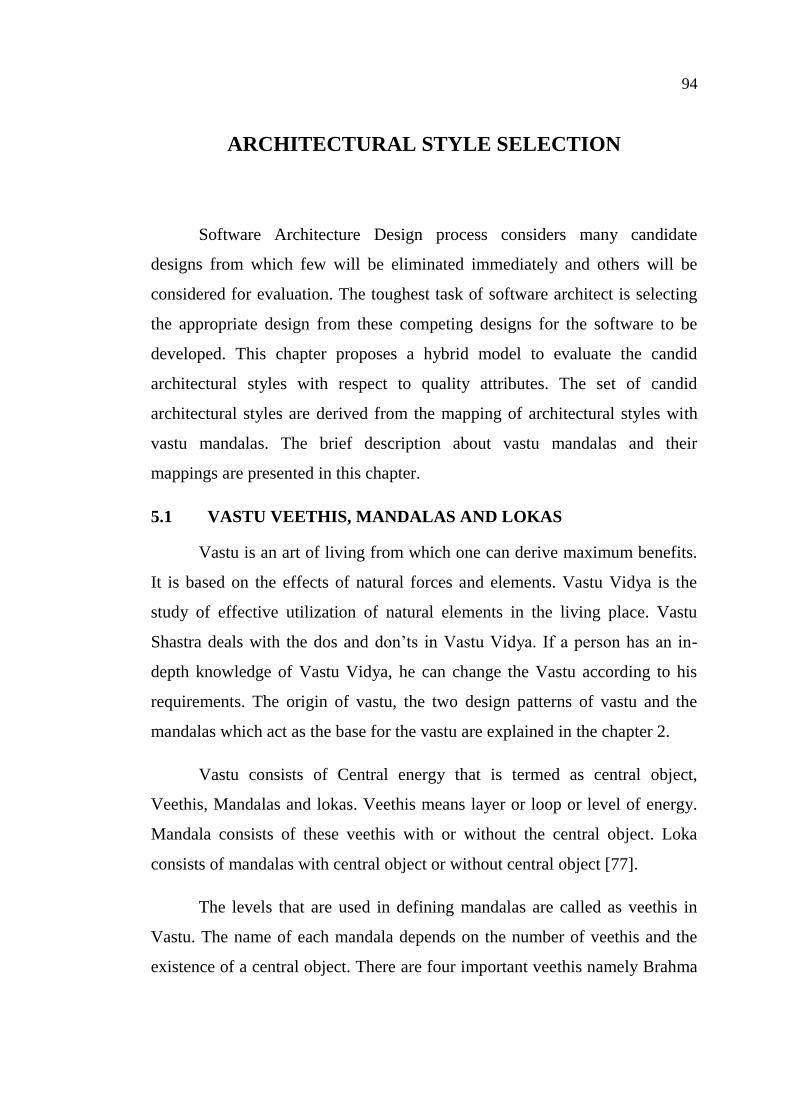
The levels that are used in defining mandalas are called as veethis in
Vastu. The name of each mandala depends on the number of veethis and the
existence of a central object. There are four important veethis namely Brahma

95
Veethi, Deva Veethi, Manushya Veethi, and Paisacha Veethi. Fig 5.1 and 5.2
depict veethis in grid and elliptic representation respectively. Brahma Veethi
is around the core of the mandala with high energy. Deva Veethi is away from
Brahma Veethi with less energy than Brahma Veethi. Manushya Veethi is
farther away from the earlier veethis and has an appropriate energy for the
evolving of life. Paisacha Veethi is the outer veethi, where energy is the least.
Fig 5.1 Four veethis of Vastu-grid representation
Fig 5.2 Four veethis of Vastu-elliptic representation
Veethis and existence of central object form thirty two mandalas that
are depicted in the following fig 5.3. Vastu not only defines these thirty-two
mandalas, but also says which structure is suited for what purpose. Mandala
means container of essence. The mandalas are in spatial dimensions that
portray how matter can be distributed in a given space. The purpose behind
these mandalas and veethis is to place the rooms in a way that works for the
well being of the dwellers by balancing the natural elements and forces
96
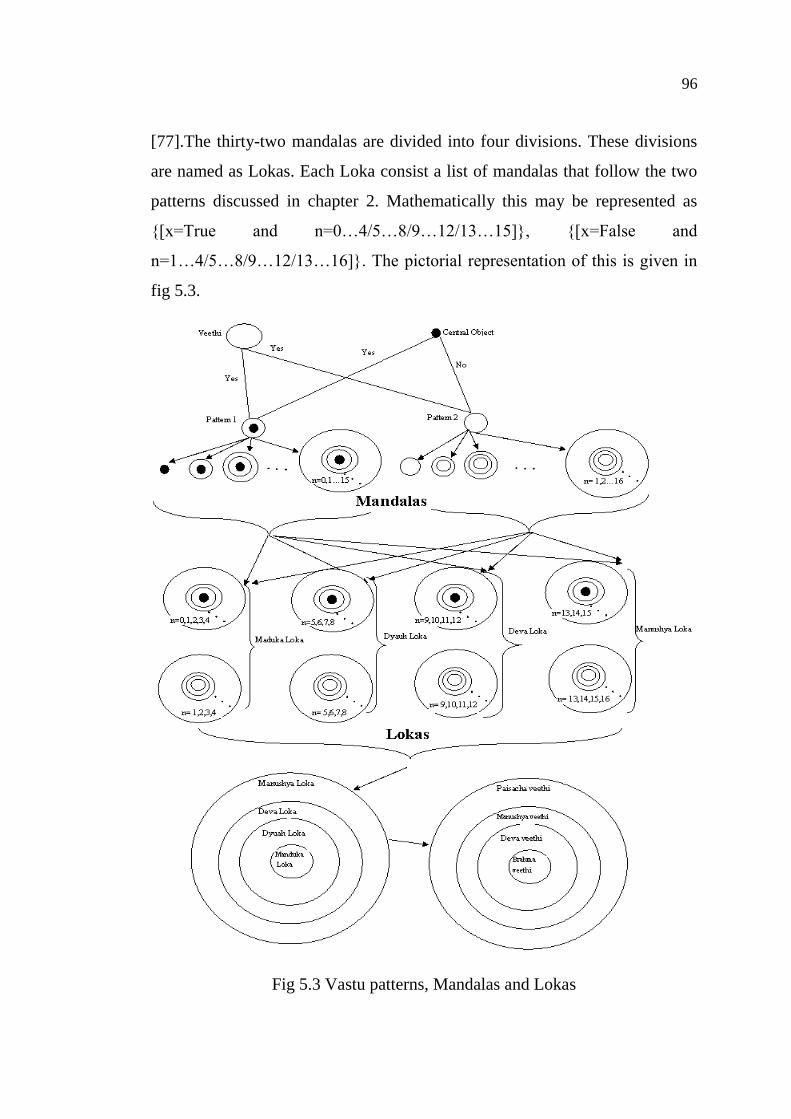
[77].The thirty-two mandalas are divided into four divisions. These divisions
are named as Lokas. Each Loka consist a list of mandalas that follow the two
patterns discussed in chapter 2. Mathematically this may be represented as
{[x=True and n=0…4/5…8/9…12/13…15]}, {[x=False and
n=1…4/5…8/9…12/13…16]}. The pictorial representation of this is given in
fig 5.3.
Fig 5.3 Vastu patterns, Mandalas and Lokas

97
The four Lokas are Manduka Loka { [x=True and n=0, 1, 2, 3, 4],
[x=False and n=1, 2, 3, 4] } Dyauh Loka { [x=True and n=5, 6, 7, 8], [x=False
and n=5, 6, 7, 8] }, Deva Loka{ [x=True and n=9, 10, 11, 12], [x=False and
n=9, 10, 11, 12] }, and Manushya Loka{ [x=True and n=13, 14, 15], [x=False
and n=13, 14, 15, 16] } (fig 5.3). Each Loka consist of four veethis as depicted
in fig 5.4.
Fig 5.4 Four Lokas and existence of four veethis
If Lokas are considered as veethis, then Manduka Loka will become a
Brahma veethi, Dyauh loka will become a Deva veethi, Deva Loka will
become a Manushya veethi and Manushya Loka will become a Paisacha
veethi. This is shown in fig 5.3. Nine different mandalas in Manduka Loka are
explained below with their mappings as per Vastu literature [77].
Sakala Mandala: This mandala represents an undivided space. Fig 5.5 depicts
this mandala, which has the undivided space of energy in the rectangle
boundary, mathematically {x=True and n=0}. Any open space with boundary
represents sakala mandala.
Fig 5.5 Sakala Mandala

98
Pechaka Mandala: This mandala represents the pattern of one loop that
contains energy, mathematically {x=False and n=1}. The same is represented
in fig 5.6. An example of this mandala is a public bath place in which
bathrooms are built in the loop around a central place. Another example is a
public worship place in which many people worship in the loop around a
central place.
Fig 5.6 Pechaka Mandala
Pitha Mandala: Pitha means a container that has energy in the center as well
as in a loop around it, mathematically {x= True and n=1}. Fig 5.7 contains
the central object of energy with a single loop of energy.
Fig 5.7 Pitha Mandala
Mahapitha Mandala: Mahapitha means a big basket that is characterized by
two loops of energy, mathematically {x=False and n=2}. This structure,
shown in fig 5.8, contains more energy than the Pitha Mandala because it has
more loops. The energy loops may not always be concentric, but they can
overlap each other. An Example of this mandala is two bodies with a
difference in mass orbiting around a common barycenter, like the Charon-
Pluto system.
Fig 5.8 Mahapita Mandala

99
Upapitha Mandala: Upapitha means additional to pitha and this is
characterized by two energy loops with a central energy space, mathematically
{x= True and n=2}. Fig 5.9 represents this mandala, which has a central object
and two loops of energy. An example of this mandala is two moons around the
planet Mars.
Fig 5.9 Upapitha Mandala
Ugrapitha Mandala: It means forceful pedestal. It has the pattern of three
energy loops, as shown in fig 5.10, mathematically {x=False and n=3}. An
example of this mandala is algol triple star systems.
Fig 5.10 Ugrapitha Mandala
Sthandila Mandala: Sthandila means an open ground or the place of rest that
is represented in fig 5.11, mathematically {x=True and n=3}. Pattern of this
mandala has three energy loops with a central energy space. This mandala is a
near complete mandala, because it has the three energy loops meant for human
habitants. This mandala is used for planning villages on an open ground. The
fields will be in the center of the village and three major settlements or paths
(veethis) are planned around the fields.
100
Fig 5.11 Sthandila Mandala
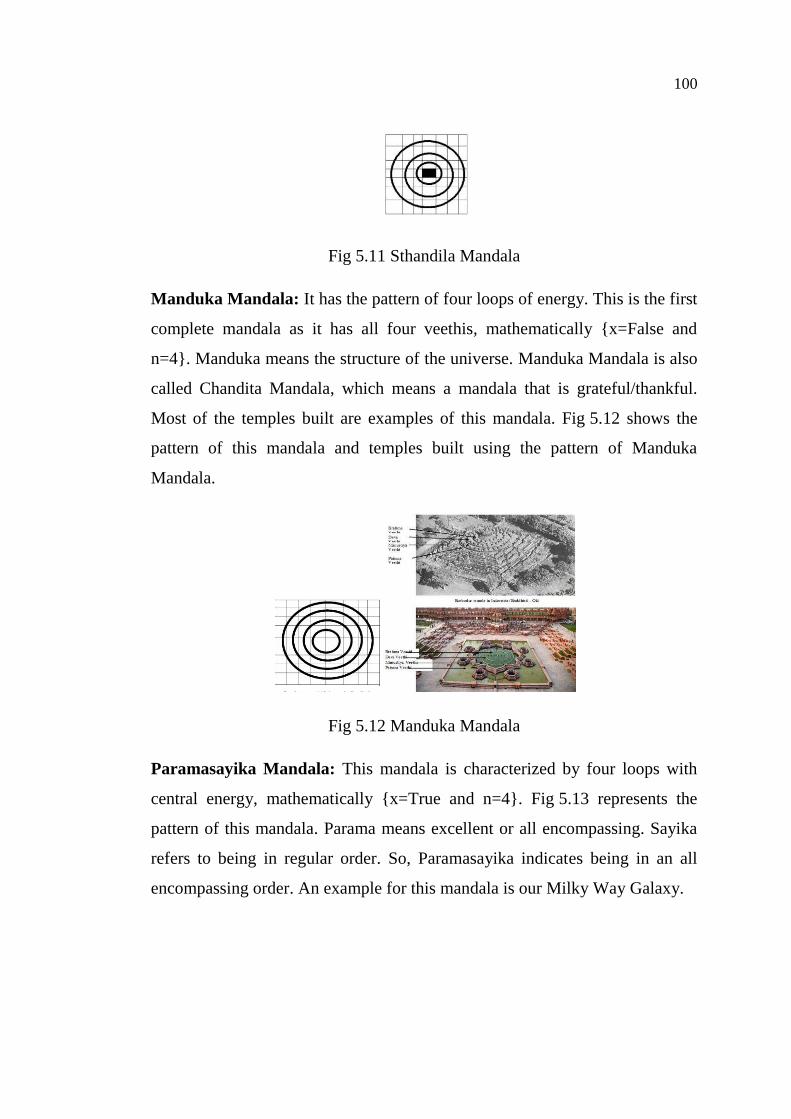
Manduka Mandala: It has the pattern of four loops of energy. This is the first
complete mandala as it has all four veethis, mathematically {x=False and
n=4}. Manduka means the structure of the universe. Manduka Mandala is also
called Chandita Mandala, which means a mandala that is grateful/thankful.
Most of the temples built are examples of this mandala. Fig 5.12 shows the
pattern of this mandala and temples built using the pattern of Manduka
Mandala.
Fig 5.12 Manduka Mandala
Paramasayika Mandala: This mandala is characterized by four loops with
central energy, mathematically {x=True and n=4}. Fig 5.13 represents the
pattern of this mandala. Parama means excellent or all encompassing. Sayika
refers to being in regular order. So, Paramasayika indicates being in an all
encompassing order. An example for this mandala is our Milky Way Galaxy.

101
Fig 5.13 Paramasayika Mandala
A traditional house built based on the Paramasayika Mandala will have
an open courtyard at the center. This is the center of high energy. Around the
center, there can be a walkway, which is the first veethi called Brahma Veethi,
so that the energy from the center can flow towards the rooms in the next
veethis. As the energy in this veethi is higher, the rooms (halls, living rooms)
where people spend most of their time can be built there. The next veethi Deva
Veethi involves the creation of matter and energy and so the dining rooms and
bedrooms of the newly married can be built here. This will have an energy
lesser than the Brahma Veethi. The next veethi will surely have a lesser energy
compared to this veethi. Hence, storage rooms, granaries, treasure chests and
bedrooms of elders can be built in Manushya Veethi. The next veethi Paisacha
Veethi may have a garden filled with trees and a high raised platform.
Similarly, the above said four Loka divisions Manduka Loka, Dyauh
Loka, Deva Loka and Manushya Loka are also mapped to earth, Solar system,
galaxy and universe respectively [77]. The next section explains how exactly
the patterns of vastu fit into the software architecture.
5.2 MAPPING OF VASTU MANDALAS TO SOFTWARE
ARCHITECTURAL STYLES
As discussed in chapter 2, the two patterns in Vastu are veethis, with a
central object and without a central object. This classification is very similar to
the two broad categories of software systems, like systems operating in

102
centralized mode and distributed mode. Patterns in vastu are similar to
architectural patterns and styles available in a literature.
The monolithic architecture is the single, undivided system structure
with interconnected components. The same pattern of architecture was
proposed 2000 years ago in Vastu as a Sakala Mandala. The Sakala Mandala
is the representation of a monolithic architecture with interconnected parts.
The Pechaka Mandala, which symbolizes the structure with one loop of
energy, is mapped to the single layer of pipe and filter architectural pattern.
The client–server architecture pattern with the central database is mapped to
Pitha Mandala as Pitha Mandala represents the structure with the central
object and one loop. The loop can also be mapped to Pechaka mandala.
Similarly, the blackboard architecture pattern will also fit into Pitha Mandala.
Mahapitha Mandala is mapped to the distributed client–server
architecture pattern. The inner loop of Mahapitha Mandala is mapped to
distributed servers and the outer loop is mapped to distributed clients.
Upapitha Mandala is mapped to remote procedure call pattern. The inner loop
in this mandala is mapped to remote procedures residing in various systems
and the outer loop is mapped to the main program routine. The inner loop may
query the centralized database. The result of the query will be returned to the
outer loop. Ugrapitha Mandala consists of three loops. This mandala is
mapped to the distributed three-tier architecture pattern [111]. The inner loop
is mapped to distributed database servers; the middle loop is mapped to a
collection of application servers, and the outer loop to clients.
Sthandila Mandala is mapped to the three layer central data store
architectural pattern [89]. The central object is mapped to the database. The
inner loop is mapped to data access components; the middle loop is mapped to
business object components, and the outer loop to UI components and clients.
Manduka Mandala is mapped to the distributed multilayered architecture

103
pattern of four layers [89]. The first innermost loop is mapped to the database
and services; the second inner loop is mapped to data access components; the
third loop is mapped to web service components and business components and
the outer loop to the collection of UI components, clients, and UI access
components.
Paramasayika Mandala is mapped to the multilayered web architecture
[112]. The central object is mapped to the database. The first innermost loop is
mapped to the server side framework; the second inner loop is mapped to
business components; the third loop is mapped to web service components and
the outer loop to the collection of UI components, clients, and UI access
components. According to vastu, it is a complete mandala with central object
and four veethis. Hence, it is implied that any architecture consisting of at
least four layers and a central database will be a complete structure.
The nine different mandalas existing in the Manduka Loka division are
mapped to different architectural patterns. As depicted in section 5.1, the four
Loka divisions Manduka Loka, Dyauh Loka, Deva Loka and Manushya Loka
can have one or more loops in them. These loops can also be suitably mapped
to appropriate architectural styles like the above.
Further, the four Lokas mentioned above can be appropriately mapped
like Manduka Loka mapped to Earth, Dyuah Loka mapped to solar system,
Deva Loka mapped to the galaxy, Manushya Loka mapped to the Universe.
These Loka divisions are mapped to distributed computing within the
organization, campus, region, country, around the world and perhaps the entire
universe. The type of distributed systems built using these four Lokas may be
called ‘super distributed system’ ‘ultra distributed system’, ‘ultra super
distributed system’ and ‘supreme distributed system’.

104
With the super distributed system, information distribution may be
within the earth. Ultra distributed system may be designed for communication
and data distribution in earth and moon, an Ultra super distributed system may
be designed for communication among planets in the galaxy. Supreme
distributed system may be for intergalaxy communication in the Universe.
Thus, vastu can help us in building any kind of complex system.
Comparative analysis of Vastu mandalas and software architecture
styles has been done based on the important characteristics of software
architecture [113]. They are structure, communication and control. One or two
criteria have been taken for the investigation based on judgment of
practitioners. Criteria considered are physical deployment for structure, shared
data & duplicated shared data and message passing for communication,
concurrent & sequential for control. Table 5.1 below displays the analysis of
architecture styles with respect to the above chosen criteria.
Criteria details:
a) Physical deployment: number of levels (separation of concerns) the
components and connectors of the style can be deployed
b) Shared data: whether shared data can be used at the level
c) Duplicate shared data: if the shared data is not being used, whether
duplicate or copy of it can be used at the given level
d) Message passing: whether data can be passed using a message passing
mechanism at the level
e) Concurrent: computations can be done simultaneously for intra level
f) Sequential: computations can be done sequentially for intra level or
inter level

105
Pipe and Filter architecture style deals with the data stream processing.
This may be on a single level of sequential operation of the incremental data
transfer. But the same style can be used in two stages with data sharing and
concurrency. Hence this style falls under the Pechaka, pitha, Mahapitha and
Upapitha mandalas. Batch sequential architecture style is non interactive and
not supporting concurrent operations. Hence this style is placed under pechaka
mandala if it is on a single level. The same style can be mapped to pitha,
Mahapitha, Ugrapitha and Manduka when the series of operations is done at
various levels in a sequential order.
Blackboard architecture style contains Blackboard, controller and
knowledge sources. The controller and knowledge sources may be on a single
level or in two levels with Blackboard as a central object. So, this style falls
under pitha and Upapitha mandalas. Repository stye is highly efficient when
dealing with large amount of data. But it finds difficult to distribute. So, this
style is considered to map the Pitha Mandala.
Main subroutine style has a main program that acts as a controller and
subroutines that do tasks with or without shared data. This suggests having
two levels with or without central object. So, this style maps Mahapitha and
Upapitha mandalas. Master slave architecture style consists of multiple
parallel tasks. The task that controls all the others is the master and the
remaining tasks are slaves. One master task always drives one or more slave
tasks. It is very advantageous when creating multi-task applications. However,
this style is considered better to map the Mahapitha, Upapitha, Ugrapitha,
sthandila and paramasayika mandalas.
The client server style fits in two, three and four levels without central
object and one, two and three levels with central object. So, this style maps to
pitha, Mahapitha, Upapitha, Ugrapitha, sthandila and Manduka mandalas.

106
Table 5.1 Mapping Table
Shared data
duplicate
shared data Msg passing Concurrent Sequential
1 √ √ √ √ Х √ Pechaka , Pitha
2 √ √ √ √ √ Х Mahapitha, Upapitha
3 Х NA NA Х NA NA
4 Х NA NA Х NA NA
1 √ √ Х √ Х √ Pechaka , Pitha
2 √ Х Х √ Х √ Mahapitha
3 √ Х Х √ Х √ Ugrapitha
4 √ Х Х √ Х √ Manduka
1 Х NA NA Х NA NA
2 √ √ √ √ Х √ Mahapitha, Upapitha
3 Х NA NA NA NA √
4 Х NA NA NA NA √
1 Х NA NA Х NA NA
2 √ √ √ √ √ Х Mahapitha, Upapitha
3 √ √ √ √ √ Х Ugrapitha, Sthandila
4 √ √ √ √ √ Х Manduka, Paramasaykia
1 √ √ Х Х √ Х Pitha
2 Х NA NA Х NA NA
3 Х NA NA Х NA NA
4 Х NA NA Х NA NA
1 √ √ Х Х √ √ Pitha
2 √ √ Х Х √ √ Upapitha
3 Х NA NA Х NA NA
4 Х NA NA Х NA NA
1 Х NA NA Х NA NA
2 √ √ √ √ Х √ Mahapitha, Upapitha
3 √ √ √ √ Х √ Ugrapitha, Sthandila
4 √ √ √ √ Х √ Manduka, Paramasaykia
1 √ √ Х √ √ √ Pitha
2 √ √ √ √ √ √ Mahapitha, Upapitha
3 √ √ √ √ √ √ Ugrapitha, Sthandila
4 √ Х √ √ √ √ Manduka
1 Х NA NA Х NA NA
2 Х NA NA Х NA NA
3 √ √ √ √ Х √ Ugrapitha
4 Х NA NA Х NA NA
1 Х NA NA Х NA NA
2 Х NA NA Х NA NA
3 √ √ √ √ Х √ Ugrapitha
4 Х NA NA Х NA NA
1 Х NA NA Х NA NA
2 Х NA NA Х NA NA
3 √ √ √ √ Х √ Ugrapitha
4 Х NA NA Х NA NA
1 Х NA NA Х NA NA
2 Х NA NA Х NA NA
3 √ √ √ √ √ √ Ugrapitha
4 Х NA NA Х NA NA
Communication
Physical
deployment
Service oriented
Mapped
Mandalas
Client
server
Broker
MVC
PAC
No.of
Levels
Control
Layered
Pipe & Filter
Batch
sequential
Main
Subroutine
Master
Slave
Repository
Blackboard

107
Layered architecture style deals with two or more than two levels. So,
other than sakala, pechaka and pitha mandalas all other mandalas are mapped
to this style. Monolithic kernel maps the indivisible interconnected structure
sakala mandala. Here we are not discussing about this. The following table 5.2
summarizes the mapping.
Table 5.2 Summary of Mapping
Mandalas Architectural Styles
paramasayka Master slave, Layered
Manduka Batch Sequential, Master slave, Layered, Client server
Sthandila Master slave, Layered, Client server
Ugrapitha Batch Sequential, Master slave, Layered, Client server , Broker, MVC,
PAC, Service oriented
Upapitha Pipe & Filter, Main subroutine, Master slave, Blackboard, Layered,
Client server
Mahapitha Pipe & Filer, Batch Sequential, Main subroutine, Master slave, Layered,
Client server
Pitha Pipe & Filer, Batch Sequential, Repository, Blackboard,
Client server
Pechaka Pipe & Filer, Batch Sequential
The next section deals with the level of support provided by the
software architectural styles to a set of quality attributes and thus they are
related to vastu mandalas. A detailed analysis is presented based on the quality
attributes and vastu mandalas.
5.3 MANDALAS AND QUALITY ATTRIBUTES
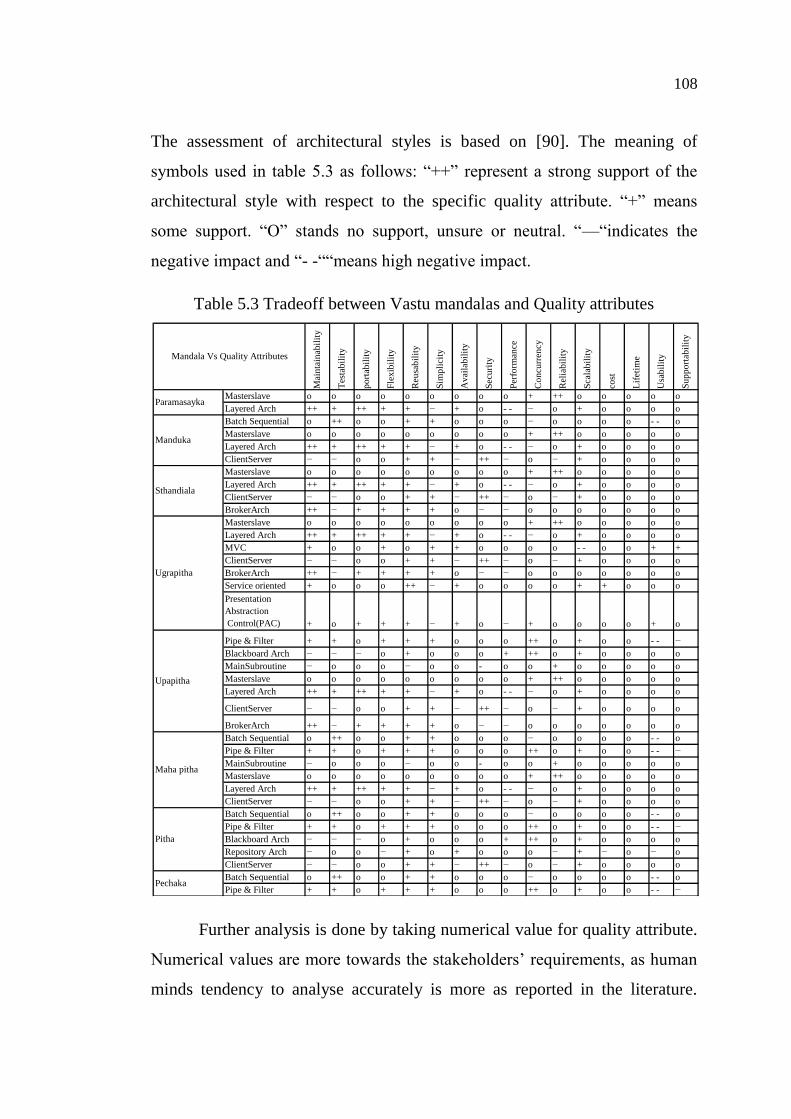
Table 5.3 shows the tradeoff between Mandalas and quality attributes.
Quality attributes play vital role in the design or selection of architectural style
for a system. A number of common quality attributes are listed in [89] [90].
They are not same. All the quality attributes have been taken for evaluation.
108
The assessment of architectural styles is based on [90]. The meaning of
symbols used in table 5.3 as follows: “++” represent a strong support of the
architectural style with respect to the specific quality attribute. “+” means
some support. “O” stands no support, unsure or neutral. “—“indicates the
negative impact and “- -““means high negative impact.
Table 5.3 Tradeoff between Vastu mandalas and Quality attributes
Further analysis is done by taking numerical value for quality attribute.
Numerical values are more towards the stakeholders’ requirements, as human
minds tendency to analyse accurately is more as reported in the literature.
Mai
nta
inab
ilit
y
Tes
tab
ilit
y
po
rtab
ilit
y
Fle
xib
ilit
y
Reu
sab
ilit
y
Sim
pli
city
Av
aila
bil
ity
Sec
uri
ty
Per
form
ance
Co
ncu
rren
cy
Rel
iab
ilit
y
Sca
lab
ilit
y
cost
Lif
etim
e
Usa
bil
ity
Su
pp
ort
abil
ity
Masterslave o o o o o o o o o + ++ o o o o o
Layered Arch ++ + ++ + + − + o - - − o + o o o o
Batch Sequential o ++ o o + + o o o − o o o o - - o
Masterslave o o o o o o o o o + ++ o o o o o
Layered Arch ++ + ++ + + − + o - - − o + o o o o
ClientServer − − o o + + − ++ − o − + o o o o
Masterslave o o o o o o o o o + ++ o o o o o
Layered Arch ++ + ++ + + − + o - - − o + o o o o
ClientServer − − o o + + − ++ − o − + o o o o
BrokerArch ++ − + + + + o − − o o o o o o o
Masterslave o o o o o o o o o + ++ o o o o o
Layered Arch ++ + ++ + + − + o - - − o + o o o o
MVC + o o + o + + o o o o - - o o + +
ClientServer − − o o + + − ++ − o − + o o o o
BrokerArch ++ − + + + + o − − o o o o o o o
Service oriented + o o o ++ − + o o o o + + o o o
Presentation
Abstraction
Control(PAC) + o + + + − + o − + o o o o + o
Pipe & Filter + + o + + + o o o ++ o + o o - - −
Blackboard Arch − − − o + o o o + ++ o + o o o o
MainSubroutine − o o o − o o - o o + o o o o o
Masterslave o o o o o o o o o + ++ o o o o o
Layered Arch ++ + ++ + + − + o - - − o + o o o o
ClientServer − − o o + + − ++ − o − + o o o o
BrokerArch ++ − + + + + o − − o o o o o o o
Batch Sequential o ++ o o + + o o o − o o o o - - o
Pipe & Filter + + o + + + o o o ++ o + o o - - −
MainSubroutine − o o o − o o - o o + o o o o o
Masterslave o o o o o o o o o + ++ o o o o o
Layered Arch ++ + ++ + + − + o - - − o + o o o o
ClientServer − − o o + + − ++ − o − + o o o o
Batch Sequential o ++ o o + + o o o − o o o o - - o
Pipe & Filter + + o + + + o o o ++ o + o o - - −
Blackboard Arch − − − o + o o o + ++ o + o o o o
Repository Arch − o o − + o + o o o − + − o − o
ClientServer − − o o + + − ++ − o − + o o o o
Batch Sequential o ++ o o + + o o o − o o o o - - o
Pipe & Filter + + o + + + o o o ++ o + o o - - −Pechaka
Mandala Vs Quality Attributes
Paramasayka
Manduka
Ugrapitha
Pitha
Maha pitha
Sthandiala
Upapitha

109
Discrete ordinal integer values are being used in table 5.4 to map the
symbols of table 5.3.
Table 5.4 Trade off table with numerical Values
The following scheme is used to map symbols into numerical values to
obtain the table 5.4 that represents the tradeoff with numerical values.
Mai
nta
inab
ilit
y
Tes
tab
ilit
y
po
rtab
ilit
y
Fle
xib
ilit
y
Reu
sab
ilit
y
Sim
pli
city
Av
aila
bil
ity
Sec
uri
ty
Per
form
ance
Co
ncu
rren
cy
Rel
iab
ilit
y
Sca
lab
ilit
y
cost
Lif
etim
e
Usa
bil
ity
Su
pp
ort
abil
ity
Masterslave 0 0 0 0 0 0 0 0 0 2 4 0 0 0 0 0
Layered Arch 4 2 4 2 2 -2 2 0 -4 -2 0 2 0 0 0 0
Batch Sequential 0 4 0 0 2 2 0 0 0 -2 0 0 0 0 -4 0
Masterslave 0 0 0 0 0 0 0 0 0 2 4 0 0 0 0 0
Layered Arch 4 2 4 2 2 -2 2 0 -4 -2 0 2 0 0 0 0
ClientServer -2 -2 0 0 2 2 -2 4 -2 0 -2 2 0 0 0 0
Masterslave 0 0 0 0 0 0 0 0 0 2 4 0 0 0 0 0
Layered Arch 4 2 4 2 2 -2 2 0 -4 -2 0 2 0 0 0 0
ClientServer -2 -2 0 0 2 2 -2 4 -2 0 -2 2 0 0 0 0
BrokerArch 4 -2 2 2 2 2 0 -2 -2 0 0 0 0 0 0 0
Masterslave 0 0 0 0 0 0 0 0 0 2 4 0 0 0 0 0
Layered Arch 4 2 4 2 2 -2 2 0 -4 -2 0 2 0 0 0 0
MVC 2 0 0 2 0 2 2 0 0 0 0 -4 0 0 2 2
ClientServer -2 -2 0 0 2 2 -2 4 -2 0 -2 2 0 0 0 0
BrokerArch 4 -2 2 2 2 2 0 -2 -2 0 0 0 0 0 0 0
Service oriented 2 0 0 0 4 -2 2 0 0 0 0 2 2 0 0 0
Presentati0n
Abstracti0n
Control(PAC) 2 0 2 2 2 -2 2 0 -2 2 0 0 0 0 2 0
Pipe & Filter 2 2 0 2 2 2 0 0 0 4 0 2 0 0 -4 -2
Blackboard Arch -2 -2 -2 0 2 0 0 0 2 4 0 2 0 0 0 0
MainSubroutine -2 0 0 0 -2 0 0 -2 0 0 2 0 0 0 0 0
Masterslave 0 0 0 0 0 0 0 0 0 2 4 0 0 0 0 0
Layered Arch 4 2 4 2 2 -2 2 0 -4 -2 0 2 0 0 0 0
ClientServer -2 -2 0 0 2 2 -2 4 -2 0 -2 2 0 0 0 0
BrokerArch 4 -2 2 2 2 2 0 -2 -2 0 0 0 0 0 0 0
Maha pitha Batch Sequential 0 4 0 0 2 2 0 0 0 -2 0 0 0 0 -4 0
Pipe & Filter 2 2 0 2 2 2 0 0 0 4 0 2 0 0 -4 -2
MainSubroutine -2 0 0 0 -2 0 0 -2 0 0 2 0 0 0 0 0
Masterslave 0 0 0 0 0 0 0 0 0 2 4 0 0 0 0 0
Layered Arch 4 2 4 2 2 -2 2 0 -4 -2 0 2 0 0 0 0
ClientServer -2 -2 0 0 2 2 -2 4 -2 0 -2 2 0 0 0 0
Batch Sequential 0 4 0 0 2 2 0 0 0 -2 0 0 0 0 -4 0
Pipe & Filter 2 2 0 2 2 2 0 0 0 4 0 2 0 0 -4 -2
Blackboard Arch -2 -2 -2 0 2 0 0 0 2 4 0 2 0 0 0 0
Repository Arch -2 0 0 -2 2 0 2 0 0 0 -2 2 -2 0 -2 0
ClientServer -2 -2 0 0 2 2 -2 4 -2 0 -2 2 0 0 0 0
Pechaka Batch Sequential 0 4 0 0 2 2 0 0 0 -2 0 0 0 0 -4 0
Pipe & Filter 2 2 0 2 2 2 0 0 0 4 0 2 0 0 -4 -2
pitha
Mandala Vs Quality Attributes
Paramasayka
Manduka
Sthandiala
Ugrapitha
Upapitha

110
Now it is clear that the value 4 represents a strong support, 2 represents
support, 0 represents neutral, -2 represents negative impact and -4 represents a
high negative impact. Based on this implication the maximum, minimum and
average level of support for each quality attribute with respect to each mandala
is calculated and presented in table 5.5.
Table 5.5 Max, Min and Average support
The following graphs are obtained by using the table 5.5. These graphs
for mandalas clearly portray different levels (Max, Min, Avg) of support for
various quality attributes.
Fig 5.14 (a) shows that paramasayka mandala can provide a strong
support to Maintainability, portability and Reliability at the maximum. On an
average it provides a support to these three quality attributes, whereas at the
minimum level it will be neutral to these attributes. As the minimum level
doesn’t give negative impact, either the Master slave or Layered architectural
styles or a combination of both can be used to achieve these quality attributes.
Max
Min
AV
G
Max
Min
AV
G
Max
Min
AV
G
Max
Min
AV
G
Max
Min
AV
G
Max
Min
AV
G
Max
Min
AV
G
Max
Min
AV
G
Maintainability 4 0 2 4 -2 1 4 -2 2 4 -2 2 4 -2 1 4 -2 0 2 -2 -1 2 0 1
Testability 2 0 1 4 -2 1 2 -2 -1 2 -2 -0 2 -2 -0 4 -2 1 4 -2 0 4 2 3
portability 4 0 2 4 0 1 4 0 2 4 0 1 4 -2 1 4 0 1 0 -2 -0 0 0 0
Flexibility 2 0 1 2 0 1 2 0 1 2 0 1 2 0 1 2 0 1 2 -2 0 2 0 1
Reusability 2 0 1 2 0 2 2 0 2 4 0 2 2 -2 1 2 -2 1 2 2 2 2 2 2
Simplicity 0 -2 -1 2 -2 1 2 -2 1 2 -2 0 2 -2 1 2 -2 1 2 0 1 2 2 2
Availability 2 0 1 2 -2 0 2 -2 0 2 -2 1 2 -2 0 2 -2 0 2 -2 0 0 0 0
Security 0 0 0 4 0 1 4 -2 1 4 -2 0 4 -2 0 4 -2 0 4 0 1 0 0 0
Performance 0 -4 -2 0 -4 -2 0 -4 -2 0 -4 -1 2 -4 -1 0 -4 -1 2 -2 0 0 0 0
Concurrency 2 -2 0 2 -2 -1 2 -2 0 2 -2 0 4 -2 1 4 -2 0 4 -2 1 4 -2 1
Reliability 4 0 2 4 -2 1 4 -2 1 4 -2 0 4 -2 1 4 -2 1 0 -2 -1 0 0 0
Scalability 2 0 1 2 0 1 2 0 1 2 -4 0 2 0 1 2 0 1 2 0 2 2 0 1
cost 0 0 0 0 0 0 0 0 0 2 0 0 0 0 0 0 0 0 0 -2 -0 0 0 0
Lifetime 0 0 0 0 0 0 0 0 0 0 0 0 0 0 0 0 0 0 0 0 0 0 0 0
Usability 0 0 0 0 -4 -1 0 0 0 2 0 1 0 -4 -1 0 -4 -1 0 -4 -2 -4 -4 -4
Supportability 0 0 0 0 0 0 0 0 0 2 0 0 0 -2 -0 0 -2 -0 0 -2 -0 0 -2 -1
Mandala Vs Quality Attributes
PechakaParamasayka Manduka Ugrapitha Upapitha Mahapitha PithaSthandila

111
Fig 5.14 (a) Paramasayka Mandala with Quality attributes
Fig 5.14 (b) shows that Manduka mandala provides strong support to
Maintainability, Testability, portability, security and Reliability at the
maximum level. Even this mandala supports these attributes at the average
level; Maintainability, Testability and Reliability are not supported at the
minimum level. Hence any one of the style under Manduka mandala can be
used to reach portability and security; whereas a combination of architectural
styles can be used to obtain all five quality attributes.
Fig 5.14 (b) Manduka Mandala with Quality attributes
Fig 5.14 (c) portrays that sthandila mandala has a strong support for
Maintainability, portability, security and Reliability at the maximum level.
Portability alone can be achieved as a neutral at the minimum level. Hence it
is advised not to select any of the style under this mandala to get these four
-6
-4
-2
0
2
4
6
Mai
nta
inab
ility
Test
abili
ty
po
rtab
ility
Flex
ibili
ty
Reu
sab
ility
Sim
plic
ity
Ava
ilab
ility
Secu
rity
Pe
rfo
rman
ce
Co
ncu
rren
cy
Rel
iab
ility
Scal
abili
ty
cost
Life
tim
e
Usa
bili
ty
Sup
po
rtab
ility
Parmasayka
-6
-4
-2
0
2
4
6
Mai
nta
inab
ility
Test
abili
ty
po
rtab
ility
Flex
ibili
ty
Reu
sab
ility
Sim
plic
ity
Ava
ilab
ility
Secu
rity
Pe
rfo
rman
ce
Co
ncu
rren
cy
Rel
iab
ility
Scal
abili
ty
cost
Life
tim
e
Usa
bili
ty
Sup
po
rtab
ility
Manduka

112
quality attributes. But the combination of styles under this mandala can be
used to get these four attributes as they are supported at average level.
Fig 5.14 (c) Sthandila Mandala with Quality attributes
Fig 5.14 (d) represents that Ugrapitha mandala posses a strong support
for Maintainability, portability, security, Reusability and Reliability.
Maintainability, Security and Reliability will be excluded from the list as they
have a negative impact at the minimum level. So, any one of the styles under
this mandala can be used to achieve Portability and Reusability. All five
quality attributes can be obtained when we use a combination of all styles
under this mandala.
Fig 5.14 (d) Ugrapitha Mandala with Quality attributes
Fig 5.14 (e) briefs that Upapitha mandala provides a strong support for
Maintainability, portability, security, concurrency and Reliability at the
maximum level. These five attributes are having a negative impact at the
-6
-4
-2
0
2
4
6
Mai
nta
inab
ility
Test
abili
ty
po
rtab
ility
Flex
ibili
ty
Reu
sab
ility
Sim
plic
ity
Ava
ilab
ility
Secu
rity
Pe
rfo
rman
ce
Co
ncu
rren
cy
Rel
iab
ility
Scal
abili
ty
cost
Life
tim
e
Usa
bili
ty
Sup
po
rtab
ility
Sthandila
-6
-4
-2
0
2
4
6
Mai
nta
inab
ility
Test
abili
ty
po
rtab
ility
Flex
ibili
ty
Reu
sab
ility
Sim
plic
ity
Ava
ilab
ility
Secu
rity
Pe
rfo
rman
ce
Co
ncu
rren
cy
Rel
iab
ility
Scal
abili
ty
cost
Life
tim
e
Usa
bili
ty
Sup
po
rtab
ility
Ugrapitha
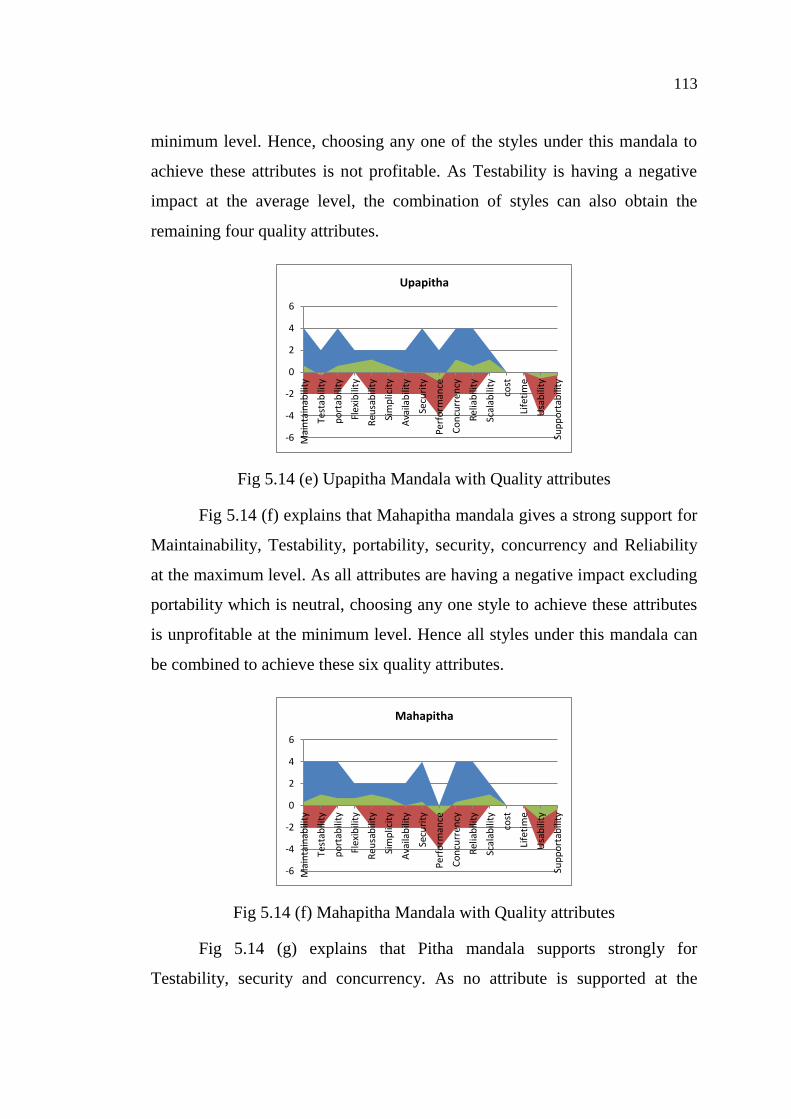
113
minimum level. Hence, choosing any one of the styles under this mandala to
achieve these attributes is not profitable. As Testability is having a negative
impact at the average level, the combination of styles can also obtain the
remaining four quality attributes.
Fig 5.14 (e) Upapitha Mandala with Quality attributes
Fig 5.14 (f) explains that Mahapitha mandala gives a strong support for
Maintainability, Testability, portability, security, concurrency and Reliability
at the maximum level. As all attributes are having a negative impact excluding
portability which is neutral, choosing any one style to achieve these attributes
is unprofitable at the minimum level. Hence all styles under this mandala can
be combined to achieve these six quality attributes.
Fig 5.14 (f) Mahapitha Mandala with Quality attributes
Fig 5.14 (g) explains that Pitha mandala supports strongly for
Testability, security and concurrency. As no attribute is supported at the
-6
-4
-2
0
2
4
6M
ain
tain
abili
ty
Test
abili
ty
po
rtab
ility
Flex
ibili
ty
Reu
sab
ility
Sim
plic
ity
Ava
ilab
ility
Secu
rity
Pe
rfo
rman
ce
Co
ncu
rren
cy
Rel
iab
ility
Scal
abili
ty
cost
Life
tim
e
Usa
bili
ty
Sup
po
rtab
ility
Upapitha
-6
-4
-2
0
2
4
6
Mai
nta
inab
ility
Test
abili
ty
po
rtab
ility
Flex
ibili
ty
Reu
sab
ility
Sim
plic
ity
Ava
ilab
ility
Secu
rity
Pe
rfo
rman
ce
Co
ncu
rren
cy
Rel
iab
ility
Scal
abili
ty
cost
Life
tim
e
Usa
bili
ty
Sup
po
rtab
ility
Mahapitha

114
minimum level, selecting one among the styles under this mandala can be
avoided. The combination of these styles can achieve all three attributes at the
average level.
Fig 5.14 (g) Pitha Mandala with Quality attributes
Fig 5.14 (h) tells that Pechaka mandala posses a strong support for
Testability and concurrency. As Concurrency has negative impact at the
minimum level, choosing one style under the mandala is not appropriate. But
the style combination may meet these two attributes at the average level.
Fig 5.14 (h) Pechaka Mandala with Quality attributes
This analysis clearly shows the support of a collection of attributes with
respect to mandala at the strongest level. Details about varying level support
of attributes can also be obtained easily from these graphs. This section clearly
shows the symbol to numerical value conversion and calculating maximum,
minimum and average level support for each attribute.
-6
-4
-2
0
2
4
6
Mai
nta
inab
ility
Test
abili
ty
po
rtab
ility
Flex
ibili
ty
Reu
sab
ility
Sim
plic
ity
Ava
ilab
ility
Secu
rity
Pe
rfo
rman
ce
Co
ncu
rren
cy
Rel
iab
ility
Scal
abili
ty
cost
Life
tim
e
Usa
bili
ty
Sup
po
rtab
ility
Pitha
-6
-4
-2
0
2
4
6
Mai
nta
inab
ility
Test
abili
ty
po
rtab
ility
Flex
ibili
ty
Reu
sab
ility
Sim
plic
ity
Ava
ilab
ility
Secu
rity
Pe
rfo
rman
ce
Co
ncu
rren
cy
Rel
iab
ility
Scal
abili
ty
cost
Life
tim
e
Usa
bili
ty
Sup
po
rtab
ility
Pechaka

115
It is clearly shown in the above analysis that set of quality attributes are
suitably mapped to vastu mandalas and the level of support they provide. The
architecture styles classified under these mandalas, exhibit the same level of
support for a set of quality attributes. The next section proposes a new hybrid
model to select the suitable mandala and to derive the best architectural style
from that mandala.
5.4 HYBRID MODEL
This section introduces a new hybrid model that deals with the
dependent and independent criteria for the selection of the best architectural
style. The solution of the problem encompasses the architectural mining,
building a hybrid model and the style selection with the balanced quality
attributes. The high level steps or stages are shown in the fig 5.15.
(Refer fig 5.16 (a))
(Refer fig 5.16 (b))
Fig 5.15 Stages in the proposed hybrid model
The initial stage of this model is architectural styles classification
which is completely described in the previous section. The mapping table 5.2
and trade off table 5.3 are the sources available for this stage. Set of
architectural styles mapped under a mandala and their level of support are
Architecture styles classification
Mandala Selection
Best architecture style selection
Table
List of Architecture styles
Given Application
Quality attributes values
Best Architecture style

116
given in these tables. This is available before the process starts. Fig 5.16 (a)
explains the Mandala selection stage in detail.
Fig 5.16 (a) Detailed steps of Mandala selection stage
consistent
1
Judgment on
No.of Levels
Judgment on
central object
Judgment matrix construction:
M =
[ 𝑀11 𝑀12 … 𝑀19
𝑀21 𝑀22 … 𝑀29
𝑀31 𝑀32 … 𝑀39
… … … …
𝑀91 𝑀92 … 𝑀99]
Derivation of Priority Vectors:
PV =
[ 𝑝𝑣11𝑝𝑣21𝑝𝑣31𝑝𝑣41𝑝𝑣51𝑝𝑣61𝑝𝑣71𝑝𝑣81𝑝𝑣91]
Check
consistency
of matrix
Not consistent
Calculate Wtotal = PVlij * Wl + PVOij *Wo
PVl , PVo
Wl , Wo
SRS document with
Layered view
Pick up Ms = M ( Wtotal (MAX))
Display ASi (Ms)
Mapping
Table
List of Architectural styles

117
Fig 5.16 (b) Detailed steps of Style selection stage
Judgment on
Quality attributes
Judgment on
Architecture styles
Judgment matrices construction:
C=
[ 𝑄1/𝑄1 𝑄1/𝑄2 𝑄1/𝑄3 … 𝑄1/𝑄𝑁
𝑄2/𝑄1 𝑄2/𝑄2 𝑄2/𝑄3 … 𝑄2/𝑄𝑁
𝑄3/𝑄1 𝑄3/𝑄2 𝑄3/𝑄3 … 𝑄3/𝑄𝑁
… … … … …
𝑄𝑁/𝑄1 𝑄𝑁/𝑄2 𝑄𝑁/𝑄3 … 𝑄𝑁/𝑄𝑁]
,
[ 𝑄1/𝐴𝑆1 𝑄1/𝐴𝑆2 … 𝑄1/𝐴𝑆𝑁
𝑄2/𝐴𝑆1 𝑄2/𝐴𝑆2 … 𝑄2/𝐴𝑆𝑁
𝑄3/𝐴𝑆1 𝑄3/𝐴𝑆2 … 𝑄3/𝐴𝑆𝑁
… … … …
𝑄𝑁/𝐴𝑆1 𝑄𝑁/𝐴𝑆2 … 𝑄𝑁/𝐴𝑆𝑁]
,
[ 𝐴𝑆1/𝐴𝑆1 𝐴𝑆1/𝐴𝑆2 … 𝐴𝑆1/𝐴𝑆𝑛
𝐴𝑆2/𝐴𝑆1 𝐴𝑆2/𝐴𝑆2 … 𝐴𝑆2/𝐴𝑆𝑛
𝐴𝑆3/𝐴𝑆1 𝐴𝑆3/𝐴𝑆2 … 𝐴𝑆3/𝐴𝑆𝑛
… … … …
𝐴𝑆𝑛/𝐴𝑆1 𝐴𝑆𝑛/𝐴𝑆2 … 𝐴𝑆𝑛/𝐴𝑆𝑛]
Construct Supermatrix
Obtain weighted supermatrix
Get Limit matrix
Obtain Stochastic Supermatrix
Select the highest scored
Architecture style
Best Architectural style
Quality Attributes
Derivation of Priority
Vectors
Check
consistency
of matrix
Not consistent
consistent
Weights
1

118
Then the judgment matrices and priority vectors are derived. After
ensuring the consistency, the priorities of the mandalas are calculated with
respect to each criterion. Then the high scored mandala is selected from the
total of the weighted priorities of two criterions. The list of architectural styles
under this mandala is extracted from the mapping table 5.2. This is given as an
input to the next stage depicted in fig 5.16 (b) that deals the best architectural
selection.
This stage gets the geometric mean value of user’s judgment on quality
attributes and their priorities as input. Based on this judgment, the judgment
matrices are built and their priority vectors are calculated. After confirming
the matrices’ consistency, supermatrix is constructed from them. Based on the
weights given to each cluster by the architect, the weighted supermatrix is
constructed and then it is converted to stocahastic matrix in order to maintain
the balance of quality attributes. The limit of this matrix lists out the score for
architecture styles and quality attributes. The high scored architectural style is
the best style to implement the given application. The next subsection explains
the second stage of this hybrid model in detail.
5.4.1 Mandala Selection
This section discusses the process to find out the best mandala under
which the given application falls. The Inputs for this process are the given
application and the classification table. The output of this process is the
shortlisted architecture styles.
The best mandala for the application is chosen based on the number of
levels/layers and the existence of the central object. This process considers
nine alternative mandalas in order to select the best mandala as shown in fig
5.17. They are Sakala, Pechaka, Pita, MahaPita, UpaPita, UgraPita, Sthandila,
Manduka and Paramasayikya mandala.

119
Fig 5.17 Manadala Selection
The selection process comprises following steps.
a. Judgments on Mandalas:
The exact estimation of the applicable information is the critical step in
many decision-making methods where the qualitative information elicitation is
required. Quantifying the information in terms of absolute values is most
important in making the right decision. Therefore, the relative importance, or
weight, of the alternatives in terms of each criterion of a given problem is
determined in most of the problems. The pairwise comparison approach is
used to determine the relative importance of each alternative in terms of each
criterion [114]. In this approach the decision-maker choose one single
pairwise comparison’s value among available discrete choices. Each choice is
a linguistic phrase. The selected linguistic choice is quantified by using a
scale, which maps the decision maker’s discrete linguistic choices to a discrete
set of numbers that represent the importance. As per the psychological
experiments, more than seven objects cannot be compared simultaneously
[115]. The Weber law states that constant percentage of the stimulus
increment will make a change in sensation [116]. This is the basis behind the
scales shown in table 5.6 with a unit difference between successive values.
Go
al
No. of Loops Object Existence
Sakala Pechaka Pith
a
Maha pitha Upa pitha Ugra pitha Sthandila Manduka Parama
saikya

120
Table 5.6 Scale of Relative importance
Reciprocals
A reciprocal, such as 1/3, is used for the other judgment in the matrix
involving the pair. For example, if the judgment 3 is entered in cell (i,j), the
judgment 1/3 is automatically entered in cell (j,i). A matrix with this special
form is called a reciprocal matrix.According to this scale, the available values
for the pairwise comparisons are members of the set: {9, 8, 7, 6, 5, 4, 3, 2, 1,
1/2, 1/3, 1/4, 1/5, 1/6, 1/7, 1/8, 1/9}
In this research, initially the best mandala that suits for the architecture
is to be determined. The first step is to compare pairs of mandalas using
fundamental scale for pairwise comparison. For each comparison, it is decided
which mandala is weaker with respect to the number of levels giving the
mandala a weight of 1. The mandalas are denoted by Mj (j=1,2,…9). When
comparing two mandalas M1 and M2, a value of 1 is assigned, if mandala M1 is
equally important as Mandala M2 .If M1 is strongly favored then maximum
value 9 is assigned over M2. The intermediate strength of importance is
assigned by values between 1 and 9. If the value of comparing (M1, M2) is
between 1 and 9, then comparing (M2, M1) has a reciprocal value. Similarly a
Intensity of
Importance
Definition
1 Equal
2 Equally to Moderately more dominant
3 Moderately more dominant
4 Moderately to Strongly more dominant
5 Strongly more dominant
6 Strongly to Very Strongly more dominant
7 Very Strongly more dominant
8 Very Strongly to Extremely more dominant
9 Extremely more dominant

121
comparison is done on the pairs of mandalas with respect to object existence.
The next step is to construct matrices based on these judgments.
b. Mandala Weighted Matrix construction:
The next step is to transfer the weights to a matrix.
M =
[ 𝑀11 𝑀12 … 𝑀19
𝑀21 𝑀22 … 𝑀29
𝑀31 𝑀32 … 𝑀39
… … … …
𝑀91 𝑀92 … 𝑀99]
Now, the complete Judgment matrix is obtained. The next step is to derive the
priority vectors from this matrix.
c. Derivation of Weighted Priority Vectors:
Priority vectors list the relative weight of each mandala of each
criterion. This process results in two priority vectors. They are PVl for the
number of loops and PVo for object existence. Priority vectors are calculated
as follows:
1. Calculate the sum of elements of each column of ‘M’ matrix
𝑀𝑖𝑗 = ∑ 𝑀𝑖𝑗 9𝑖=1 (5.1)
2. In each column, divide each element by the sum value of
column
𝑋𝑖𝑗 = 𝑀𝑖𝑗
∑ 𝑀𝑖𝑗 9𝑖=1
(5.2)

122
and obtain the matrix X =
[ 𝑋11 𝑋12 … 𝑋19
𝑋21 𝑋22 … 𝑋29
𝑋31 𝑋32 … 𝑋39
… … … …
𝑋91 𝑋92 … 𝑋99]
3. Calculate the mean value of each row
𝑃𝑉𝑖𝑗 = ∑ 𝑋𝑖𝑗
9𝑗=1
9 (5.3)
and get the priority vector PV =
[ 𝑝𝑣11𝑝𝑣21𝑝𝑣31𝑝𝑣41𝑝𝑣51𝑝𝑣61𝑝𝑣71𝑝𝑣81𝑝𝑣91]
The next step makes use of this priority vector to ensure the consistency of the
matrix and helps to select the best style.
d. Ensuring the Consistency of Matrix:
If all the comparisons are perfectly consistent, then the following
relation should always be true for any combination of comparisons taken from
the judgment matrix. It is a crucial thing to determine how consistent the
comparisons are, during the pairwise comparisons. Consistency ratio less than
0.1 indicate good consistency. Two consistency ratios exist: CRl for a number
of levels and CRo for object existence. Consistency ratio could be calculated
by the following way:
CR =( (λmax- n)/(n-1))/RI (5.4)

123
Where λmax is largest eigenvalue of matrix, n is order of matrix and RI is
random consistency index.
Consistency vector CVij =
[ 𝑐𝑣11𝑐𝑣21𝑐𝑣31𝑐𝑣41𝑐𝑣51𝑐𝑣61𝑐𝑣71𝑐𝑣81𝑐𝑣91]
can be calculated using the following
formulae
CVij = (Xi1PV11 + Xi2PV21 + Xi3PV31+ . . . +Xi9PV91) / Wi1 (5.5)
The largest eigen value λmax is calculated by taking the average of consistency
vectors given as follows
λmax = ∑ 𝐶𝑉𝑖19
𝑖=1
9 (5.6)
Now, using the λmax value, consistency index (CI) is calculated using the
formula
CI = (λmax - n) / n-1 =( λmax -9) / 8 (5.7)
If the CI value obtained using formula (7) is 0, then the judgment matrix
formed by the pairwise comparison is a perfectly consistent one. Otherwise,
the consistent ratio should be calculated as division of Consistency Index (CI)
by the Random consistency index (RI) value which is depicted in the formula
(5.8)
CR = CI /RI where RI is the Random consistency Index (5.8)
RI value is obtained from the following table 5.7 where the upper row is the
order of the random matrix and the lower row is the corresponding index of
consistency for random judgments.
124
Table 5.7 Random Consistency Index
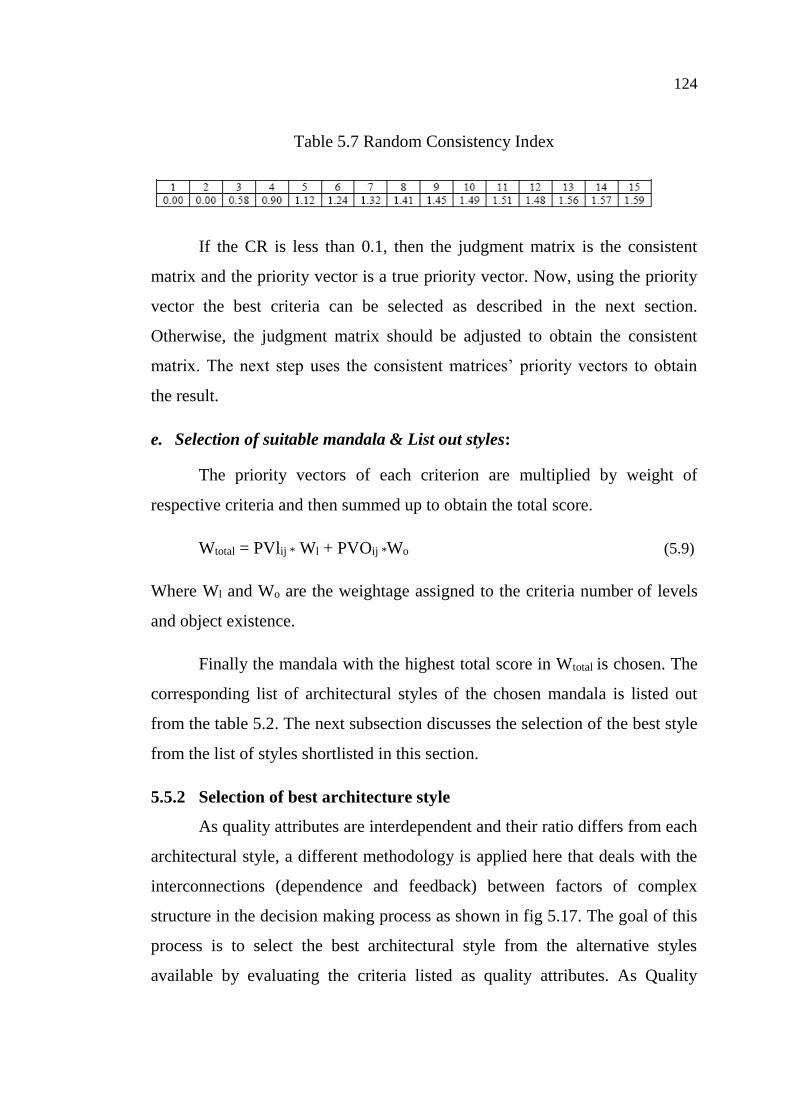
If the CR is less than 0.1, then the judgment matrix is the consistent
matrix and the priority vector is a true priority vector. Now, using the priority
vector the best criteria can be selected as described in the next section.
Otherwise, the judgment matrix should be adjusted to obtain the consistent
matrix. The next step uses the consistent matrices’ priority vectors to obtain
the result.
e. Selection of suitable mandala & List out styles:
The priority vectors of each criterion are multiplied by weight of
respective criteria and then summed up to obtain the total score.
Wtotal = PVlij * Wl + PVOij *Wo (5.9)
Where Wl and Wo are the weightage assigned to the criteria number of levels
and object existence.
Finally the mandala with the highest total score in Wtotal is chosen. The
corresponding list of architectural styles of the chosen mandala is listed out
from the table 5.2. The next subsection discusses the selection of the best style
from the list of styles shortlisted in this section.
5.5.2 Selection of best architecture style
As quality attributes are interdependent and their ratio differs from each
architectural style, a different methodology is applied here that deals with the
interconnections (dependence and feedback) between factors of complex
structure in the decision making process as shown in fig 5.17. The goal of this
process is to select the best architectural style from the alternative styles
available by evaluating the criteria listed as quality attributes. As Quality

125
attributes are interdependent, self loop is added in the criteria box. The two
arrow marks between criteria and alternatives specify that quality attributes
have impact on architectural styles and vice versa. The steps involved in
selecting the right style are given below.
Fig 5.17 Best style selection
The selection process involved comprises of following steps.
a. Judgments on Quality Attributes and Architecture styles:
Pairwise comparisons of the criteria elements are done. With respect to
each quality attribute, two levels of comparison are done. Comparisons of
Quality attribute Vs Quality attribute and Quality attributes Vs Architecture
styles are done and relative importance weights are determined using a
fundamental scale. And also, pairwise comparisons of architectural styles are
performed. The set of comparison matrices C is obtained.
C =
[ 𝑄1/𝑄1 𝑄1/𝑄2 𝑄1/𝑄3 … 𝑄1/𝑄𝑁
𝑄2/𝑄1 𝑄2/𝑄2 𝑄2/𝑄3 … 𝑄2/𝑄𝑁
𝑄3/𝑄1 𝑄3/𝑄2 𝑄3/𝑄3 … 𝑄3/𝑄𝑁
… … … … …
𝑄𝑁/𝑄1 𝑄𝑁/𝑄2 𝑄𝑁/𝑄3 … 𝑄𝑁/𝑄𝑁]
,
[ 𝑄1/𝐴𝑆1 𝑄1/𝐴𝑆2 … 𝑄1/𝐴𝑆𝑁
𝑄2/𝐴𝑆1 𝑄2/𝐴𝑆2 … 𝑄2/𝐴𝑆𝑁
𝑄3/𝐴𝑆1 𝑄3/𝐴𝑆2 … 𝑄3/𝐴𝑆𝑁
… … … …
𝑄𝑁/𝐴𝑆1 𝑄𝑁/𝐴𝑆2 … 𝑄𝑁/𝐴𝑆𝑁]
,
[ 𝐴𝑆1/𝐴𝑆1 𝐴𝑆1/𝐴𝑆2 … 𝐴𝑆1/𝐴𝑆𝑛
𝐴𝑆2/𝐴𝑆1 𝐴𝑆2/𝐴𝑆2 … 𝐴𝑆2/𝐴𝑆𝑛
𝐴𝑆3/𝐴𝑆1 𝐴𝑆3/𝐴𝑆2 … 𝐴𝑆3/𝐴𝑆𝑛
… … … …
𝐴𝑆𝑛/𝐴𝑆1 𝐴𝑆𝑛/𝐴𝑆2 … 𝐴𝑆𝑛/𝐴𝑆𝑛]
Goal : Select the best style
Performance Reliability Availability Usability Flexibility
Style 1
Style n
Style 2
Style 3

126
b. Derivation of Weighted Priority Vectors:
A set of priority vectors is calculated by the same formulas 5.1 to 5.8
used in section 5.4.1. This set represents the relative importance weights of the
pairwise comparison matrices.
c. Unweighted Supermatrix:
The interrelationships of all quality attributes and architectural styles in
the system are represented by placing the relative importance weights of
pairwise comparison matrices within a supermatrix. The row and column of
the matrix have an entry of a list of alternative mandalas, a list of quality
attributes and the goal. The unweighted supermatrix is represented by
AS1 AS2 . . . ASN
Q11 Q12 Q13 . . . Q1N Q11 Q12 Q13 . . . Q1N Q11 Q12 Q13. . .Q1N
Q11
Q12
Q13
AS1 Q14 W11 W12 . . . W1N
.
.
.
Q1N
Q11
Q12
Q13
AS2 Q14 W21 W22 . . . W2N
.
.
.
Q1N
Q11
CW = Q12
Q13
AS3 Q14 W31 W32 . . . W3N
.
.
.
Q1N
. .
. . . . . . . . . . . . . .
. .
Q11
Q12
Q13
Q14 WN1 WN2 . . . WNN
ASN .
.
.
Q1N

127
Where Wik is the block matrix of priority vectors of the influence of quality
attribute in the ith architecture style with respect to kth architecture style,
ASi is ith architecture style
And Qij is the jth quality attribute of ith architecture style
d. Stochastic supermatrix:
In general the supermatrix is rarely stochastic because, in each column,
it consists of several eigenvectors which each sums to one, and hence the
entire column of the matrix may sum to an integer greater than one. The
supermatrix must first be reduced to a matrix, each of whose columns sums to
unity, resulting in a column stochastic or simply a stochastic matrix. If the
matrix is stochastic, the limiting priorities depend on its reducibility,
primitivity, and cyclicity.
In each block of the supermatrix, a column is either a normalized
eigenvector with possibly some zero entries, or all of its elements are equal to
zero. In either case it is weighted by the priority of the corresponding cluster
on the left. If it is zero, that column of the supermatrix must be normalized
after weighting by the cluster’s weights. This operation is equivalent to
assigning a zero value to the cluster on the left when weighting a column of a
block with zero entries and then re-normalizing the weights of the remaining
clusters. Such a supermatrix is called as weighted supermatrix.
e. Limit matrix:
The weighted supermatrix is now column stochastic from which one
then derives the limiting supermatrix. The limit matrix can be obtained by
raising the matrix to largest powers so that the powers will converge to the
limit matrix or converge to the cycle of matrices where limit matrix is the
average of these matrices. The Limit Matrix is the weighted Super matrix,
128
taken to the power of k+1 to have the converged or stable values, where k is
an arbitrary number [117].
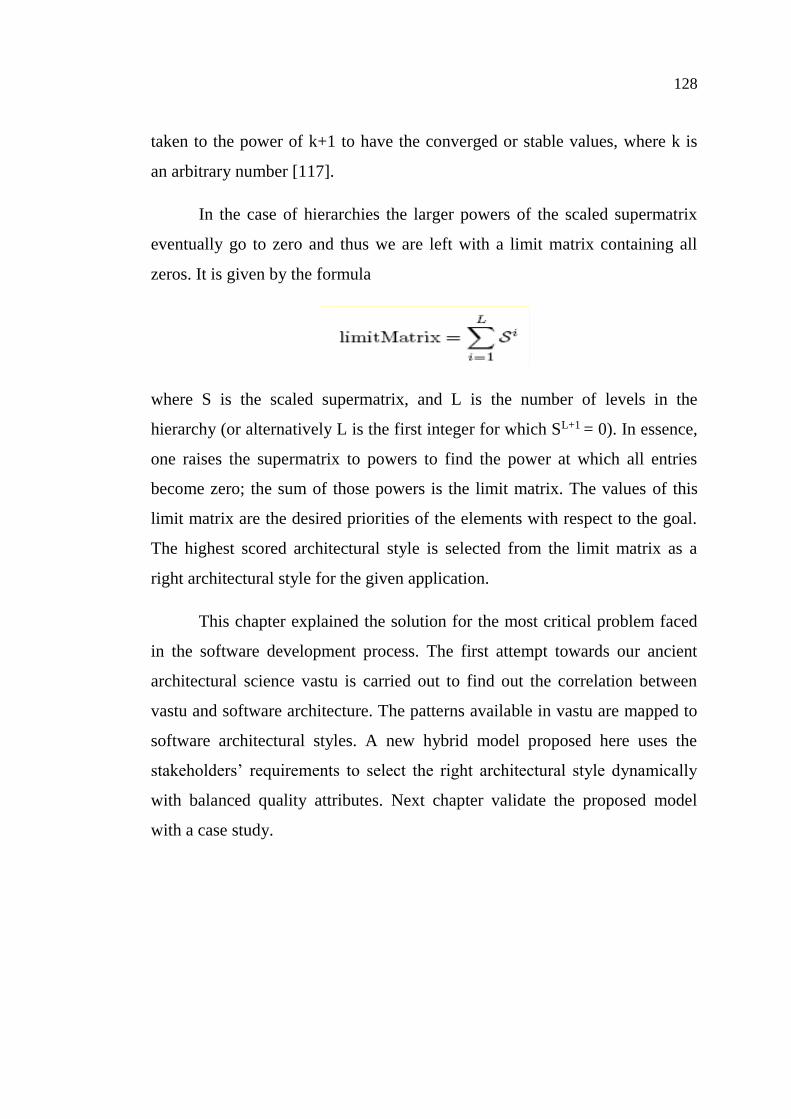
In the case of hierarchies the larger powers of the scaled supermatrix
eventually go to zero and thus we are left with a limit matrix containing all
zeros. It is given by the formula
where S is the scaled supermatrix, and L is the number of levels in the
hierarchy (or alternatively L is the first integer for which SL+1 = 0). In essence,
one raises the supermatrix to powers to find the power at which all entries
become zero; the sum of those powers is the limit matrix. The values of this
limit matrix are the desired priorities of the elements with respect to the goal.
The highest scored architectural style is selected from the limit matrix as a
right architectural style for the given application.
This chapter explained the solution for the most critical problem faced
in the software development process. The first attempt towards our ancient
architectural science vastu is carried out to find out the correlation between
vastu and software architecture. The patterns available in vastu are mapped to
software architectural styles. A new hybrid model proposed here uses the
stakeholders’ requirements to select the right architectural style dynamically
with balanced quality attributes. Next chapter validate the proposed model
with a case study.