Embed Size (px)
Citation preview
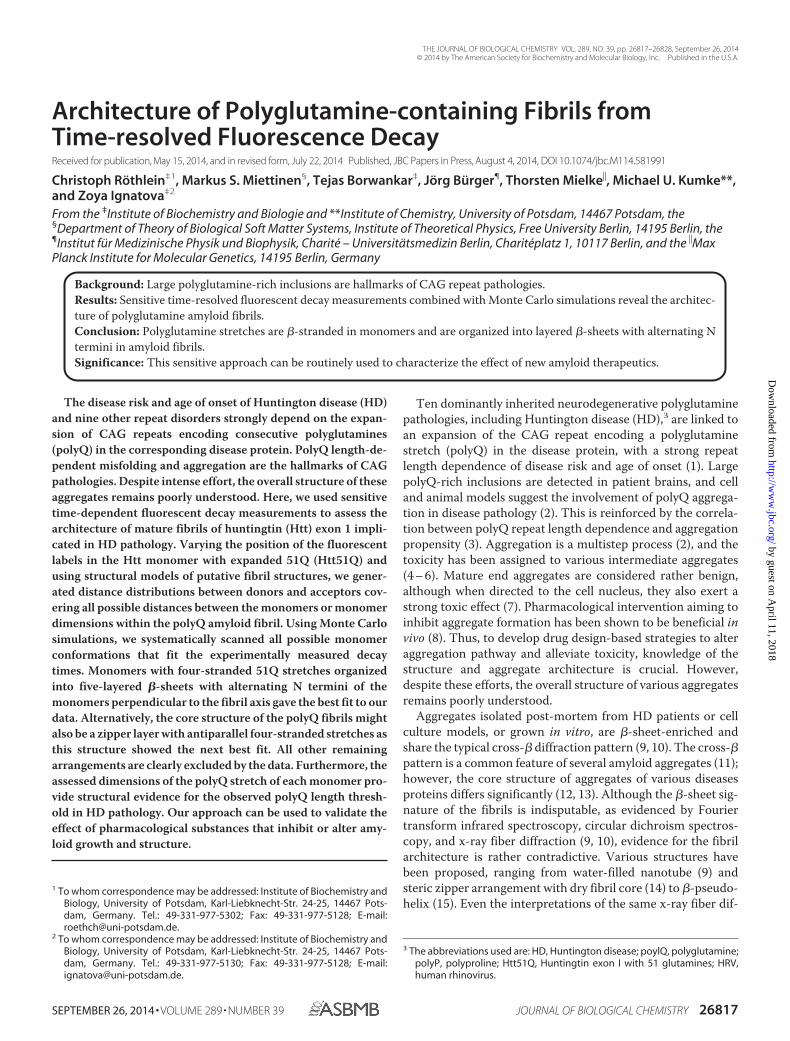
Architecture of Polyglutamine-containing Fibrils fromTime-resolved Fluorescence DecayReceived for publication, May 15, 2014, and in revised form, July 22, 2014 Published, JBC Papers in Press, August 4, 2014, DOI 10.1074/jbc.M114.581991
Christoph Röthlein‡1, Markus S. Miettinen§, Tejas Borwankar‡, Jorg Burger¶, Thorsten Mielke�, Michael U. Kumke**,and Zoya Ignatova‡2
From the ‡Institute of Biochemistry and Biologie and **Institute of Chemistry, University of Potsdam, 14467 Potsdam, the§Department of Theory of Biological Soft Matter Systems, Institute of Theoretical Physics, Free University Berlin, 14195 Berlin, the¶Institut fur Medizinische Physik und Biophysik, Charite – Universitatsmedizin Berlin, Chariteplatz 1, 10117 Berlin, and the �MaxPlanck Institute for Molecular Genetics, 14195 Berlin, Germany
Background: Large polyglutamine-rich inclusions are hallmarks of CAG repeat pathologies.Results: Sensitive time-resolved fluorescent decay measurements combined with Monte Carlo simulations reveal the architec-ture of polyglutamine amyloid fibrils.Conclusion: Polyglutamine stretches are �-stranded in monomers and are organized into layered �-sheets with alternating Ntermini in amyloid fibrils.Significance: This sensitive approach can be routinely used to characterize the effect of new amyloid therapeutics.
The disease risk and age of onset of Huntington disease (HD)and nine other repeat disorders strongly depend on the expan-sion of CAG repeats encoding consecutive polyglutamines(polyQ) in the corresponding disease protein. PolyQ length-de-pendent misfolding and aggregation are the hallmarks of CAGpathologies. Despite intense effort, the overall structure of theseaggregates remains poorly understood. Here, we used sensitivetime-dependent fluorescent decay measurements to assess thearchitecture of mature fibrils of huntingtin (Htt) exon 1 impli-cated in HD pathology. Varying the position of the fluorescentlabels in the Htt monomer with expanded 51Q (Htt51Q) andusing structural models of putative fibril structures, we gener-ated distance distributions between donors and acceptors cov-ering all possible distances between the monomers or monomerdimensions within the polyQ amyloid fibril. Using Monte Carlosimulations, we systematically scanned all possible monomerconformations that fit the experimentally measured decaytimes. Monomers with four-stranded 51Q stretches organizedinto five-layered �-sheets with alternating N termini of themonomers perpendicular to the fibril axis gave the best fit to ourdata. Alternatively, the core structure of the polyQ fibrils mightalso be a zipper layer with antiparallel four-stranded stretches asthis structure showed the next best fit. All other remainingarrangements are clearly excluded by the data. Furthermore, theassessed dimensions of the polyQ stretch of each monomer pro-vide structural evidence for the observed polyQ length thresh-old in HD pathology. Our approach can be used to validate theeffect of pharmacological substances that inhibit or alter amy-loid growth and structure.
Ten dominantly inherited neurodegenerative polyglutaminepathologies, including Huntington disease (HD),3 are linked toan expansion of the CAG repeat encoding a polyglutaminestretch (polyQ) in the disease protein, with a strong repeatlength dependence of disease risk and age of onset (1). LargepolyQ-rich inclusions are detected in patient brains, and celland animal models suggest the involvement of polyQ aggrega-tion in disease pathology (2). This is reinforced by the correla-tion between polyQ repeat length dependence and aggregationpropensity (3). Aggregation is a multistep process (2), and thetoxicity has been assigned to various intermediate aggregates(4 – 6). Mature end aggregates are considered rather benign,although when directed to the cell nucleus, they also exert astrong toxic effect (7). Pharmacological intervention aiming toinhibit aggregate formation has been shown to be beneficial invivo (8). Thus, to develop drug design-based strategies to alteraggregation pathway and alleviate toxicity, knowledge of thestructure and aggregate architecture is crucial. However,despite these efforts, the overall structure of various aggregatesremains poorly understood.
Aggregates isolated post-mortem from HD patients or cellculture models, or grown in vitro, are �-sheet-enriched andshare the typical cross-� diffraction pattern (9, 10). The cross-�pattern is a common feature of several amyloid aggregates (11);however, the core structure of aggregates of various diseasesproteins differs significantly (12, 13). Although the �-sheet sig-nature of the fibrils is indisputable, as evidenced by Fouriertransform infrared spectroscopy, circular dichroism spectros-copy, and x-ray fiber diffraction (9, 10), evidence for the fibrilarchitecture is rather contradictive. Various structures havebeen proposed, ranging from water-filled nanotube (9) andsteric zipper arrangement with dry fibril core (14) to �-pseudo-helix (15). Even the interpretations of the same x-ray fiber dif-
1 To whom correspondence may be addressed: Institute of Biochemistry andBiology, University of Potsdam, Karl-Liebknecht-Str. 24-25, 14467 Pots-dam, Germany. Tel.: 49-331-977-5302; Fax: 49-331-977-5128; E-mail:[email protected].
2 To whom correspondence may be addressed: Institute of Biochemistry andBiology, University of Potsdam, Karl-Liebknecht-Str. 24-25, 14467 Pots-dam, Germany. Tel.: 49-331-977-5130; Fax: 49-331-977-5128; E-mail:[email protected].
3 The abbreviations used are: HD, Huntington disease; poylQ, polyglutamine;polyP, polyproline; Htt51Q, Huntingtin exon I with 51 glutamines; HRV,human rhinovirus.
THE JOURNAL OF BIOLOGICAL CHEMISTRY VOL. 289, NO. 39, pp. 26817–26828, September 26, 2014© 2014 by The American Society for Biochemistry and Molecular Biology, Inc. Published in the U.S.A.
SEPTEMBER 26, 2014 • VOLUME 289 • NUMBER 39 JOURNAL OF BIOLOGICAL CHEMISTRY 26817
by guest on April 11, 2018
http://ww
w.jbc.org/
Dow
nloaded from
fraction diagrams are inconsistent; Perutz et al. (9) suggested awater-filled cylindrical �-sheet structure for the polyQ fibrils,whereas Sikorski and Atkins (16), reanalyzing the diffractionpattern, concluded that �-sheets elongated in fibril growthdirection and stacked on top of each other. Site-directed spinlabeling and electron paramagnetic resonance spectroscopyshow a lack of stacking of many residues in a parallel, in-registerarrangement that is commonly found in other amyloids (17).Molecular dynamics simulations combined with dockingexperiments exclude some of the proposed monomer struc-tures, e.g. �-helices or steric zipper, �-nanotube, and �-pseudo-helix. NMR experiments, however, propose a steric zipper con-formation for mature fibrils, where the individual monomersare stabilized via side-chain interactions (14). In addition, aninnovative twist of two-dimensional Fourier transform infraredspectroscopy (18) and biochemical studies of �-sheet stabiliz-ing motifs (19) proposes �-sheet-based structure as the mostlikely structure of the polyQ fibrils, although these studies donot reveal details on the molecular organization of the mono-mers, e.g. �-turns per monomer, orientation of neighboringmonomers, and number of layers perpendicular to the fibrilaxis.
Here, we assess the architecture of polyQ fibrils using a dis-tance-dependent energy transfer combined with Monte Carlosimulations. Typically, HD progression is accompanied by theaggregation of mutant huntingtin (Htt) and its N-terminal frag-ments composed of exon 1 (20, 21). Thus, we used Htt exon 1with expanded polyQ length (here 51Q) to grow amyloid fibrilsin vitro. By selective fluorophore labeling (donor or acceptorprobes) of the polyQ monomers at various positions flankingthe polyQ region, we measured the time-dependent fluorescentdecay times of the donors. We developed a new algorithm forMonte Carlo simulations to capture time-resolved donor fluo-rescence decay and fit the experimental data to various modelsof fibril architecture. This approach allows for exact determi-nation of distances between the monomers in addition to mono-mer dimensions in the fibrils. Our data suggest that polyQmonomers are organized in a five-layered �-sheet. Further-more, each monomer consists of four strands with alternatingN termini perpendicular to the fibril axis. The minimal lengthof the stable three-stranded polyQ region is 36 amino acids,which corresponds to the observed polyQ length threshold inHD pathologies.
EXPERIMENTAL PROCEDURES
Protein Expression and Purification—Htt exon 1 constructswith polyQ lengths of 25 or 51 were cloned in the pGEX6Pvector and expressed in soluble form as GST fusions. All codonsencoding Cys in GST were mutated to Ser to create a Cys-lessGST fusion. Amino acids at positions 16, 69, or 111 in Htt exon1 (the numbering is according to the primary sequence ofHtt51Q) were mutated to Cys using a QuikChange protocol(Stratagene). All GST-tagged constructs were expressed in asoluble form in Escherichia coli BL21(DE3) in minimal mediumcontaining 100 mg/liter ampicillin, induced at optical density�0.4 for 4 h at 30 °C by adding 400 �M isopropyl-1-thio-�-D-galactopyranoside, and affinity-purified to homogeneity usingthe GST tag as described previously (22). Purified proteins were
flash-frozen in PBS (10 mM Na2HPO4, pH 7.3, 120 mM NaCl,10% (v/v) glycerol, 1 mM EDTA, and 1 mM DTT).
Labeling and Aggregation—For fluorescent decay time mea-surements, 15 �M GST protein in PBS without glycerol wasmixed with tris(2-carboxyethyl)phosphine and a 10-fold excessof the corresponding fluorescent dye, Alexa Fluor 488 maleim-ide or Alexa Fluor 594 maleimide. Samples were incubated for5 h at 4 °C with slow vortexing at 80 rpm. Excess dye wasremoved with Bio-Spin P6 columns (Bio-Rad), and labeled pro-tein was concentrated and washed in Amicon Ultra centrifugalfilter devices (Millipore) with a cut-off size of 10 kDa until theratio of dye and protein absorption remained constant. Label-ing efficiency was calculated using the extinction coefficients ofthe protein and dyes at 280, 495, and 590 nm. Note that duringthe labeling and processing time, each construct remained sol-uble because of the GST tag.
Alexa Fluor 488-labeled (donor-labeled) and Alexa Fluor594-labeled (acceptor-labeled) GST-tagged proteins weremixed in different ratios (from 20%:1.5% to 20%:20%), and thefinal concentration of each sample was adjusted to 4 �M withunlabeled protein. One unit of HRV protease (Mobitec) wasadded to each 100-�l reaction to remove the GST tag andinduce aggregation. Aggregation proceeded to completion for48 h at 30 °C with gentle agitation at 300 rpm. The labeledaggregates were collected by centrifugation at 21,000 � g for 30min and washed several times with 1 ml of PBS to remove thesoluble GST counterpart and non-aggregated Htt exon 1.
Fluorescent Decay Time Measurements—Fluorescent decaytimes were recorded on an FL920 spectrometer (EdinburghInstruments) operated in a time-correlated single photoncounting mode. A time window of 50 ns and 1024 channelswere used in the measurements. Samples were excited at �ex �450 nm using a SC-400-PP supercontinuum source (Fianum),and the emission was collected at �em � 525 nm using a polar-izer set at magic angle position and a multichannel plate (Euro-photon) as a detector. The repetition rate of the excitation lightsource was set to 10 MHz. The measurements were stoppedupon 10,000 counts collected in the most prominent channel.
Quantum Yield and Forster Radius Determinations—TheForster radius R0 was calculated according to
R0 � 6�9 � In(10) � �2 � �D � J���
128 � 5 � NA � n4 (Eq. 1)
where �2 accounts for the relative orientation between donorfluorescence and acceptor absorption transition dipolemoments, �D is the fluorescence quantum yield of the donor,J(�) is the overlap integral of the donor emission and acceptorabsorption spectra, NA is the Avogadro constant, and n is therefractive index of the solution. Using a photoluminescencequantum yield measurement system (C9920, Hamamatsu Pho-tonics), the quantum yield �D for the Alexa Fluor 488-labeledHtt exon 1 monomer was determined to be 0.6.
The emission spectra of Alexa Fluor 488-labeled Htt exon 1monomer and the excitation spectra of Alexa Fluor 594-labeledHtt exon 1 monomer were recorded on a QuantaMaster 40(Photon Technology International), and Felix32 software wasused to determine the Forster radius for the labeled monomer
Structure of Polyglutamine Amyloid Fibrils
26818 JOURNAL OF BIOLOGICAL CHEMISTRY VOLUME 289 • NUMBER 39 • SEPTEMBER 26, 2014
by guest on April 11, 2018
http://ww
w.jbc.org/
Dow
nloaded from
donor/acceptor pair. The relative orientation of the dye wasassumed to be random and its movements much faster than thefluorescent decay times (�2 � 2/3). The refractive index of aninfinitely diluted aqueous solution (n � 1.33) was used. TheForster radius R0 was calculated to be 54 Å, which is in a goodagreement with a previously determined Forster radius for theidentical dye FRET pair in slightly different solvent conditions(23). The fluorescent decay time for the Alexa Fluor 488-labeled Htt exon I was determined using an algorithm writtenin our laboratory. The algorithm minimized the sum of thesquared differences between the measured data and the theo-retical fluorescent decay time function convoluted with theinstrument response function. The fluorescent decay time was randomly varied by up to 10% in either direction in 100,000iterations, and each result was accepted as a change in fluores-cent decay time if it led to an improvement in the sum ofsquared differences. The resulting value was identical inde-pendent of what starting value was used, 0.01 ns or 100 ns.
The fluorescent decay time of the monomer (M) is the recip-rocal sum of the rate constants ki of all possible processes lead-ing to deactivation of excited dye.
M �1
�ikiM
(Eq. 2)
The quantum yield of the donor-labeled monomer �M can beexpressed as the ratio of the fluorescence decay rate constantkFl,M to the sum of all deactivation rate constants.
�M �kFlM�ikiM
(Eq. 3)
The rate constant of fluorescence of donor-labeled monomerscan therefore be calculated using,
kFlM ��M
M(Eq. 4)
Anisotropy measurements suggest little alteration of the sol-vent conditions, hence the difference between kFl,F and kFl,Mshould be close to zero.
�F � kFlF � F (Eq. 5)
where �F is the quantum yield, and kFl,F and F are the fluores-cence rate constant and the fluorescence decay time of donor-labeled monomers in the fibril, respectively.
The quantum yield of the system can be corrected forincreased quenching in fibrils by considering the change in thesum of all decay rates in Equation 3. Because the Forster radius,R0, is dependent on the quantum yield, it was also adjusted forthe labeled fibrils according to the donor fluorescent decaytimes in the fibrils for all different labeling positions.
Simulations of the Fluorescent Decay Times—The code forpredicting the output of the fluorescence decay time experi-ments was written in Fortran90. The input files contain thedimension of the simulated space, its periodicity, the number ofdonors and acceptors, and their expected coordinates for eachstudied structure. The fibrils used in the simulations consisted
of 7500 monomers, which were randomly assigned with donorsand acceptors to represent the experimental constellation. Thefibrils were periodic in their growth direction to avoid stochas-tically insignificant situations at the rare fibril ends.
Each donor was excited randomly with the probability
Pexcitation �I � �t � A
�Ep � ND�� �1 � 10
�D � l � ND
V � (Eq. 6)
where I is the irradiance, �t is the time interval over which theexcitation takes place, A is the surface area of light irradiation,�D is the extinction coefficient of the donor, l is the length ofthe excited volume in direction of the excitation beam, ND is thenumber of donors in the observed volume V, and EP is theenergy of a photon with the excitation wavelength of 450 nm.To obtain sufficient signal, the low excitation probability wasenhanced artificially to increase the speed of the simulationswhile ensuring that signals even from samples with the highestquenching rates were not altered by this adjustment. On aver-age, 1 in 250 donors was excited in our simulations.
Because the distance of the dye to the �-carbon of the first orlast glutamine can easily be 2 nm, in the experimental setup forsimulation purposes, all dye positions were changed by thatdistance in a random direction for all the excited donors andnearby acceptors in a given excitation cycle. During the simu-lated 50 ns, the dye positions were assumed to remain constant.All distances to the acceptors within the relevant distance(2R0 4 nm) were calculated for each excited donor.
Subsequently, the FRET rates kT to all acceptors available totake up energy were added to the total sum of deactivation rates
kT �1
F� �R0
r �6
(Eq. 7)
where F is the fluorescent decay time of the donor-labeledmonomer within the fibril without any acceptor present and r isthe distance to a given acceptor. As in the experiments, the50-ns time frame was divided in 1024 equal intervals �t. Theprobability of the donor being still excited after a given timeinterval was calculated, and a random number generator wasused to deactivate the donor. The donor was therefore stillexcited with a probability.
P�Dexcitation� ��t0
t0 �t
e�iki � t � dt (Eq. 8)
If the donor was deactivated, the ratios of the rate constantswere used to assign the probabilities to the deactivation mech-anisms. If a photon was emitted, it was added to the total pho-ton number at this time interval.
The possible bias due to restricted orientations of the excit-able dyes and therefore time-dependent efficiencies of photondetection was found to be negligible by testing dye mobility inanisotropy measurements of fibrils labeled with donor only (seeFig. 2C). Subsequently, the acceptors excited in previous timesteps, due to occurring transfers, were quenched according totheir measured fluorescent decay times in the fibrils.
Structure of Polyglutamine Amyloid Fibrils
SEPTEMBER 26, 2014 • VOLUME 289 • NUMBER 39 JOURNAL OF BIOLOGICAL CHEMISTRY 26819
by guest on April 11, 2018
http://ww
w.jbc.org/
Dow
nloaded from
P�Aexcitation� ��t0
t0�t
et
Acceptor,F � dt (Eq. 9)
If an acceptor is excited (or deactivated), it is removed from (oradded again to) the list of available acceptors for each exciteddonor in its proximity. All 1024 time intervals were simulatedfor each still excited donor or until no excited donor was left,after which the simulation was reset and a new subset of donorswas randomly excited. 10,000 photons were collected in at leastone of the 1024 time intervals.
Analysis of the Fluorescent Decay Times—For comparisonwith the simulated data sets, the experimental data were con-voluted with the corresponding instrument response function,and the fit was judged by two methods: (i) the absolute differ-ences between the expected and measured amount of countsand (ii) the sum of the squares of the differences. To categorizedifferent simulated structures, the simulations were separatelyand collectively judged with tests i and ii. Each test result wasthen judged in relation to the mean of all 0% acceptor sampleswithin each set of labeling positions. The fibrils with 0% accep-tor serve as a perfect standard to extract the distance betweenthe experimental and simulated values because no errors canoccur by wrongly predicted donor-acceptor distances or inter-actions. For test i, divergences from the 0% acceptor sample upto 5% were designated as good, up to 25% as acceptable fits andmore than 25% as unacceptable fits. For test ii, those borderswere 35 and 80%, respectively.
Electron Microscopy—Samples for electron microscopy werewashed with pure water instead of PBS to avoid visual artifacts.Aggregates were loaded on freshly glow-discharged holey car-bon grids (Quantifoil Micro Tools GmbH, Jena, Germany), cov-ered with an additional self-made thin layer of continuous car-bon, washed with deionized water, and negatively stained using2% (w/v) uranyl acetate. Samples were imaged using either a100-kV Philips CM100 transmission electron microscopeequipped with a 1k F114 Fastscan camera (Tietz Video andImage Processing Systems) or a 120-kV Tecnai G2 Spirit micro-scope equipped with a 2k Eagle CCD camera (FEI) at a nominalmagnification between 20,000� and 42,000�. For cryo-elec-tron microscopy, samples were plunge-frozen in liquid ethaneusing a semi-automated Vitrobot plunger (FEI) and imagedusing low dose conditions.
RESULTS
Choice of Positions to Introduce the Fluorophores and in VitroAggregation of Htt Exon 1 Mutants—To assess the structure ofnative polyglutamine fibrils of Htt exon 1, the position of themutation within the target sequence and fluorophore labelingshould have minimal to no perturbation of Htt exon 1 aggrega-tion behavior or fibril structure. PolyQ stretches (Fig. 1A) areinvariant among the polyQ-containing proteins and are com-posed solely of consecutive glutamine repeats (1). A mutationwithin the polyQ stretch alters the length of the hairpinsbetween the polyQ stretches (24, 25). Two consecutive poly-proline (polyP) regions downstream of the polyQ stretch (Fig.1A) influence the aggregation propensity of the polyQ stretchand stability of the polyQ fibrils (26). Thus, non-perturbing
mutation is only possible at positions flanking the polyPstretches. Furthermore, the 17-amino acid-long N terminus ofHtt exon (Fig. 1A) is crucial for the initial aggregation steps (27,28); residues 4 –12 have strong propensity to form �-helicesand are involved in the formation of initial globular oligomers,and mutations within this region alter the aggregation pathway(27). The unprecedented complexity of how the HttQ primarysequence controls the aggregation behavior restricts the posi-tions available for introducing cysteines and attaching dyes.Because we aimed at elucidating the conformation of the polyQstretches within the mature amyloid fibrils, we have chosen twopositions flanking this stretch, S16C upstream and P69C down-stream of the polyQ region (Fig. 1A). Mutants were numberedaccording to the primary sequence of Htt exon 1 with a patho-logical polyQ length (Htt51Q). Furthermore, we introduced anadditional mutation downstream of the polyP region (A111C)(Fig. 1A). This residue is far from the polyQ core, and whenmixed with any other position of labeling flanking the polyQstretch, it introduces longer distances into the system.
Htt51Q and its point mutants are highly aggregation-prone;hence to express them in soluble form, they all were fused toCys-less GST (Fig. 1A). An HRV protease cleavage site betweenthe Cys-less GST and Htt51Q protein serves to release intactHtt exon 1 and initiate the aggregation reaction. The aggrega-tion kinetics followed by static light scattering suggested thatthe Cys mutations did not significantly change the kinetics offibril formation as compared with the Htt51Q (Fig. 1B). Onlythe S16C mutant exhibited slightly faster aggregation kinetics,likely due to the position of the mutation; Ser-16 resides in closeproximity to the key intrinsic �-helical modulator sequence ofHtt aggregation (27, 28).
A requirement for our measurements was a completedaggregation process to mature fibrils. The aggregation wascompleted after approximately 2 h for unlabeled and labeledmutants (Fig. 1B). Electron microscopy time series confirmedthat the aggregation is also completed after �3 h with no fur-ther apparent growth of the fibrils (Fig. 1D). Notably, almost nosingle fibrils were detected, but rather large fibril bundles,which, if stably attached to each other, may interfere with thefluorescent decay time measurements and introduce FRETevents originating from interfibrillar FRET pairs. Next, weapplied cryo-electron microscopy to image the fibrils undermore physiological conditions. Less compact bundles wereobserved in vitrified ice, indicating that the individual fibrilswere not strongly attached to each other (Fig. 1C). The fibrils innegative stain tend to cluster due to drying on the grid or othertypical negative stain artifacts.
Structural Insights into PolyQ Fibrils with Time-resolvedFluorescence Decay Measurements—To gain insight into thestructure of Htt51Q fibrils, we measured the kinetics of donorfluorescence decay in fibrils composed of different ratios ofdonor- and acceptor-labeled monomers. The monomer label-ing position was also varied in different combinations; donor-labeled P16C, P69C, or A111C was mixed in every possiblecombination with acceptor-labeled P16C, P69C, or A111C. Inall fluorescence decay measurements and simulations, the frac-tion of donor-labeled monomers was held constant at 20%,while the amount of acceptor-labeled monomers was varied
Structure of Polyglutamine Amyloid Fibrils
26820 JOURNAL OF BIOLOGICAL CHEMISTRY VOLUME 289 • NUMBER 39 • SEPTEMBER 26, 2014
by guest on April 11, 2018
http://ww
w.jbc.org/
Dow
nloaded from
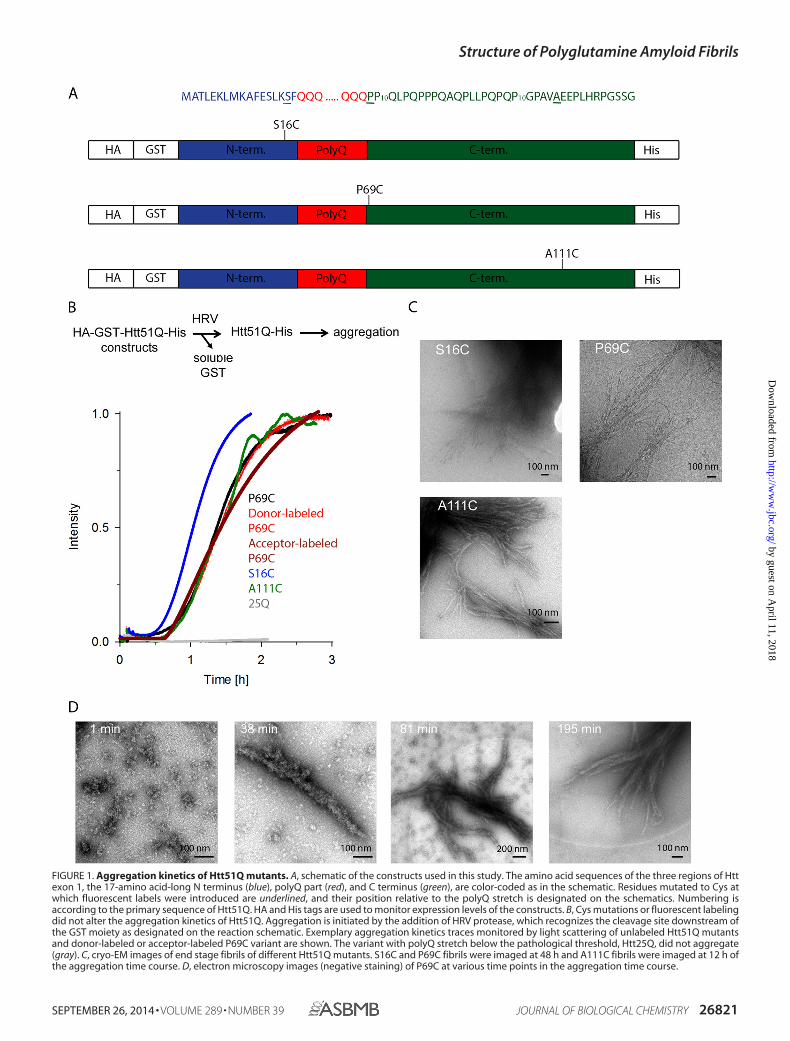
FIGURE 1. Aggregation kinetics of Htt51Q mutants. A, schematic of the constructs used in this study. The amino acid sequences of the three regions of Httexon 1, the 17-amino acid-long N terminus (blue), polyQ part (red), and C terminus (green), are color-coded as in the schematic. Residues mutated to Cys atwhich fluorescent labels were introduced are underlined, and their position relative to the polyQ stretch is designated on the schematics. Numbering isaccording to the primary sequence of Htt51Q. HA and His tags are used to monitor expression levels of the constructs. B, Cys mutations or fluorescent labelingdid not alter the aggregation kinetics of Htt51Q. Aggregation is initiated by the addition of HRV protease, which recognizes the cleavage site downstream ofthe GST moiety as designated on the reaction schematic. Exemplary aggregation kinetics traces monitored by light scattering of unlabeled Htt51Q mutantsand donor-labeled or acceptor-labeled P69C variant are shown. The variant with polyQ stretch below the pathological threshold, Htt25Q, did not aggregate(gray). C, cryo-EM images of end stage fibrils of different Htt51Q mutants. S16C and P69C fibrils were imaged at 48 h and A111C fibrils were imaged at 12 h ofthe aggregation time course. D, electron microscopy images (negative staining) of P69C at various time points in the aggregation time course.
Structure of Polyglutamine Amyloid Fibrils
SEPTEMBER 26, 2014 • VOLUME 289 • NUMBER 39 JOURNAL OF BIOLOGICAL CHEMISTRY 26821
by guest on April 11, 2018
http://ww
w.jbc.org/
Dow
nloaded from
between 1.5 and 20%. Each construct was freshly labeled with afluorophore as a GST-Htt51Q. Note that the Htt51Q remainedsoluble only as GST fusion during the labeling procedure.Thereafter the aggregation was initiated by adding HRV pro-tease and allowed for completeness for 48 h. The solubleGST and traces of non-aggregated labeled Htt51Q mono-mers were removed by several washing steps of the maturefibrils. Thus, the signal in the time-resolved fluorescencedecay measurements is solely from labeled aggregates.
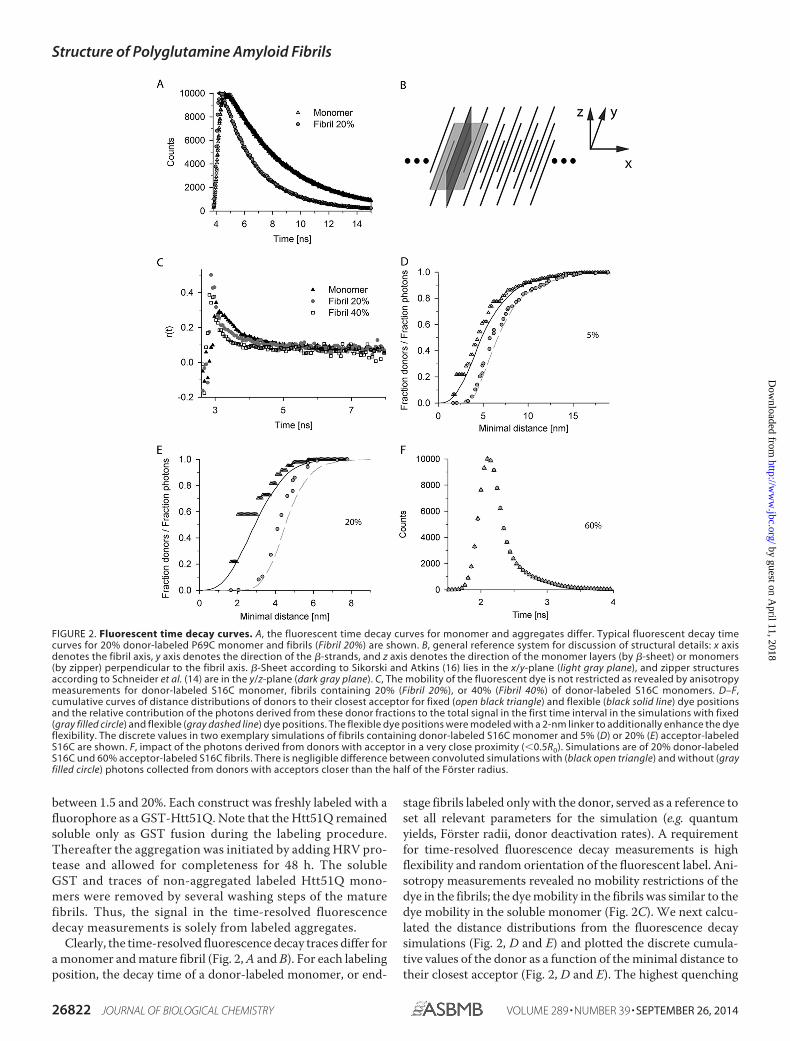
Clearly, the time-resolved fluorescence decay traces differ fora monomer and mature fibril (Fig. 2, A and B). For each labelingposition, the decay time of a donor-labeled monomer, or end-
stage fibrils labeled only with the donor, served as a reference toset all relevant parameters for the simulation (e.g. quantumyields, Forster radii, donor deactivation rates). A requirementfor time-resolved fluorescence decay measurements is highflexibility and random orientation of the fluorescent label. Ani-sotropy measurements revealed no mobility restrictions of thedye in the fibrils; the dye mobility in the fibrils was similar to thedye mobility in the soluble monomer (Fig. 2C). We next calcu-lated the distance distributions from the fluorescence decaysimulations (Fig. 2, D and E) and plotted the discrete cumula-tive values of the donor as a function of the minimal distance totheir closest acceptor (Fig. 2, D and E). The highest quenching
FIGURE 2. Fluorescent time decay curves. A, the fluorescent time decay curves for monomer and aggregates differ. Typical fluorescent decay timecurves for 20% donor-labeled P69C monomer and fibrils (Fibril 20%) are shown. B, general reference system for discussion of structural details: x axisdenotes the fibril axis, y axis denotes the direction of the �-strands, and z axis denotes the direction of the monomer layers (by �-sheet) or monomers(by zipper) perpendicular to the fibril axis. �-Sheet according to Sikorski and Atkins (16) lies in the x/y-plane (light gray plane), and zipper structuresaccording to Schneider et al. (14) are in the y/z-plane (dark gray plane). C, The mobility of the fluorescent dye is not restricted as revealed by anisotropymeasurements for donor-labeled S16C monomer, fibrils containing 20% (Fibril 20%), or 40% (Fibril 40%) of donor-labeled S16C monomers. D–F,cumulative curves of distance distributions of donors to their closest acceptor for fixed (open black triangle) and flexible (black solid line) dye positionsand the relative contribution of the photons derived from these donor fractions to the total signal in the first time interval in the simulations with fixed(gray filled circle) and flexible (gray dashed line) dye positions. The flexible dye positions were modeled with a 2-nm linker to additionally enhance the dyeflexibility. The discrete values in two exemplary simulations of fibrils containing donor-labeled S16C monomer and 5% (D) or 20% (E) acceptor-labeledS16C are shown. F, impact of the photons derived from donors with acceptor in a very close proximity (�0.5R0). Simulations are of 20% donor-labeledS16C und 60% acceptor-labeled S16C fibrils. There is negligible difference between convoluted simulations with (black open triangle) and without (grayfilled circle) photons collected from donors with acceptors closer than the half of the Forster radius.
Structure of Polyglutamine Amyloid Fibrils
26822 JOURNAL OF BIOLOGICAL CHEMISTRY VOLUME 289 • NUMBER 39 • SEPTEMBER 26, 2014
by guest on April 11, 2018
http://ww
w.jbc.org/
Dow
nloaded from
effect came from the closest acceptors, i.e. the fraction of pho-tons and therefore the influence on the signal is the lowest fordonors with close acceptors (Fig. 2, D and E). For higher accep-tor amounts (compare Fig. 2E for 20% with Fig. 2D for 5%acceptor-labeled S16C fibrils), high frequencies of short rangedistances at which additional quantum mechanical effects, e.g.Dexter energy transfer, could be possible. However, the amountof photons collected by such donors was negligible even forhigher acceptor concentrations. Thus, further alteration oftheir fluorescent decay times would not result in any significantchange in the predicted photon distribution (Fig. 2F). Further-more, although anisotropy measurements indicate a smalldegree of homo-FRET (29) (Fig. 2C), the distance ranges forsuch transfer (Fig. 2, D and E) indicate no significant alterationof the excited donor positions.
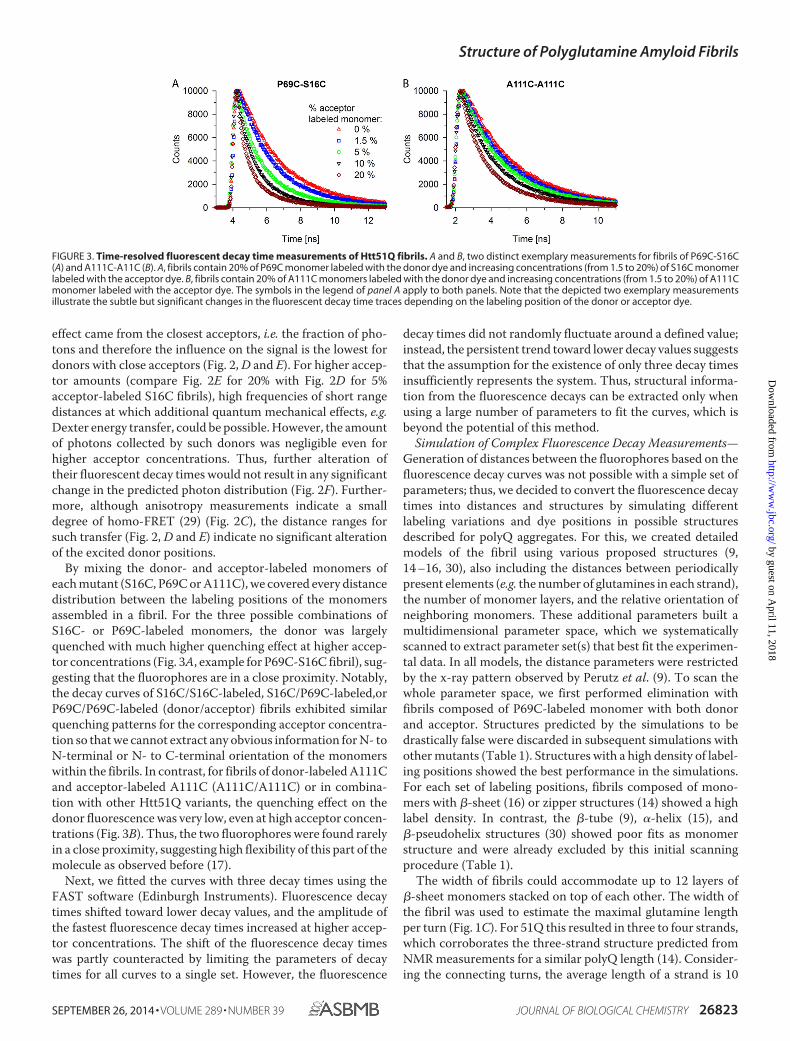
By mixing the donor- and acceptor-labeled monomers ofeach mutant (S16C, P69C or A111C), we covered every distancedistribution between the labeling positions of the monomersassembled in a fibril. For the three possible combinations ofS16C- or P69C-labeled monomers, the donor was largelyquenched with much higher quenching effect at higher accep-tor concentrations (Fig. 3A, example for P69C-S16C fibril), sug-gesting that the fluorophores are in a close proximity. Notably,the decay curves of S16C/S16C-labeled, S16C/P69C-labeled,orP69C/P69C-labeled (donor/acceptor) fibrils exhibited similarquenching patterns for the corresponding acceptor concentra-tion so that we cannot extract any obvious information for N- toN-terminal or N- to C-terminal orientation of the monomerswithin the fibrils. In contrast, for fibrils of donor-labeled A111Cand acceptor-labeled A111C (A111C/A111C) or in combina-tion with other Htt51Q variants, the quenching effect on thedonor fluorescence was very low, even at high acceptor concen-trations (Fig. 3B). Thus, the two fluorophores were found rarelyin a close proximity, suggesting high flexibility of this part of themolecule as observed before (17).
Next, we fitted the curves with three decay times using theFAST software (Edinburgh Instruments). Fluorescence decaytimes shifted toward lower decay values, and the amplitude ofthe fastest fluorescence decay times increased at higher accep-tor concentrations. The shift of the fluorescence decay timeswas partly counteracted by limiting the parameters of decaytimes for all curves to a single set. However, the fluorescence
decay times did not randomly fluctuate around a defined value;instead, the persistent trend toward lower decay values suggeststhat the assumption for the existence of only three decay timesinsufficiently represents the system. Thus, structural informa-tion from the fluorescence decays can be extracted only whenusing a large number of parameters to fit the curves, which isbeyond the potential of this method.
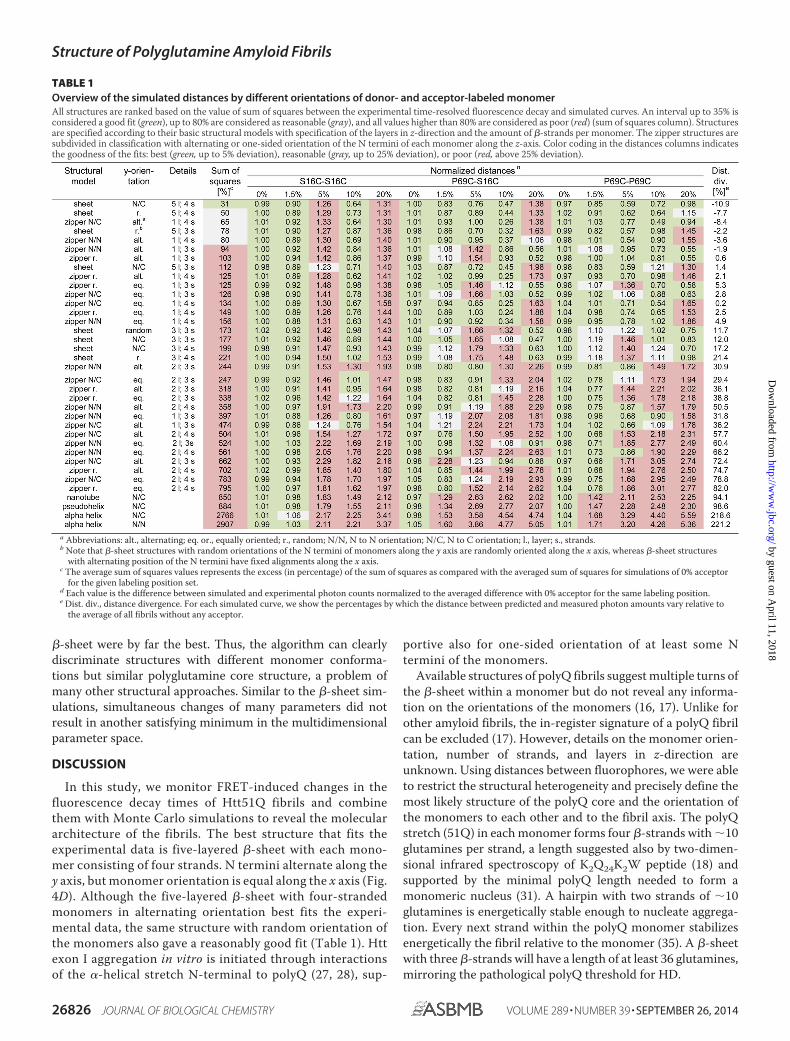
Simulation of Complex Fluorescence Decay Measurements—Generation of distances between the fluorophores based on thefluorescence decay curves was not possible with a simple set ofparameters; thus, we decided to convert the fluorescence decaytimes into distances and structures by simulating differentlabeling variations and dye positions in possible structuresdescribed for polyQ aggregates. For this, we created detailedmodels of the fibril using various proposed structures (9,14 –16, 30), also including the distances between periodicallypresent elements (e.g. the number of glutamines in each strand),the number of monomer layers, and the relative orientation ofneighboring monomers. These additional parameters built amultidimensional parameter space, which we systematicallyscanned to extract parameter set(s) that best fit the experimen-tal data. In all models, the distance parameters were restrictedby the x-ray pattern observed by Perutz et al. (9). To scan thewhole parameter space, we first performed elimination withfibrils composed of P69C-labeled monomer with both donorand acceptor. Structures predicted by the simulations to bedrastically false were discarded in subsequent simulations withother mutants (Table 1). Structures with a high density of label-ing positions showed the best performance in the simulations.For each set of labeling positions, fibrils composed of mono-mers with �-sheet (16) or zipper structures (14) showed a highlabel density. In contrast, the �-tube (9), �-helix (15), and�-pseudohelix structures (30) showed poor fits as monomerstructure and were already excluded by this initial scanningprocedure (Table 1).
The width of fibrils could accommodate up to 12 layers of�-sheet monomers stacked on top of each other. The width ofthe fibril was used to estimate the maximal glutamine lengthper turn (Fig. 1C). For 51Q this resulted in three to four strands,which corroborates the three-strand structure predicted fromNMR measurements for a similar polyQ length (14). Consider-ing the connecting turns, the average length of a strand is 10
FIGURE 3. Time-resolved fluorescent decay time measurements of Htt51Q fibrils. A and B, two distinct exemplary measurements for fibrils of P69C-S16C(A) and A111C-A11C (B). A, fibrils contain 20% of P69C monomer labeled with the donor dye and increasing concentrations (from 1.5 to 20%) of S16C monomerlabeled with the acceptor dye. B, fibrils contain 20% of A111C monomers labeled with the donor dye and increasing concentrations (from 1.5 to 20%) of A111Cmonomer labeled with the acceptor dye. The symbols in the legend of panel A apply to both panels. Note that the depicted two exemplary measurementsillustrate the subtle but significant changes in the fluorescent decay time traces depending on the labeling position of the donor or acceptor dye.
Structure of Polyglutamine Amyloid Fibrils
SEPTEMBER 26, 2014 • VOLUME 289 • NUMBER 39 JOURNAL OF BIOLOGICAL CHEMISTRY 26823
by guest on April 11, 2018
http://ww
w.jbc.org/
Dow
nloaded from
glutamines, which corresponds to the minimal hairpin lengthof a monomeric nucleus that initiates polyQ aggregation (31).For the detailed simulations, in the case of �-sheet structure,the number of layers was restricted between three and five,suggested also as most reasonable by the initial simulations.Considering the initial steps of Htt exon 1 aggregation (27, 28),a continued assembly of N termini connecting two polyQ layersseemed very plausible. Thus, two layers of zippers on top ofeach other were considered for the zipper structure (Table 1).
The last parameter to simulate was the relative orientationof adjacent monomers. Although the options for the zipperstructure were limited, the sheet structures allow many pos-sible variations in the orientation of the neighboring mono-mer. We randomly simulated two orientations, althoughapplying consistent rules for the neighboring monomers inx- and z-directions. In one set, the direction of the N terminiof the monomers alternated at opposite sites across the fibrilaxis (Fig. 4 and Table 1). In the other set, the monomers hadcompletely random orientation in x- and y-directions (Table1). The possibility that two layers do not completely overlapbut are rather shifted along the x axis was not considered. Itshould be noted that the orientation of the N termini of themonomer to its neighbor had only marginal influence on theoutcome of the simulation.
Fibrils with Five-layered �-Sheet of Four-stranded MonomersFit the Fluorescence Decay Curves the Best—The initial simu-lations revealed two candidate structures, �-sheet and zip-
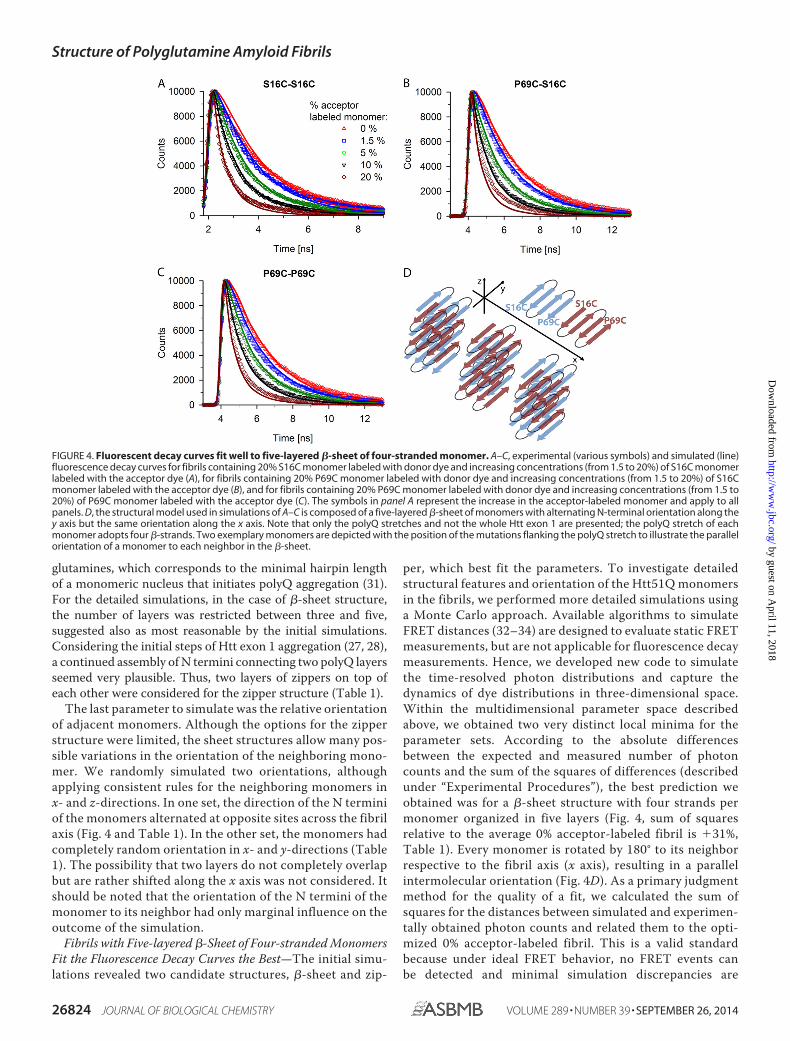
per, which best fit the parameters. To investigate detailedstructural features and orientation of the Htt51Q monomersin the fibrils, we performed more detailed simulations usinga Monte Carlo approach. Available algorithms to simulateFRET distances (32–34) are designed to evaluate static FRETmeasurements, but are not applicable for fluorescence decaymeasurements. Hence, we developed new code to simulatethe time-resolved photon distributions and capture thedynamics of dye distributions in three-dimensional space.Within the multidimensional parameter space describedabove, we obtained two very distinct local minima for theparameter sets. According to the absolute differencesbetween the expected and measured number of photoncounts and the sum of the squares of differences (describedunder “Experimental Procedures”), the best prediction weobtained was for a �-sheet structure with four strands permonomer organized in five layers (Fig. 4, sum of squaresrelative to the average 0% acceptor-labeled fibril is 31%,Table 1). Every monomer is rotated by 180° to its neighborrespective to the fibril axis (x axis), resulting in a parallelintermolecular orientation (Fig. 4D). As a primary judgmentmethod for the quality of a fit, we calculated the sum ofsquares for the distances between simulated and experimen-tally obtained photon counts and related them to the opti-mized 0% acceptor-labeled fibril. This is a valid standardbecause under ideal FRET behavior, no FRET events canbe detected and minimal simulation discrepancies are
FIGURE 4. Fluorescent decay curves fit well to five-layered �-sheet of four-stranded monomer. A–C, experimental (various symbols) and simulated (line)fluorescence decay curves for fibrils containing 20% S16C monomer labeled with donor dye and increasing concentrations (from 1.5 to 20%) of S16C monomerlabeled with the acceptor dye (A), for fibrils containing 20% P69C monomer labeled with donor dye and increasing concentrations (from 1.5 to 20%) of S16Cmonomer labeled with the acceptor dye (B), and for fibrils containing 20% P69C monomer labeled with donor dye and increasing concentrations (from 1.5 to20%) of P69C monomer labeled with the acceptor dye (C). The symbols in panel A represent the increase in the acceptor-labeled monomer and apply to allpanels. D, the structural model used in simulations of A–C is composed of a five-layered �-sheet of monomers with alternating N-terminal orientation along they axis but the same orientation along the x axis. Note that only the polyQ stretches and not the whole Htt exon 1 are presented; the polyQ stretch of eachmonomer adopts four �-strands. Two exemplary monomers are depicted with the position of the mutations flanking the polyQ stretch to illustrate the parallelorientation of a monomer to each neighbor in the �-sheet.
Structure of Polyglutamine Amyloid Fibrils
26824 JOURNAL OF BIOLOGICAL CHEMISTRY VOLUME 289 • NUMBER 39 • SEPTEMBER 26, 2014
by guest on April 11, 2018
http://ww
w.jbc.org/
Dow
nloaded from
expected. For the �-sheet structure, only the fluorescentdecay time of fibrils made of 20% donor-labeled P69C and20% acceptor-labeled S16C showed slight deviation from theprediction for this set (Fig. 4B). However, if the parameterdescribing the orientation of the monomer to each nextneighbor was changed to a random orientation, the simula-tion fits similarly well the fluorescence decay curves (Table1, relative sum of squares is 50%). Reduction of the numberof strands from four to three within a monomer reduces thedistances between the fluorophores of two consecutivemonomers and the average donor-acceptor distance. Conse-quently, higher quenching rates were simulated that ren-dered the predictions suboptimal (Table 1, relative sum ofsquares is 112%). Furthermore, altering the number of the�-sheet layers along the z axis led to a more severe loss ofquality in the predicted fluorescent decays (Table 1, relativesum of squares is 199%). Simultaneous changes of severalparameters, such as orientation of the monomers or layeringof �-sheets along z axis, did not result in good fits either(Table 1). By chance, a single fluorescent decay fit might bepredicted well when changing more than one parameter, butfor the 12 tested FRET systems, we did not observe any con-sistently good behavior.
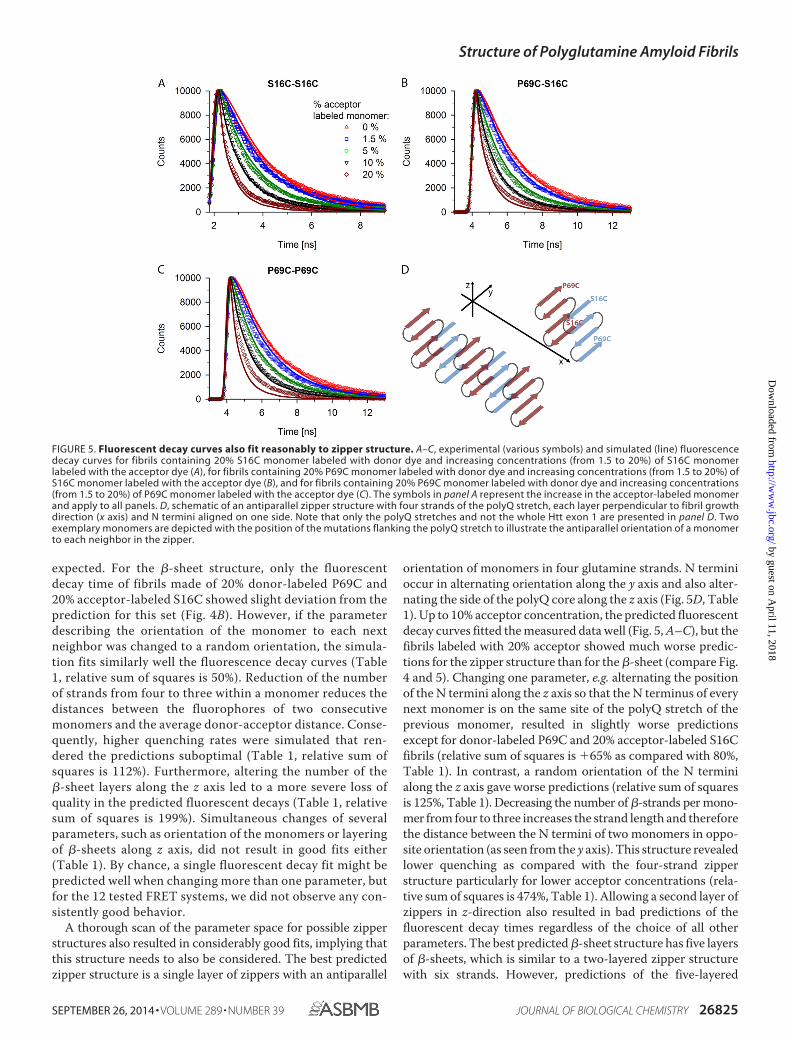
A thorough scan of the parameter space for possible zipperstructures also resulted in considerably good fits, implying thatthis structure needs to also be considered. The best predictedzipper structure is a single layer of zippers with an antiparallel
orientation of monomers in four glutamine strands. N terminioccur in alternating orientation along the y axis and also alter-nating the side of the polyQ core along the z axis (Fig. 5D, Table1). Up to 10% acceptor concentration, the predicted fluorescentdecay curves fitted the measured data well (Fig. 5, A–C), but thefibrils labeled with 20% acceptor showed much worse predic-tions for the zipper structure than for the �-sheet (compare Fig.4 and 5). Changing one parameter, e.g. alternating the positionof the N termini along the z axis so that the N terminus of everynext monomer is on the same site of the polyQ stretch of theprevious monomer, resulted in slightly worse predictionsexcept for donor-labeled P69C and 20% acceptor-labeled S16Cfibrils (relative sum of squares is 65% as compared with 80%,Table 1). In contrast, a random orientation of the N terminialong the z axis gave worse predictions (relative sum of squaresis 125%, Table 1). Decreasing the number of �-strands per mono-mer from four to three increases the strand length and thereforethe distance between the N termini of two monomers in oppo-site orientation (as seen from the y axis). This structure revealedlower quenching as compared with the four-strand zipperstructure particularly for lower acceptor concentrations (rela-tive sum of squares is 474%, Table 1). Allowing a second layer ofzippers in z-direction also resulted in bad predictions of thefluorescent decay times regardless of the choice of all otherparameters. The best predicted �-sheet structure has five layersof �-sheets, which is similar to a two-layered zipper structurewith six strands. However, predictions of the five-layered
FIGURE 5. Fluorescent decay curves also fit reasonably to zipper structure. A–C, experimental (various symbols) and simulated (line) fluorescencedecay curves for fibrils containing 20% S16C monomer labeled with donor dye and increasing concentrations (from 1.5 to 20%) of S16C monomerlabeled with the acceptor dye (A), for fibrils containing 20% P69C monomer labeled with donor dye and increasing concentrations (from 1.5 to 20%) ofS16C monomer labeled with the acceptor dye (B), and for fibrils containing 20% P69C monomer labeled with donor dye and increasing concentrations(from 1.5 to 20%) of P69C monomer labeled with the acceptor dye (C). The symbols in panel A represent the increase in the acceptor-labeled monomerand apply to all panels. D, schematic of an antiparallel zipper structure with four strands of the polyQ stretch, each layer perpendicular to fibril growthdirection (x axis) and N termini aligned on one side. Note that only the polyQ stretches and not the whole Htt exon 1 are presented in panel D. Twoexemplary monomers are depicted with the position of the mutations flanking the polyQ stretch to illustrate the antiparallel orientation of a monomerto each neighbor in the zipper.
Structure of Polyglutamine Amyloid Fibrils
SEPTEMBER 26, 2014 • VOLUME 289 • NUMBER 39 JOURNAL OF BIOLOGICAL CHEMISTRY 26825
by guest on April 11, 2018
http://ww
w.jbc.org/
Dow
nloaded from
�-sheet were by far the best. Thus, the algorithm can clearlydiscriminate structures with different monomer conforma-tions but similar polyglutamine core structure, a problem ofmany other structural approaches. Similar to the �-sheet sim-ulations, simultaneous changes of many parameters did notresult in another satisfying minimum in the multidimensionalparameter space.
DISCUSSION
In this study, we monitor FRET-induced changes in thefluorescence decay times of Htt51Q fibrils and combinethem with Monte Carlo simulations to reveal the moleculararchitecture of the fibrils. The best structure that fits theexperimental data is five-layered �-sheet with each mono-mer consisting of four strands. N termini alternate along they axis, but monomer orientation is equal along the x axis (Fig.4D). Although the five-layered �-sheet with four-strandedmonomers in alternating orientation best fits the experi-mental data, the same structure with random orientation ofthe monomers also gave a reasonably good fit (Table 1). Httexon I aggregation in vitro is initiated through interactionsof the �-helical stretch N-terminal to polyQ (27, 28), sup-
portive also for one-sided orientation of at least some Ntermini of the monomers.
Available structures of polyQ fibrils suggest multiple turns ofthe �-sheet within a monomer but do not reveal any informa-tion on the orientations of the monomers (16, 17). Unlike forother amyloid fibrils, the in-register signature of a polyQ fibrilcan be excluded (17). However, details on the monomer orien-tation, number of strands, and layers in z-direction areunknown. Using distances between fluorophores, we were ableto restrict the structural heterogeneity and precisely define themost likely structure of the polyQ core and the orientation ofthe monomers to each other and to the fibril axis. The polyQstretch (51Q) in each monomer forms four �-strands with �10glutamines per strand, a length suggested also by two-dimen-sional infrared spectroscopy of K2Q24K2W peptide (18) andsupported by the minimal polyQ length needed to form amonomeric nucleus (31). A hairpin with two strands of �10glutamines is energetically stable enough to nucleate aggrega-tion. Every next strand within the polyQ monomer stabilizesenergetically the fibril relative to the monomer (35). A �-sheetwith three �-strands will have a length of at least 36 glutamines,mirroring the pathological polyQ threshold for HD.
TABLE 1Overview of the simulated distances by different orientations of donor- and acceptor-labeled monomerAll structures are ranked based on the value of sum of squares between the experimental time-resolved fluorescence decay and simulated curves. An interval up to 35% isconsidered a good fit (green), up to 80% are considered as reasonable (gray), and all values higher than 80% are considered as poor (red) (sum of squares column). Structuresare specified according to their basic structural models with specification of the layers in z-direction and the amount of �-strands per monomer. The zipper structures aresubdivided in classification with alternating or one-sided orientation of the N termini of each monomer along the z-axis. Color coding in the distances columns indicatesthe goodness of the fits: best (green, up to 5% deviation), reasonable (gray, up to 25% deviation), or poor (red, above 25% deviation).
a Abbreviations: alt., alternating; eq. or., equally oriented; r., random; N/N, N to N orientation; N/C, N to C orientation; l., layer; s., strands.b Note that �-sheet structures with random orientations of the N termini of monomers along the y axis are randomly oriented along the x axis, whereas �-sheet structures
with alternating position of the N termini have fixed alignments along the x axis.c The average sum of squares values represents the excess (in percentage) of the sum of squares as compared with the averaged sum of squares for simulations of 0% acceptor
for the given labeling position set.d Each value is the difference between simulated and experimental photon counts normalized to the averaged difference with 0% acceptor for the same labeling position.e Dist. div., distance divergence. For each simulated curve, we show the percentages by which the distance between predicted and measured photon amounts vary relative to
the average of all fibrils without any acceptor.
Structure of Polyglutamine Amyloid Fibrils
26826 JOURNAL OF BIOLOGICAL CHEMISTRY VOLUME 289 • NUMBER 39 • SEPTEMBER 26, 2014
by guest on April 11, 2018
http://ww
w.jbc.org/
Dow
nloaded from
The single zipper layer with four strands and N termini oftwo adjacent zippers antiparallel along the y axis (Fig. 5D, Table1) is also revealed as a reasonably good fit, and we cannotexclude it as a core structure of the polyQ fibrils. The length ofthe �-strand in the zipper is the same as in the �-sheet, 10glutamines, thus fulfilling the requirements for a minimallength to form a stable monomeric nucleus (31). This structureis consistent with the structure deduced from NMR measure-ments (14). It should be noted, however, that the NMR mea-surements were performed with polyQ peptides whose solubil-ity was increased by flanking them with residues of oppositecharges (14). Thus, an antiparallel alignment of monomersmight be additionally favored by stabilizing interactions of thealternating charges at the two opposite ends.
Initially, we also considered other structures, e.g. �-helix (30),�-pseudohelix (15), and water-filled �-tube (9), which, how-ever, due to the limited density of labeling positions, did not fitto the experimentally obtained donor fluorescent decays. An�-helical confirmation of a polyQ monomer is in principle sta-ble enough to nucleate aggregation (36), but kinetically unsta-ble as dimer to support oligomerization (37). Similarly, �-tubeand �-helix are too short-lived as dimers to initiate aggregation(37).
In sum, although the single zipper layer with four strands fitsreasonably our experimental data, the observed acceleration ofpolyQ aggregation through structures promoting �-turn (19)and two-dimensional infrared spectroscopy of K2Q24K2W (18)rather support the five-layered �-sheet with four-strandedmonomer. Unlike the �-sheet, the zipper structure is kineticallyunstable to serve as a monomeric nucleus to initiate polyQfibrillization (36). It is conceivable to assume cross-seedingbetween the �-sheet and zipper due to their significant struc-tural similarity, whereas the zipper structure seems less likely tobe the nucleation-initiating template for polyQ aggregation.
Acknowledgments—We thank Angelo Valleriani for inspiring discus-sions about many aspects of this project and Robert Smock for com-ments on the manuscript. We appreciate the help of Carolin Rungewith the expression and purification of the proteins and Katlen Bren-nenstuhl and Carsten Dosche for help with the fluorescent decay timeand anisotropy measurements.
REFERENCES1. De Los Rios, P., Hafner, M., and Pastore, A. (2012) Explaining the length
threshold of polyglutamine aggregation. J. Phys. Condens. Matter. 24,244105
2. Ross, C. A., and Poirier, M. A. (2004) Protein aggregation and neurode-generative disease. Nat. Med. 10, (suppl.) S10 –S17
3. Orr, H. T., and Zoghbi, H. Y. (2007) Trinucleotide repeat disorders. Annu.Rev. Neurosci. 30, 575– 621
4. Nucifora, L. G., Burke, K. A., Feng, X., Arbez, N., Zhu, S., Miller, J., Yang,G., Ratovitski, T., Delannoy, M., Muchowski, P. J., Finkbeiner, S., Legleiter,J., Ross, C. A., and Poirier, M. A. (2012) Identification of novel potentiallytoxic oligomers formed in vitro from mammalian-derived expanded hun-tingtin exon-1 protein. J. Biol. Chem. 287, 16017–16028
5. Ren, P. H., Lauckner, J. E., Kachirskaia, I., Heuser, J. E., Melki, R., andKopito, R. R. (2009) Cytoplasmic penetration and persistent infection ofmammalian cells by polyglutamine aggregates. Nat. Cell Biol. 11, 219 –225
6. Zhang, Q. C., Yeh, T. L., Leyva, A., Frank, L. G., Miller, J., Kim, Y. E.,Langen, R., Finkbeiner, S., Amzel, M. L., Ross, C. A., and Poirier, M. A.
(2011) A compact � model of huntingtin toxicity. J. Biol. Chem. 286,8188 – 8196
7. Yang, W., Dunlap, J. R., Andrews, R. B., and Wetzel, R. (2002) Aggregatedpolyglutamine peptides delivered to nuclei are toxic to mammalian cells.Hum. Mol. Genet. 11, 2905–2917
8. Tanaka, M., Machida, Y., and Nukina, N. (2005) A novel therapeutic strat-egy for polyglutamine diseases by stabilizing aggregation-prone proteinswith small molecules. J. Mol. Med. (Berl) 83, 343–352
9. Perutz, M. F., Finch, J. T., Berriman, J., and Lesk, A. (2002) Amyloid fibersare water-filled nanotubes. Proc. Natl. Acad. Sci. U.S.A. 99, 5591–5595
10. Poirier, M. A., Li, H., Macosko, J., Cai, S., Amzel, M., and Ross, C. A. (2002)Huntingtin spheroids and protofibrils as precursors in polyglutaminefibrilization. J. Biol. Chem. 277, 41032– 41037
11. Jahn, T. R., Makin, O. S., Morris, K. L., Marshall, K. E., Tian, P., Sikorski, P.,and Serpell, L. C. (2010) The common architecture of cross-� amyloid. J.Mol. Biol. 395, 717–727
12. Sawaya, M. R., Sambashivan, S., Nelson, R., Ivanova, M. I., Sievers, S. A.,Apostol, M. I., Thompson, M. J., Balbirnie, M., Wiltzius, J. J., McFarlane,H. T., Madsen, A. Ø., Riekel, C., and Eisenberg, D. (2007) Atomic struc-tures of amyloid cross-� spines reveal varied steric zippers. Nature 447,453– 457
13. Tycko, R. (2011) Solid-state NMR studies of amyloid fibril structure.Annu. Rev. Phys. Chem. 62, 279 –299
14. Schneider, R., Schumacher, M. C., Mueller, H., Nand, D., Klaukien, V.,Heise, H., Riedel, D., Wolf, G., Behrmann, E., Raunser, S., Seidel, R., En-gelhard, M., and Baldus, M. (2011) Structural characterization of polyglu-tamine fibrils by solid-state NMR spectroscopy. J. Mol. Biol. 412, 121–136
15. Zanuy, D., Gunasekaran, K., Lesk, A. M., and Nussinov, R. (2006) Compu-tational study of the fibril organization of polyglutamine repeats reveals acommon motif identified in �-helices. J. Mol. Biol. 358, 330 –345
16. Sikorski, P., and Atkins, E. (2005) New model for crystalline polyglutamineassemblies and their connection with amyloid fibrils. Biomacromolecules6, 425– 432
17. Bugg, C. W., Isas, J. M., Fischer, T., Patterson, P. H., and Langen, R. (2012)Structural features and domain organization of huntingtin fibrils. J. Biol.Chem. 287, 31739 –31746
18. Buchanan, L. E., Carr, J. K., Fluitt, A. M., Hoganson, A. J., Moran, S. D., dePablo, J. J., Skinner, J. L., and Zanni, M. T. (2014) Structural motif ofpolyglutamine amyloid fibrils discerned with mixed-isotope infraredspectroscopy. Proc. Natl. Acad. Sci. U.S.A. 111, 5796 –5801
19. Kar, K., Hoop, C. L., Drombosky, K. W., Baker, M. A., Kodali, R., Arduini,I., van der Wel, P. C., Horne, W. S., and Wetzel, R. (2013) �-Hairpin-mediated nucleation of polyglutamine amyloid formation. J. Mol. Biol.425, 1183–1197
20. Landles, C., Sathasivam, K., Weiss, A., Woodman, B., Moffitt, H., Fink-beiner, S., Sun, B., Gafni, J., Ellerby, L. M., Trottier, Y., Richards, W. G.,Osmand, A., Paganetti, P., and Bates, G. P. (2010) Proteolysis of mutanthuntingtin produces an exon 1 fragment that accumulates as an aggre-gated protein in neuronal nuclei in Huntington disease. J. Biol. Chem. 285,8808 – 8823
21. Ratovitski, T., Nakamura, M., D’Ambola, J., Chighladze, E., Liang, Y.,Wang, W., Graham, R., Hayden, M. R., Borchelt, D. R., Hirschhorn, R. R.,and Ross, C. A. (2007) N-terminal proteolysis of full-length mutant hun-tingtin in an inducible PC12 cell model of Huntington’s disease. Cell Cycle6, 2970 –2981
22. Borwankar, T., Rothlein, C., Zhang, G., Techen, A., Dosche, C., and Igna-tova, Z. (2011) Natural osmolytes remodel the aggregation pathway ofmutant huntingtin exon 1. Biochemistry 50, 2048 –2060
23. Schuler, B., Lipman, E. A., Steinbach, P. J., Kumke, M., and Eaton, W. A.(2005) Polyproline and the “spectroscopic ruler” revisited with single-molecule fluorescence. Proc. Natl. Acad. Sci. U.S.A. 102, 2754 –2759
24. Poirier, M. A., Jiang, H., and Ross, C. A. (2005) A structure-based analysisof huntingtin mutant polyglutamine aggregation and toxicity: evidence fora compact �-sheet structure. Hum. Mol. Genet. 14, 765–774
25. Thakur, A. K., and Wetzel, R. (2002) Mutational analysis of the structuralorganization of polyglutamine aggregates. Proc. Natl. Acad. Sci. U.S.A. 99,17014 –17019
26. Bhattacharyya, A., Thakur, A. K., Chellgren, V. M., Thiagarajan, G.,
Structure of Polyglutamine Amyloid Fibrils
SEPTEMBER 26, 2014 • VOLUME 289 • NUMBER 39 JOURNAL OF BIOLOGICAL CHEMISTRY 26827
by guest on April 11, 2018
http://ww
w.jbc.org/
Dow
nloaded from

Williams, A. D., Chellgren, B. W., Creamer, T. P., and Wetzel, R. (2006)Oligoproline effects on polyglutamine conformation and aggregation.J. Mol. Biol. 355, 524 –535
27. Tam, S., Spiess, C., Auyeung, W., Joachimiak, L., Chen, B., Poirier, M. A.,and Frydman, J. (2009) The chaperonin TRiC blocks a huntingtin se-quence element that promotes the conformational switch to aggregation.Nat. Struct. Mol. Biol. 16, 1279 –1285
28. Thakur, A. K., Jayaraman, M., Mishra, R., Thakur, M., Chellgren, V. M.,Byeon, I. J., Anjum, D. H., Kodali, R., Creamer, T. P., Conway, J. F.,Gronenborn, A. M., and Wetzel, R. (2009) Polyglutamine disruption of thehuntingtin exon 1 N terminus triggers a complex aggregation mechanism.Nat. Struct. Mol. Biol. 16, 380 –389
29. Ghosh, S., Saha, S., Goswami, D., Bilgrami, S., and Mayor, S. (2012) Dy-namic imaging of homo-FRET in live cells by fluorescence anisotropymicroscopy. Methods Enzymol. 505, 291–327
30. Fiumara, F., Fioriti, L., Kandel, E. R., and Hendrickson, W. A. (2010) Es-sential role of coiled coils for aggregation and activity of Q/N-rich prionsand PolyQ proteins. Cell 143, 1121–1135
31. Kar, K., Jayaraman, M., Sahoo, B., Kodali, R., and Wetzel, R. (2011) Criticalnucleus size for disease-related polyglutamine aggregation is repeat-
length dependent. Nat. Struct. Mol. Biol. 18, 328 –33632. Berney, C., and Danuser, G. (2003) FRET or no FRET: a quantitative com-
parison. Biophys. J. 84, 3992– 401033. Corry, B., Jayatilaka, D., and Rigby, P. (2005) A flexible approach to the
calculation of resonance energy transfer efficiency between multiple do-nors and acceptors in complex geometries. Biophys. J. 89, 3822–3836
34. Frederix, P. L., de Beer, E. L., Hamelink, W., and Gerritsen, H. C. (2002)Dynamic Monte Carlo simulations to model FRET and photobleaching insystems with multiple donor-acceptor interactions. J. Phys. Chem. B 106,6793– 6801
35. Landrum, E., and Wetzel, R. (2014) Biophysical underpinnings of the re-peat length dependence of polyglutamine amyloid formation. J. Biol.Chem. 289, 10254 –10260
36. Miettinen, M. S., Knecht, V., Monticelli, L., and Ignatova, Z. (2012) As-sessing polyglutamine conformation in the nucleating event by moleculardynamics simulations. J. Phys. Chem. B 116, 10259 –10265
37. Miettinen, M. S., Monticelli, L., Nedumpully-Govindan, P., Knecht, V.,and Ignatova, Z. (2014) Stable polyglutamine dimers can contain �-hair-pins with interdigitated side chains— but not �-helices, �-nanotubes,�-pseudohelices, or steric zippers. Biophys. J. 106, 1721–1728
Structure of Polyglutamine Amyloid Fibrils
26828 JOURNAL OF BIOLOGICAL CHEMISTRY VOLUME 289 • NUMBER 39 • SEPTEMBER 26, 2014
by guest on April 11, 2018
http://ww
w.jbc.org/
Dow
nloaded from

Mielke, Michael U. Kumke and Zoya IgnatovaChristoph Röthlein, Markus S. Miettinen, Tejas Borwankar, Jörg Bürger, Thorsten
DecayArchitecture of Polyglutamine-containing Fibrils from Time-resolved Fluorescence
doi: 10.1074/jbc.M114.581991 originally published online August 4, 20142014, 289:26817-26828.J. Biol. Chem.
10.1074/jbc.M114.581991Access the most updated version of this article at doi:
Alerts:
When a correction for this article is posted•
When this article is cited•
to choose from all of JBC's e-mail alertsClick here
http://www.jbc.org/content/289/39/26817.full.html#ref-list-1
This article cites 37 references, 10 of which can be accessed free at
by guest on April 11, 2018
http://ww
w.jbc.org/
Dow
nloaded from