Embed Size (px)
Citation preview

[Lahane*, 5.(1): January, 2016] ISSN: 2277-9655
(I2OR), Publication Impact Factor: 3.785
http: // www.ijesrt.com © International Journal of Engineering Sciences & Research Technology
[22]
IJESRT INTERNATIONAL JOURNAL OF ENGINEERING SCIENCES & RESEARCH
TECHNOLOGY
ANALYSIS OF GEAR PAIR CONTACT TO PRIDICT EFFICIENCY Mr.Ravindra S. Lahane*, Mr. Nilesh Pawar, Swapnil Ghogardare
Mechanical Engineering Department, D Y Patil College of Engineering ,Akurdi, Pune -411044.
ABSTRACT Gear pair is higher pair point contact is under the stress. Due to that point contact get converted into line contact.
Deformation due to contactlosses some energy during meshing of gear is generally neglected, but so many researchers
calculate efficiency of gear drive by practically and analytically is upto 98%for metal only.if the error due to
deformation in transmission in gear box is small no one proposed this kind work is workout in this paper.
KEYWORDS— Gear pair, Contact, Deformation, Efficiency.
INTRODUCTION (BAYESIAN TECHNIQUE)Efficiency of spur and helical gear systems has become an increasingly important research topic as the fuel economy
requirements for today’s passenger vehicles and rotorcraft are more stringent, not only due to fuel cost, but also
environmental concerns associated with energy utilization and air pollution. Improved gear system efficiency also
results in less frictional heat generation within the gearbox, resulting in improvements in gear failure modes such as
scoring and pitting, and lower-capacity lubrication systems. Sliding friction contributes about 98% of the total power
loss for gear trains operating at relatively low speeds (less than 2000 rpm input speed). Rolling frictional losses
decrease with increased load while windage losses are only significant for gears running at very high speeds (greater
than 3000 rpm). The results also showed that the overall efficiency varies over the path of contact of the gear meshes
ranging between 94% to 99.5%.
There are other benefits to improving gear efficiency as well. Since the efficiency losses amount to additional heat
generation within the gearbox, several gear failure modes including scoring and contact fatigue failures are directly
impacted by the efficiency of the gear pair. A more efficient gear pair generates less heat, and therefore, it is likely to
perform better in terms of such failures. In the process, demands on the capacity and the size of the lubrication system
and the amount and quality of the gearbox lubricant are also eased with improved efficiency. This also reduces the
overall weight of the unit contributing to further efficiency improvements.
The total efficiency loss of the gearbox is attributable to sliding and rolling frictional losses between the gear teeth,
windage losses due to complex interactions with the air surrounding the gears, and oil splashing and churning losses
inside the gearbox, as well as the losses associated with the bearing and seals. While churning and windage losses are
mostly geometry and speed related, friction losses are mainly associated with sliding velocities and load. Friction
losses of hypoid gears are of primary interest here since they are a major source of losses in a drive train. As a common
automotive application, the drive train of a rear-wheel-drive (or all-wheel-drive) car or truck contains one (or two, one
rear and one front) axle gearbox that is formed by a hypoid final drive reduction unit and a differential. Unlike parallel
axis gears that may have a mechanical efficiency well over 99 percent, the efficiency of hypoid gears usually falls into
the range of 86 to 97 percent depending on the amount of relative sliding induced the gear geometry. This is mainly
because sliding velocities in a hypoid gear contact are significantly larger than parallel-axis gears. As a result of this,
an axle unit that is formed by a single hypoid gear set has the same levels of (and in May applications more) power
loss as a manual or automatic transmission that contains many spur or helical gears. This presents the hypoid gear
drive as a prime candidate for any efficiency improvement efforts.
Until now many researchers have worked on static and dynamic contact of contact with

[Lahane*, 5.(1): January, 2016] ISSN: 2277-9655
(I2OR), Publication Impact Factor: 3.785
http: // www.ijesrt.com © International Journal of Engineering Sciences & Research Technology
[23]
Gosselin etal [1] applied a new methodology based on FEM to analyze the contact stress and displacement of the line
contact condition in spur gears.
Braucr Zanzi and Pedrero and Guing and etal [2] on Tooth contact analysis and stress analysis of gear drives.
Umezawa and Ishikawa [3] presented experimental studies for the deflections and moments of a gear tooth.
Chabert et al also presented valuable results using finite element method (FEM) on the stresses and deflection of spur
gear teeth induced by a static load.
Litvin etal [1] developed computer programs that integrate computerized design, tooth contact analysis and automatic
modeling and finite element simulation of a new type of helical gear drives.
Vedmar and Henriksson introduced a method to use the deformations of the gears to determine the variation of the
gear mesh stiffness and the boundary of the action between the gears.Littleresearch has been reported on finite element
based methods to investigate the dynamic contact/impact problems of gear drives.
GEARS are the most common power transmission systems in industrial machinery, automobiles, aircrafts, marine
vessels et cetera. The efficiency of these power transmission systems is an important design factor due to the following
reasons:
i. Efficient power transmission systems ensure fuel economy of automobiles, marine vessels and aircrafts.
ii. With less fuel consumption, less pollutant gases and particulate are emitted to the environment
As the recent work is on the gear contact, when gear pair is rotated due tensional effect due to that causes the small
deformation in the profile causes minor loss in energy that error affects in transmission efficiency.
1. Gear pair is the higher pair with line contact under the stress , line contact get converted into surface contact
i.e. lower pair due to that degree of freedom is zero hence motion will not possible, law of gearing is not possible at
all point due to series of deformation.
2. The motion will takes place because of the additional deformation with satisfaction of law of gearing.
3. Resistance to the motion is due to :
a. Friction b. Additional deformation
4. Tractive forces causes the deformation at point of contact, hence some Energy is utilized for Local
Deformation. Practically, complete Strain Energy is not regained under elastic deformation.
NOMENCLATURE:
Z1 No. of teeth on pinion
Z2 No. of teeth on gear
α Pressure Angle
m Module
dpPitch circle Diameter of Gear1
dg Pitch circle Diameter of Gear2
A Addendum of gear
D Dedendum of gear
tTooth thickness
wFace width
P Circular pitch
F Applied load vector
Pmax Maximum contact stress
Fi Load per unit width
σHMaximum Hertz stress
aContact width
hWorking depth
H Whole depth
[Lahane*, 5.(1): January, 2016] ISSN: 2277-9655
(I2OR), Publication Impact Factor: 3.785
http: // www.ijesrt.com © International Journal of Engineering Sciences & Research Technology
[24]
Acaddendum circle diameter
Dc dedendum circle diameter
CR Contact Ratio
CL Contact Length
R1 Radius of Gear1
R2 Radius of Gear2
Llength of cylinder
Ft Tangential Force
Fr Radial Force
Fn Normal Force
Ei Young’s Modulus of elasticity
µ Poisson’s ratio
∂x in x-direction
∂y Deformation in y-direction
∂z Deformation in z-direction
σNormal Stress
τ Shear Stresses
σxx, σyy, σzz Normal Stress in X, Y and Z Direction
εxx, εyy, εzz Normal Elastic Strain in X, Y and Z Direction
τxy, τyz, τxz Shear stress component in XY, YZ and XZ Plane
γxy, γyz, γxz Shear strain component in XY, YZ and XZ Plane
CONTACT ANALYSIS OF TWO CYLINDRICAL Why is the Contact Problem Significantly Difficult
Despite the importance of contact in the mechanics of solids and its engineering applications, contact effects are rarely
seriously taken into account in conventional engineering analysis, because of the extreme complexity involved.
Mechanical problems involving contacts are inherently linear elastic behavior.
First, the actual region of contact between deformable bodies in contact is not known until the solution has been
obtained. Depending on the loads, materials, and boundary conditions, along with other factors, surfaces can come
into and go out of contact with each other in a largely unpredictable manner. Secondly, most contact problems need
to account for friction. The modelling of friction is very difficult as the friction depends on the surface smoothness,
the physical and chemical properties of the material, the properties of any lubricant that might be present in the motion,
and the temperature of the contacting surfaces. There are several friction laws and models to choose from, and all are
nonlinear. Frictional response can be chaotic, making solution convergence difficult (ANSYS). In addition to those
difficulties, many contact problems must also address multi-field effects, such as the conductance of heat and electrical
currents in the areas of contact. Bodies in contact may have complicated geometries and material properties and may
deform in a seemingly arbitrary way. With the rapid development of computational mechanics, however, great
progress has been made in numerical analysis of the problem. Using the finite element method, many contact
problems, ranging from relatively simple ones to quite complicated ones, can be solved with high accuracy. The Finite
Element Method can be considered the favourite method to treat contact problems, because of its proven success in
treating a wide range of engineering problem in areas of solid mechanics, fluid flow, heat transfer, and for
electromagnetic field and coupled field problems. An easy way to comply with the conference paper formatting
requirements is to use this document as a template and simply type your text into it.
How to Solve the Contact Problem
There are many types of contact problems that may be encountered, including contact stress, dynamic impacts, metal
forming, bolted joints, crash dynamics, and assemblies of components with interference fits, etc. All of these contact
problems, as well as other types of contact analysis, can be split into two general classes (ANSYS),
Rigid - to - flexible bodies in contact,
Flexible - to - flexible bodies in contact.

[Lahane*, 5.(1): January, 2016] ISSN: 2277-9655
(I2OR), Publication Impact Factor: 3.785
http: // www.ijesrt.com © International Journal of Engineering Sciences & Research Technology
[25]
In rigid - to - flexible contact problems, one or more of the contacting surfaces are treated as being rigid material,
which has a much higher stiffness relative to the deformable body it contacts. Many metal forming problems fall into
this category.
Flexible-to-flexible is where both contacting bodies are deformable.
Examples of a flexible-to-flexible analysis include gears in mesh, bolted joints, and interference fits.
Types of Contact Models
In general, there are three basic types of contact modelling application as far as
ANSYS use is concerned. Point-to-point contact: the exact location of contact should be known beforehand. These
types of contact problems usually only allow small amounts of relative sliding deformation between contact surfaces.
Point-to-surface contact: the exact location of the contacting area may not be known beforehand. These types of
contact problems allow large amounts of deformation and relative sliding. Also, opposing meshes do not have to have
the same discretisation or a compatible mesh. Point to surface contact was used in this chapter. Surface-to-surface
contact is typically used to model surface-to-surface contact applications of the rigid-to-flexible classification.
Why contact between two cylindrical Surfaces
Contact of two curved surface is represent the gear teeth so two cylindrical surfaces in contact cuases the contact stress
and deformation, in machine design,problem frequently occurs when two members with curved surfaces are deformed
when press against one another giving rise to an area contact under the compressive stresses. Of particular interest to
the gear designer is the case where the curved surfaces are of cylindrical shape because they closely resemble gear
tooth surface
Consider two circular cylinder, B1 and B2, with a radius of R1= 5 mm. and R2= 5mm. as shown in Figure 3.2
Hertz Contact Stress Equations:
Usually, the current methods of calculating contact stresses use Hertz’s equations, which were originally derived
for contact between two cylinders.
The maximum surface (Hertz) stress:
Pmax = 𝜎𝐻 = 0.564√𝑭(
𝟏
𝑹𝟏+
𝟏
𝑹𝟐)
√(𝟏−𝝁𝟏𝟐
𝑬𝟏+
𝟏−𝝁𝟐𝟐
𝑬𝟐)
……………….(1)
Where,
F -is load per unit length,
Ri- is radius of the cylinder,
µi- is Poisson ratio,

[Lahane*, 5.(1): January, 2016] ISSN: 2277-9655
(I2OR), Publication Impact Factor: 3.785
http: // www.ijesrt.com © International Journal of Engineering Sciences & Research Technology
[26]
Ei- is Young’s modus of cylinder.
Material properties of the two cylindrical bodies and load data of the contact model are shown in Table 4.1.
TABLE I
MATERIAL PROPERTY AND PARAMETER
Sr.
No
Material Property and Parameter
Surface
Body
MaterialProperty Dimension
1 Cylinder 1
(B1)
1.Modulus of
Elasticity
(E1)=200X10^5Pa
2. Poisson’s ratio
( µ¹)=0.3
Radius
(R1)=5mm,
Length
(L) = 60mm
2 Cylinder 2
(B2)
1.Modulus of
Elasticity
( E 2)=200X
10^5Pa
2. Poisson’s ratio
( µ²)=0.3
Radius
(R2)= 5mm,
Length
(L) = 60mm
3 Load Data: Load (F) = 2000 N
Following fig 3.3 (a) and fig 3.3(b) shows the deformation and von misses stress contact zone is near contact
surface.
Figure a): Deformed Model two half cylinder surfaces
Figure b): Von Mises Stress Model of two half cylinder surfaces
[Lahane*, 5.(1): January, 2016] ISSN: 2277-9655
(I2OR), Publication Impact Factor: 3.785
http: // www.ijesrt.com © International Journal of Engineering Sciences & Research Technology
[27]
Table 3.1: Comparison of finite element analysis results with analytical results for contact model
REGION ANSYS THEOROTI
CAL
%
ERROR
CONTACT
DEFORMATION(
mm)
0.00083
6
0.000928 1.10
CONTACT
DEFORMATION(
mm)
31.64 25.467 0.5
Conclusion: Finite element modeling of the contact between two cylinders was examined in detail. The finite element
method with special techniques, such as the incremental technique of applying the external load in the input file, the
deformation and contact stress and the introduction of the contact element were used. It was found that initial loading
using displacements as inputs was helpful in reducing numerical instabilities.
FORCE ANALYSIS FOR SPUR GEAR One of the fundamental parameters to be considered, analyzed and checked for designing a gear system is the load
transmitting capability of gear teeth. For this the circumferential force effective on the tooth at the pitch circle of the
gear when in mesh, must be known. Irrespective of the value of the contact ratio, for the calculation the total gear
forces are taken to be effective on a single pair of teeth in mesh.
Rated Power PR = 30 KN,
Speed on Pinion = NP = 1000 RPM
Speed on Gear = NG = 500 RPM
Z1 = No. Of Teeth on the Pinion = 18
Z2 = No. Of Teeth on the Gear = 18
Pressure Angle α = 20 deg for Full Depth
Torque on Pinion & Gear TP &TG= 𝑃×60
2𝜋𝑁𝑃𝑜𝑟𝑁𝐺 =
30 000×60
2𝜋×1000
= 286.4788 N-mm
Material for Gear and Pinion = Structural Steel
Brinell hardness number (B.H.N) =200
Assuming the steady state condition& 8-10 hrs. service per day
Design Power (Pd) = (PR) ×K1 = 30×10^3 ×1 = 30×10^3 W
Where, PR = Rated Power, K1 = Load Factor = 1
Tooth Load Ft, N
Ft =(P)d
Vp
Where Vp = Pitch Line Velocity, m/sec
Vp = πDp Np
60×1000 =
π×m×18×1000
60×1000= 0.9424 m m/sec
Ft = 30×10^3
0.9424m =
31830.9886
m… . . (1)
Bending Strength by Lewis equation, FB ,N
FB = So × Cv ×b × Y× m
Where,
So= Basic Strength, MPa= 140MPa
Cv = Velocity Factor = 3 / 3 +Vp = 0.3 (trial value)
b= Face width of gears =10mm (trial value)
Y =Modified Lewis form factor = 0.485 – 2.87 / Tp
=0.485 – 2.87/18
= 0.3256

[Lahane*, 5.(1): January, 2016] ISSN: 2277-9655
(I2OR), Publication Impact Factor: 3.785
http: // www.ijesrt.com © International Journal of Engineering Sciences & Research Technology
[28]
m= Module, mm
FB=140×0.3×10m×0.3256×m=138.74 ×m2....... (2)
Equating Equation (1) & (2), we get
FB = Ft
138.74 ×m2 = 31830.9886/m
m3 = 229.4290
m=6.1218 ≈ 8mm
Therefore,
The standard value of module m =8mm
Face width b= 10m = 10×8=80 mm
Diametral Pitch for pinion dp = 8 ×18 =144 mm
Diametral Pitch for gear dg = 8 ×18 = 144 mm
Pitch Line Velocity, Vp= 0.9424 ×m =0.9424 ×8 =7.5392 m/sec
Ft = 31830.9886/m =31830.9886/8 =3,978.8735 N
FB=138.74×m2 = 138.74 ×82 =8,879.36 N
Dynamic Load Fd, N Based on Buckingham’s Equation
The dynamic force for the gear is given by
Fd = Ft + 21𝑉𝑝 (𝐶𝑒𝑏+𝐹𝑡)
21𝑉𝑝+√𝐶𝑒𝑏+𝐹𝑡
The permissible error at 7.5392 m/sec i.e. 452.352 m/min is 0.045.
We must use class-2 chain gear for which the permissible error for which the probable error
For 8mm module will be 0.4mm.For deformation factor C for steel with 200 full depth teeth
C= 11800
Ceb = 11800×0.04×80 = 37,760
Ceb + Ft = 37,760 + 3,978.36= 41,738.36
21Vp = 158.34
Fd= 3,978.36 + 158.34×(41,738.36)
158.34+√41,738.36
= 22,203.33 N
Limiting Wear Strength Fw, N
FW = DP×b×K×Q
Where, K= Load Stress Factor
Dp= 144mm
b= 80 mm
tg&tp =No. of teeth on gear & pinion respectively = 18
Q = Size Factor = 2tg / tg+tp =1….for internal gear
Fw = 144 ×80×1×k
= 11520 k………….…….(3)
Equating Fw to Fd, We get kmin;
Kmin = 22203.33/11520=1.9273
Hardness for pinion & gear= 350 B.H.N
Endurance strength, Fen, N
Fen = Seb×b×Y×m
Seb = Endurance Strength =596 MPa for Steel with 350B.H.N
b= 80mm
Y= 0.1034
Fen= 596×80×0.1034×8
= 39440.8960N
The greater than Fd so O.K.
3D CONTACT ANALYSIS OF GEAR 5.1 SPUR GEAR PAIR MODEL

[Lahane*, 5.(1): January, 2016] ISSN: 2277-9655
(I2OR), Publication Impact Factor: 3.785
http: // www.ijesrt.com © International Journal of Engineering Sciences & Research Technology
[29]
This model of spur gear is made in catia V5R20 then this model is import in though IGES format in ANSYS 12.1
Software. It can be seen in fig 2.11 that during the course of action of the teeth engagement along the path of action
in a meshing pair of gear teeth, i.e. from beginning of contact to the end of the contact comprising the length of contact
,the load during rest of the time.
The following parameters are used to design the pair of spur gear.
5.2 Contact Ratio
It can be seen from fig that during the course of action of teeth engagement along the path of action in a meshing pair
of gear teeth, i.e. from beginning of contact to the end of contact comprising the length of contact, the load is
transmitted by a single tooth of the driving gear for part of the time and by two teeth during rest of the time. For
continuous contact, the angle of action must be greater than the angle subtended at the centre by the arc representing
the circular pitch (called “pitch angle”).the relation between these two angles is termed as the contact ratio.
The physical significance of the contact ratio lies in the fact that it is a measure of average number of teeth in contact
during the period in which a tooth comes and goes out of contact with the mating gear. Contact ratio 1 means that only
one pair (one tooth from each gear) is engaged at all times during course of action. This is the case when the angle
The zone of action of meshing gear teeth is shown in Figure 4.4. Tooth contact begins and ends at the intersections of
the two addendum circles with the pressure line.
In figure, initial contact occurs at a and final contact at b. Tooth profiles drawn through these points intersect the pitch
circle at A and B, respectively. As shown, the distance AP is called the arc of approach ua, and the distance P B, the
arc of recess ur. The sum of these is the arc of action AB= La.
Now, consider a situation in which the arc of action is exactly equal to the circular pitch= p.This means that one tooth
and its space will occupy the entire arc AB. In other words,
When a tooth is just beginning contact at a, the previous tooth is simultaneously ending its contact at b. Therefore,
during the tooth action from a to b, there will be exactly one pair of teeth in contact.
According to Machinery’s Handbook [8-9], the contact ratio is the ratio of the arc of action in the plane of rotation to
the circular pitch.

[Lahane*, 5.(1): January, 2016] ISSN: 2277-9655
(I2OR), Publication Impact Factor: 3.785
http: // www.ijesrt.com © International Journal of Engineering Sciences & Research Technology
[30]
Referring to Fig,
The path of contact La = ua+ ur =Arc of approach (AP) + Arc of recess (PB)
La =√ (〖 (r1+a)〗^2-〖r1〗^2×cos^2 α) + √ (〖 (〖r2〗^2+a)〗^2-〖r2〗^2×cos^2 α) - (r1 + r2) sin α
= √ (〖80〗^2-〖72〗^2×cos^2 20) + √ (〖 80〗^2-〖72〗^2×cos^2 20) - (72+72) sin 20
= 42.6897 + 42.6897 - 49.2509
= 36.1284mm
The contact ratio is given by following formula
Circular pitch = pitch angle = Base pitch
= π×m Cos 20
= π×8 cos20
=23.6170
C.R = (the path of contact)/ (circular pitch)
= La/(π×m Cos 20 )
= (36.128)/ (23.6170 )
= 1.530................................... (1)
Table 5.1 Design Parameter of Spur Gear
Parameter Formulas Driving
Gear
Driven
Gear
Profile Involute involute
No. of teeth Z1/Z2=1 Z1 =18 Z2=18
Pressure angle α 20 deg 20 deg
Module m 8 mm 8mm
Circular pitch P= π m 25.1328
mm
25.1328
mm
Pitch circle
diameter d= m*z 144 mm 144 mm
addendum a = 1m 8mm 8mm
Dedendum b = 1.25m 10mm 10mm
Tooth thickness t =1.57m 12.56 mm 12.56 mm
Face width b 80 mm 80 mm
Working depth H =2m 16 mm 16mm
Whole depth h=2.25m 18mm 18mm
addendum
circle diameter Ac = d+2m 160mm 160mm
dedendum
circle diameter Dc = d- 2m 128 mm 128 mm

[Lahane*, 5.(1): January, 2016] ISSN: 2277-9655
(I2OR), Publication Impact Factor: 3.785
http: // www.ijesrt.com © International Journal of Engineering Sciences & Research Technology
[31]
4 Meshing of spur gear
In this session gear teeth in mesh contact causes the deformation in micron over the gear teeth and contact stress at
point of contact is maximum. This gear tooth mesh model there is total nodes no 59790 to 61549 and element number
38643 to 39908 on this node in contact, minimum elemental edge length is 0.00984mm.
Fillet radius Rf= 0.4m 3.2 mm 3.2 mm
Top land tp= 0.25m 2mm 2mm
Centre distance C =
(z1+z2)m|2 144mm 144mm
Contact ratio CR =
La/Pcosα 1.5297 1.5297
Power (P) P= 2¶NT/60 30 KN 30 KN
Speed (N) N 1000 rpm 500rpm
Torque( T) T 286.32 N-
mm
572.95N-
mm
Tangential
Force Ft
3978.8748
N
Normal Force Fn=Ft/cosα 4234.2301
N
Radial force Fr=Ft *tanα 1448.1920
N

[Lahane*, 5.(1): January, 2016] ISSN: 2277-9655
(I2OR), Publication Impact Factor: 3.785
http: // www.ijesrt.com © International Journal of Engineering Sciences & Research Technology
[32]
Fig 5.2 Fine Mesh of Spur Gear near Contact
5.2 DEFORMATION, ENERGY AND EFFICIENCY OF GEAR TEETH
Fig: a) Deformation Model in X- Direction
Fig: b) Deformation Model in Y- Direction

[Lahane*, 5.(1): January, 2016] ISSN: 2277-9655
(I2OR), Publication Impact Factor: 3.785
http: // www.ijesrt.com © International Journal of Engineering Sciences & Research Technology
[33]
Fig: c) Deformation Model in Z- Direction
Fig 5.3: 3D Deformed Model for gear under contact.
5.2.2 Methods for Energy Estimation under Strain
The following types of energy method used to calculate the gear pair losses
5.2.2.1 Strain Energy Method
The energy stored in body due to deformation is called strain energy. The strain energy stored in an elastic material
upon deformation is calculated below for a number of different geometries and loading conditions.
The strain energy stored due to deformation in gear pair contact is calculated as follows:
Strain energy per unit volume.
Ue = ½ × Stress × Strain = ½ × σ ×ε
= ½ × [σxx×εxx+ σyy×εyy+ σzz×εzz+ τxy × γxy + τyz × γyz+ τxz × γxz]
=1/2× [0.46881×1.82E-06 +0.2662 × 7.83E-07 + 0.19354 ×4.92E-07
+ 1.59E-06 × 1.22E-01 + 4.62E-02 × 6.00E-07 + 9.28E-02 × 1.21E-06]
= 7.45E-07 Joules
Assumptions for Sample Calculations Material under consideration is - Cast Steel 0.20 % Carbon, Untreated
Throughout the length of contact, average deformation is assumed to be constant Assumptions for Energy Estimation
Energy Calculation by considering,
1. Sliding friction and rolling friction is absent No Power losses under friction.
2. Zero Bearing and Churning loss for lubricating oil.
3. The windage losses due to complex interactions with the air surrounding the gears is Zero.
5.2.2.2 Efficiency Calculation of Gear
In gear drive, the efficiency of system is given by
Efficiency (η) = (output power)/(input power)
= (Toutput×ωoutput)/(Tinput ×ωinput)..... (5)There is a power loss in the system due to the sliding action of toothing.
Besides this, there are power losses at the bearing, loss due to the churning of Lubricating oil and other losses, so that
the overall efficiency becomes still lesser Than the efficiency calculated on the basis of loss due to sliding only.
The following values are typical for the spur gear drive system
η = 92 to 94 % for unmachined teeth
= 96 % for smooth and lubricated teeth
= 98 to 99 % for very carefully machined teeth with hydrodynamic
Lubrication between teeth surfaces With the ideal kind of design, construction and bearing systems coupled with very
good Lubrication and gears of high quality, it is not difficult to attain an efficiency as high as 98% to 99%.for
automotive drives in general, it is around 97%.
If the sliding velocity is high, it leads to considerable power loss due to friction and the
Efficiency may fall to around 85%. According to Machinery’s Handbook [8-9],

[Lahane*, 5.(1): January, 2016] ISSN: 2277-9655
(I2OR), Publication Impact Factor: 3.785
http: // www.ijesrt.com © International Journal of Engineering Sciences & Research Technology
[34]
Hence efficiency is calculated as follows:
Input Energy = Torque acting on the pinion = 286.4788 Joules
Total loss = Input Energy –Output Energy
Efficiency Estimation is
Efficiency (η) = (Output Energy)/(Input Energy) ×100
= (Input Energy –Total Loss)/(Input energy) ×100
= 286.4788- 7.4544E-7/286.4788×100
= 99. 9997 %
Estimated loss due to strain energy method in transmission is 0.03 %.loss in transmission is minor in due to sliding
of the contact of spur gear, hence from that loss we predict to efficiency by reducing the loss.
5.2.2 POSSIBILITIES TO CALCULATE THE AVERAGE DEFORMATION:
The deformation over the gear tooth Profile considering the 100 point on contact surface then each point contact is
converted into line contact hence deformation over teeth in nearly equal as the calculated by direct contact in triaxial
direction. For that divide gear tooth profile having total length 23.77mm and having dividend distance between points
is 0.2377mm is shown in fig 5.1
The first model used is a 2D model. With this model we will find the real points on the tooth profile where the single
pair in contact change into a double pair of teeth in contact this way we find with a good approximation the loading
diagram for the 100 points on the involute active profile.
Fig 5-7 2D Meshing point contact of gear teeth model
To keep track of the surface elements the single point observation method was used. Thesingle point observation
method was introduced by Andersson and Eriksson [17] and has been successfully used by Hugnell [18], Björklund
[19] and others. Andersson and Eriksson studied how a point on a gear tooth moved in relation to another point on the
opposing tooth, see figure 5.2. By regarding single points on the teeth, interesting information can be deduced, such
as the difference in sliding distance for a local point on the pinion- and gear surfaces, which is discussed below. Local
wear and pressure on the flanks can be investigated.

[Lahane*, 5.(1): January, 2016] ISSN: 2277-9655
(I2OR), Publication Impact Factor: 3.785
http: // www.ijesrt.com © International Journal of Engineering Sciences & Research Technology
[35]
a) Deformed Model in X- Direction
b) Deformed Model in Y- Direction
c) Deformed Model in Z- Direction
Figure 5.5 Contact Point along Tooth Face Width
The single point observation method naturally relates the wear, pressure and other relevant quantities, directly to the
surface thus facilitating the study of local phenomenon on a tooth face. The surface geometry is also easily changed
which is important when researching wear. The change of the surface curvature in contact affects the pressures and
contact width as well as the load distribution during the meshing. This is important but often neglected and some
works treat the wear as a curve fitting procedure [20], making the wear calculation very specific and not general
Table 5.3 shows the Average Deformation in X, Y & Z Direction over the Profile considering 100 point on face width
compare with actual deformation calculated from the ansys.

[Lahane*, 5.(1): January, 2016] ISSN: 2277-9655
(I2OR), Publication Impact Factor: 3.785
http: // www.ijesrt.com © International Journal of Engineering Sciences & Research Technology
[36]
From Table 5.4 which is shown in Appendix calculate value of normal stress, strain and shear stress and shear strain
that value of all around 100 point on tooth edge face along tooth width used to calculated for strain energy.
Strain Energy per Unit Volume
Ue = ½ × Stress × Strain = ½ × σ ×ε
= ½ × [σxx×εxx+ σyy×εyy+ σzz×εzz+ τxy × γxy + τyz × γyz+ τxz × γxz]
= 2.087e-3 joules
Efficiency Estimation is................
Efficiency (η) = (Output Energy)/ (Input Energy) ×100
= (Input Energy–Total Loss)/(Inputenergy)×100
= (286.4788- 2.087e-3)/286.4788 ×100
= 99. 9992 %
Estimated loss is
Using Strain Energy Method ignoring cantilever Effect Loss in transmission is estimated to be 0.08%.
Figure 5.5 shows variation of the deformation over point number along the tooth width contact region when complete
load acted on contact region it will reached the pick level during contact by considering 50 points on the gear teeth
profile.
Figure 5.5 shows variation of the deformation over point number along the tooth width
Figure 5.6 also shows variation of the deformation over point number along the tooth width contact region when
complete load acted on contact region it will reached the pick level during contact by considering 50 points on the
gear teeth profile.
Figure 5.6 shows variation of the deformation over point number along the tooth width
As seen in figure 5.7 shows the deformation is constantly increases in tooth entering the contact and decreases in tooth
contact is leaving.
[Lahane*, 5.(1): January, 2016] ISSN: 2277-9655
(I2OR), Publication Impact Factor: 3.785
http: // www.ijesrt.com © International Journal of Engineering Sciences & Research Technology
[37]
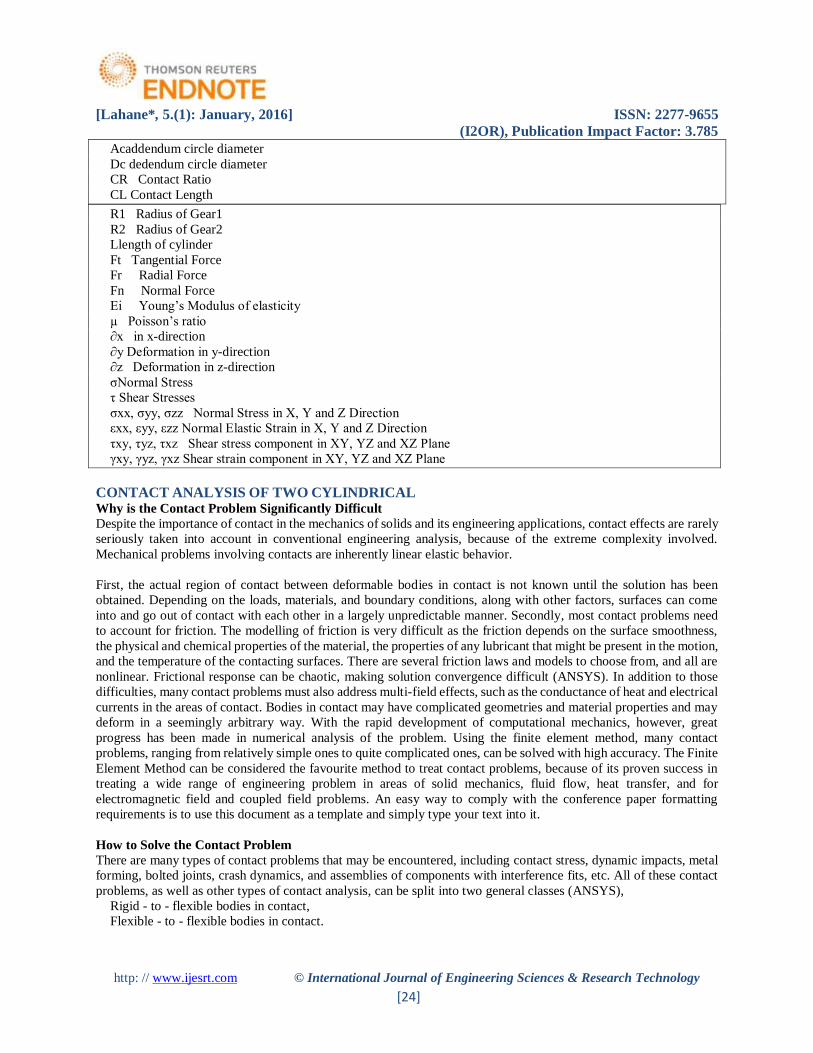
Figure 5.7 shows variation of the deformation over point number alongtooth face width
5.4 Energy Required For the Cantilever Effect
Essentially, gear tooth in operation can be considered as a cantilever beam under load. For this reason, the ability of
the tooth to resist tooth breakage of the tooth at the root is often reffed to as its beam strength .the basic tooth stresses
caused by bending were first investigated by wildfred Lewis and the bending stress equation is still known as the
Lewis formula although much modification of the original formula has taken place during the period of nearly 10
years.
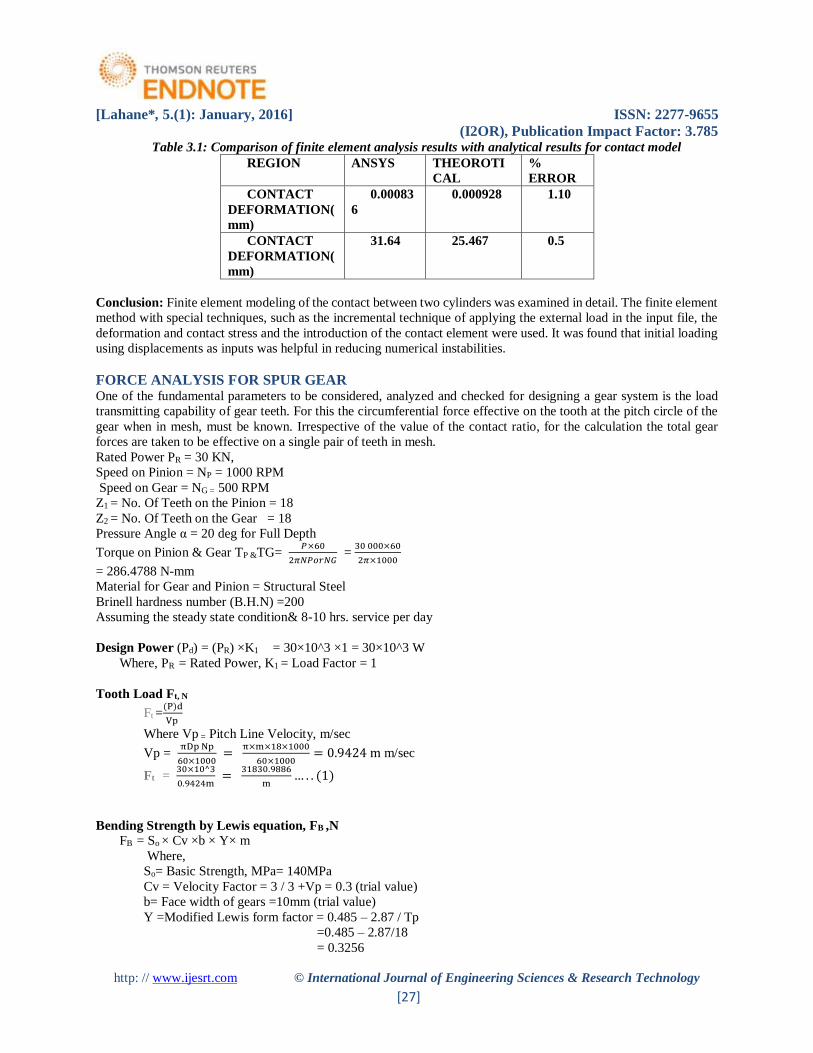
Referring to fig5.5 and 5.6, the tooth load F is supposed to act at the tip corner as shown .under this assumption,
calculation becomes simplified. Load F acts along the line of action at a grip angle of α1at the tip corner. When
referred to pitch point P, angle α is the pressure angle of the system .As explained in earlier section, force F is normal
to the tooth profile at pitch point the line of action If at the intersection of the line of action and the present Centre line
of the tooth this force F is resolved, then We get,
The radial component Fr=F Sin α=1448.1920 N
The tangential component Ft=F Cos α =3978.8748 N
Normal Force Component F= 4234.2301 N
Fig 5.6: Loading and Boundary
Bending Moment at the profile is maximum is given follows:
M = Ft*D = 3978.4788* 18 = 71612.6184N-mm
M1=Ft*D1= 3978.4788*16 = 63655.6608 N-mm
M2= Ft*D2=3978.4788*10 = 39784.7880N-mm
M3= Ft*D3= 3978.4788*8 =31827.8304 N-mm
[Lahane*, 5.(1): January, 2016] ISSN: 2277-9655
(I2OR), Publication Impact Factor: 3.785
http: // www.ijesrt.com © International Journal of Engineering Sciences & Research Technology
[38]
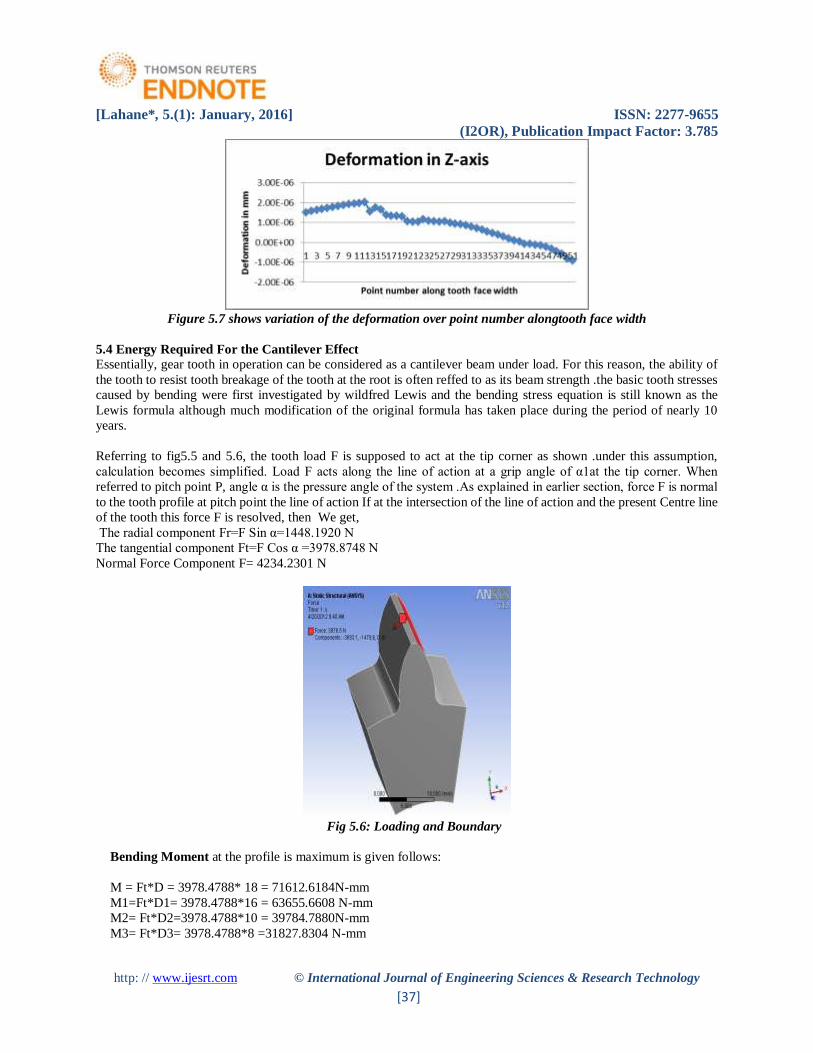
Bending Moment is Maximum at the top tooth end hence force is applied at the end of gear tip corner. Single tooth is
imported into ansysis software and the apply the Boundary Condition the we got Model is discredited into small
element by meshing then bottom end of the tooth is fixed and Tangential force is applied at end.
Fig: 5.1 Total Deformations
Fig: 5.2Deformation in x –direction
Fig: 5. 3 Deformation in y –direction

[Lahane*, 5.(1): January, 2016] ISSN: 2277-9655
(I2OR), Publication Impact Factor: 3.785
http: // www.ijesrt.com © International Journal of Engineering Sciences & Research Technology
[39]
Fig: 5.4 Deformation in z –direction
Strain Energy per Unit Volume is......
Ue = ½ × Stress × Strain = ½ × σ ×ε
= ½ × [σxx×εxx+ σyy×εyy+ σzz×εzz+ τxy × γxy + τyz × γyz+ τxz × γxz]
= ½ × [105.99×0.0004445 + 147.15 ×0.00066001 + 49.212 × 0.000233
12.731 ×0.00016 + 9.8418 ×0.0001297 + 17.28 × 0.00022465]
= 0.08147 Joules
Efficiency Estimation is................
Efficiency (η) = (Output Energy )/(Input Energy) ×100
= (Input Energy –Total Loss)/(Input energy)×100
= (286.4788- 0.08147)/286.4788 ×100
= 99. 9715%
Estimated loss is..........
Using Strain Energy Method Considering Cantilever Effect, Loss in transmission is estimated to be 2.85%
Energy required for the cantilever effect is large as compared to energy required for the ignoring the cantilever effect
so that calculation made by ignoring cantilever effect is correct and also the loss in transmission more than ignoring
the cantilever effect
CONCLUSION A spur gear model was developed to predict the overall efficiency of a gearbox system.The analysis showed that the
strain energy losses are highly dependent on the rotational speed of the gear wheels and is insignificant for speeds
below 1000 rpm. The rolling friction loss was found to contribute a small percentage of the total power loss in the
system. The rolling friction losses depend on the position of contact of the mating gear teeth and reduce with increased
load.
The efficiency of gearbox system is varies from 92%,95%,98%,99% by considering contact losses there is 1% loss
in transmission contact deformation this big problem in transmission .
The additional energy is required to overcome the deformation of gear pair contact and Force required overcoming
the friction.Loss of energy to predict efficiency Softer gear the material larger is loss in transmission and harder the
material Gear material lesser losses in transmission. The Young’s modulus of elasticity is more percent loss in energy
is less and Youngs modulus of elasticity is less percent loss in energy is more. The speed of rotation of gear is more
therefore percent loss of energy is less and Speed is less percent in loss of energy is more.

[Lahane*, 5.(1): January, 2016] ISSN: 2277-9655
(I2OR), Publication Impact Factor: 3.785
http: // www.ijesrt.com © International Journal of Engineering Sciences & Research Technology
[40]
FUTURE SCOPE After the successful completion of the current project, the recommendations to improve
the current results and scope for the future work are as follows.
[1] Use the full version software to mesh the contact model. Mesh near the contact region using very fine
elements, to avoid the high magnitude errors at smaller stick zone sizes.
[2] Mesh the contact model as symmetric near the contact region, and solve the model to observe the symmetry
in stick zone results.
[3] Resistant to motion is due to
[4] a. Friction b. Additional deformation
[5] Strain energy loss affects efficiency of a gear unit means that it produces the highest possible output power
for a given input power. The energy lost in the process manifests itself in the form of heat, for example in
bearings, O-ring seals or gear wheels. As gear efficiency increases, its temperature will go down. This has a
number of positive effects: a decreasing temperature not only extends the oil life, but the service life of seals
as well. This in turn reduces the risk of leakage. Another benefit is that fans or air conditioners in production
facilities might be switched off, which is another contributor to lower energy costs and a better CO2 balance.
REFERENCES [1] Darle W. Dudley, ‘Gear Handbook: The design, manufacturing applications of gear’, 1965.
[2] Darle W. Dudley, ‘Handbook of practical gear design’, 1972.
[3] Maitra G.M., “Handbook of Gear Design”, Tata McGraw-Hill Company, India, New Delhi, 1997.
[4] Tengjiao Lina, H. Oub, Runfang Lia,“A finite element method for 3D static and dynamic contact/impact
analysis of gear drives Comput”. Methods Applied. Mech.Engg.196 (2007) 1716–1728.
[5] T.J.R. Hughes, R.L. Taylor, J.L. Sackman, A. Curnier, W. Kanoknulchai,“ A finite element method for a
class of contact-impact problems”,Comput. Methods Appl”. Mech. Engg. 8 (1976) 249–276.
[6] K. Umezawa, J. Ishikawa, Deflection due to contact between gear teeth with “finite width, Bull.JSME 16
(97) (1973).
[7] ERRATA, NASA TP–1622 “Spur-Gear-System Efficiency at Part and Full Load” Neil E. Anderson and
Stuart H. LoewenthalFebruary 1980.
[8] HaiXu, B.S., M.S.E., M.S. By The Ohio State University 2005, “Development of a Generalized Mechanical
Efficiency Prediction Methodology for Gear Pairs”.
[9] Vaishya, M., Houser, D. R., “Modeling and Analysis of Sliding Friction in Gear Dynamics”, Proceedings of
DETC’00, ASME 2000 Design Engineering Technical Conferences and Computers and Information in
Engineering Conference, Baltimore, Maryland, September 10-13, 2000.
[10] Hochmann, D., Houser, D. R., “Friction Forces as a Dynamic Excitation Source in Involute Spur and Helical
Gearing”, Proceedings of DETC’00, ASME 2000 Design Engineering Technical Conferences and Computers
and Information in Engineering Conference, Baltimore, Maryland, September 10-13, 2000.
[11] Reuleaux, F., “Friction in Tooth Gearing”, Transactions of the ASME, Vol. VIII, pp. 45-85, 1886.
[12] Martin, K. F., “A Review of Friction Predictions in Gear Teeth”, Wear 49, pp. 201-238, 1978.
[13] Yada, T., “Review of Gear Efficiency Equation and Force Treatment”, JSME International Journal, Series
C, Vol. 40, pp. 1- 8, 1997.
[14] H. Xu and A. Kahraman, “Prediction of Mechanical Efficiency of Parallel – Axis Gear Pairs,” Transactions
of ASME, vol. 129, pp. 58–68, 2007.
[15] FakherChaari, Manel Ben Romdhane, WalidBaccar, TaherFakhfakh, Mohemendhaddar “Mechanics
Modeling and Production research “Unit National School of Engineers of SfaxBP 1173 - 3038 – Sfax –
TUNISIA.
[16] M. Vaishya and R. Singh, “Strategies for Modeling Friction in Gear Dynamics,” Journal of Mechanical
Design, vol. 125, pp. 383–393, 2003.
[17] N. E. Anderson and S. H. Loewenthal, “Efficiency of Non-Standard High Contact Ratio Involute Spur
Gears,” Tech Rep., NASA Lewis Research Center, 1984.
[18] P. Heingartner and D. Mba, “Determining Power Losses in the Helical Gear Mesh,” Gear Technology, pp.
32–37, 2005.
![IJESRT /Archives-2015/January-2015/104_AN... · http: // © International Journal of Engineering Sciences & Research Technology [713] IJESRT INTERNATIONAL ... Table 1: 5S tools Japanese](https://img.pdfslide.net/doc/110x75/5b7b9e307f8b9a483c8e7d2c/archives-2015january-2015104an-http-international-journal-of-engineering.jpg)


![IJESRT /Archive-2016/June...Lin et al., [27] obtained design information for processes involving mass transfer, including many electrochemical processes. Transfer rates from a flowing](https://img.pdfslide.net/doc/110x75/6113aa3920727000f065d83e/archive-2016june-lin-et-al-27-obtained-design-information-for-processes.jpg)


![IJESRT /Archive-2016/April-2016/68_EFFECT OF... · [Deepali*, 5(4): April, 2016] ISSN: 2277-9655 (I2OR), Publication Impact Factor: 3.785 http: // © International Journal of Engineering](https://img.pdfslide.net/doc/110x75/5b52380b7f8b9a7b648d0242/archive-2016april-201668effect-of-deepali-54-april-2016-issn.jpg)

![IJESRT /Archive-2016/June-2016/11... · 2018-10-11 · [Laad* et al., 5.(6): June, 2016] ISSN: 2277-9655 IC™ Value: 3.00 Impact Factor: 4.116 http: // © International Journal of](https://img.pdfslide.net/doc/110x75/5ea39260ea729c19fe1a0d6e/archive-2016june-201611-2018-10-11-laad-et-al-56-june-2016-issn.jpg)


![IJESRT /Archive-2017/March-2017/85.pdf · [Banerjee* et al., 6(3): March, 2017] Impact Factor: 4.116 IC™ Value: 3.00 CODEN: IJESS7 ... Luggage paradox, no prior scientific paper](https://img.pdfslide.net/doc/110x75/5f63d75e83268c481f238034/archive-2017march-201785pdf-banerjee-et-al-63-march-2017-impact-factor.jpg)