Embed Size (px)
Citation preview

ARCHIVED - Archiving Content ARCHIVÉE - Contenu archivé
Archived Content
Information identified as archived is provided for reference, research or recordkeeping purposes. It is not subject to the Government of Canada Web Standards and has not been altered or updated since it was archived. Please contact us to request a format other than those available.
Contenu archivé
L’information dont il est indiqué qu’elle est archivée est fournie à des fins de référence, de recherche ou de tenue de documents. Elle n’est pas assujettie aux normes Web du gouvernement du Canada et elle n’a pas été modifiée ou mise à jour depuis son archivage. Pour obtenir cette information dans un autre format, veuillez communiquer avec nous.
This document is archival in nature and is intended for those who wish to consult archival documents made available from the collection of Public Safety Canada. Some of these documents are available in only one official language. Translation, to be provided by Public Safety Canada, is available upon request.
Le présent document a une valeur archivistique et fait partie des documents d’archives rendus disponibles par Sécurité publique Canada à ceux qui souhaitent consulter ces documents issus de sa collection. Certains de ces documents ne sont disponibles que dans une langue officielle. Sécurité publique Canada fournira une traduction sur demande.

Supply and Services Canada
Bureau of Management Consulting
Approvisionnements et Services Canada
Bureau des conseillers en gestion
10
1 1 1
HV 8931 .C2 C64 1983 v.1
CORRECTIONAL SER v'ICE CANADA
INDUSTRIES PROGRAM
WAREHOUSE REQUIREMENTS FOR
CORCAN PRODUCTS

the bureau of management consulting agency of the department of supply and services is an
rt -P z
1/, Gee rite document does nolbelong to ttte Or own.
Proper authotee Mee °bee 1‘\e eee
aviï 'meted use.
t-es
des deer présee document n Betterment
as
éÉ.tat.Ioute ueron contenu ctu orésent
docee ee
ewe Oaeell P5 aule\g.
Project No. 2-3789
July 1983
LrAY (7.:E iH 1 I
CI: CANADI\
F" le BULtOTHÈOUE\ DA
MINEITC.Pd.s: DU SOLLICITEUR
GÉNERAL. DU CANADA
oT A, ON CANADA (1 1¼ G1
/CORRECTIONAL SERVICE CANADA
INDUSTRIES PROGRAM
WAREHOUSE REQUIREMENTS FOR
CORCAN PRODUCTS/

5 5
6
TABLE OF CONTENTS Page Appendix
Reference
Executive Summary i
Introduction iii
CHAPTER I BACKGROUND
A. Mandate and Objectives - Industries Program 1
B. Financial Goals 1 C. The Range of CORCAN
Products 2 D. CORCAN customers 3 E. Organization 3
CHAPTER II THE CORCAN BUSINESS PROCESS
A. Planning B. Production C. Storage, Distribution
and Inventory Control
CHAPTER III THE ASSIGNMENT
A. Project Description 7 A B. The Conduct of the
Assignment 7 B C. The Workplan 8
CHAPTER IV PHASE I RESEARCH
A. Documentation 9 C B. Visits 9 D,E,F,G,H C. Questionnaires 10 I,J
CHAPTER V PHASE 2 ANALYSIS
A. General 12 B. Work in Progress 12 C. Raw Materials 13 D. Finished Goods 13
CHAPTER VI PHASE 3 DEVELOPMENT OF SPACE CALCULATION METHOD
A. Finished Goods 15 Methodology # 1 16 K Methodology # 2 17 L
B. Raw Materials 17 M C. Summary 21
Conclusions and Recommendations 23

APPENDICES
(These are bound separately from this report)
A. Project Proposal
B.
Bi. Progress Report - June 18th 1982 B2. Progress Report - July 5th 1982 B3. Progress Report - July 16th 1982 B4. Progress Report - August 6th 1982 B5. Progress Report - September 3rd 1982
C. Review of Information Needs, Services and Deficiencies
D. Visit Report - Ontario Region
E. Visit Report - Quebec Region
F. Visit Report - Kingston Penitentiary
G. Visit Report - Joyceville Institution -
H. Sources of Information
I. Questionnaire
J. Review and Analysis of Returned Questionaires
K. Finished Goods Methodology # 1
L. Set of Assumptions
M. Raw Materials' Methodology
Computer Printout for Raw Materials (bound separately)

-i- •
EXECUTIVE SUMMARY
The Correctional Service of Canada 1982/83 Estimates included in its goals that the costs of inmate incarceration should be defrayed by revenue resulting from inmate employment. The Director General, Inmate Employment responded to this by issuing a policy and directives document in July, 1982 stating that the objective ce the CORCAN program would be to maximize production. Industries Division was responsible for the development of sales forecasts for the period 1982-1986 which are the bases of an expanded manufacturing program to be delivered by the participating institutions.
Increases in output from the manufacturing plants can be expected to generate the need for more storage space so Industries Division initiated a project to determine storage space requirements for the five year period 1982-1987.
Three types of contents were identified for consideration when determining storage space needs; raw materials; work in process and; finished goods. The space needed for raw materials and finished goods are the main subjects addressed in this study. There are two reasons for this. The first is that a study of space required for work in process would require a survey of the manufacturing processes in all the manufacturing locations. The second is that a high proportion of storage space will be occupied by raw materials and finished goods, particularly the latter.
TWo main sources of data were the four year sales forecast and the institution manufacturing plans. The former was used to develop finished goods storage space while the latter was used to calculate raw material storage space. Other documented sources of information were the Bills of Material and the Price List. Visits were made to two Regional warehouses, Ontario and Quebec, and to two institutions, Kingston Penitentiary and Joyceville. Information was requested from all Regional HQs and institutions by a questionnaire. The response, however, to these requests was limited.
Methodologies have been developed and used to calculate space requirements in East and West warehouses for storing finished goods based on the sales forecast for 1982-1983. A methodology employing a mini computer has been developed for calculating the space requirements for raw materials to meet the manufacturing plans drawn by each institution. These have been synthesized to produce Regional storage space needs but only apply to the 1982/83 year since manufacturing plans exist only for this year.
The space required for finished goods in East warehouses in 1982/83 is estimated at between .40 and 1.00 million cubic feet. This variation depends upon the stock turnover rate and the difference between the expected and the actual customer demands. In 1986/87 the space requirements will have increased to between .86 and 2.04 million cubic
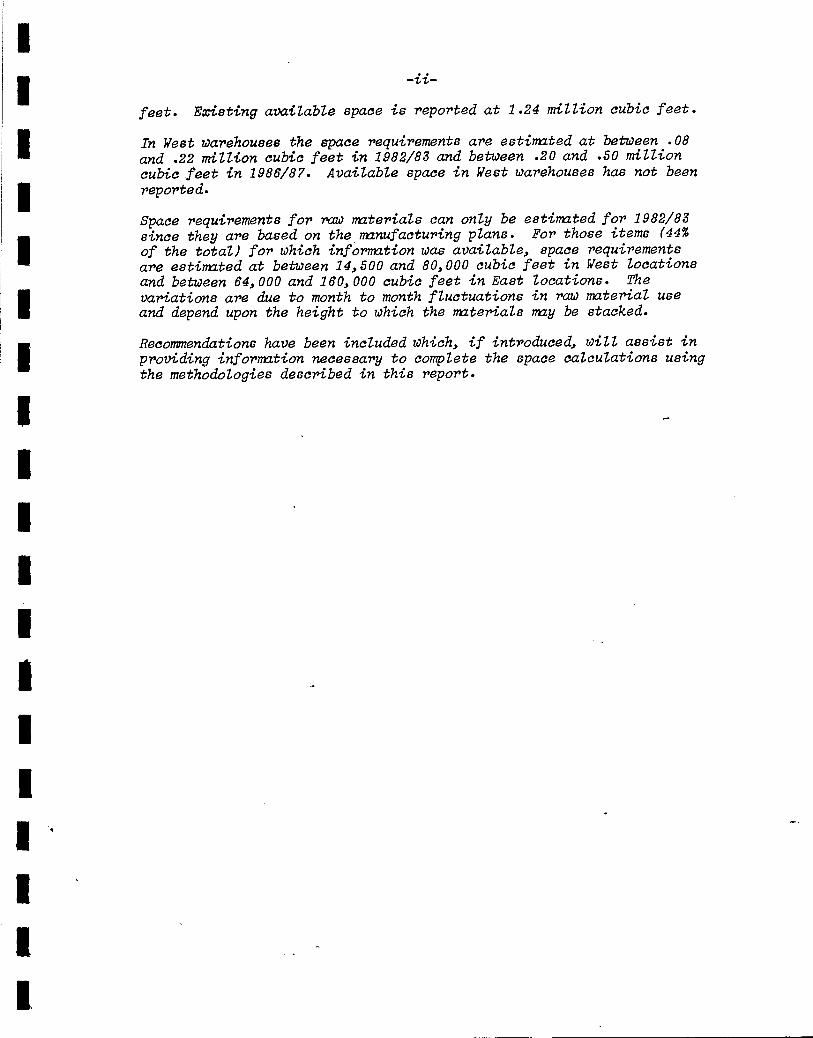
feet. Existing available space is reported at 1.24 million cubic feet.
In West warehouses the space requirements are estimated at between .08 and .22 million cubic feet in 1982/83 and between .20 and .50 million cubic feet in 1986/87. Available space in West warehouses has not been reported.
Space requirements for raw materials can only be estimated for 1982/83 since they are based on the manufacturing plans. For those items (44% e the total) for which information was available, space requirements are estimated at between 14,500 and 80,000 cubic feet in West locations and between 64,000 and 160,000 cubic feet in East locations. The variations are due to month to month fluctuations in raw material use and depend upon the height to which the materials may be stacked.
Recommendations have been included which, if introduced, will assist in providing information necessary to complete the space calculations using the methodologies described in this report.

I.
1
1
INTRODUCTION
A study was authorized by the management of the Industries Division, Inmate Employment Branch, Correctional Service of Canada to determine storage space requirements over the five years 1982-87. This storage space will be to house raw materials, work in process and finished goods produced in Correctional Service of Canada (CSC) institutions.
The information necessary to develop these storage needs was judged to be available in a five year marketing plan, institution manufacturing plans, and in the Price List and Bills of Material. This information was planned to be augmented by visits to selected warehouses and institutions and by requesting information through the circulation of a questionnaire.
Interviews were planned with personnel representing customers of the products, representatives of the sales force retained to market the products, and CSC managers concerned with the program.
The study was conducted through three phases, Phase I, Research of Information, Phase 2, Analysis of the Information and Phase 3, Development of Methodologies and Cubic Space Requirements.
This report has been constructed so that the narrative is presented in as few pages as possible. Detail is contained in the appendices which have been bound separately under two covers. One contains Appendices A to M while the other contains the computer printouts relating to Raw Material quantities.

- 1 -
CHAPTER I
BACKGROUND
A. Mandate and Objectives - Industries Programs
The Inmate Employment Branch of the Correctional Service of Canada (CSC) is responsible for the planning and execution of three main programs involving the employment of inmates of federal correctional institutions. The three programs are Agribusiness, Education and Training, and Industries.
The Industries program, which results in producing a range of products under the trade name of CORCAN, is operated in twenty-two federal institutions. The Director General, Inmate Employment, has published a Branch Directive - "CORCAN Policies & Direction - M.M. David, 21 July 1982" - stating:
"The objective of CORCAN's industrial and automated document processing service sectors shall be to maximize production."
and goes on further to state that: "It is recognized that the inmate employment concept as a whole may have other objectives from time to time, for example, inmate training, skills transfer, inmate employability, and the work ethic. However, for CORCAN, any such achievements shall be as a by-product of its main objective."
CSC management hold concerns over the efficient operation of the Industries program. A further statement in the 1982/83 Estimates, Section IIC, p. 31 qualifies this by stating that: "A major concern for this activity is to continue to improve CORCAN's ability to contribute more to reducing the operating costs of the Service. This will be effected by revitalizing industries with a focus on iMproved marketing, manufacturing, staff training, inmate productivity, and increased employment of inmates."
B. Financial Goals
In response to the intents stated in the corporate objectives for CORCAN, a four year sales forecast was developed for the period 1982-1986. The increase in output to meet the forecast sales can be expected to exert an increase in the demand for storage space for raw materials (including packaging materials), work in process of manufacture, and finished products.
A major indicator of program performance is revenue. In 1980/81, revenues from the Industries program were $7,483,000

woe 2
235 58
121
86 48
106
98
3 18
- 30% greater than the forecast estimate. - and in 1981/82 were $8,091,000 - 20% lower than the forecast estimate (Ref. 1981-82 Industries Division Annual Report.) The forecast revenues for the four year period 1982-86 are:-
1982/83 - $11,700,000 1983/84 - $12,900,000 1984/85 - $14,450,000 1985/86 - $16,000,000
(Industries Employment Branch publication "CORCAN° Policies & Direction - 21 July 1982)
The revenues tabled above are constant (1982) dollars and do not include any allowance for future inflation due to rising costs. The difference between 1982/83 and 1985/86 revenues represents an increase in sales (and therefore in production) of 36.75%.
C. The Range of CORCAN Products
There are nine groups of CORCAN products. In 1981 the CORCAN catalogue listed seven hundred and seventy three product items, but this number was reduced to one hundred and ninety one as listed on the 1982 - 1986 sales forecast. The reduction of products by product group is as follows:
Product Group
Group 100 - Furnishings Group 200 - Post Office
Equipment Group 300 - Recreation &
sports equipment Group 400 - CSC -products Group 500 - Maintenance
equipment Group 600 - Storage &
packaging products Group 700 - Specialized
equipment Group 800 - Modular housing Group 900 - Services
TOTAL
1981 1982/86 Catalogue Sales Forecast
89 10
11
41 3
5
24
1 7
773 191
The sales forecast information refers to products to be marketed nationally whilst the catalogue lists products which

- 3 -
may be marketed both nationally and regionally. Of the seven hundred and seventy three product items listed in the catalogue, four hundred and twenty four were designated as "national" products. The one hundred and ninety one product items listed in the sales forecast include some product items which were previously designated as "regional" products in the catalogue.
D. CORCAN Customers
The customer groups of CORCAN products are:
o Correctional Service of Canada o Government of Canada departments, Crown
Corporations and Agencies o Provincial government departments and Agencies o Municipal government departments and Agencies o Non profit organizations.
Supply & Services Canada (SSC), the appointed purchasing agent for most federal government departments and agencies is the biggest customer of CORCAN products. It is estimated by Industries Division managers that between fifty & fiftyfive per cent of CORCAN revenues result from sales to Federal Government departments through SSC.
SSC purchasing policy as laid down by the Government of Canada requires that the award of contracts to supply materiel for use in Canadian government controlled operations shall be distributed among those suppliers who can meet the terms of the contract. For the types of product manufactured through the CSC Industries program, SSC purchasing policy at present limits the share of the SSC market to 10% per supplier. The CSC product which is an exception to this quota is shelving, - CSC product sub-group 140. At present CSC provides 50% of SSC shelving requirements and this share of the market could, according to SSC authorities, be increased. However, to attain the increase in revenue goals set for the Industries program CORCAN operation, there will need to be an increase in sales to the customer groups other than the Government of Canada departments and agencies.
E. Organization
The Director General, Inmate Employment is responsible to the Senior Deputy Commissioner, CSC, and directs the overall execution of programs delivered through five Divisions. These Divisions are; Agribusiness; Education and Training; Industries; Special Employment; and Systems and Administration.

The Industries Division consists of two sections, Manufacturing, to include Customer Service, and Marketing and Sales, to include Product Design and Development.
The Industries program is operated in twenty two institutions located throughout Canada. The manufacturing plants in each institution are managed by an Assistant Warden, Industries (AWI), or a production supervisor. The institutions are grouped Regionally, there being five Regions, Atlantic, Quebec, Ontario, Prairie and Pacific. The Industries program in the Quebec, Ontario and Prairie Regions is managed by a Regional Manager, Industries (RMI) while in the Atlantic and Pacific Regions the Program is managed by a Regional Manager Inmate Employment (RMIE). These managers report to the Director, Industries Division, NHQ, for functional direction and guidance, and to the Regional Deputy Commissioner for administration.
CORCAN sales are arranged through a non-government - organization, - TETRAD - with whom CSC has contracted. The terms of the contract include a scale of commission to be paid to TETRAD on the volume of sales. The TETRAD organization reports to the Director, Industries Division. The TETRAD organization head office is in Ottawa and employs regional representatives in each of the five CSC Regions where close contact between the TETRAD representative and the RMI occurs.

- 5 -
CHAPTER II
CORCAN BUSINESS OPERATING PROCESS
In this chapter the stages of Planning, Manufacturing, Storing and Controlling the outputs from the Industries Division Programs are discussed.
A. Planning
The CORCAN business cycle begins in August/September when a tentative sales forecast for the coming year is prepared based on the marketing plan and potential customer demands identified by TETRAD. Two estimated sales figures are given for each product, one for East and one for West. The East figure is for the East Regions, Ontario, Quebec and Atlantic, and the West figure for the Prairie and Pacific Regions. The sales forecasts are circulated to the RMIs, who, review the list with their AWIs, selecting those products for which the institutions have manufacturing capability and in numbers which can be met by the institution's capacity.
In November/October, the RMIs, and the Industries Division and TETRAD managers meet in Ottawa to review the Regions' proposals for manufacture in the coming year. Following discussion and possible amendments, the sales forecast and responding broad manufacturing plan will be agreed.
Upon returning to their Regions, the RMIs in consultation with the AWIs, produce detailed manufacturing plans showing the intended production of products during each month of the coming year.
During the manufacturing year, if the actual manufacturing pattern deviates from the plan, amendments to the plan are sent from the RMI to National Headquarters (NHQ) and to TETRAD. In June each year, the RMIs, Industries Division managers, and TETRAD managers again meet in Ottawa to review the year's progress, to consider any changes to the sales forecasts and the manufacturing plans and to agree plans for the final six months of the year.
B. Production
The initiation of a production run in some institutions is made by the RMI who raises a work order and transmits this to the AWI as an instruction to commence production. In other institutions the AWI through reference to the institution manufacturing plan raises the work order. Raw material acquisition is made by the AWI following an allotment of funds in the case of some institutions while in others,

6
following a regionally prepared bulk order, the AWI draws on the purchased material. There is no one method for raw material acquisition and subsequent initiation of a production run, practiced by all Regions and all institutions.
C. Storage, Distribution, Inventory Control
With most products manufactured and packaged (when necessary) at the institutions, the completed order is transported to the Regional warehouse for finished goods and stored. In the Quebec Region, a sample of the consignment is checked for quality before being accepted into the warehouse. In Ontario some products e.g. mail bags and duffle bags, are shipped from the institution to the customer's premises, while in the Quebec Region, the goods are transported via the Regional warehouse where they are checked for quality before proceeding to the customer's premises.
Orders for delivery to customers are raised by TETRAD and forwarded to the Regions selected for supply. This in turn, may initiate a work order being raised by the RMI, or, if the product is stocked, will require the warehouse staff to withdraw the finished products from stock and ship them to the customers. In some cases, TETRAD will send a commitment order to the Region. This reserves a stated amount of a product for future delivery to a customer.
Inventory records are held in the Regional warehouses showing intake of products into the warehouses from the manufacturing institutions, shipments of products from the warehouse to the customers, and stock levels of products stored in the warehouse including those products committed to customers but held awaiting shipment. Each week the information concerning stock movement and current inventory state is entered into the EDP Inventory system by the Ontario, Quebec and Pacific Regions using a remote Terminal. Industries Division managers and TETRAD managers are thus informed of the state of inventory and goods traffic in those Regions. The Atlantic and Prairie Regions report the information manually each month.

•■■ 7 ■■••
CHAPTER III
THE ASSIGNMENT
The description of the project's objectives, scope and required results are described in this chapter together with the method of administering the project and the work plan.
A. Project Description
The study was authorized to assist the Industries Division management to determine the warehouse capacity that will be required in five years time. (See Appendix A-Project Proposal) The scope of the study was to include raw materials, packaging materials, work in process and finished goods relating to the CORCAN products produced through the Industries program in twenty two participating institutions. These institutions are divided among five Regions, each Region (excluding the Prairie Region) operating a Regional warehouse for the storage of CORCAN products.
The objective of the assignment was to estimate/calculate Industries Division warehouse space requirements for raw materials, packaging materials, work in process and finished goods based upon the Industries Division five year Marketing Plan and the decision rules and assumptions to be developed during the assignment.
The study was to develop two different methodologies for determining, through estimation or calculation, the warehouse space requirements for CORCAN produts.
B. The Conduct of the Assignment
The client was the Chief, Manufacturing, Industries Division, Inmate Employment Branch, Correctional Service of Canada. It was planned that throughout the execution of the assignment, progress reports would be made by the consultants to the client and other Industries Division managers concerned with the assignment. These progress reports were made at frequent intervals (approximately monthly) by both a written and verbal presentation. Copies of the progress reports are shown at Appendices Bi to B5.
The purpose of these progress reports was to obtain approval by the client of the work carried out during the reporting periods, to make known to the client any problems encountered and any action required to remedy the problems, and to obtain the client's direction and guidance to further the progress of the assignment.

■■•• 8 ■■•
C. The Work Plan
The project was conducted through three broad phases, each phase consisting of a number of items of work content. These constituted the work plan for the project and were presented at the June 1982 meeting of the RMIs and NHQ managers. The work plan was reviewed and accepted.
The three phases of the project and their work content items are shown below. Subsequent chapters of this report are devoted to these phases with the work content items arranged either singly or jointly as sections of the chapter.
Phase 1 - Research - Background - Documentation and logistics - Interviews - Visits - Questionnaires
Phase 2 - Analysis - Finished products information - Raw materials information - Work in process information - Regional and Institution data
Phase 3 - Development of space calculation methods.

- 9 -
CHAPTER IV
PHASE I - RESEARCH
In this chapter the sources of information and the methods used to obtain this information are discussed. Included are the documentation found to be available, accounts of visits to locations where the Industries Program is being operated and the design and distribution of questionnaires.
A. Background and Documentation
The initial stages of this phase consisted of gathering such background information as that obtained from the Current Estimates, policy papers, and project definition documents. More detailed information was then sought in order to determine the scope and content of the project, for example, lists of product quantities to be made, physical volumes etc.
To determine the storage space requirements for goods the following basic information is needed:
a. The cubic volume of the quantities of each product already held in storage.
b. the cubic volume of the quantities of each product entered into storage and the date on which they were entered.
c. The cubic volume of the quantities of each product leaving the storage area and the date on which they left.
A matrix showing the information needs, the information available, sources, and deficiencies are shown at Appendix C to this report.
B. Interviews and Visits
Visits were made to the Ontario and Quebec Region warehouses to obtain and discuss Regional managers' views on CORCAN products storage. Two institutions were also visited, - Kingston Penitentiary, and Joyceville Institution. The AWIs or their representatives arranged and conducted tours of their manufacturing units and storage facilities, and explained and discussed the systems operated in these institutions. Brief reports on these visits are shown at Appendices D, E, F, and G.
Several authorities were interviewed during this research phase. A list of those interviewed is shown at Appendix H.

- 10 -
There are several differences between the Ontario and Quebec regional warehouse operations and between the systems operated in the institutions, all having a bearing on storage and warehousing requirements. For example, bulk purchase of raw materials is being pursued in the Ontario Region but is not being considered in Quebec. Quality control of raw materials and finished products is practiced in the Quebec warehouse and institutions, but is not being practiced in Ontario.
A logistical report is sent by the Quebec, Ontario and Pacific Regions to NHQ each week by terminal, while the Atlantic and Prairie Regions report monthly by letter. These reports state the transactions involving goods taken into Regional warehouses from the manufacturing institutions, dispatched to customers from the warehouses and commitment orders reserving goods in stock for dispatch at a later date.
This information is historical and has not been captured for a sufficiently long period to allow trend analysis to be made and used for such purposes as may require capacity analysis.
C. Questionnaires
The visits to the Regional warehouses in Quebec and Ontario revealed differences in the operating styles of the two Regional managers of the Industries program. These influenced the operating methods of the AWIs in the institutions, and led to differences in methods and controls practiced in the Regional warehouses. The visits to the two institutions, Kingston Penitentiary and Joyceville, emphasized the differences in space availability and management methods used in the institution industries operations.
The Prairie Region does not operate a Regional warehouse so all materials and finished products must be stored in institution or nearby premises.
It was necessary to obtain information concerning the dimensions and limitations of available storage space, the adequacy of the space to meet future volumes, the practices followed when ordering raw materials, and the control systems used in institutions and Regional warehouses. This information, when considered with the required space calculated from the sales forecast data, would assist in determining the adequacy of storage facilities owned or rented by CSC for the four year period covered by the sales forecast.

- 1 1 -
Since no more than the four visits mentioned previously were authorized, questionnaires were designed and distributed to all institutions and Regional warehouses (See Appendix I). An account of the design rationale, and the results obtained from the completed questionnaires are shown at Appendix J to this report.

- 12 -
CHAPTER V
PHASE 2-ANALYSIS
In this chapter the special considerations and factors of the three types of items for which storage space is required are identified and discussed. The three types of items are; Work in Process, Raw Materials and Finished Goods.
A. General -
The first step in the analysis of the information obtained during the research stage was to consider the items to be stored and to separate these into groups for which special storage arrangements were required.
There are three such groups, raw materials, work in process, and finished products. At present, raw materials and work in process require storage at the institutions, while finished goods are stored in the Regional Warehouses.
Finished goods require significantly more space than raw materials and work in process and because of this emphasis was placed on finished goods space requirements by the consultants. The possibilities of raw materials being obtained through bulk purchasing, - a method being developed and tested by Industries program managers in the Ontario Region - indicated that emphasis should also be made on raw materials space requirements by the consultants.
B. Work in Process •
Work in process space requirements depend almost exclusively upon the management of the workshops in the different institutions. Their decisions concerning work order quantities, time balance between operations, operation sequence etc. can greatly influence space requirements for work in process. In addition, the space allocated at the institutions is at a premium. Several of the institutions reported that they were experiencing shortage of space or expected to do so in the future. It is the opinion of the consultants that the determination of space required for work in process is sufficiently complex to warrant a separate study and has not been dealt with at any length during this assignment.
Since the batch method of processing work is practiced in the majority of cases within the institutions, it can be reasonably assumed that space for work in process is required at each operation work place. Space is required adjacent to

- 13 -
the operation for items on the verge of being processed, and adjacent to the operation for items completed. As a rough guide, space equal to twice that occupied by each operation work place may be estimated as space required for work in process.
Two sub-studies have been conducted, the first dealing with raw materials and the second with finished goods. This report will as far as possible address the two groups separately.
C. Raw Materials
There are several reasons for carrying stocks of material. These reasons may be grouped under the headings, Sales oriented, Production oriented and Finance oriented.
Material stocks held to safeguard against shortages due to supplier based problems e.g. strikes, plant breakdowns etc., will ensure that customer orders are met. Production runs can also be started with a minimum of delay if material stocks are held. This will allow the manufacturer to accurately schedule production runs for the efficient use of machinery and equipment, minimizing machine "down" time and operator waiting time. Any such delays are reflected by an increase in operating costs.
D. Finished Goods
Finished goods warehouse space requirements may be considered from three different points of view, each belonging to a separate function of the business process. The first, by Sales, requires that a stock of products is held sufficient to meet the immediate demand by customers. The second, by Production, requires that space is available to store the outputs of long production runs, economic as far as the manufacturing process is concerned, and to store outputs of products which the manufacturer deems convenient to make at the manufacturer's choice of time. The third, by Finance, sees stock as tied up capital, and warehouse space and labor as features which do not contribute to revenue but which add to the product and program costs.
The most influential customer supplied from CSC warehouse stocks by reason of sales volume is SSC. The current SSC procurement practice includes providing the supplier with a commitment to purchase an approximate quantity of a product during the year and placing actual orders for delivery every three months, giving a lead time to the supplier of two to three weeks. Faced with this situation, CORCAN has no option

- 14 -
but to build up and carry stocks in readiness to meet the customer's orders.
Whether stocks are held to suit the Sales viewpoint or the Production viewpoint depends upon the business principle adopted by CORCAN. Is the organization operation designed to suit the manufacturing group, who decide what to produce, how many, and when, with the Sales group expected to find customers? Or, is the organization to follow a marketing management approach and develop a manufacturing plan to meet a sales forecast of which products will be in demand, in what quantity, and when they are needed? With a marketing management approach the sales forecast will have been developed with an understanding of the manufacturers capability and capacity.
Since a sales forecast for the period 1982-1986 has been developed, it is assumed that the organization is to follow a marketing management approach. Discrepancies between the manufacturing plans and the sales forecasts, suggest however, that the manufacturers are not committed to this approach. Until this difference is resolved, accurate finished goods storage space requirements cannot be calculated.

- 15 -
CHAPTER VI
PHASE 3 - DEVELOPMENT OF SPACE CALCULATION METHODS
Two methodologies designed to calculate finished goods storage space are discussed in this chapter. Seven options for the storage location of raw materials are also described together with a methodology for use in the calculation of raw materials storage space.
A. Finished Goods
Three methodologies for the calculation of warehouse space required for finished goods were considered in depth during the course of the study. Two of these were developed and are presented in this report.
The initial approach taken by the consultants was to attempt to correlate the manufacturing plans with the sales forecast. The manufacturing plans quote planned monthly quantities of each product and can be used to determine the monthly quantities delivered to Regional warehouses. The sales forecast, however, only quotes yearly quantities of each product to be supplied from warehouses in either the East or West geographic divisions.
No information was discovered by the consultants which would allow the East and West forecasted sales to be allocated to each of the five Regions. Also, the one customer ordering pattern which would provide the means of distributing the yearly sales forecast quantities at periods throughout the year was SSC, and their estimate was for dollar purchases rather than product quantities. The number of assumptions to be made, and their high error implication gave sufficient grounds for abandoning this first method. This method was to correlate the cubic volumes of goods entering and leaving the warehouses, using the information contained in the manufacturing plans and the sales forecast. Although abandoned, the logic of the method is considered to be the most sound of the three methods considered.
The two methods developed and presented in this report are based on calculations which allow the cubic volume of finished goods to be equated to sales dollar values. These two methods are:-

- 16 -
1. Methodology #1 - Converting the cubic volumes developed from the quantities quoted on the sales forecast to sales dollars.
The sales forecasts contain the estimated sales quantities of each product per year from East and West division sources. The forecast quantities can be converted to cubic volumes using the product or package dimensions or the product cubic volumes given on the Bills of Material or the Price List.
Group 100 products have been chosen to represent the whole range of CSC warehoused finished goods since Group 100 products represent 53% of the value of stored CSC finished goods. Furnishings (Group 100) sales are estimated at $2.32 million, while Furnishings, Post Office Equipment, Maintenance Equipment and Specialized Equipment which together constitute Warehoused finished goods are estimated at $4.37 million. (Schedule 1 - Industries Division 1981-82 Annual Report). The data for calculating cubic volumes of products are also more complete for Group 100 products than for others. The sum of the individual product cubic volumes provides yearly total cubic volumes for the East and West divisions.
These totals can be converted to dollar values by multiplying by the standard dollar values per cubic foot calculated for East and West divisions. The standards are $14.0 and $10.6 respectively, differing due to variations in product mix and product quantities forecast for the two divisions. The development of these standards is shown at Appendix K. Since the total dollar values for East and West represent 53% of the value of all the stored goods, the total value can now be calculated.
Customer demand is represented by SSC demand patterns estimated at 25%, 15%, 20%, and 40% of the year's dollar purchases for the 1st, 2nd, 3rd, and 4th quarter of the year. Although SSC provide an estimate of the total amount that is intended to be spent on CSC product purchases, the actual purchases may be either more or less than the forecast amount. For CSC to be sensitive to the possible demand variation, consideration must be given to increasing stock or reducing stock levels. The space requirements for both high and low stock levels must be calculated to assess either the low utilization of available space or the need for additional space.
The amount of stock to be carried depends upon the reliability of goods delivery from the manufacturers and upon customer's level of conformity with the sales forecast. Low stock levels run the risk of being unable to meet customer demand, while high stock levels risk stocked products becoming obsolete, incur storage costs and tie up capital. Measures of stock levels are in terms of turn over rates, eg. twice a year stock turn over means carrying six months sales, three times a year, four months sales etc. Calculation of

- 17 -
monthly stock levels to be held based on various turn over rates have been converted to illustrate different space requirements, and are shown at Appendix K to this report.
The stock held in stores based on turn over rate is mainly to safeguard against unexpected customer demand. In addition, to safeguard against delays in delivery of goods from the manufacturing institutions, safety stocks of products must be held.
In the example of this method, described in detail at Appendix K of this report, variations to customer demand forecast of 125% and 75% have been applied to the quarterly purchase estimates, turn over rates of twice, three times, and four times per year have been calculated, and a one month safety stock has been estimated.
The calculations so far are in dollars. These can be converted to cubic feet by dividing by the dollar per cubic foot standard referred to earlier. The cubic volumes are for the space occupied by finished goods in storage. To this must be added space for gangways, marshalling and receiving areas etc. This non storage space is estimated as being equal to the storage space. Together, the storage space plus non storage space equals the total warehouse space required for finished goods.
2. Methodology #2 - Converting an estimated or known sales value of finished goods to cubic space required to store the goods.
Upon occasion, it is likely that management will be called upon to make a quick decision which involves an assessment of warehouse space availability for additional requirements. As, for example, in the case of deciding to carry more stock than was previously planned. If the sales value of the stock is known, multiplying this by the standards referred to in Method # 1 - ie. $14.0 per cubic foot in East division warehouses, and $10.6 per cubic foot in West division warehouses will produce approximate cubic volumes of storage space. To this must be added allowances for non storage space in the event of acquiring new warehouse facilities. The non storage space will be the same amount as that required for storage.
A list of assumptions upon which these two methodologies have been developed is shown at Appendix L.
B. Raw Materials (including Packaging materials)
Since packaging material is consumed in the production of finished goods, in the same manner that raw materials are used, they can be considered jointly. In this section

- 18 -
therefore, a reference to raw materials will be understood to include packaging material. The need for raw materials storage space depends upon the purchasing and production scheduling policies used in the CSC regions. Seven feasible options exist, and are described as follows:
1. Options
a. Raw Materials Management at the Institutions
Each institution orders raw material for the production of a given item on the manufacturing plan as close as possible to the time production is to begin, bearing in mind the suppliers lead time. This option eliminates the need for space in the regional warehouse to store raw materials.
b. Raw Materials Management shared by Region and Institutions
The marketing plan is disaggregated into regional production requirements. Within each Region a production schedule is developed for each of its institutions. Master agreements are reached with each supplier of raw materials, siifficient to meet the requirements of the production schedule. Each institution orders the raw materials needed for a specific batch against these master agreements.
c. Raw Materials Management at Regional Level
The marketing plan is disaggregated in regional production requirements. Within the Region, purchase orders are placed for the materials needed to meet the required production. These are stored in the Regional warehouse untia needed.
d. Raw Materials Management Shared by Central Authority Institutions (or Regions)
National requirements for raw materials are determined from the marketing plan and "standing order" agreements are negotiated with suppliers. Institutions (or Regions) requisition raw materials from the suppliers under these standing orders to meet their needs.
e. Raw Materials Management Based on Product Classification
Separate finished goods items into two classes:

- 19 -
Class I Those with demand sufficiently stable to enable an inventory to be maintained.
Class II Those with demand too unstable for maintenance of an inventory.
Class I items would be produced according to a system whose objectives are stated in terms of training and maintenance of stable employment. Gaps would be left in the schedule to permit the production of Class II items to fulfill the marketing plan or local orders. Raw material would be stockpiled in the regional warehouse for Class I items and ordered locally for Class II items to suit the production schedule.
f. Raw Materials Management Based on Material Popularity
Analysis of the Bills of Materials will show that - certain materials (or material groups) are used more frequently, and/or in greater quantities than others. Purchase of the range of CORCAN materials through different methods e.g. Central purchasing of the more popular and greater volume materials, and local purchasing of the smaller volumes or the materials unique to an institution's products, may prove to be economic and efficient.
g. Calculation Method
If it is decided that, for some or all items, raw materials are to be delivered to the regional warehouses for distribution to the institutions as needed, then space at each regional warehouse must be set aside for this purpose.
In any of the options, the amount of space will depend on the number of each item to be produced at the institutions served by the warehouse, the raw materials used in producing each item, the volume of a unit of each raw material, and the length of time it spends in the warehouse.
Thus, once the production schedule for each of the institutions has been developed, the raw materials needed for that schedule can be calculated. The lead time for delivery of each raw material, assuming separate purchasing, will then determine an ordering schedule for the raw material needs of each warehouse. While this process would suffice for materials that are seldom used and have fixed lead times, it may result in a large number of orders for the same material, each order being relatively small, or interruptions to the
.70.-

- 20 -
production at an institution if delivery is delayed. For materials with variable lead times or use in a large number of finished goods, it may be preferable to keep a stock of these materials in the warehouse. The quantities to be ordered and the order dates can be calculated for this type of material using the standard inventory control methodology which minimizes the sum of ordering and storage costs. This approach to warehousing is more complex and requires an inventory control system to be successful. The raw materials space in the warehouse would be segregated into three zones. Material arriving from suppliers would be moved into the first zone to await quality control inspection. Upon completion the material for replenishing stock is moved to zone two, the material to be transferred to the producing institutions is moved directly to zone three. Immediately before the materials are required at the institution, they are withdrawn from zones two and three, checked for completeness and transferred to the institution.
2. Cubic Volumes. of Raw Materials
Calculation of the storage space required for raw materials depends upon: -
a. the cubic volume of a unit of the raw material. b. the number of products to be manufactured. c. the scrap/reject rate d. the turn over rate e. buffer/safety stock precautions f. assess_space necessary to handle raw materials g. the height to which the materials may be stacked
The cubic volumes of the materials required to manufacture the products planned for 1982/83 have been calculated. The methodology for these calculations employing the use of a mini computer has -been developed and is shown at Appendix M.
A printout of the steps in the computer program designed to capture the necessary data, and the resulting cubic volume calculations are contained in a separate binder. The calculated raw material cubic volumes are for individual institutions and have been aggregated to produce Regional totals.
The flow charts describing the logic and sequence of the steps used to capture the required data and calculate the cubic volumes are shown as Figures 1 to 6 following this paragraph. The computer programs based on these flow charts have been recorded on floppy discs which have been handed to the Chief, Manufacturing, Industries Division.

Corcan 82-83 Manufacturin Plan
L
Manplan Partial
Sort to Product Sequence
-Manufacturin Plan by
Sman Plan
Extract Items for which Boms are avail-able
Key Enter
Generate danufacturing ?lan File
'41111111111111" Disk Fil:
Check List
L
' t
System Flow - Corcan Raw Materials

Space Requirement
Institution Region
Vol Mat Raw Mat
FteRe2
System Flow- Corcan Raw Materials
Corcan Bills of Mate ri
Sman Plan
Extract / Large Vol) urne or azardous 'tome
Key Enter
Calculate Space Requirements
Bill of Materials by
Pr(uh•-2

MANPLAN
FIG,ukE B
CORCAN1: ManufactUring Plan Data Capture
CORCAN Manufacturing
Plan by Instituti
Keyenter Selected
Items
mPLAin.
Keyenter Corrections MPLAN2
Check List
EMANPLAN
MPLAN3 Manufacturing
Plan by Product
SMANPLAN

BMAT1
RMINF
PicooRs. 4
CORCAN 2: Raw,LMaterial Data Capture
CORCAN Bills of Material
(
Keyenter \ Raw Material Attributes/
Keyenter ' Raw Material Attributes I
BMAT2 Alphbetical List of Raw Material Locators__
Additional CORCAN Bills of Material
RMINF

Alphabetical List of Raw Material =="
rtaueE. S
CORCAN3: Bill of Materials Capture
CORCAN Bills of
Materials
(
Keyenter \ Locator and Quantity /
BOM
. CORBOM

RMINF 1 CORBOM SMANPLAN
Ft c.TuReG
CORCAN4: Raw Material Space Calculations
r_ __ I l optional
1 Detail
'" List I
" I ie
Space Requirements by Institution and Region
VOLMAT RAWMAT

- 21 -
The procedural steps for completing the calculation is shown below.
Step 1 - Calculate the cubic volumes of the product quantities forecast as sales for the year from East and West warehouses.
Step 2 - Summarize the cubic volumes to produce total yearly cubic volumes for East and West.
Step 3 - Convert the yearly cubic volumes to yearly sales revenues by applying the dollar per cubic foot standards developed and described at Appendix K.
Step 4 - Estimate the dollar revenues per quarter using S.S.C. estimates of quarterly purchasing percentages.
Step 5 - Divide the estimated dollar revenues per quarter by three to estimate monthly revenues.
Step 6 - Develop dollar values of stock stored each month by: a) adding the estimated revenues for the number of
succeeding months to match the turn over rate; and to these;
h) add the estimated revenue for the number of succeeding months to match the safety stock carried.
Step 7 - Convert the dollar values of the stock stored each month to cubic feet by applying the dollar per cubic foot standards used at Step 3.
Step 8 - Double the cubic volume of the stock stored each month to estimate the monthly cubic warehouse space required.
C. Summary
1. Finished Goods
Two methodologies have been developed to determine the space required for finished goods.
The first is a calculation of the cubic volumes of the sales which have been forecast for each of the five years 1982-1987 and which are to be supplied from warehouses in the East and West divisions.

- 22 -
The second methodology is an adaptation of the first, and would be applicable to a situation where the dollar value of stock is known. By applying the dollar per cubic foot standards, the stock dollar value can be converted to cubic space. The procedure for this method is restricted to steps 7 and 8 of the previously described procedure for Method # 1.
Both methods rely upon the accuracy of the standards which have been developed from the 1982-83 sales forecast and 1982 (July) price list. Any different product mix, quantities change, or product sales price change could result in change to the standards, and would therefore require recalculation of the space estimates required. Calculation of space using methodology #1 depends also upon the stock turn over rate chosen.
2. Raw material storage space requirements
A methodology has been developed suitable for the employment of a mini computer to determine space required for storing raw materials. A detailed description of this together with the calculated cubic volume of the raw materials is shown at Appendix M. The calculations are for those items of production planned for 1982/83 for which Bills of Material exist. This methodology relies upon the similarity of the manufacturing plan to the sales forecast, and upon the adherence to the manufacturing plan. It has been assumed that raw materials will be ordered and stored by the institution although several options have been listed in the raw materials paragraph of this chapter of the report.
3. Work in Process
This has not been addressed during the study since extensive and detailed study would be required within each institution to observe manufacturing methods, work scheduling practice and manufacturing times. Sections of the questionnaire sent to the manufacturing institutions were designed to obtain information relating to space used for work in process, but the replies produced little information of value.

- 23 -
CONCLUSIONS AND RECOMMENDATIONS
This final section of the report is used to review both the methodologies and the results from the two finished goods space requirement calculations, the raw materials space analysis performed and to observe on requirements to improve the data to calculate these requirements in the future.
Methodology # I Finished Goods
Incorporating the assumptions shown at Appendix L, Methodology #1 for finished goods space calculation has been used to develop East and West divisions warehouse space to meet the forecast sales for 1982-1987 (See Appendix K). Analysis of the questionnaires returned by the Regional officers enabled a summary of the reported available warehouse space to be produced (see Appendix J - Regional Warehouse Section). This summary is for East division warehouses only since a reply to the questionnaire was not received from the Pacific Region and the information supplied by Prairie Region officers was incomplete.
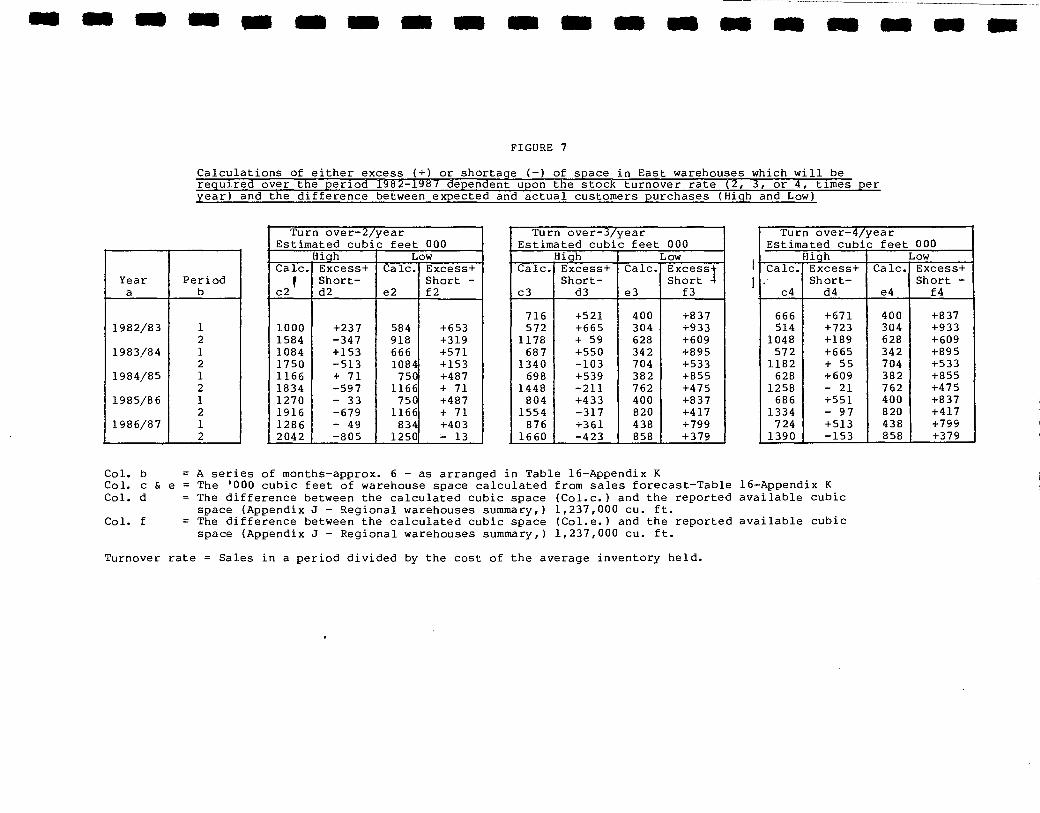
An analysis has been completed to show the difference between calculated required space and available space in East division warehouses under various conditions. These include different stock turnover rates and high and low levels of customer demand. If, for example, a turnover rate of three times per year applies requiring four months supply of goods to be stored, and the customers purchasing behaviour is judged to be higher purchases than were originally expected, then the available warehouse space in East division warehouses is sufficient until the second half of 1983/84.
An analysis has been completed to show the difference between calculated required space and available space in East division warehouses under various conditions. These include different stock turnover rates and high and low levels of customer demand, and are shown at Figure 7 following this
chapter.
Review of Figure 7 shows that the less frequent the turn over rate, the greater the demand created for storage space. This also applies when the customer demand is perceived to have increased during the year and the planned manufacturing quantities are 125% of the original sales forecast. The least space shown is for a turn over rate of four times per year and the manufacturing quantities being 75% of the original sales forecast.

- 24 -
The estimated space required in West warehouses during the period 1982 to 1987, calculated for each of the three turn over rates and for high or low actual demand, are shown at Figure 8 following this chapter. Estimates of excess space available or shortage of space cannot be calculated since no reports of available space were received from West Regions or other sources.
Methodology # 2 Finished Goods
This methodology has been developed to suit a situation where the sales value of a stock of products is known and there is a need to know the storage space occupied by the stock.
The dollar per cubic foot values of $14.0 for East storage and $10.6 for West storage can be used to convert the stock dollar value to cubic feet.
EXAMPLE
?7.0 million of stock is being held in East warehouses and $1.5 million of stock is being held in West warehouses.
The conversion of these stock values to cubic feet is:-
East: $7.0 million divided by $14.0 = 500,000 cu. ft. West: $1.5 million divided by $10.6 = 141,500 cu. ft.
To these cubic volumes must be added non-storage space which can be assumed to equal the storage space. This produces an estimate of the warehouse cubic space which in the above example is:
East: 500,000 multiplied by 2 = 1,000,000 cu. ft. West: 414,500 multiplied by 2 = 238,000 cu. ft.
Future Requirements
To plan storage space requirements it is necessary to possess accurate knowledge of which products and in what quantity will be entering a warehouse at a known point in time and similar information concerning the products leaving the warehouse. The consultants were not able to obtain this information and of necessity were compelled to make several assumptions involving estimates, proxy measures, and materials handling disciplines. It is recommended that:
" A system be introduced to collect financial, operational and quantitative data concerning the ordering, and use of materials, transfers to storage, and consignment to customers of CORCAN products for one

- 25 -
year. This data to be used to determine patterns of material movement affecting institutions and warehouses".
The discrepancies and dissimilarities in form between the manufacturing plans and the sales forecast caused the need for assumptions to be made. It does not seem unreasonable to expect that the sales forecasts could be presented for shorter intervals than one year, - ideally monthly. It also seems appropriate for business planning and control that the sales forecast and the manufacturing plan should be identical. It is recommended that:
"Agreement on sales forecasts and manufacturing plans should be obtained before the start of the manufacturing year"
The unique conditions under which the Industries programs strives to operate involving security, frequent disruptions (compared with a civilian counterpart) and unknown attitudes towards productivity held by the labor force present considerable difficulty in planning which includes space planning. Either large buffer stocks of products must be retained to ensure that customers demands accepted by the sales force are met, or every effort must be made to identify and implement alternatives to planned manufacturing facilities i.e. back-up facilities in other institutions. This latter method is less costly than the former which involves large stocks, tied up capital and the risk of obsolescence and deterioration. It is recommended that:
"Frequent e.g. quarterly meetings are held to review the subsequent period's manufacturing and sale plans to develop alternatives as may be required"
and
"Any changes to a manufacturing plan by Industries plant managers are reviewed with the sales force management".
During the study, the Comptroller's Department and the Director General's Office were approached during the information research stage to obtain any reports which described the operation and performance of the Industries program. No such reports were available. Any commercial undertaking requires a cash flow analysis, detail of product profitability shown by revenues and expenditures, and productivity measures. Without these indicators and measures 'management does not have all the necessary facts upon which to base decisions.

- 26 -
Raw Materials
The manufacturing plans show the identity and quantities of the products planned for manufacture at each institution during each month. The Bills of Material state the amount of each of the different materials required to produce one unit of a product. This, when multiplied by the monthly planned quantity of the product produces the monthly material requirement. The total of each product monthly material requirements by material type equals the institution's planned monthly usage of each type of material. These can be further summarized as Regional and East/West material type usages and converted to cubic volumes using the dimensions stated on the Bills of Material.
The computer printout concludes with a table showing the cubic feet of space required each month in each region. These cubic volumes distinguish between normal materials and hazardous materials which because of their volatile nature for example, require separate storage facilities. The cubic volumes are for the raw materials from which each month's planned manufacture of products in 1982/83 are produced. They have only been calculated however, for approximately 44% of the products contained in the manufacturing plans, since Bills of Material are not complete for all products (Ref. Appendix M).
A methodology has been developed to convert the raw materials cubic volumes tables in the computer printout to building cubic space required to store the raw materials. The procedure for this yiethodology is shown below. The procedure has been used to develop building space requirements for East and West Division storages using the data from the computer printout as a base. The results are shown at Figures 9 and 10 following this Chapter.
Procedure for Estimating Raw Materials Storage Space
Step a. Add the Regional cubic volumes for each Division (East and West) to produce monthly Division totals for normal and hazardous materials (Source: Region cubic volumes table in printout)
Step b. Add a predetermined number of months' cubic volumes to produce the cubic volumes of stock held each month.
e.g. If the stock turn over rate plus buffer/safety stock has been determined as three months stock to be held, the cubic volume of that stock for month # 1 will be:

- 27 -
Month #1 plus Month #2 plus Month #3 (from list produced in Step a)
The cubic volume for Month #2 will be:
Month #2 plus Month #3 plus Month #4.
Step c. The awkwardness of shapes or the fragibity of some materials will not allow all the available height of the storage building to be utilized. The cubic volumes of materials stored can be considered therefore as percentages of the available storage cube, and the utilized cubic volumes of the building calculated.
Step d. The utilized cubic volumes calculated in Step c do not include space for gangways etc. This accessibility space is assumed to be equal to the actual storage space occupied by the materials. The total building space is calculated by multiplying the storage space (Step c) by two.
Tables 1 (East) and 2 (West) have been constructed using the above procedure. The columns correspond to the steps in the procedure, e.g. Col. a. is produced by completing Step a.
Col. b has been constructed for a three month stock of materials being held.
Col. c & d show cubic volumes using i 20% of the height, ii 25%, iii 50%.
ina «ga age as an au ma ma ea as se es as ire as am me elm
FIGURE 7
Calculations of either excess (+) or shortage (-) of space in East warehouses which will be required over the period 1982-1987 dependent upon the stock turnover rate (2, 3, or 4, times per year) and the difference between expected and actual customers purchases (High and Low)
Year Period a b
1982/83 1 2
1983/84 1 2
1984/85 1 2
1985/86 1 2
1986/87 1 2
Turn over-2/year Estimated cubic feet 000
High Low Calc. Excess+ Calc. Excess+
f Short- Short - c2 d2 e2 f2
1000 +237 584 +653 1584 -347 918 +319 1084 +153 666 +571 1750 -513 1084 +153 1166 + 71 750 +487 1834 -597 1166 + 71 1270 - 33 750 +487 1916 -679 1166 + 71 1286 - 49 834 +403 2042 -805 1250 - 13
Turn over-3/year Estimated cubic feet 000
High Low Calc. Excess+ Calc. Excesst
Short- Short 4 c3 d3 e3 f3
716 +521 400 +837
572 +665 304 +933
1178 + 59 628 +609
687 +550 342 +895
1340 -103 704 +533
698 +539 382 +855
1448 -211 762 +475
804 +433 400 +837
1554 -317 820 +417
876 +361 438 +799
1660 -423 858 +379
Turn over-4/year Estimated cubic feet 000
High Low
Calc. Excess+ Calc. Excess+ Short- Short -
c4 d4 e4 f4
666 +671 400 +837
514 +723 304 +933
1048 +189 628 +609
572 +665 342 +895
1182 + 55 704 +533
628 +609 382 +855
1258 - 21 762 +475
686 +551 400 +837
1334 - 97 820 +417
724 +513 438 +799
1390 -153 858 +379
Col. b = A series of months-approx. 6 - as arranged in Table 16-Appendix K Col. c & e = The '000 cubic feet of warehouse space calculated from sales forecast-Table 16-Appendix K Col. d = The difference between the calculated cubic space (Col.c.) and the reported available cubic
space (Appendix J - Regional warehouses summary,) 1,237,000 cu. ft. Col. f = The difference between the calculated cubic space (Col.e.) and the reported available cubic
space (Appendix J - Regional warehouses summary,) 1,237,000 cu. ft.
Turnover rate = Sales in a period divided by the cost of the average inventory held.

Turn over-2/year Estimated cubic feet 000
High Low Cale. Excess+ Cale. Excess+
Short- Short - 2 1 e2 f2 c d2
220 130 374 220 242 154 436 264 288 176 436 N.A. 288 N.A. 308 176 486 288 308 176 486 288
Turn over-3/year Estimated cubic feet 000
High Low Cale. Excess+ Cale. Excess+
Short- Short - c3 d3 e3 f3 I
166 96 282 166 166 118 356 212 190 142 356 N.A. 236 N.A. 212 142 378 236 212 142 378 236
Turn over-4/year Estimated cubic feet 000
High Low Calc. Excess+ Cale. Excess+
Short- Short - c4 d4 e4 f4
126 76 252 152 152 100 302 176 152 100 302 N.A. 176 N.A. 152 126 328 202 176 126 328 202
Year Period a b
1982/83 1 2
1983/84 1 2
1984/85 1 2
1985/86 1 2
1986/87 1 2
111. ale IMO en 111.1 IRS 11 OM ea an ala UN ea IIla falli
FIGURE 8
Space required in West warehouses which will be required over the period 1982-1987 dependent upon the stock turn over rate, (2, 3 or 4 times per year and the difference between expected and actual customers
purchases (hiqh and low)
Col. b = A series of months-approx. 6 - as arranged in Table 17 Appendix K Col. c & e= The '000 cubic feet of warehouse space calculated from the sales forecast-Table 17-Appendix K Col. d & f = Would also show the difference between calculated space and available space but the available
space is not known. N.A. = information not available.
Turnover rate = Sales in a period divided by the cost'of the average inventory held.

OM ale MI MI UM 111111 IUD gal OM an UM ea re ea an MI in
FIGURE 9
Conversion of Planned Monthly Manufacturing Outputs To Building Space Required for Raw Materials Storage
East Normal material
1982/83 Monthly 3 months
Output stock (cu.ft.) (cu.ft.)
April 4050 15110 May 6060 , 20610 June 5000 22440 July 9550 24870 Aug. 7890 22560 Sept. 7430 19200 Oct. 7240 18440 Nov. 4530 19280 Dec. 6670 20240 Jan. 8080 19670 Feb. 5490 15640 Mar. 6100 16210
Hazardous material
1982/83
April 290 840 May 320 1010 June 230 990 July 460 1010 Aug. 300 880 Sept. 250 830 Oct. 330 800 Nov. 250 730 Dec. 220 700 Jan. 260 690 Feb. 220 720 Mar. 210 820
Storage Space (cu. ft.) Height Occupied
(i) 20% (ii) 25% (iii) 50%
76,000 60,000 30,000
103,000 82,000 41,000
112,000 90,000 45,000
124,000 99,000 50,000
113,000 90,000 45,000
96,000 77,000 38,000
92,000 74,000 37,000
96,000 77,000 38,000
101,000 81,000 41,000
98,000 79,000 39,000
78,000 62,000 31,000
81,000 65,000 32,000
4,200 3,400 1,700
5,100 4,000 2,000
5,000 4,000 2,000
5,100 4,000 2,000
4,400 3,500 1,800
4,100 3,300 1,700
4,000 3,200 1,600
3,600 2,900 1,500
3,520 2,800 1,400
3,500 2,800 1,400
3,600 2,900 1,400
4,100 3,300 1,600
Building Space (cu. ft.) Height Occupied
(i) 20% (ii) 25% (iii) 50 %
152,000 120,000 60,000 106,000 164,000 82,000 224,000 180,000 90,000 248,000 198,000 100,000 226,000 180,000 90,000 192,000 154,000 76,000 184,000 148,000 74,000 192,000 154,000 76,000 202,000 162,000 82,000 196,000 158,000 78,000 156,000 124,000 62,000 162,000 130,000 64,000
8,400 6,800 3,400
10,200 8,000 4,000
10,000 8,000 4,000
10,200 8,000 4,000
8,800 7,000 3,600
8,200 6,600 3,400
8,000 6,400 3,200
7,200 5,800 3,000
7,000 5,600 2,800
7,000 5,600 2,800
7,200 5,800 2,800
8,200 6,600 3,200
Note: Height Occupied - i 20% = material stored at 20% of available height ii 25% = material stored at 25% of available height iii 50% = material stored at 50% of available height

Mai FM Me • MI mu um me um um 111111, me um imis cum am um um
FIGURE 10
Conversion of Planned Monthly Manufacturing Outputs To Building Space Required for Raw Materials Stora e
West Normal material
1982/83 Monthly 3 months Output stock (cu.ft.) (cu.ft.)
April 710 4190 May 1620 5620 June 1860 6380 July 2140 6020 Aug. 2380 52000 Sept. 1500 3640 Oct. 1320 3840 Nov. 820 4350 Dec. 1700 5400 Jan. 1830 4960 Feb. 1870 3840 Mar. 1260 3590
Storage Space (cu. ft.) Height Occupied
(i) 20% (ii) 25% (iii) 50%
20950 16760 8380 28100 22480 11240 31900 25520 12760 30100 24080 12040 26000 20800 10400 18200 14560 7280 19200 15360 7680 22750 17400 8700 27000 21600 10800 24800 19840 9920 19200 15360 7680 17950 14360 7180
Building Space (cu. ft.) Height Occupied
(i) 20% (ii) 25% (iii) 50%
42,000 34,000 17,000 56,000 45,000 23,000 64,000 51,000 26,000 60,000 48,000 24,000 52,000 42,000 21,000 36,000 29,000 15,000 38,000 31,000 16,000 46,000 35,000 18,000 54,000 43,000 22,000 50,000 40,000 20,000 38,000 31,000 15,000 36,000 29,000 14,000
Hazardous material
1982/83
April 20 110 May 60 130 J.une 30 140
Jul 40 150 Mtg. 70 150 Sèpt. 40 100 .
-&ct' 40 130 0
S'bv4 20 140 - De'di 70 160 ,Jan 50 110 IF.A . ID; 40 80 kà, r 20 100
550 440 220 650 520 260 700 560 280 750 600 300 750 600 300 500 400 200 650 520 260 750 560 280 800 640 320 550 440 220 400 320 160 500 400 200
1,100 900 400
1,300 1,000 500
1,400 1,100 600
1,500 1,800 600
1,500 1,200 600
1,000 800 400
1,300 1,000 500
1,400 1,100 600
1,600 1,300 600
1,100 900 400
800 600 300
1,000 800 400 e ' ,... c L
M 21 J Note: Height Occupied - i 20% = material stored at 20% of available height
ii. 25%'= material stored at 25 of available height iii Du% = material stored at Dut or available neignt

BOLDEN CANADA L BIBLI 1 11 II 111 i I
0000024227

Date Due
HV Correctional Service 8931 Canada Industries .C2 Program Warehouse C64 Requirements for 1983 Corcan Products. v.1
DATE ISSUED TO
EV Correctional Service 8931 Canada Industries .C2 Program Warehouse C64 Requirements for 1983 Corcan Products. v.1