Embed Size (px)
Citation preview

ARCTIC
VOL. 47, NO. 3 (SEPTEMBER 1994) P. 265–279
Arctic Sea Ice Microstructure Observations Relevant to Microwave ScatteringMOHAMMED E. SHOKR1 and NIRMAL K. SINHA2
(Received 5 May 1993; accepted in revised form 31 January 1994)
ABSTRACT. Sea ice microstructure characteristics relevant to ice microwave scattering were studied during SIMMS’91 fieldexperiment in Resolute Bay in May/June 1991. Thin sections of the top 300 mm layer of first-year and multi-year ice (fromhummocks and melt ponds) were prepared and examined. Analysis is based mostly on qualitative observations, although statisticson bubble dimensions and geometry were obtained from digital analysis of thin section photographs. First-year ice featured mostlyan oriented columnar grain structure. Both spherical and needle-shaped brine pockets were observed. In multi-year ice, a varietyof grain structures and inclusion patterns were observed from the same floe. Hummock and melt pond ice are different in termsof grain structure and air bubble contents. Air bubbles in hummock ice are highly random and interconnected, especially near thesurface. At lower depths, they retain simpler shapes and become oriented parallel to the dominant grain growth direction. In meltpond ice, two types of air inclusions whose typical dimensions differ by an order of magnitude were observed. Significant spatialvariability of multi-year ice microstructure within a single floe is demonstrated.
Key words: sea ice, ice microstructure, ice microwave scattering, SAR ice signatures, air bubbles in sea ice
RÉSUMÉ. Au cours de l’étude de terrain SIMMS’91 menée dans la baie Resolute en mai/juin 1991, on a étudié les caractéristiques de lamicrostructure de la glace de mer pertinentes à la diffusion d’hyperfréquences par la glace. On a préparé et examiné de fines coupestransversales prélevées dans les 300 mm supérieurs de la glace de l’année et de la glace pluri-annuelle (provenant de hummocks et de maresde fonte). L’analyse s’appuie principalement sur des observations qualitatives, bien que les statistiques sur les dimensions et la géométriedes bulles aient été obtenues à partir du traitement numérique de photographies représentant de fines coupes transversales. La glace del’année affichait principalement une structure granulaire prismée. On a observé des poches de saumure sphériques ainsi qu’aciculaires.Dans la glace pluri-annuelle, on a observé dans le même floe une diversité de structures granulaires et de schémas d’inclusion. Leshummocks et la glace des mares de fonte diffèrent quant à leur structure granulaire et au contenu des bulles d’air. Dans la glace de hummock,les bulles d’air sont distribuées au hasard et reliées entre elles, surtout près de la surface. À de plus grandes profondeurs, elles conserventdes formes plus simples et s’orientent parallèlement à la direction dominante de la croissance granulaire. Dans la glace des mares de fonte,on retrouve deux types d’inclusions d’air dont les dimensions typiques diffèrent d’un ordre de grandeur. On démontre qu’il existe uneimportante variabilité spatiale de la microstructure de la glace pluri-annuelle à l’intérieur d’un même floe.
Mots clés: glace de mer, microstructure de la glace, diffusion d’hyperfréquences par la glace, signatures de la glace obtenues avecle RALS, bulles d’air dans la glace de mer
Traduit pour la revue Arctic par Nésida Loyer.
1 Atmospheric Environment Service, 4905 Dufferin Street, North York, Ontario M3H 5T4, Canada2 Institute for Engineering in the Canadian Environment, National Research Council of Canada, Ottawa, Ontario K1A 0R6, Canada
© The Arctic Institute of North America
INTRODUCTION
Sea ice is a heterogeneous mixture of pure ice crystals, gas (air)bubbles and brine pockets in either liquid or solid forms. Severalstudies on microstructure of laboratory-made saline ice havebeen conducted to understand its formation and growth processes(Weeks and Assur, 1963; Weeks and Lofgren, 1967; Cox andWeeks, 1975). Only a few studies, however, have been conductedto relate the microstructure of natural first-year ice to the growthrate and the meteorological and oceanographical conditions(Nakawo and Sinha, 1981, 1984). Most studies focus on thefabric of crystalline structure in relation to the ice age and theregion of origin.
Peyton (1966) studied the structure of columnar ice 0.5 m ormore beneath the surface of ice along the Alaskan coast andfound that it was characterized by a strongly c-axis orientation in
the horizontal plane. Strongly preferred c-axis orientation wasalso noticed by Sinha (1977) to occur within 20 mm below thesurface in Strathcona Sound, Baffin Island, Canada. Photographsof highly oriented grains and intragranular salt inclusions arepresented in the same reference. Weeks and Gow (1978) notedoriented columnar ice in the northern part of Alaska in land-fastice and concluded that the alignment was related to the dominantorientation of water current under the ice cover. Sinha (1984)found the same structure in first-year and multi-year ice inCrozier Channel in the Beaufort Sea region. About 70% of thefirst-year ice adjacent to the east coast in Mould Bay (CanadianWestern Arctic) was found to be vertically-oriented frazil icewith the c-axis of crystals randomly oriented in the horizontalplane (Sinha, 1986). This was attributed to the strong westerlywind during the formation of the ice cover. Tucker et al., (1987)reported that about 75% of first-year ice in Fram Strait (between

266 • M.E. SHOKR and N.K. SINHA
the East Greenland coast and Svalbard) consisted of columnargrains and the remaining 25% consisted of granular ice. Eickenand Lange (1989) studied three wind-controlled ice formationregimes in the Weddell Sea, where columnar ice predominatedin undeformed ice (formed at low wind speeds), while granularice predominated in heavily ridged and rafted ice (formed underhigh wind speeds). The lack of ice crystal orientation in the Seaof Bothnia as compared to ice in the Arctic Ocean was attributedby Weeks et al., (1990) to the weaker or more variable seacurrent. Few studies have been carried out on characteristics ofinclusions in ice (Poe et al., 1974; Bjerkelund et al., 1985)—asubject of direct relevance to ice microwave remote sensing.
Sea ice monitoring for operational and scientific applicationshas progressed through the use of advanced remote sensingtools, particularly in the microwave band. Both active andpassive sensors have been used. The prime sensor within thecategory of active sensors is the Synthetic Aperture Radar (SAR)(Ulaby et al., 1986). Interpretation of sea ice SAR imagesdepends on understanding the radar backscattering mechanism.Extensive data on radar backscattering from ice at differentfrequencies are presented in the literature (e.g., Onstott, 1992).Backscattering is influenced by three factors: the ice surfaceroughness, the average dielectric constant of ice, and themicrostructural properties of ice in terms of crystal structure and,more importantly, inclusions in ice. The third factor is the subjectof this study.
Data on ice microstructural properties relevant to icemicrowave remote sensing have become more available recently.Tucker et al., (1991) presented results from surface-based activeand passive microwave measurements, made in conjunctionwith physical and structural properties of ice. They showed thatmicrowave signatures are affected by brine (liquid content) aswell as gaseous void distribution. Eicken et al., (1990)demonstrated the feasibility of quantitative texture analysis ofice microstructure images. Samples of different ice grain textureswere distinguished based on the slope of the histogram of atexture parameter. Perovich and Gow (1991) calculated thecorrelation function between a template representing the typicalappearance of brine pockets and the images of actual brine pocketsin first-year ice. Statistics derived from the correlation functionwere ascribed to geometrical characteristics of brine pockets.
From the operational and scientific viewpoints, first-year andmulti-year ice are among the most important ice types. For thesetypes, the dominant inclusions are brine pockets and air bubblesrespectively. Air bubbles exist at depths above the water level.The saline-free nature of the upper layer of multi-year ice allowsmore microwave energy to penetrate and interact with airbubbles. This interaction invokes volume scattering, which,together with surface scattering, forms the total backscatterreceived by a microwave remote sensor. Both experimentalstudies and microwave scattering model results (Gogineni et al.,1990) show that volume scattering from first-year ice is notsignificant, particularly at small incidence angles of the incomingradiation. Modeling volume scattering in multi-year ice dependson information on bubble characteristics. At present, thisinformation is scarce in the literature. Attempts to measurebubble dimensions are presented in Poe et al., (1974) and
Bjerkelund et al., (1985). The latter reference shows that 83% ofthe spherical bubbles in a horizontal section from completelydesalinated second-year ice have a diameter less than 1 mm.More detailed study is required to explore the variability ofbubble characteristics in relation to the topography of ice (i.e.,hummock and melt pond), as well as the grain structures thatcommonly exist in each type. A requirement for in situ data tocharacterize inclusions that can be incorporated in microwavescattering models has been identified in the literature (e.g.,Winebrenner et al., 1989).
The present study was carried out to characterize air bubblesand brine pockets in relation to grain structures in natural sea icein the Arctic. The study focused on differences between crystallinestructure in hummocks and melt ponds. Results are based mostlyon qualitative analysis, although limited quantitative informationon air bubbles in multi-year ice is obtained from digital analysisof thin sections. The main objective of the study is to further definethe parameters contributing to the microwave volume scattering.Hence, a better capability to interpret radar ice signatures observedin SAR images can be developed.
METHODS
The present study was the second in a series conducted underthe Sea Ice Monitoring and Modeling Site (SIMMS) program. Itwas designed to collect baseline geophysical data from snow-covered sea ice and relate them to ice signatures from SAR(Barber, 1991).
The field study was conducted during 21 May to 4 June, 1991in Resolute Passage off Barrow Strait, Northwest Territories,Canada (Fig. 1). This period signals the early melt season whenthe snow cover becomes wet but is not yet flooded (Livingstoneet al., 1987). In addition to ice microstructure data, in situ datasuch as thickness, surface roughness distribution, temperatureand salinity profiles were collected on snow and ice. Some ofthese data are presented in other papers in this issue. Fulldocumentation of the data are included in Reddan et al., 1991.
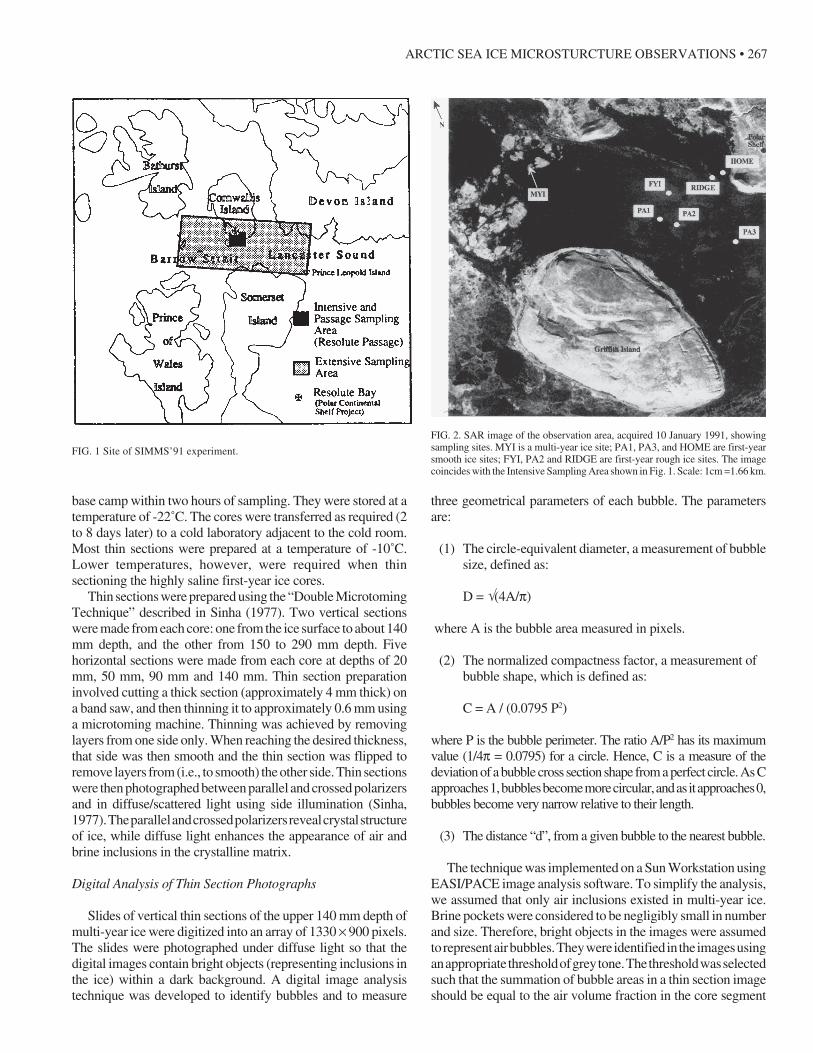
The observation area consisted mainly of first-year sea ice with anumber of relatively small (less than 2 km diameter) multi-year icefloes. The floes were located approximately 25 km west of ResoluteBay. An image of the observation area acquired by the STAR-2 SARsystem (Nichols et al., 1986) is shown in Fig. 2.
Core Sampling and Sectioning
Ice cores of 100 mm diameter were collected using an NRCC-made fibreglass core auger. Only the top 300 mm length of eachcore was examined. This is enough depth to include the penetrationof the microwave C-band (estimated by Vant et al., (1978) to bein the order of a few centimetres) and to accommodate the mosteffective part of penetration in multi-year ice (the penetrationdepth is reported by Fung and Eom (1982) to be around 1 m).Two cores were collected from each of the first-year ice (FYI)and PA1 (Passage) sites. Seven cores were collected fromhummocks and five cores from melt ponds, all from the multi-year ice (MYI) site. Cores were transferred to a cold room at the
ARCTIC SEA ICE MICROSTURCTURE OBSERVATIONS • 267
FIG. 1 Site of SIMMS’91 experiment.
base camp within two hours of sampling. They were stored at atemperature of -22˚C. The cores were transferred as required (2to 8 days later) to a cold laboratory adjacent to the cold room.Most thin sections were prepared at a temperature of -10˚C.Lower temperatures, however, were required when thinsectioning the highly saline first-year ice cores.
Thin sections were prepared using the “Double MicrotomingTechnique” described in Sinha (1977). Two vertical sectionswere made from each core: one from the ice surface to about 140mm depth, and the other from 150 to 290 mm depth. Fivehorizontal sections were made from each core at depths of 20mm, 50 mm, 90 mm and 140 mm. Thin section preparationinvolved cutting a thick section (approximately 4 mm thick) ona band saw, and then thinning it to approximately 0.6 mm usinga microtoming machine. Thinning was achieved by removinglayers from one side only. When reaching the desired thickness,that side was then smooth and the thin section was flipped toremove layers from (i.e., to smooth) the other side. Thin sectionswere then photographed between parallel and crossed polarizersand in diffuse/scattered light using side illumination (Sinha,1977). The parallel and crossed polarizers reveal crystal structureof ice, while diffuse light enhances the appearance of air andbrine inclusions in the crystalline matrix.
Digital Analysis of Thin Section Photographs
Slides of vertical thin sections of the upper 140 mm depth ofmulti-year ice were digitized into an array of 1330 × 900 pixels.The slides were photographed under diffuse light so that thedigital images contain bright objects (representing inclusions inthe ice) within a dark background. A digital image analysistechnique was developed to identify bubbles and to measure
FIG. 2. SAR image of the observation area, acquired 10 January 1991, showingsampling sites. MYI is a multi-year ice site; PA1, PA3, and HOME are first-yearsmooth ice sites; FYI, PA2 and RIDGE are first-year rough ice sites. The imagecoincides with the Intensive Sampling Area shown in Fig. 1. Scale: 1cm =1.66 km.
three geometrical parameters of each bubble. The parametersare:
(1) The circle-equivalent diameter, a measurement of bubblesize, defined as:
D = √(4A/π)
where A is the bubble area measured in pixels.
(2) The normalized compactness factor, a measurement ofbubble shape, which is defined as:
C = A / (0.0795 P2)
where P is the bubble perimeter. The ratio A/P2 has its maximumvalue (1/4π = 0.0795) for a circle. Hence, C is a measure of thedeviation of a bubble cross section shape from a perfect circle. As Capproaches 1, bubbles become more circular, and as it approaches 0,bubbles become very narrow relative to their length.
(3) The distance “d”, from a given bubble to the nearest bubble.
The technique was implemented on a Sun Workstation usingEASI/PACE image analysis software. To simplify the analysis,we assumed that only air inclusions existed in multi-year ice.Brine pockets were considered to be negligibly small in numberand size. Therefore, bright objects in the images were assumedto represent air bubbles. They were identified in the images usingan appropriate threshold of grey tone. The threshold was selectedsuch that the summation of bubble areas in a thin section imageshould be equal to the air volume fraction in the core segment

268 • M.E. SHOKR and N.K. SINHA
represented by that section. The technique identifies separatedbubbles. Overlapping bubbles have to be separated manually,i.e., in an interactive mode. The smallest bubble that can beresolved in an image has a circle-equivalent diameter of 0.1 mm.This is an adequate resolution for the purpose of ice/microwavestudies where the wavelength of the incident signal is typicallya few centimetres. Details about the technique are presented inShokr and Sinha (in press).
RESULTS AND DISCUSSION
First-year Ice Microstructure
The top surface layer (140 mm) of first-year ice in ResolutePassage during 1991 winter season consisted mainly of orientedcolumnar crystals. A typical vertical section of that layer is
shown in two photographs, Figs. 3a and 3b, taken between crosspolarizers and in diffuse light respectively. The section wasprepared from a core collected from the FYI site, which had arelatively bright signature in the SAR image (Fig. 2) comparedto signatures from other first-year ice sites. Brine inclusions canbe seen in Fig. 3a located along grain and sub-grain boundaries.
FIG. 3. First-year ice microstructure: (a), (b) vertical section of the upper 140 mm, photographed between crossed polarizers and in diffuse light respectively; (c)horizontal section at 140 mm depth photographed between crossed polarizers. Arrows at the top mark spots of high concentration of inclusions within the frazilice matrix. The arrow at the bottom marks a vertical drainage channel. The horizontal dark lines in (a) divide layers of different microstructure characteristics.

ARCTIC SEA ICE MICROSTURCTURE OBSERVATIONS • 269
Three sub-layers exhibiting different microstructuralcharacteristics can be identified in the figure (their boundariesare marked with heavy dark lines). The first layer occupies thetop 7 mm. It is characterized by randomly oriented fine grainstypically a few millimetres in size. This layer constitutes slushice formed, perhaps, during a snowfall. A high concentration ofinclusions can be seen in two bright spots (marked with arrowsin Fig. 3b). The second layer extends from 7 mm to 25 mm depth.It contains vertically-oriented frazil grains, slightly larger thanthose in the first layer. This is confirmed from the horizontalsection at 20 mm (not shown). The grain size is typically 4 mmto 10 mm. Inclusions of different shapes can be seen. For frazilice, the assumption of spherical inclusions proved to be appropriatefor modeling the dielectric constant (Shokr and Sinha, in press).The inclusion dimensions range between a fraction of a millimetreto a maximum of 2 millimetres. These inclusions are a mix of gasand brine pockets. The size of the inclusions (gas and brine)decreases with the decrease in temperature. The volumetricchange in the gaseous inclusions is primarily controlled by thethermal contraction of the ice volume. The decrease in the brinevolume with temperature, on the other hand, is mainly controlledby the changes in the equilibrium conditions, which cause moresolid salts to precipitate (Weeks and Akley, 1982). This elicits adecrease in the ice dielectric constant and an increase in microwavepenetration depth, based on calculations reported by Shokr andSinha (in press) from using the dielectric mixing model developedby de Loor (1968). Qualitatively speaking, more volume scatteringis expected from first-year ice as ice temperature decreases.
The third layer features columnar-grained ice. Columns growin the direction of maximum heat flux, which is usually verticalas shown in Fig. 3a. Brine pockets are arranged in a significantnumber of thin vertical lines. A brine drainage channel ofapproximately 4 mm width can be seen in the middle part of Fig.3b. The grains are also oriented in the horizontal plane as shownin Fig. 3c, which represents a horizontal section of half core at140 mm. The c-axis of the grains tends to be parallel to thedominant ocean current at the time of ice formation (Weeks andGow, 1978; Nakawo and Sinha, 1984). Perhaps more relevant tomicrowave scattering, grain orientation also defines the directionalong which brine pockets are stretched. Information on thisdirection, with respect to the applied electric field, is importantto determine both dielectric constant and microwave scattering.This is especially true when brine pockets have an asymmetriccross section in the horizontal plane (as usually observed atdepths below approximately 50 mm).
Multi-year Ice Microstructure
The surface of a multi-year ice floe is characterized byhummocks, melt ponds and ridges. In hummock ice, the onlyinclusion type is air bubbles. In melt pond ice and in the bulk ofthe ice, air bubbles and brine pockets coexist depending upon thesalinity of the ice. Microwave volume scattering is more significantin hummocks because of their desalinated nature, which allowsmore energy penetration. Air bubbles are the main scatterer inboth ice types. However, bubble formation mechanisms andgeometrical characteristics are different between the two types.
Hummock Ice
Four cores from the same multi-year floe (MYI in Fig. 2)demonstrated a variety of grain structure. The shape and size ofthe grains indicate the conditions under which the ice wasformed. The formation histories affect bubble shapes andorientations.
Figs. 4a and 4b depict a vertical section of the top 140 mm ofcore #1 from a hummock. The top part of the original core waswhite in colour and could have been mistaken as compactedsnow or highly porous recrystallized ice. Because of earlierexperience (Sinha, 1984), the top section was thin-sectionedwith great care. The section shows large, vertically-orientedcolumnar grains starting immediately from the surface. This wasthe bulk ice that had existed below the surface layer in theoriginal first-year ice prior to surface melt. No additional (i.e.,newer) ice was formed on the hummock surface in subsequentseasons. Note the large number of air bubbles in Fig. 4b (thehorizontal line shows a crack formed during the microtomingprocess). The measured density from this core, averaged overthe 140 mm depth, was 0.620 kg.mm-3.
Bubbles are highly interconnected near the surface. They losetheir individual identity and form a complicated network.Photomicrography of air bubbles confirmed this observation.Therefore, the commonly-used assumption of elliptical bubbleshape (used in microwave scattering models) may not be validfor the surface layer of multi-year ice. Dark areas appearing atcorresponding locations in Figs. 4a and 4b represent large voidsof a few millimetres in diameter. These voids have been observedoccasionally. Statistics on their geometrical properties, thoughimportant for microwave scattering models, cannot be obtainedfrom the present data because of the limited number of coresamples. Since the average density was 0.620 kg.mm-3, thecorresponding air volume fraction was 38% (Shokr and Sinha,in press). This value is too high for air to be considered as aninclusion in a host (pure ice) material. This limits the applicationof dielectric and microwave scattering models based on theconcept of inclusions contained in a host material of dominantvolume fraction.
The second core was characterized by inclined columnar-grained ice. Figs. 5a and 5b show a vertical section from 140 to280 mm depth. Large grains are readily visible. Their major axisvaries from 50 to 80 mm, although smaller dimensions, around10 mm, are observed near the top. Grains have irregularboundaries, which means that the original ice was highly saline.The large deviation of grain orientation from the vertical directionindicates that the hummock was part of an old rubble field. Theboundary between bubble-rich/bubble-free regions is wellidentified at about 220 mm below the surface (it separates thebright objects and the dark background in Fig. 5b). This abrupttermination of air bubbles is observed in all hummock cores atdepths between 50 and 350 mm.
The horizontal section at a 90 mm depth shows definite grainorientation as can be seen in Figs. 5c and 5d. Air bubbles arestretched and spatially arranged parallel to the dominant grainorientation. This implies that when surface melt infiltrates ice (insummer), the melt water follows paths connecting brine pockets

270 • M.E. SHOKR and N.K. SINHA
FIG. 4. Hummock core #1. Vertical section of the upper 140 mm depth, photographed (a) between crossed polarizers, (b) in diffuse light.
(which exist in the original saline first-year ice). The major axisof bubbles observed in this section varies from 1 to 6 mm long.
Fig. 6 shows the top 140 mm of core #3, featuring largeoriented grains with straight boundaries. The planer boundaries,with no sub-grain boundaries, indicate that the ice grew fromfreshwater. Note that the long axis of the grains is inclined atapproximately 45˚. Since the long axis of the grains marks thegrowth direction or the direction of maximum heat flow, this icemust have grown at the edge of a melt pond and, thereby, on a sideof a hummock. Note, however, that the ice contains vertically-oriented bubbles; i.e., not parallel to the dominant grain orientation.These bubbles were not, therefore, formed during the growthseason. The bubbles trapped during growth are usually elongatedwith their long axis parallel to the grain growth direction. The iceunder examination must have gone through another melt seasonafter formation. Vertically-oriented air bubbles are indicators ofthe flow of melt water following the gravity (vertical) direction.This is the natural path of surface melt water to percolate throughice. Irregular and interconnected bubbles, with typical dimensions
between 1 to 4 mm, are observed in the surface layer (top part ofFig. 6). At greater depths (bottom part of the figure), the commonbubble shape is elliptical with typical dimensions of the majorand minor axes being about 6 mm and 3 mm respectively.Bubbles are randomly spaced in both vertical and horizontalsections but they tend to cluster as shown in the figure. Thisaspect is not limited to this core and is being further examined.
The fourth core is characterized by small non-oriented grainsa few millimetres in diameter throughout its entire length (280mm). Fig. 7 is a vertical section between 150 and 280 mm depth.Based on its textural appearance, the top of the core is believedto comprise snow ice. The shape and distribution of air bubbles(dimensions between 2–5 mm) are similar to those observed inprevious cores (Figs. 5, 6). Diffused-light photographs show thatair bubbles terminate at about 130 mm depth (above the top edgeof the shown section). The most important feature in this core isthe large void, the black object with an approximate diameter of62 mm, that can be seen in the top half of the photograph.

ARCTIC SEA ICE MICROSTURCTURE OBSERVATIONS • 271
FIG. 5. Hummock core #2. (a), (b) vertical section of a depth range 140 mm to 290 mm, photographed between crossed polarizers and in diffuse light respectively.(c), (d) horizontal section at 90 mm depth photographed in diffuse light and between crossed polarizers respectively.
of waterlogged snow deposited on a pond. The second is smallair bubbles trapped in the water or rejected during formation ofice in the pond. Both types differ from air bubbles in hummockice in terms of formation mechanism and geometricalcharacteristics. Observations from three melt pond cores arepresented in the following.
The typical structure of melt pond ice is shown in Fig. 8 (core#1), where a vertical section of the upper 140 mm depth is shownin Figs. 8a and 8b and a horizontal section at 90 mm depth is
Melt Pond Ice
As with hummock ice, melt pond ice exhibits a variety ofmicrostructure patterns. Unlike hummock ice, however, twodistinct types of air inclusions exist in melt pond ice. The first, inthe form of clusters of bubbles, is believed to originate from airentrapped between snow grains. These large clusters wereconsistently found in snow-ice layers forming the top layer of anice cover. This layer is formed during freezing of snow slush or

272 • M.E. SHOKR and N.K. SINHA
FIG. 6. Hummock core #3. Vertical section of the upper 140 mm depth,photographed between crossed polarizers.
FIG. 7. Hummock core #4. Vertical section from 150 to 280 mm deepphotographed between crossed polarizers.
shown in Fig. 8c. The vertical section exhibits three layers ofdistinct structure. The top layer, about 40 mm in thickness, iscomprised of numerous small grains about 1 mm in diameter.This vertical section, in conjunction with the horizontal sectionat 20 mm (not shown), indicated that the ice was isotropic andequiaxial. This type of ice develops from freezing of saturatedsnow, and is called “snow ice” or granular ice. Air entrappedbetween snow particles evolves into nearly spherical inclusions,depicted as large bright objects in Fig. 8b. Their average diameteris 4 mm. These inclusions are consistently observed in, andconfined only to, snow-ice layers in melt pond ice. Compared tocommonly observed bubbles in hummock ice, they are moreisotropic in shape, well separated, and have larger diameters.
The middle layer, 25 mm thick, comprises ice crystals formedduring the selection process, where crystals will survive only iftheir basal plane is parallel to the growth direction or the directionof maximum heat flow. Smaller air bubbles, ranging from afraction of a millimetre to slightly above 1 mm, are readily visiblein this layer (Fig. 8b). They are probably formed from air rejectedby water during the formation of fine-grained crystals (i.e., not
instigated by percolation during summer melt). This type ofbubble was found consistently in melt pond ice, mostly aroundsmall ice crystals. The coexistence of the two types of airinclusions should be considered in microwave scattering models.The top and the middle layers contain newer ice, formedsubsequent to a melt season.
The third layer, about 100 mm below the surface, exhibitsclear, nearly inclusion-free columnar-grained ice. The grainsmay appear to be of fresh water origin but the non-planer or theslight irregularity of their boundaries (Fig. 8c) suggests that theice grew from brackish water. Measured salinity at depths wherethis layer exists ranges between 1.1 and 1.4 ppt.
Fig. 9 shows a vertical section from 150 to 270 mm depth fromcore #2. The core consisted of a 230 mm layer of non-salinesnow-ice with grain diameters less than 2 mm. This suggestedthat ice was formed from water-saturated snow cover whennumerous nucleators (snow particles) had existed. Air inclusionsof the type observed in snow ice are clearly visible in Fig. 9b.Their diameters range from 1.5 to 6 mm. Small air bubbles,typically less than 1 mm diameter, can also be seen. The snow-

ARCTIC SEA ICE MICROSTURCTURE OBSERVATIONS • 273
FIG. 8. Melt pond core #1. (a), (b) vertical section of the upper 140 mm depthphotographed between crossed polarizers and in diffuse light respectively, (c)horizontal section at 90 mm depth photographed between crossed polarizers.
ice layer is underlain by a 30 mm transition layer of larger grainswhose length varies between 1 to 4 mm. The layer marks atransition between the fine snow crystals and the columnargrains that represent originally saline ice which has been re-textured by aging (see the bottom of Fig. 9a). The establishmentof columnar-grained ice also establishes the growth conditionunder which the impurities can be pushed down to the ice/waterinterface. Note the smooth transition in the grain structure in Fig.9a. As for air inclusions, note the sharp boundary between thecolumnar-grained ice and the upper layers.
Careful examination of an individual air inclusion of the largediameter type (Fig. 9a), shows that its overall dark appearance is,in fact, cloudy with fading colours. The colours denote thepresence of fine crystals within the inclusion. This supports thepremise that the inclusions have originated from larger air pocketsentrapped between snow particles during the freezing process.
A vertical section of the upper 140 mm depth from core #3 isshown in Fig. 10. The section consists of a saline snow-ice layerof average salinity 5.5 ppt and grain dimensions from 1 to 4 mm
(the grain structure is not shown in the figure). This layer extendsto 170 mm and is underlain by columnar ice of less salinity,around 1 ppt. The relatively high salinity indicated that, prior tothe latest freezing season, the pond was either connected to the

274 • M.E. SHOKR and N.K. SINHA
FIG. 9. Melt pond core #2. Vertical section of a depth range 150 mm to 270 mm photographed (a) between crossed polarizers, (b) in diffuse light.
seawater through a thaw hole, or filled with seawater as thesurface was below the freeboard of the ice floe. The verticalneedles shown in Fig. 10 are brine pockets. The spherical brightobjects are air inclusions of the type observed in snow ice asdescribed above. The diameter of air inclusions varies from 2 to8 mm, with small inclusions existing near the surface.Observations from this core indicate that microwave dielectricand scattering models should account for the co-existence ofboth air and brine inclusions in melt pond ice.
Statistics of Air Bubbles in Multi-Year Ice
Bubbles were identified in digital images of vertical thinsections from 5 hummock and 5 melt pond cores. A total of 1496bubbles from melt pond ice and 520 bubbles from hummock icewere identified. The smallest bubble that can be identified has adiameter of 0.1 mm. Bubble statistics were derived from threeparameters: the circle equivalent diameter, the normalizedcompactness factor, and the distance to the nearest bubble. Thestatistics are included in Table 1. The average diameter of airbubbles in melt pond ice is 2.58 mm, which is slightly larger thanthat in hummock ice, 2.36 mm. The difference is attributed to the
presence of large bubbles of snow-ice origin in melt pond ice. Infact, the average diameter of that bubble type is 4.8 mm. Thenormalized compactness factor (C) is around 0.65 for both icetypes, indicating that the overall bubble shape is similar in bothtypes. Nevertheless, bubbles of snow-ice origin in melt pond ice
TABLE 1: Geometrical properties of air bubbles in multi-year ice
Ice type Parameter Mean Median Standard Deviation
melt pond D (mm) 2.58 2.00 1.96C 0.62 0.65 0.19d (mm) 4.03 3.81 1.73
hummock D (mm) 2.36 2.29 0.83C 0.68 0.69 0.12d (mm) — — —
D, circle-equivalent diameter; C, compactness factor; d, distancebetween nearest bubbles.
are more spherical, with an average C = 0.83. The averagedistance to the nearest bubble in melt pond ice is 4.03 mm. Thisdistance was not calculated for bubbles in hummock ice sincemost bubbles were detected manually due to their significant

ARCTIC SEA ICE MICROSTURCTURE OBSERVATIONS • 275
overlap. Therefore, bubble sampling was not random and thecalculated distance statistics should not be consideredrepresentative of the population.
Histograms of the three parameters are shown in Fig. 11. Thecircle-equivalent diameter histogram features a long tail for meltpond ice data; a manifestation of existence of the two bubble
FIG. 10. Melt pond core #3. Vertical section of the upper 140 mm depthphotographed in diffuse light.
types as suggested above. The compactness factor histogramsshow that melt pond ice contains inclusions of more elongatedshapes (i.e., of small compactness factor). Moreover, bubbles inhummock ice have a rather limited variety of shapes as comparedto bubbles in melt pond ice. The distance to the nearest bubble ischaracterized by a skewed histogram (from melt pond ice dataonly); this is evidence of the clustered bubble distributionpattern. The probabilities shown in Fig. 11 are important as astatistical description of bubbles in multi-year ice for the purposeof modeling microwave volume scattering models.
FIG. 11. Histograms of geometrical parameters of air bubbles in multi-year ice(a) circle-equivalent diameter, (b) normalized compactness factor, (c) distanceto the nearest bubble.
The probability of bubble existence at different depths isshown in Fig. 12 for melt pond ice data. Again, due to theinteractive method of bubble detection in hummock ice (i.e., thebiased sampling approach), the corresponding probability forhummock ice data was not obtained. A trend of bubble densitydecrease with depth is evident in the figure. The ragged appearanceof the plot is probably caused by the limited number of samples.More samples are required to account for the large variability ofthe bubble-rich layer thickness.

276 • M.E. SHOKR and N.K. SINHA
FIG. 12. Probability of occurrence of air bubbles in melt pond ice.
Air Bubble Formation in Multi-Year Ice
Based on observations from this study, a scenario of bubbleformation in multi-year ice is introduced. The validity of theproposed ideas is limited to the present observations and shouldbe established against other observations since variation of iceproperties and natural ice formation conditions are diverse.
Considerable ablation of the surface of multi-year ice takesplace in summer. Hummock surfaces are exposed to more solarradiation and will melt a significant amount of water. Also, meltwater accumulating in melt ponds will decrease albedo, increaseshortwave absorption, and will probably melt a significantamount of the ice beneath it. About 1 m of ice was observed tomelt on a multi-year floe in Sabine Bay, Melville Island duringthe summer of 1992 (Rajan, pers. comm. 1993). Thus, there ismuch drainage through the remaining ice. In order for surfacemelt water to penetrate ice volume, a drainage network must beestablished. This is feasible only if channels can have their endpoints connected to the atmosphere. The convex surface of ahummock makes this possible (Fig. 13a). The surface meltpenetrates ice and flushes salts. As the freezing season approaches,surface melt slows down while the water in channels continuesto drain by gravity. Hence, channels will be partially empty. Atfreezing time, the empty parts become what are known as airinclusions. In other words, bubbles at or near the surface areformed from the remains of water drainage channels establishedin summer. This scenario explains the two commonly-observedgeometrical features of air bubbles in hummock ice. The first istheir orientation nearly parallel to the vertical plane or the gravityaxis. The second is their interconnected nature near the surface.
The concave surface of melt pond ice does not allow formationof a drainage network in a significant manner. In this case,surface melt could accumulate, along with snow and rainwater,on top of the ice surface (Fig. 13b). At freezing time this layerconsolidates forming a “newer” ice layer that could consist of asnow-ice layer if snow fall occurs immediately before freezing.Formation of air inclusions in snow-ice is possible through twomeans. The first is air entrapment between snow particles; thesecond is air trapped in the water or dissolved air rejected fromwater during ice freezing.
FIG. 13. Multi-year ice surface conditions during summer melt (a) Hummocksurface and (b) Melt pond surface. Conditions lead to different mechanisms ofair bubble formation mechanisms.
Microwave Volume Scattering
An array of volume scattering models that apply to sea ice hasbeen produced in the last two decades. Models are based ondifferent realizations of ice and snow media, ranging from thenumber of scattering layers, the nature of interfaces betweenlayers (rough or planar), and the type and distribution of dielectricinhomogeneities (scatterers) in ice. An extensive review of seaice microwave volume scattering models is presented inWinebrenner et al., (1992). A common approach adopted inthese models is based on the concept of discrete scatterers (Kimet al., 1984; Tsang and Ishimaru, 1987). In this approach,scattering is assumed to be caused by geometrically distinctscatterers of identical dielectric constant embedded in a hostmaterial of different dielectric constant. This two-phase approachis particularly useful in the case of multi-year hummock icewhere clearly identifiable air bubbles are present in a backgroundof desalinated ice of low electromagnetic absorption. Informationon shapes, sizes, and spatial distribution of scatterers is necessaryto initiate these models. Kim et al. (1984) used a semi-empiricalmodel based on the assumption that scatterers are randomlydistributed spheres of constant diameter. Winebrenner et al.,

ARCTIC SEA ICE MICROSTURCTURE OBSERVATIONS • 277
(1989) evaluated a radiative transfer model based on the sameassumption. Their analyses show a strong sensitivity of scatteringcross section to air bubble radius. For example, backscattercoefficient increases by 4 dB as bubble radius increases from 0.5to 1.0 mm. This implies that accurate information on bubble sizeis required.
Melt pond ice is characterized by a great variety of bubblesize. The smallest bubble diameter that can be detected using thetechnique described above is 1 mm. However, based on thehistogram of bubble diameters (Fig. 11a), it can be inferred thata large number of smaller bubbles exist in melt pond ice.Scattering from small bubbles, less than approximately 2 mm,can be modeled as Rayleigh scattering (Kim et al., 1984;Drinkwater, 1989). The average circle-equivalent diameters inhummock and melt pond ice, 2.36 mm and 2.58 mm respectively,are almost equal to what is normally considered in microwavediscrete scatterer models. The deviation from this value is largerfor bubbles in melt pond ice (SD = 1.96 mm) as compared tobubbles in hummock ice (SD = 0.83 mm). The assumption ofspherical air bubbles in multi-year ice, commonly employed indiscrete scattering models, such as dense medium radiativetransfer (Tsang and Ishimaru, 1987), is generally valid. Bubbleshapes, however, deviate from a sphere, especially in the top(low density) layer of hummock ice. In that layer, bubbles areheavily connected and difficult to characterize. Ice can best bedescribed as a continuous random medium in which permittivityis a random function of position. Stogryn (1987) has developeda model to calculate the effective permittivity and Winebrenneret al., (1992) summarized available theories of microwavescattering in a random medium.
The coexistence of air inclusions and brine pockets in meltpond ice indicates that the assumption made in many dielectricand scattering models that multi-year ice is characteristicallylow-loss dielectric media with one inclusion/scattering elementtype (i.e., air bubbles) is not valid. Melt pond ice could have awide variety of ice types and salt content. If a melt pond isconnected to the sea water, under the floe, then highly saline,first-year type ice will exist on top of the pond in the winter. Inthis case models should account for the presence of three phases:pure ice, brine, and air bubbles.
Findings from this study signify five possible reasons for thevariability of microwave volume scattering from multi-year ice.They contribute to differences in scattering levels that canexplain the texture-rich signature of multi-year ice in SARimages (Holmes et al., 1984; Barber and LeDrew, 1991; Shokr,1991; Nystuen and Garcia, 1992; Rignot and Kwok, 1993). Thefirst is the intrinsic difference between air bubble characteristicsin hummocks and melt ponds. In hummock ice, air bubblesdelineate a trail of drainage channels where water from surfacemelt percolates through ice. In melt pond ice, the surface layer isoften composed of snow ice. This is where most of the airinclusions, believed to have originated from air entrapped betweensnow particles, exist. These inclusions are larger and moregeometrically isotropic than bubbles in hummock ice. Thesecond is the bubble orientation (both major axis of individualbubbles and their spatial arrangement) which follows mostly thepredominant grain orientation. This is observed only when
multi-year ice has evolved from saline first-year ice. Variabilityof microwave scattering is inevitable since air bubble orientationvaries relative to the fixed radar look and incidence angles (incase of SAR). The third is the possible existence of a saline meltpond surrounded by desalinated hummock ice. Saline meltponds absorb more microwave energy and therefore return lessvolume scattering. Desalinated and bubbly hummocks allowmore energy penetration and more volume scattering. The fourthis the formation of a newer snow-ice layer on top of the originalice in melt ponds. This layer, if present, is characterized byrelatively large bubbles as described above. Although notstatistically established, the present results indicate that thelayer’s thickness varies considerably, contributing to thevariability of volume scattering. The fifth reason is the variabilityin depth of the bubble-rich layer in hummock ice. The presentdata show that this layer varies between a few millimetres toapproximately 350 mm.
SUMMARY AND RECOMMENDATIONS
Basic information on crystalline structure, brine and airinclusions in Arctic sea ice was obtained from qualitativeanalysis of ice thin-section photographs. Statistics on size andshape of air bubbles in multi-year ice were also obtained fromdigital analysis of the photographs.
First-year ice features typically a thin layer (a few centimetres)of snow or frazil crystals, underlain by columnar crystals.Spherical brine pockets are observed within fine-grained icestructure. Needle-shaped brine pockets are observed withinvertically-oriented frazil ice and columnar-grained ice. Thepockets are parallel to the ice growth direction, which is mostlyvertical. Spherical pockets are also found in sub-surface layerswhere columnar ice growth is interrupted by the presence ofsnow-like crushed ice and frazil ice.
Analysis of multi-year ice crystal structure confirmed thewell-established conclusion that hummock and melt pond ice arestructurally different. Hummock ice has a large columnar structurestarting immediately under the surface. Melt pond ice is morelikely to contain snow ice in the surface layer, formed fromfreezing of snow slush or waterlogged snow, on top of pre-existing ice. Air bubbles are different between hummock andmelt pond ice in terms of their formation mechanism andgeometrical characteristics. In hummock ice, bubbles are formedas a result of water percolation from surface melt during summer.They retain complicated, highly interconnected shapes near thesurface and simpler, well separable shapes at larger depths. Theymeasure typically 1-5 mm. In melt pond ice, two types of airinclusions whose characteristic dimensions differ by an order ofmagnitude exist. The first type is observed in snow-ice layerscommonly existing near the surface. It probably originates fromair entrapped between snow grains when snow slush, originallydeposited on top of the pre-existing pond ice, is consolidated.These inclusions are nearly spherical with diameters between 3to 10 mm, independent of depth. The second type is observed infine-grained structure (snow-ice, frazil, or transition columnarice). It features small bubbles with typical diameters around

278 • M.E. SHOKR and N.K. SINHA
1 mm. Their origin is believed to be air trapped or rejected duringice formation on top of pre-existing melt pond ice surface.
In the top (low density) layer of hummock ice, bubbles tendto lose their individual entity and form a complicated network.In this case, ice can best be described as a continuous randommedium in which permittivity is a random function of position.In some melt pond cores, two inclusions, brine pockets and airbubbles, are observed. In this case, the conventional representationof multi-year ice as a two-phase medium of pure ice and airbubbles, may not be appropriate. A more realistic three-phasemodel should be considered.
A variety of grain structures and inclusion patterns are foundin cores collected from same area (roughly 300 × 300 m) in thesame multi-year ice floe. This raises a question on the spatialvariation of ice structural properties in relation to the observedmicrowave scattering signal. The variation should be addressedon a statistical basis in a future study.
A realistic physical model of multi-year ice should take intoaccount not only statistical characteristics of its microstructureincluding inclusions, but also probabilistic occurrence ofhummocks and melt ponds within a given floe. This requires anappropriate survey to determine characteristics of floe surfacetopography, followed by a proper core sampling scheme whichreflects those characteristics. A future experimental programshould be designed to fulfill this requirement. The present resultscan be used to test and revise assumptions employed in dielectricand microwave scattering models.
ACKNOWLEDGEMENTS
The SIMMS program has been initiated by the Earth ObservationsLaboratory of the Institute for Space and Terrestrial Science at theUniversity of Waterloo. The program is undertaken with supportfrom a variety of agencies including the Ice Centre EnvironmentCanada who provided the SAR image used in this study. The fieldassistance of David Lapp of Norland Science and Engineering Ltd.and Ronald Jerome of the National Research Council of Canada isgratefully acknowledged. The logistic support of the Polar ContinentalShelf Project, Energy Mines and Resources Canada is also appreciated.Thanks are due to the SIMMS’91 team for their support in differentcapacities.
REFERENCES
BARBER, D.G., 1991. The seasonal sea ice monitoring site (SIMS)1991 science plan. Technical Report ISTS-EOL-SIMS-TR91-001. Earth Observation Laboratory, Institute for Space andTerrestrial Science, University of Waterloo, Waterloo, Ontario,Canada.
BARBER, D.G., and LeDREW, E.F. 1991. SAR ice discrimination:A multivariate approach. Photogrammetric Engineering andRemote Sensing 57(4):385 –395.
BJERKELUND, C.A., LAPP, D.J., RAMSEIER, R.O., and SINHA,N.K. 1985. The texture and fabric of the second year sea icecover at Mould Bay, Prince Patrick Island, NWT, April 1983.
Proceedings of the International Geoscience & Remote SensingSymposium (IGARSS’85), University of Massachusetts, Amherst,MA.426 – 431.
COX, G.F.N., and WEEKS, W.F. 1975. Brine drainage and initialsalt entrapment in sodium chloride ice. Hanover, New Hampshire:U.S. Cold Regions Research and Engineering Laboratory,Research Report 345.
DeLOOR, G.P. 1968. Dielectric properties of heterogeneousmixtures containing water. Journal of Microwave Power 3:67 –73.
DRINKWATER, M.R. 1989. LIMEX’87 ice surface characteristics:Implications for C-band SAR backscatter signatures. IEEETransactions on Geoscience & Remote Sensing GE-27(5):501 –513.
EICKEN, H., and ANGE, M.A. 1989. Development and propertiesof sea ice in the coastal regime of the Southeastern Weddell Sea.Journal of Geophysical Research 94(C6):8193 –8206.
EICKEN, H., LANGE, M.A., and ACKLEY, S.F. 1990. Quantificationof sea-ice textures through automated digital image analysis.Hanover, New Hampshire: Cold Regions Research and EngineeringLaboratory, Monograph 90–1. 28–32.
FUNG, A., and EOM, H. J. 1982. Application of a combined roughsurface and volume scattering theory to sea ice and snowbackscatter. IEEE Transactions on Geoscience and RemoteSensing GE-20(4):528 –536.
GOGINENI, S., MOORE, R.K., WANG, Q., GOW, A., andONSTOTT, R.A. 1990. Radar backscatter measurements oversaline ice. International Journal of Remote Sensing 11(4):603 –615.
HOLMES, Q.A., NUESCH, D. R., and SCHUCHMAN, R. A.1984. Textural analysis and real-time classification of sea icetypes using digital SAR data. IEEE Transactions on Geoscienceand Remote Sensing GE-22(2):113 –120.
KIM, Y.S., MOORE, R.K., and ONSTOTT, R.G. 1984. Theoreticaland experimental study of radar backscatter from sea ice.Lawrence, Kansas: Remote Sensing Laboratory, University ofKansas. Technical Report. 331 –37.
LIVINGSTONE, C.E., SINGH, K.P., and GRAY, A.L. 1987.Seasonal and regional variation of active/passive microwavesignatures of sea ice. IEEE Transactions on Geoscience andRemote Sensing GE-25(2):159 – 173.
NAKAWO, M., and SINHA, N.K. 1981. Growth rate and salinityprofiles of first-year sea ice in the High Arctic. Journal ofGlaciology 27(96):315 – 330.
––––––. 1984. A note on brine layer spacing of first-year sea ice.Atmosphere/Ocean 22(2):193 – 206.
NICHOLS, A.D., WILHELM, J.W., GAFFIELD, T.W., INKDTER,R.D., and LEUNG, S.K. 1986. A SAR for real-time icereconnaissance. IEEE Transactions on Geoscience and RemoteSensing GE-24(3):383 –389.
NYSTUEN, J.A., and GARCIA JR., W. 1992. Sea ice classificationusing SAR backscatter statistics. IEEE Transactions onGeoscience and Remote Sensing 30(3):502 –509.
ONSTOTT, R.G. 1992. SAR and scatterometer signatures of seaice. In: Carsey, F.D., ed. Microwave remote sensing of sea ice.Geophysical Monograph 68, American Geophysical Union.73 –104.

ARCTIC SEA ICE MICROSTURCTURE OBSERVATIONS • 279
PEROVICH, D.K., and GOW, A.J. 1991. A statistical descriptionof the microstructure of young sea ice. Journal of GeophysicalResearch. 96(C9):16943 –16953.
PEYTON, H.R. 1966. Sea ice strength. Fairbanks, Alaska:Geophysical Institute, University of Alaska. Technical Report,UAGR-182.
POE, G.A., STOGRYN, A., EDGERTON, A.T., and RAMSEIER,R.O. 1974. Study of microwave emissive properties of sea ice.Azusa, California: Aerojet Electrosystems Co. Technical Report,1804FR-1.
REDDAN, S.P., BARBER, D.G., and LeDREW, E.F. 1991.SIMMS’91 data report. Technical Report ISTS-EOL- SIMS-TR91-005. Earth Observation Laboratory, ISTS, University ofWaterloo, Waterloo, Ontario, Canada.
RIGNOT, E., and KWOK, R. 1993. Characterization of spatialstatistics of distributed targets in SAR data. International Journalof Remote Sensing 14(2):345 –363.
SHOKR, M.E. 1991. Evaluation of second-order textural parametersfor sea ice classification from radar images. Journal ofGeophysical Research 96(C6):10625 – 10640.
SHOKR, M.E., and SINHA, N.K. In press. Physical, dielectricaland microstructural properties of Arctic sea ice observed duringSIMMS’92 field experiment. Research Report #MRB,Atmospheric Environment Service, Toronto, Canada.
SINHA, N.K. 1977. Technique for studying structure of sea ice.Journal of Glaciology 21:385.
––––––. 1984. Uniaxial compressive strength of first-year andmulti-year sea ice. Canadian Journal of Civil Engineering 11:82– 91.
––––––. 1986. Young Arctic frazil ice: field and laboratory strengthtests. Journal of Materials Science 21(5):1533 –1546.
STOGRYN, A. 1987. An analysis of the tensor dielectric constantof sea ice at microwave frequencies. IEEE Transactions onGeoscience and Remote Sensing GE-25(2):147 –158.
TSANG, L., and ISHIMARU, A. 1987. Radiative wave equationsfor vector electromagnetic propagation in dense nontenuousmedia. Journal of Electromagnetic Wave Applications 1(2):161 –175.
TUCKER III, W.B., GOW, A.J., and WEEKS, W.F. 1987. Physicalproperties of summer sea ice in the Fram Strait. Journal ofGeophysical Research 92(C7):6787-6803.
TUCKER III, W.B., GRENFELL, T.C., ONSTOTT, R.G., PEROVICH,D.K., GOW, A.J., SHUCHMAN, R.A., and SUTHERLAND, L.L.1991. Microwave and physical properties of sea ice in the winterMarginal Ice Zone. Journal of Geophysical Research 96(C3):4573 –4587.
ULABY, F., MOORE, R.K., and FUNG, A.K. 1986. MicrowaveRemote Sensing. Vol II. Washington, D.C.:Artech House, Inc.
VANT, M.R., RAMSEIER, R.O., and MAKIOS, V. 1978. Thecomplex dielectric constant of sea ice at frequencies in the rangeof 0.1-40 GHz. Journal of Applied Physics 49(3):1264 –1280.
WEEKS, W.F., and ACKLEY, S.F. 1982. The growth, structure,and properties of sea ice. Hanover, New Hampshire: ColdRegions Research and Engineering Laboratory, Monograph82 –1.
WEEKS, W.F., and ASSUR, A. 1963. Structural control of thevertical variation of the strength of sea and salt ice. In: Kingery,W.D., ed. Ice and snow; properties, processes, and applications.Cambridge, Massachusetts: M.I.T. Press. 258 –276.
WEEKS, W.F., and GOW, A. J. 1978. Preferred crystal orientationin the fast ice along the margins of the Arctic Ocean. Journal ofGeophysical Research 83:5105 -5121.
WEEKS, W.F., GOW, A.J., KOSLOFF, P., and DIGBY-ARGUS,S. 1990. The internal structure, composition and properties ofbrackish ice from the Bay of Bothnia. Hanover, New Hampshire:Cold Regions Research and Engineering Laboratory, Monograph90-1:5 –15.
WEEKS, W.F., and LOFGREN, R. 1967. The effective solutedistribution coefficient during the freezing of NaCl solutions.In: Oura, H., ed. Physics of snow and ice, Vol. 1, Part 1. Instituteof Low Temperature Science, Hokkaido University, Japan.579 –597.
WINEBRENNER, D.P., TSANG, L., WEN, B., and WEST, R.1989. Sea ice characterization measurements needed for testingof microwave remote sensing models. IEEE Journal of OceanicEngineering 14(2):49 –158.
WINEBRENNER, D.P., BREDOW, J., FUNG, A.K.,DRINKWATER, M.R., NGHIEM, S., GOW, A.J., PEROVICH,D.K., GRENFELL, T.C., HAN, H.C., KONG, J.A., LEE, J.K.,MUDALIAR, S., ONSTOTT, R., TSANG, L., and WEST, R.D.1992. Microwave sea ice signature modeling. In: Carsey, F.D.,ed.. Microwave remote sensing of sea ice. GeophysicalMonograph 68, American Geophysical Union. 137 – 175.