Embed Size (px)
Citation preview
ARCTIC SEA ICE
PAST, PRESENT AND FUTURE
Asgeir Sorteberg, Marianne Skolem Andersenand Nils Gunnar Kvamstø
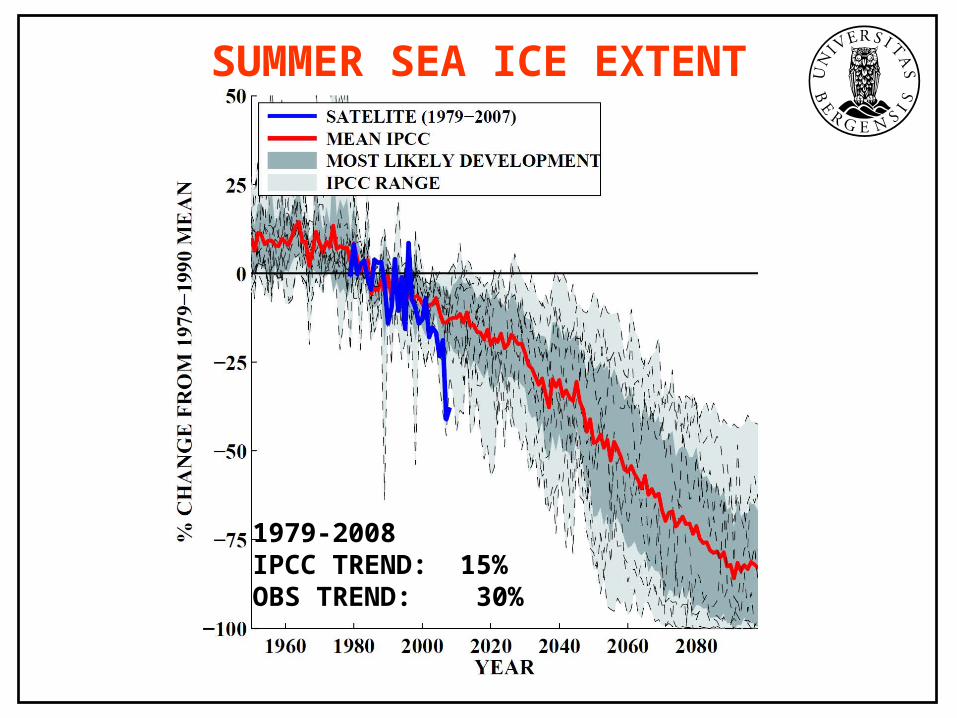
SUMMER SEA ICE EXTENT
1979-2008IPCC TREND: 15% OBS TREND: 30%
QUESTIONS
• PREDICTIONS – WILL THIS CONTINUE?
• UNDERSTANDING OF THE PROCESSES
• ENVIRONMENTAL AND SOCIO-ECONOMIC IMPACT
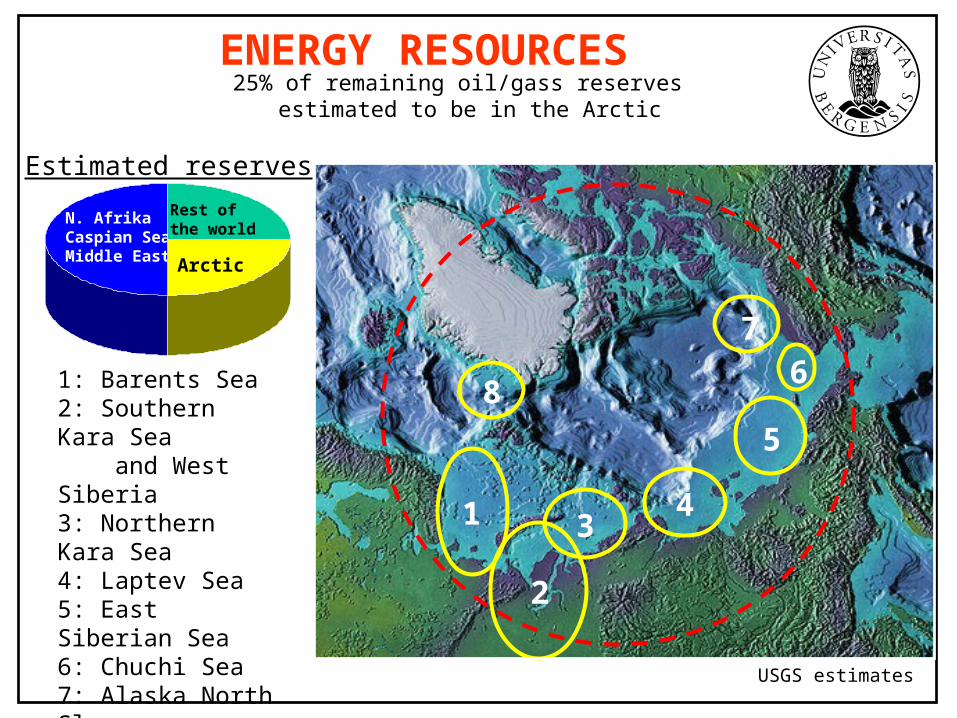
1: Barents Sea2: Southern Kara Sea and West Siberia3: Northern Kara Sea4: Laptev Sea5: East Siberian Sea6: Chuchi Sea7: Alaska North Slope8: East Greenland
Estimated reserves
N. AfrikaCaspian SeaMiddle East
Rest ofthe world
Arctic
8
3
2
1 4
5
67
USGS estimates
25% of remaining oil/gass reserves estimated to be in the Arctic
ENERGY RESOURCES
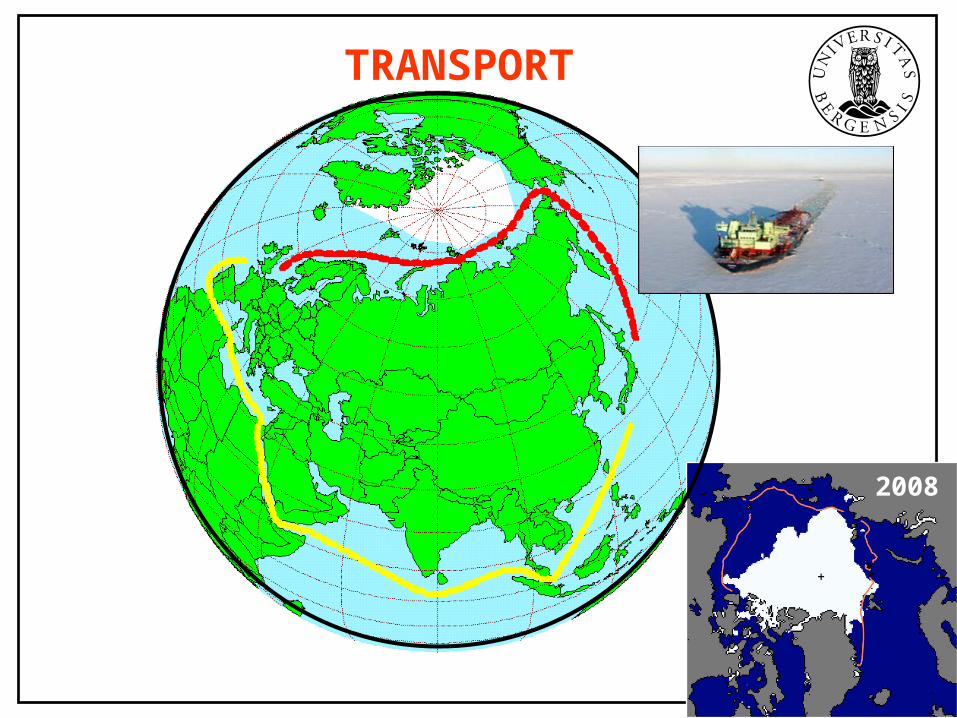
TRANSPORT
2008
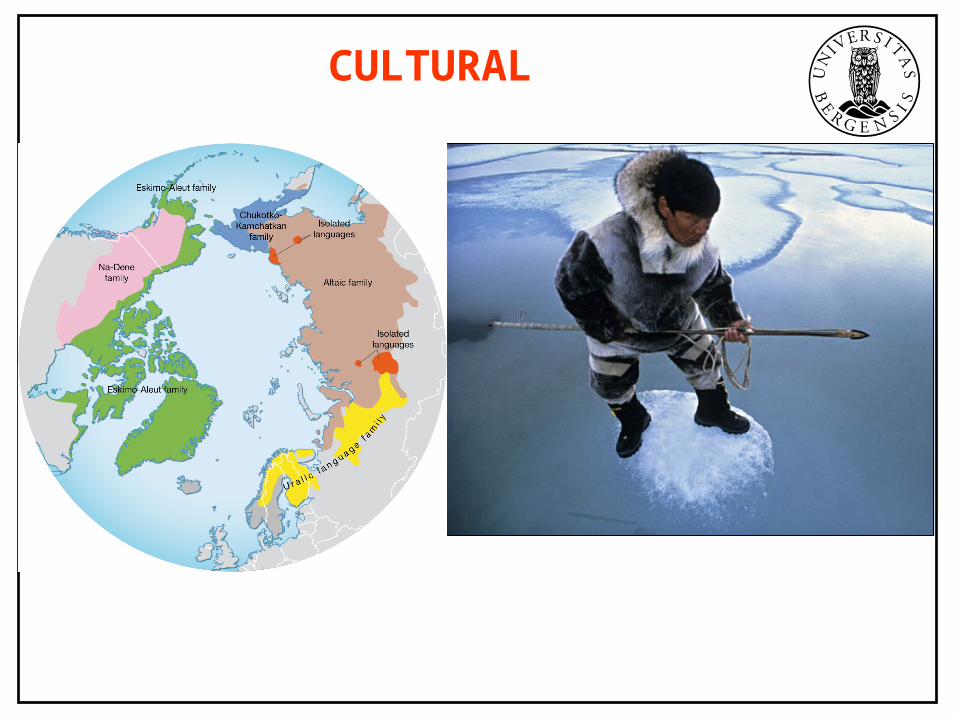
CULTURAL
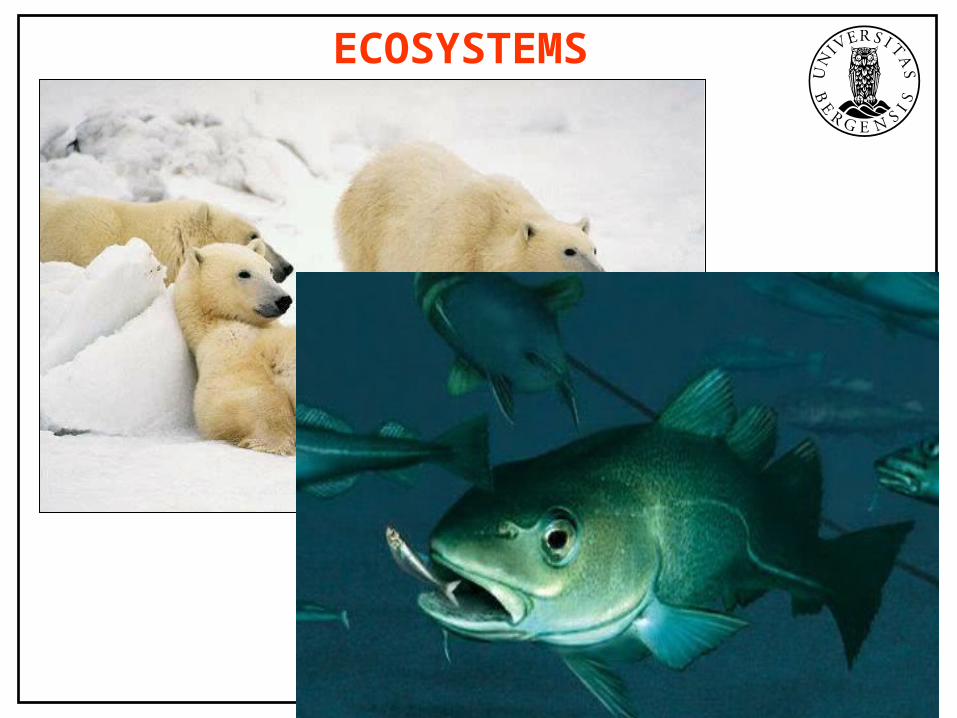
ECOSYSTEMS
OBSERVATIONS OF SEA ICE
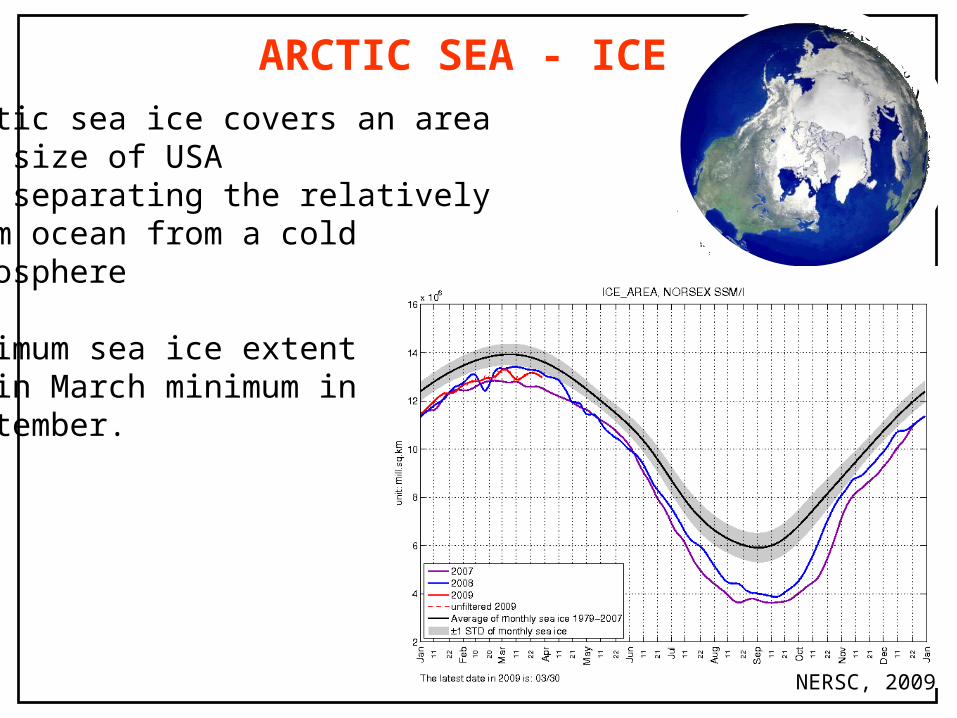
Arctic sea ice covers an areathe size of USA Its separating the relatively warm ocean from a cold atmosphere
Maximum sea ice extent is in March minimum in September.
ARCTIC SEA - ICE
NERSC, 2009
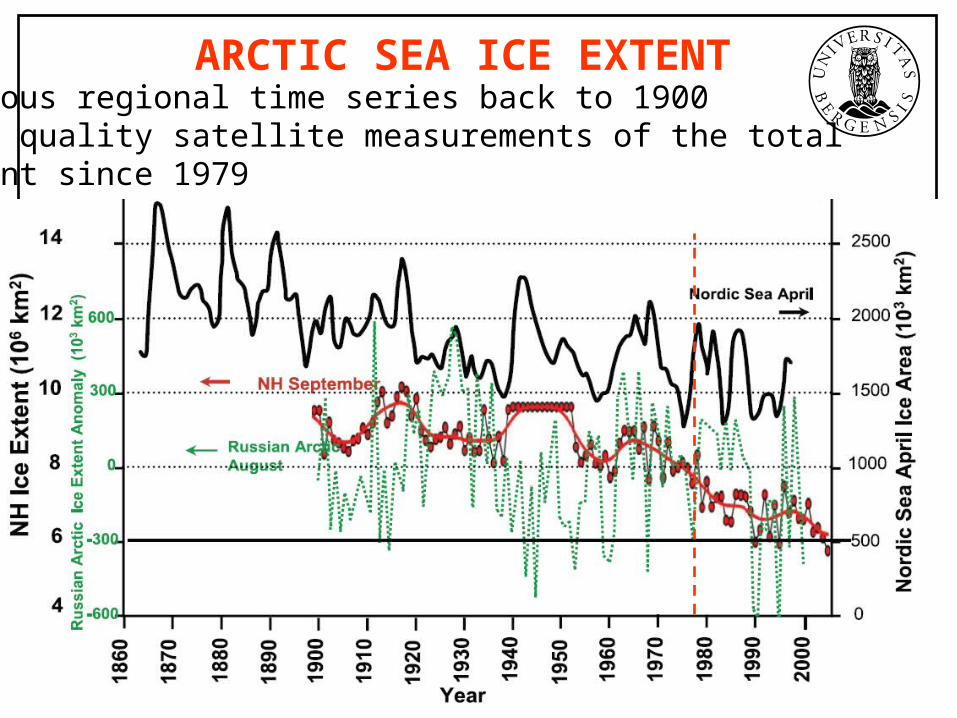
Various regional time series back to 1900Good quality satellite measurements of the total extent since 1979
ARCTIC SEA ICE EXTENT
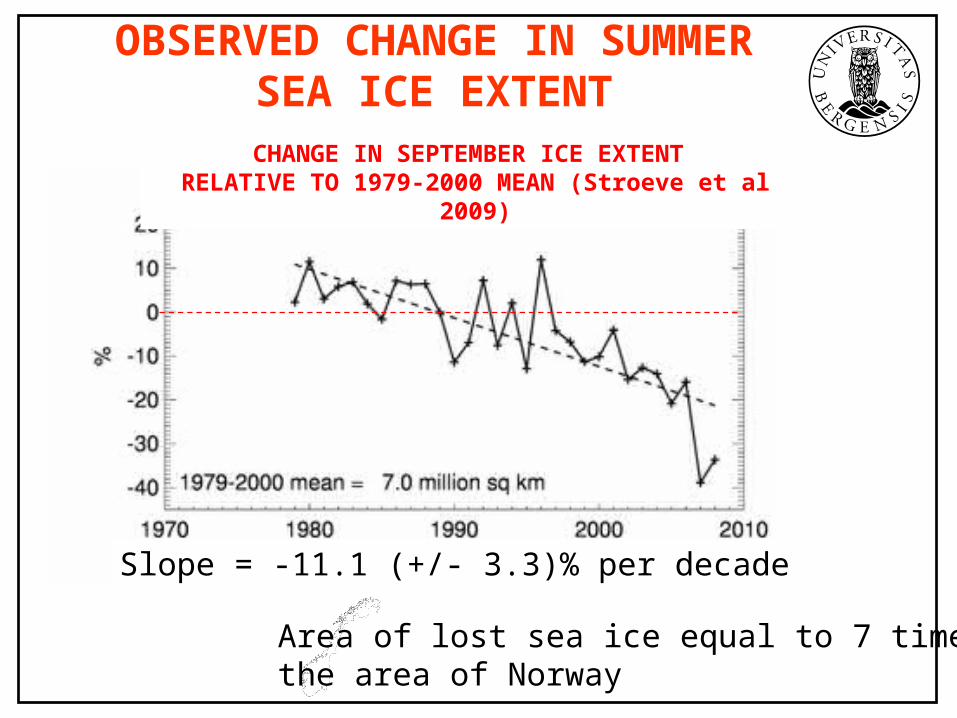
OBSERVED CHANGE IN SUMMER SEA ICE EXTENT
CHANGE IN SEPTEMBER ICE EXTENT RELATIVE TO 1979-2000 MEAN (Stroeve et al
2009)
Slope = -11.1 (+/- 3.3)% per decade
Area of lost sea ice equal to 7 times the area of Norway
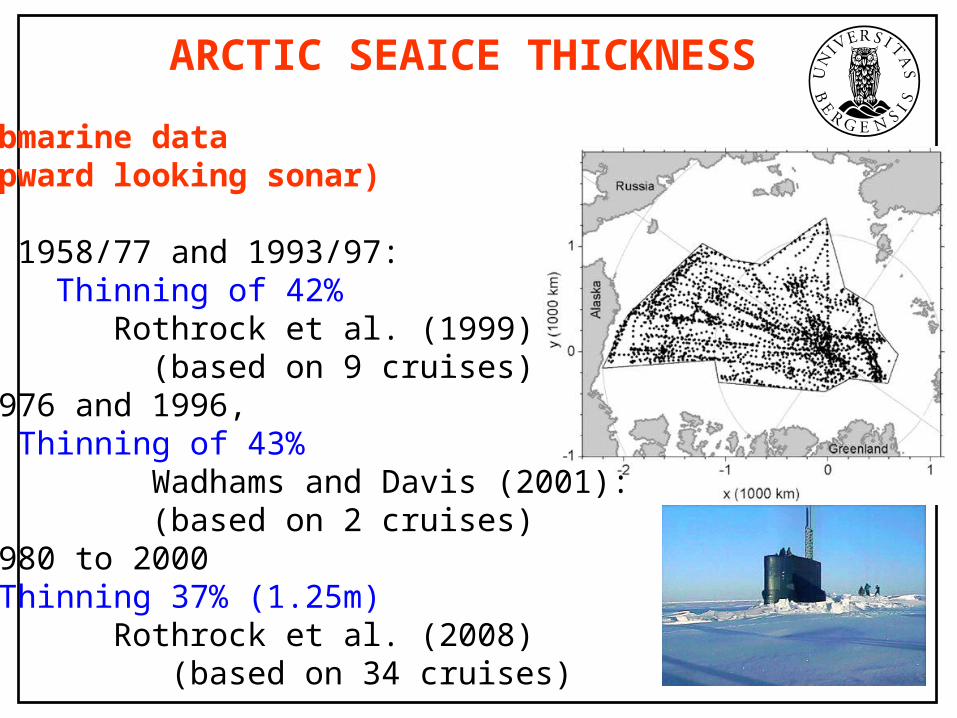
Submarine data (upward looking sonar) • 1958/77 and 1993/97: Thinning of 42% Rothrock et al. (1999) (based on 9 cruises)•1976 and 1996, Thinning of 43% Wadhams and Davis (2001): (based on 2 cruises)•1980 to 2000 Thinning 37% (1.25m) Rothrock et al. (2008) (based on 34 cruises)
ARCTIC SEAICE THICKNESS
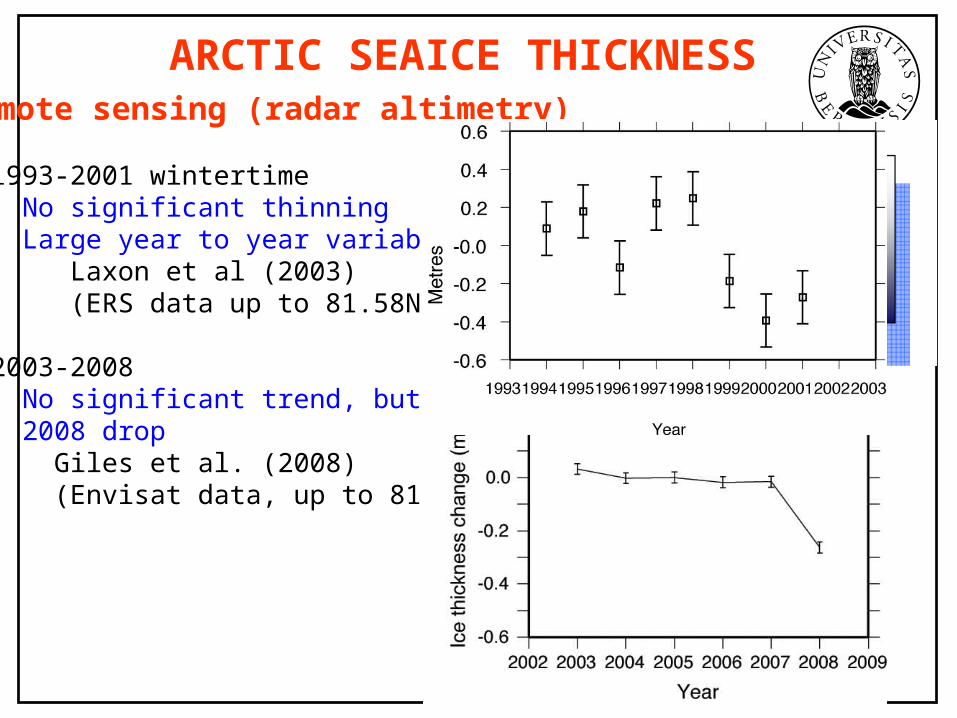
Remote sensing (radar altimetry)
• 1993-2001 wintertime No significant thinning Large year to year variability Laxon et al (2003) (ERS data up to 81.58N)
• 2003-2008 No significant trend, but 2008 drop Giles et al. (2008) (Envisat data, up to 81.58N)
ARCTIC SEAICE THICKNESS
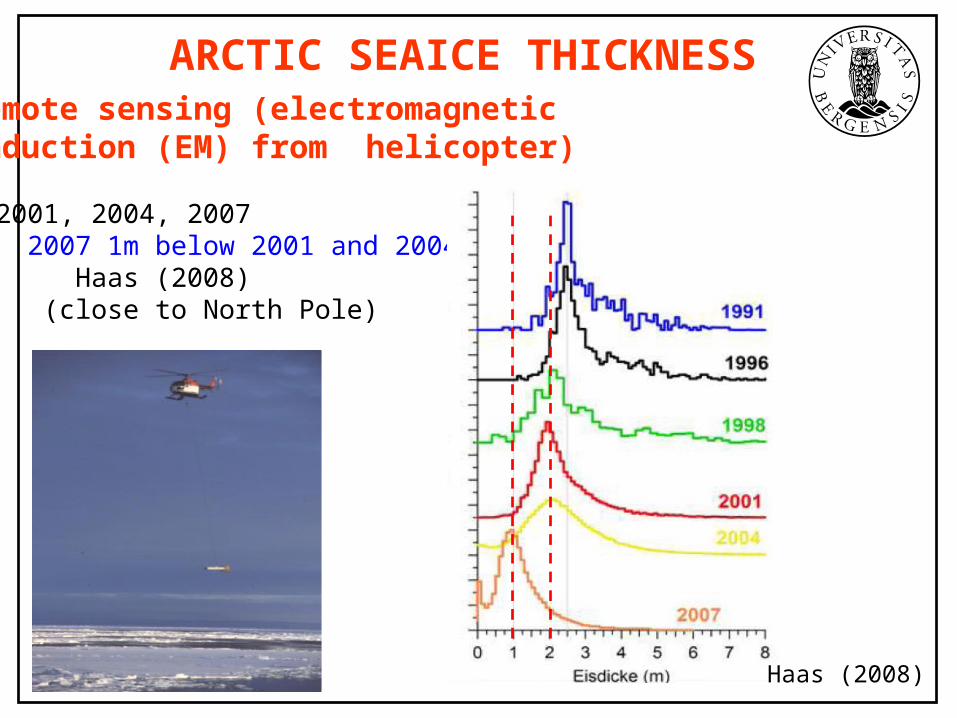
Remote sensing (electromagnetic induction (EM) from helicopter)
• 2001, 2004, 2007 2007 1m below 2001 and 2004 Haas (2008) (close to North Pole)
ARCTIC SEAICE THICKNESS
Haas (2008)
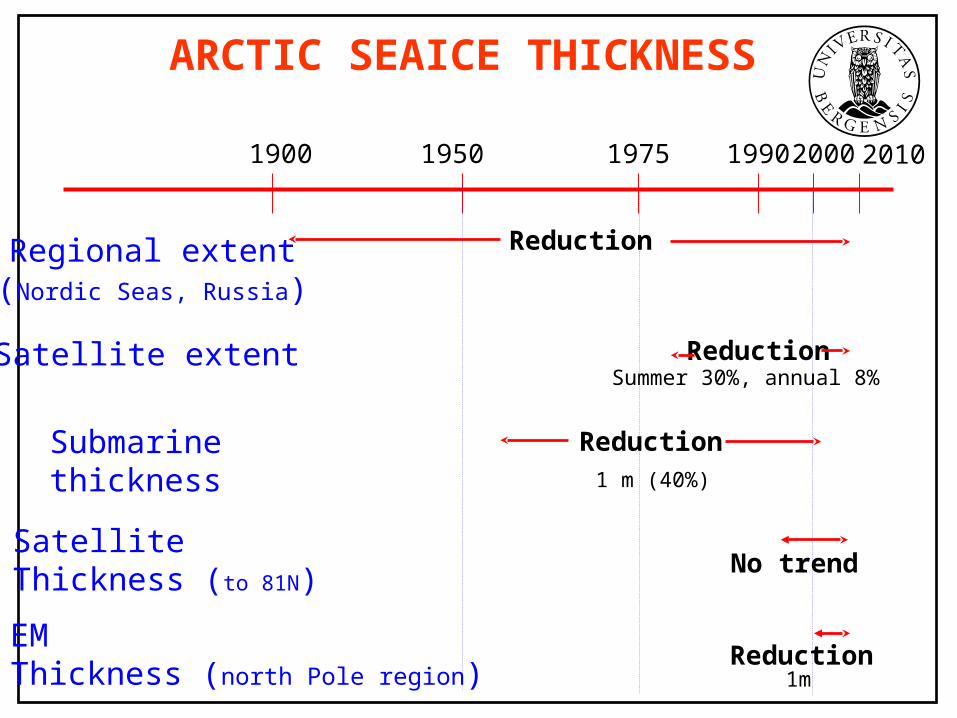
ARCTIC SEAICE THICKNESS
1950 1975 2000
Submarinethickness
Reduction
Reduction
Regional extent(Nordic Seas, Russia)
Reduction
1900 1990
Satellite extent
Reduction
SatelliteThickness (to 81N) No trend
2010
EMThickness (north Pole region)
Summer 30%, annual 8%
1 m (40%)
1m

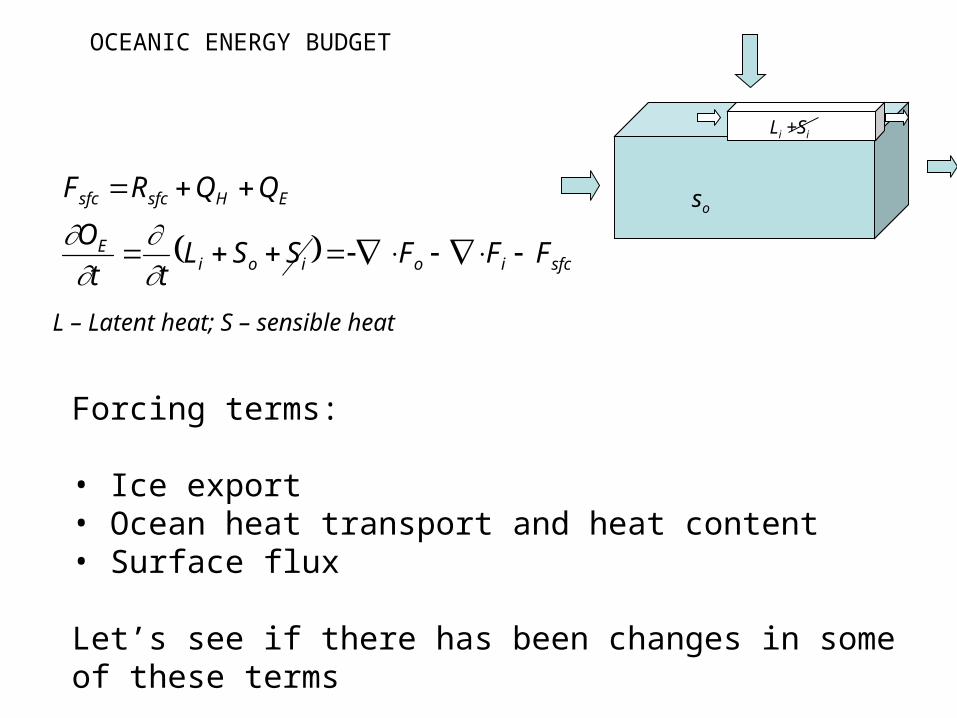
OBSERVATIONS OF FORCING TERMS
sfcioioiE
EHsfcsfc
FFFSSLtt
O
QQRF
so
Li +Si
OCEANIC ENERGY BUDGET
L – Latent heat; S – sensible heat
Forcing terms: • Ice export• Ocean heat transport and heat content• Surface flux
Let’s see if there has been changes in someof these terms

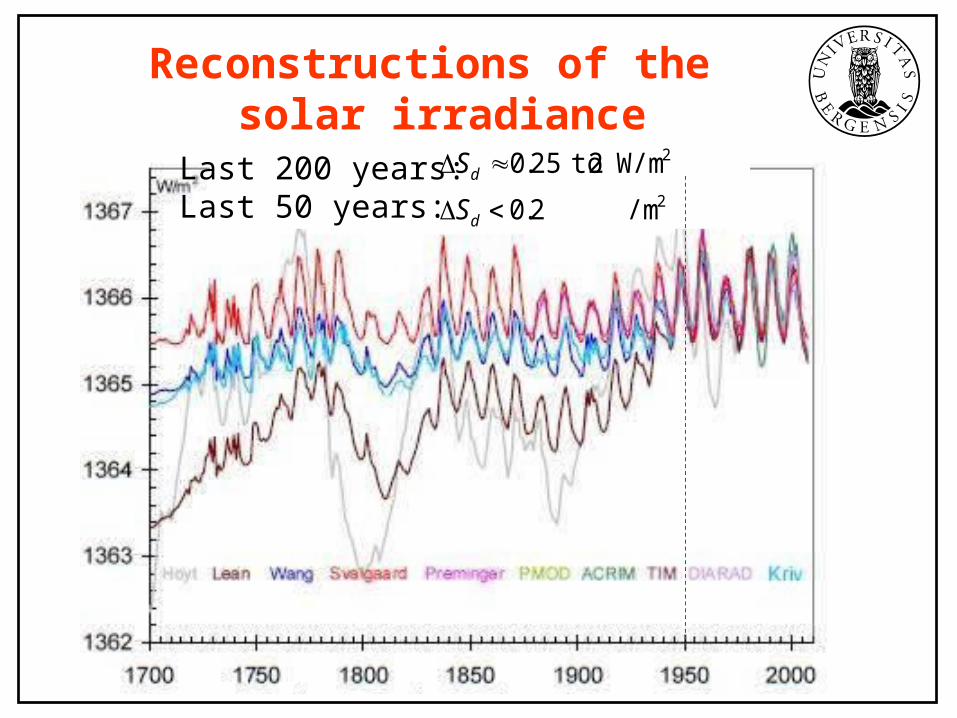
RADIATION TERMS
2
2
/m W2.0
W/m2 to25.0
d
d
S
SLast 200 years:Last 50 years:
Reconstructions of the solar irradiance
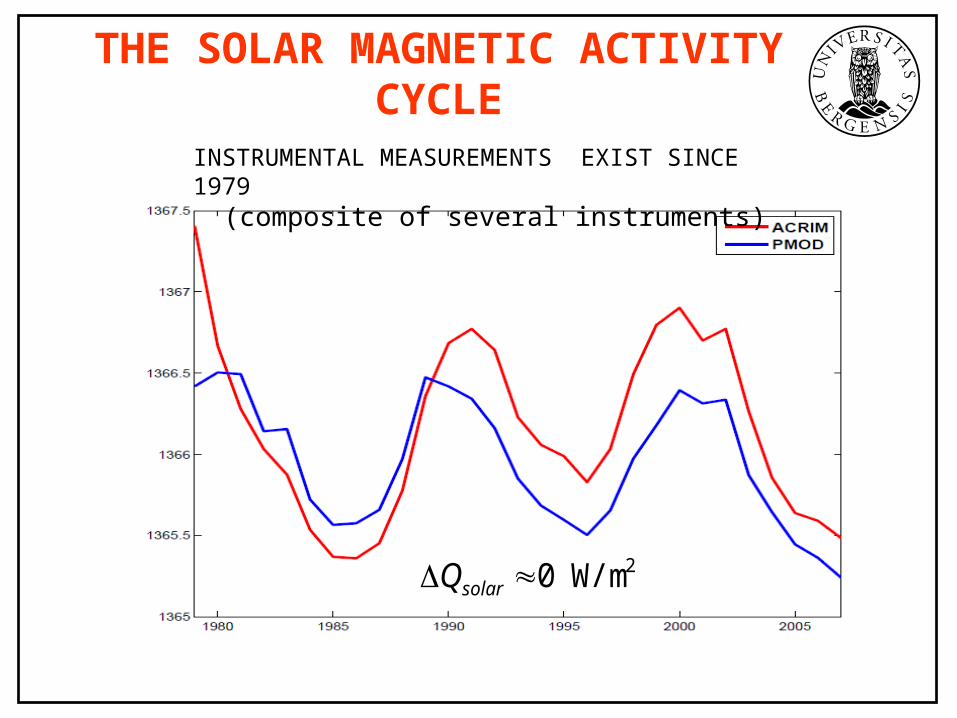
INSTRUMENTAL MEASUREMENTS EXIST SINCE 1979(composite of several instruments)
THE SOLAR MAGNETIC ACTIVITY CYCLE
2 W/m0 solarQ
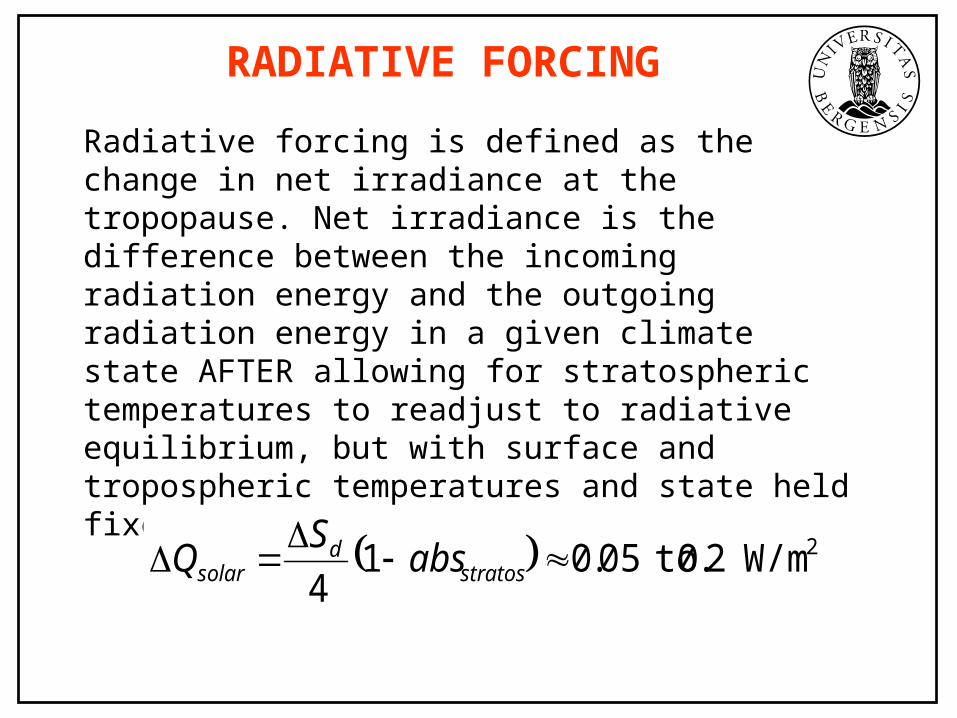
RADIATIVE FORCING
Radiative forcing is defined as the change in net irradiance at the tropopause. Net irradiance is the difference between the incoming radiation energy and the outgoing radiation energy in a given climate state AFTER allowing for stratospheric temperatures to readjust to radiative equilibrium, but with surface and tropospheric temperatures and state held fixed at the unperturbed values. [W/m2]
2 W/m2.0 to05.014
stratosd
solar absS
Q
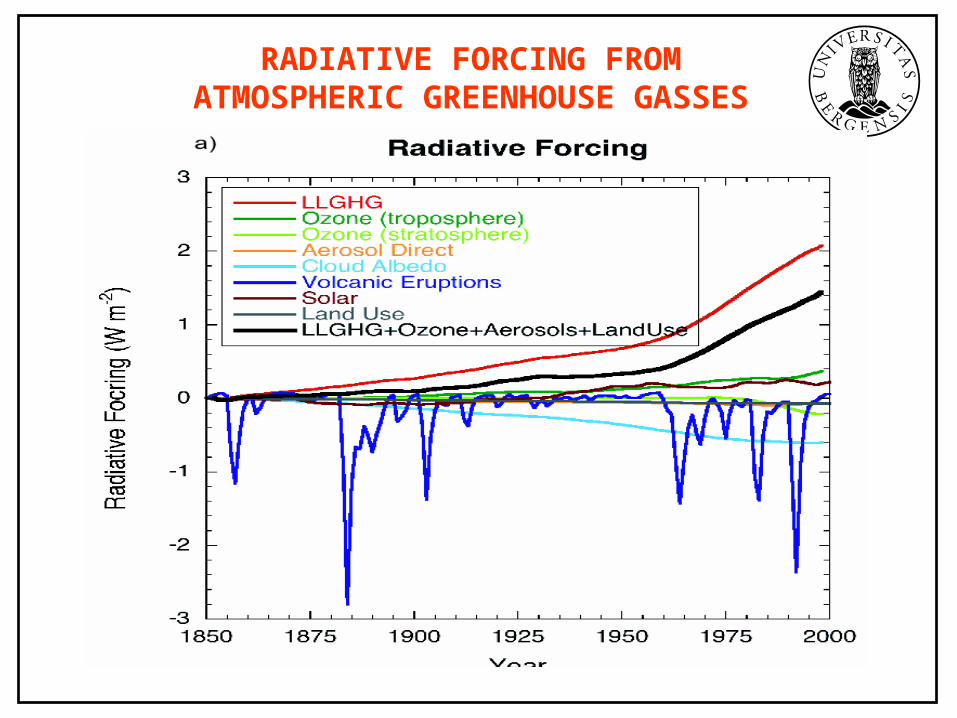
RADIATIVE FORCING FROMATMOSPHERIC GREENHOUSE GASSES
IPCC., 2007
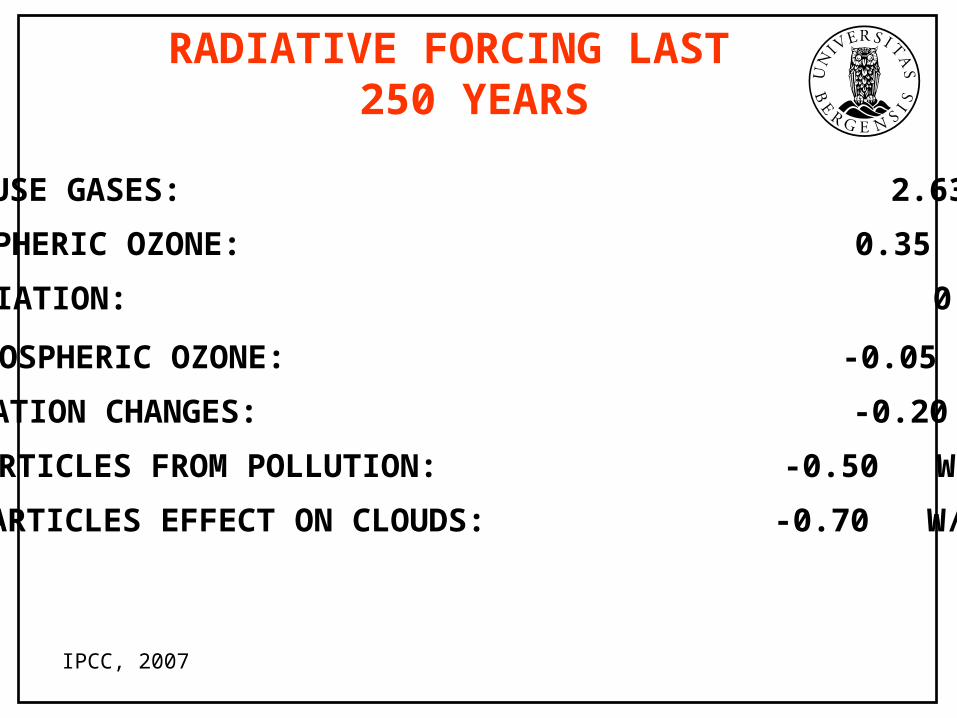
GREENHOUSE GASES: 2.63 W/m2
TROPOSPHERIC OZONE: 0.35 W/m2
SOLAR RADIATION: 0.12 W/m2
STRATOSPHERIC OZONE: -0.05 W/m2
PARTICLES EFFECT ON CLOUDS: -0.70 W/m2
VEGETATION CHANGES: -0.20 W/m2
PARTICLES FROM POLLUTION: -0.50 W/m2
SUM: 1.65 W/m2
RADIATIVE FORCING LAST 250 YEARS
IPCC, 2007
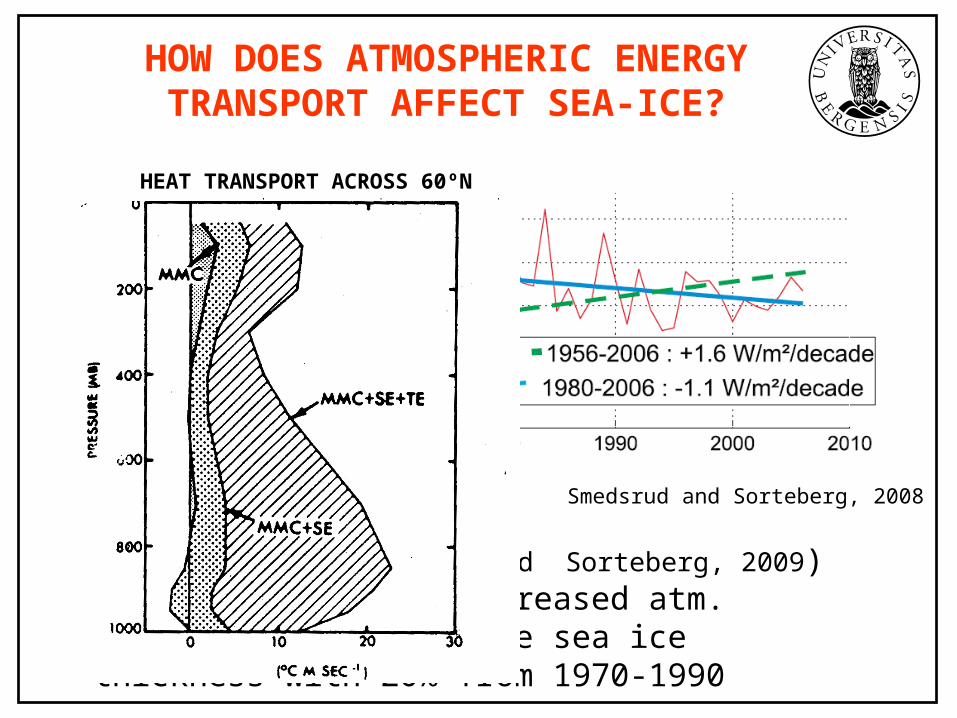
Smedsrud and Sorteberg, 2008
HOW DOES ATMOSPHERIC ENERGY TRANSPORT AFFECT SEA-ICE?
Model study (Andersen and Sorteberg, 2009) indicates that the increased atm. energy flux reduced the sea ice thickness with 20% from 1970-1990
HEAT TRANSPORT ACROSS 60ºN
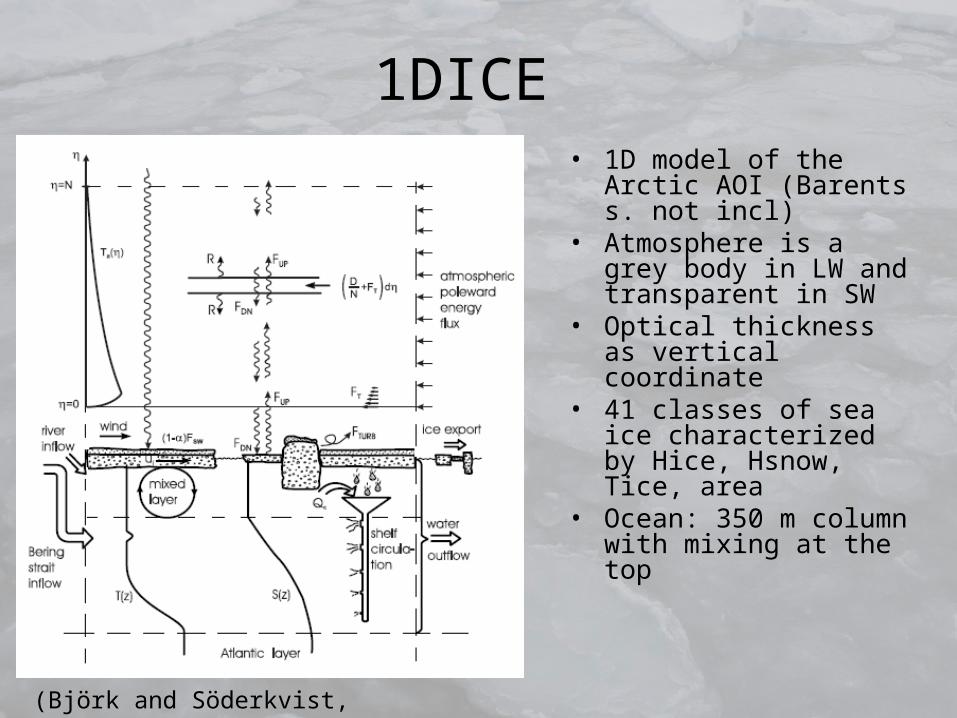
1DICE • 1D model of the Arctic
AOI (Barents s. not incl)• Atmosphere is a grey
body in LW and transparent in SW
• Optical thickness as vertical coordinate
• 41 classes of sea ice characterized by Hice, Hsnow, Tice, area
• Ocean: 350 m column with mixing at the top
(Björk and Söderkvist, 2002)
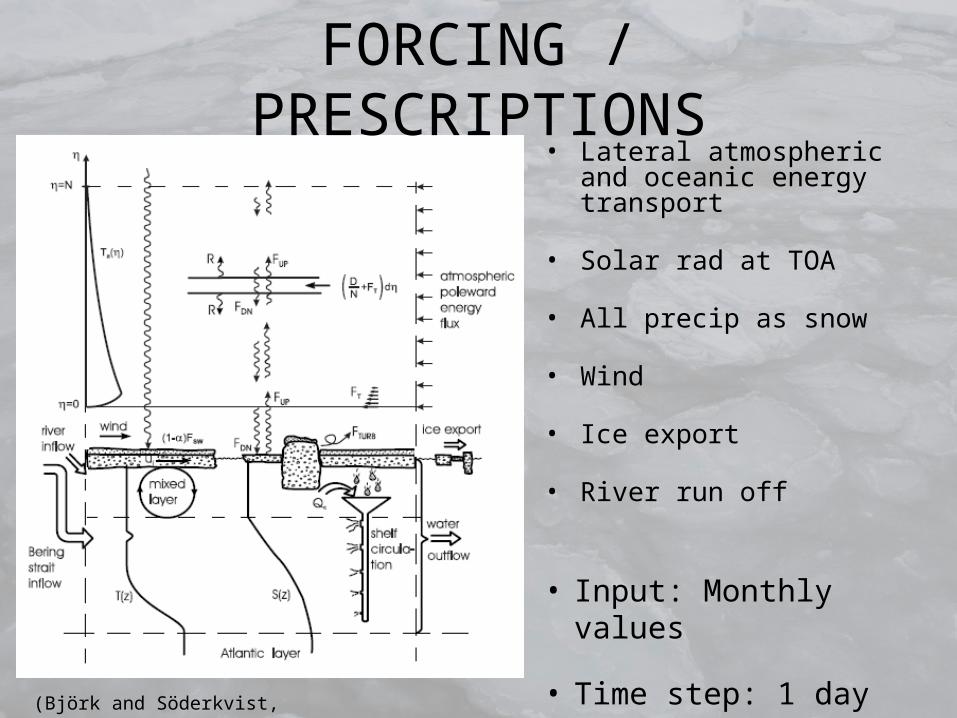
• Input: Monthly values
• Time step: 1 day(Björk and Söderkvist, 2002)
FORCING / PRESCRIPTIONS• Lateral atmospheric and
oceanic energy transport
• Solar rad at TOA
• All precip as snow
• Wind
• Ice export
• River run off
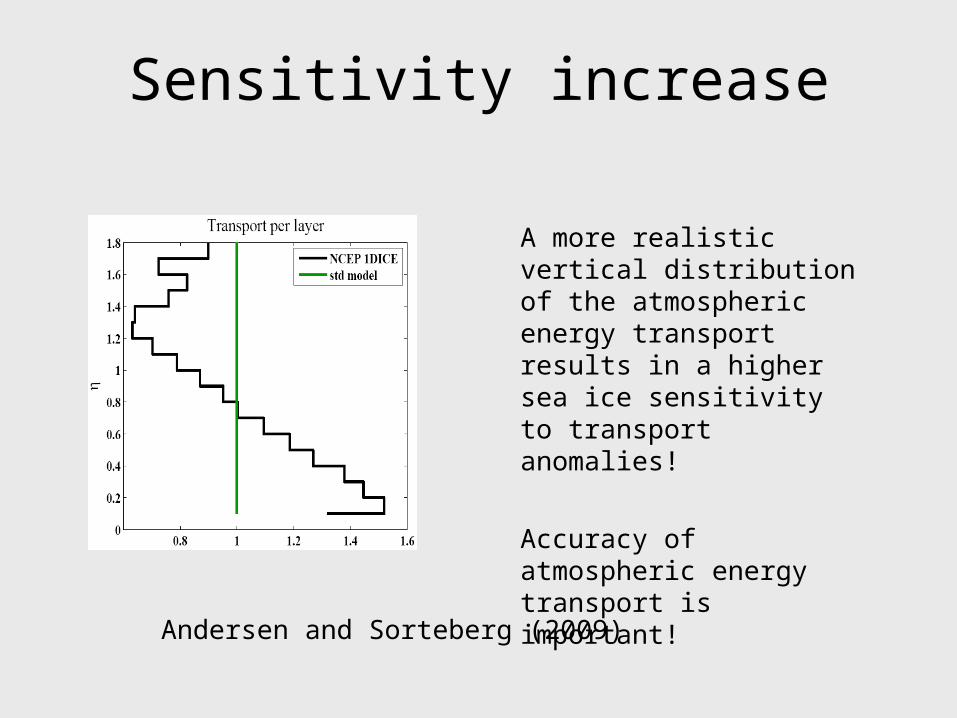
Sensitivity increase
A more realistic vertical distribution of the atmospheric energy transport results in a higher sea ice sensitivity to transport anomalies!
Accuracy of atmospheric energy transport is important!
Andersen and Sorteberg (2009)
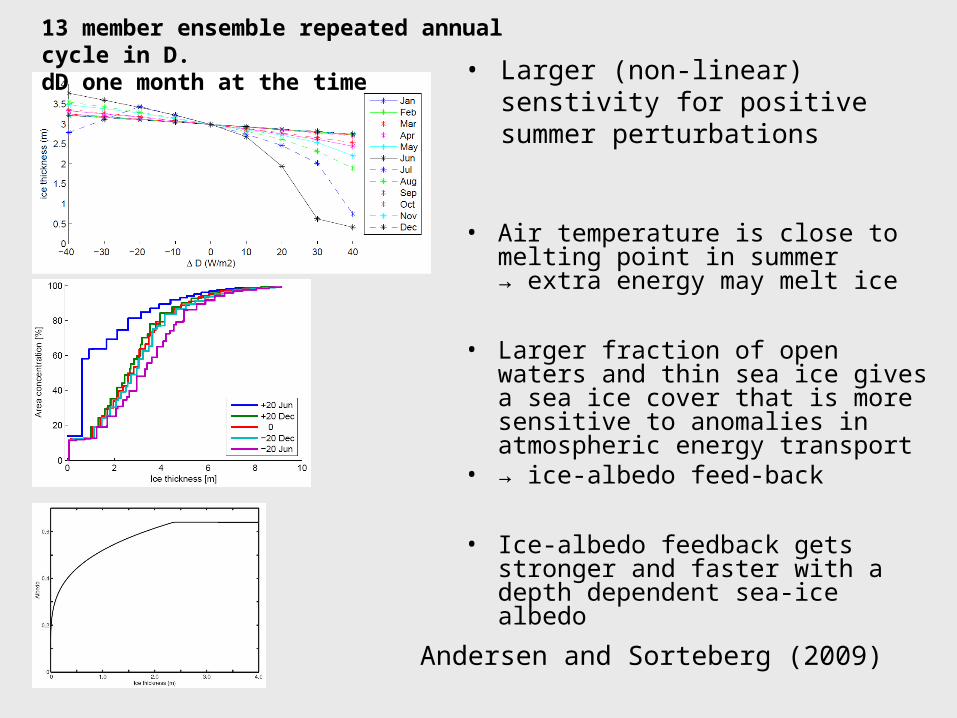
• Air temperature is close to melting point in summer → extra energy may melt ice
• Larger fraction of open waters and thin sea ice gives a sea ice cover that is more sensitive to anomalies in atmospheric energy transport
• → ice-albedo feed-back
• Ice-albedo feedback gets stronger and faster with a depth dependent sea-ice albedo
• Larger (non-linear) senstivity for positive summer perturbations
13 member ensemble repeated annual cycle in D. dD one month at the time
Andersen and Sorteberg (2009)
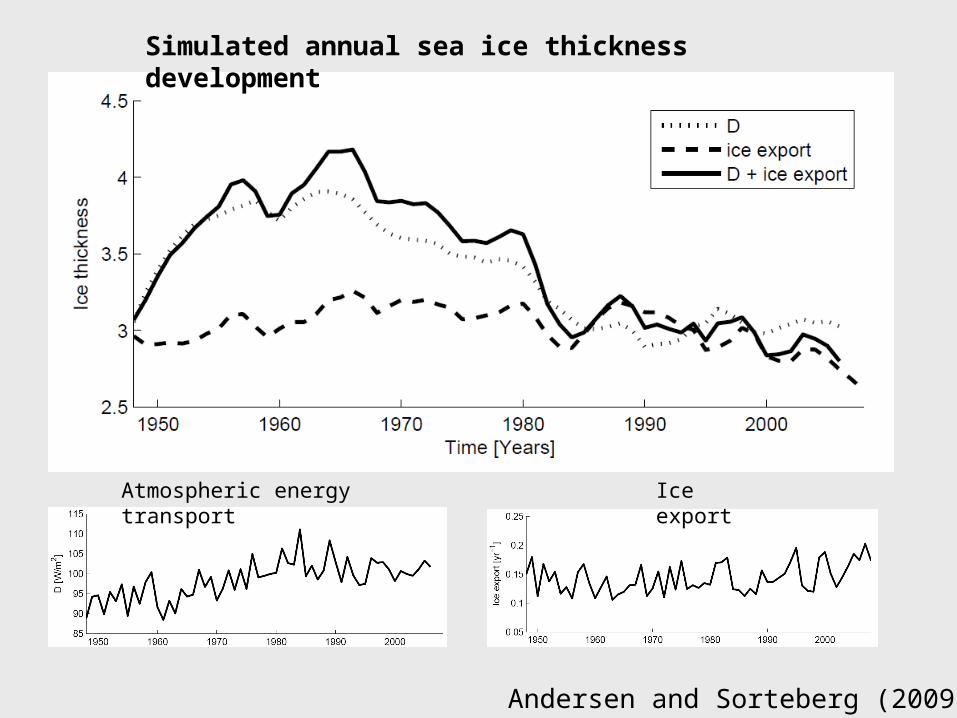
Simulated annual sea ice thickness development
Atmospheric energy transport Ice export
Andersen and Sorteberg (2009)
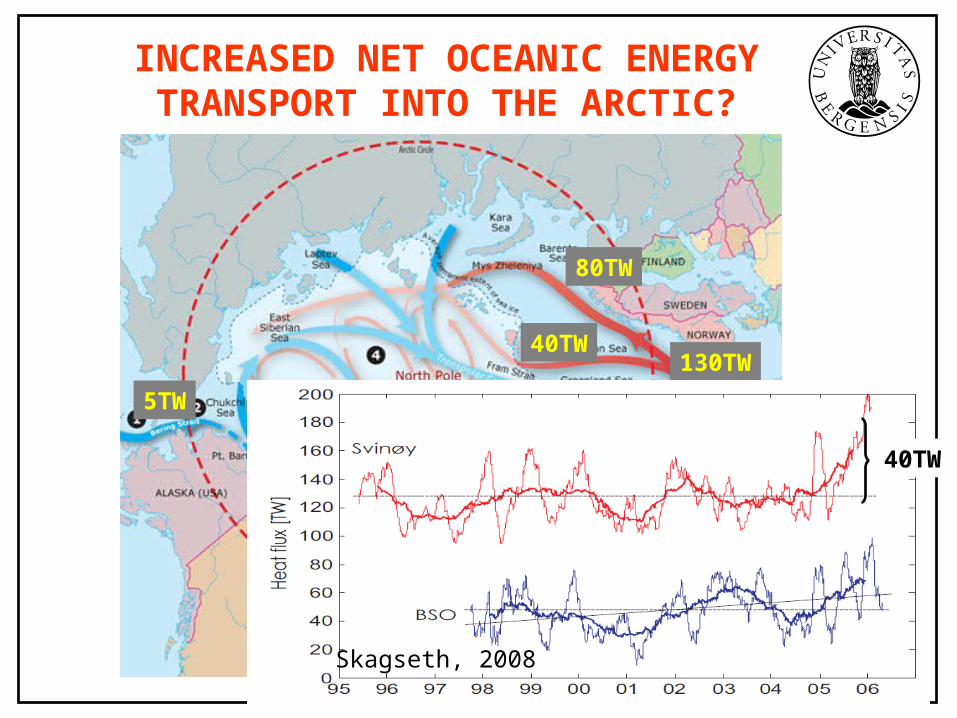
INCREASED NET OCEANIC ENERGY TRANSPORT INTO THE ARCTIC?
40TW130TW
80TW
5TW
40TW
Skagseth, 2008

89N, 166E
Possibly more oceanic heat transportlast few years
Warm water into Arctic does not necessarily means more melting.Depends on turbulent mixing
Observations indicates that turbulent mixing is low outside shelf areas (Sirevåg, 2008)
INCREASED NET OCEANIC ENERGY TRANSPORT INTO THE ARCTIC?
Model study (Smedsrud and Sorteberg, 2008) indicates that an increase in oceanic heatflow of 40TW (5W/m2) over 10 years reduces the ice thickness with 10-15%

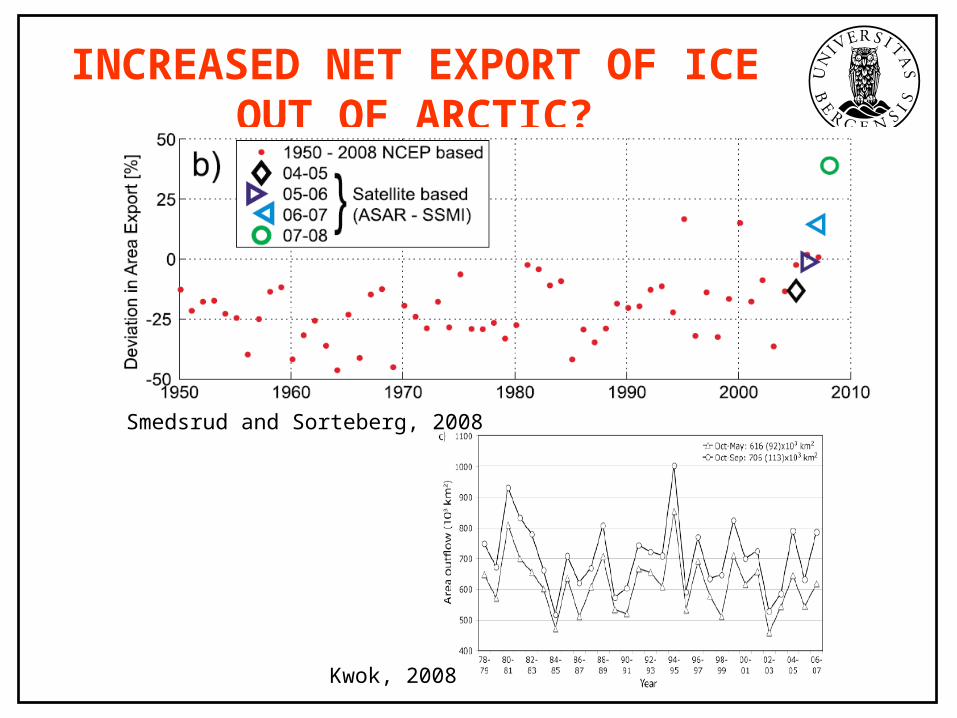
INCREASED NET EXPORT OF ICE
OUT OF ARCTIC?
INCREASED NET EXPORT OF ICE
OUT OF ARCTIC?
Smedsrud and Sorteberg, 2008
Kwok, 2008
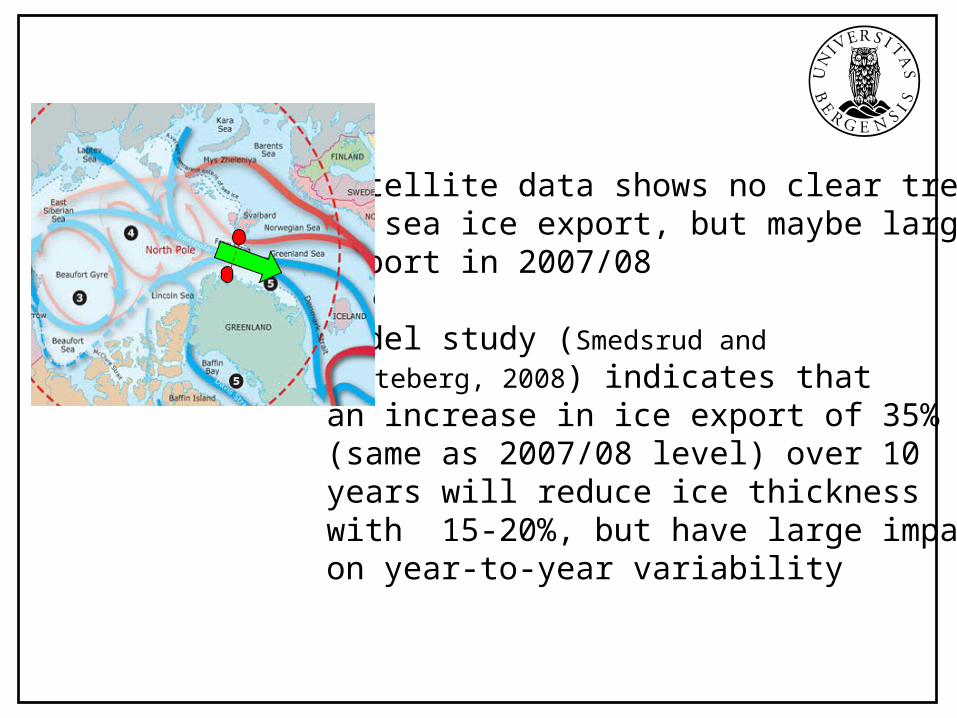
Satellite data shows no clear trendin sea ice export, but maybe large export in 2007/08
Model study (Smedsrud and Sorteberg, 2008) indicates that an increase in ice export of 35%(same as 2007/08 level) over 10years will reduce ice thicknesswith 15-20%, but have large impacton year-to-year variability
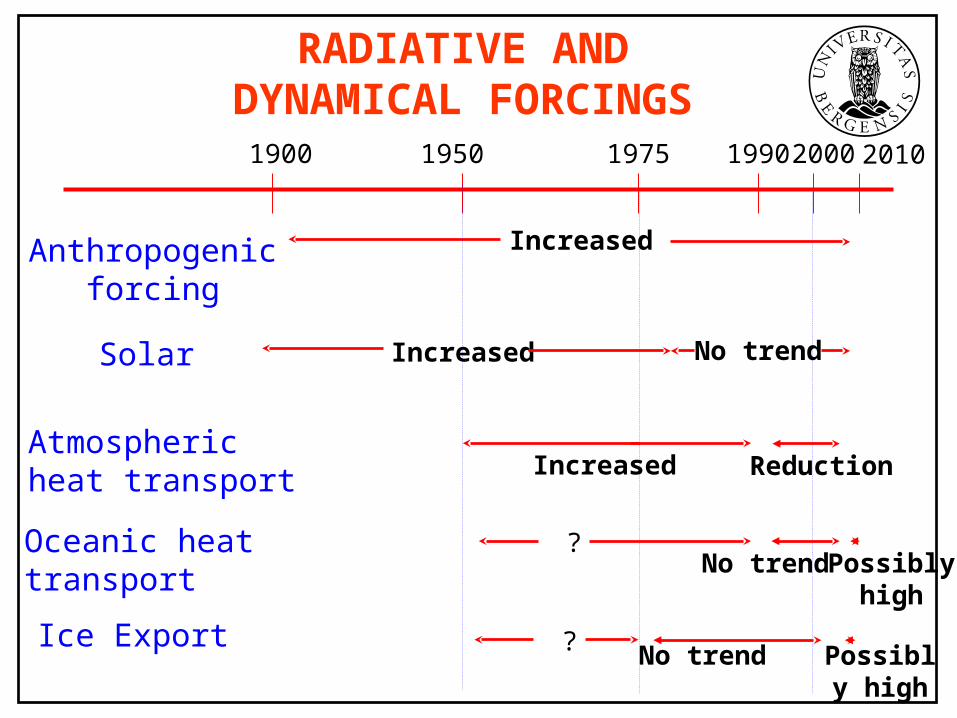
RADIATIVE ANDDYNAMICAL FORCINGS
1950 1975 2000
Atmospheric heat transport
Possibly high
No trend
Anthropogenicforcing
Increased
1900 1990
Solar
Reduction
Oceanic heattransport Possibly
high
2010
Ice Export
Increased
Increased
?
? No trend
No trend
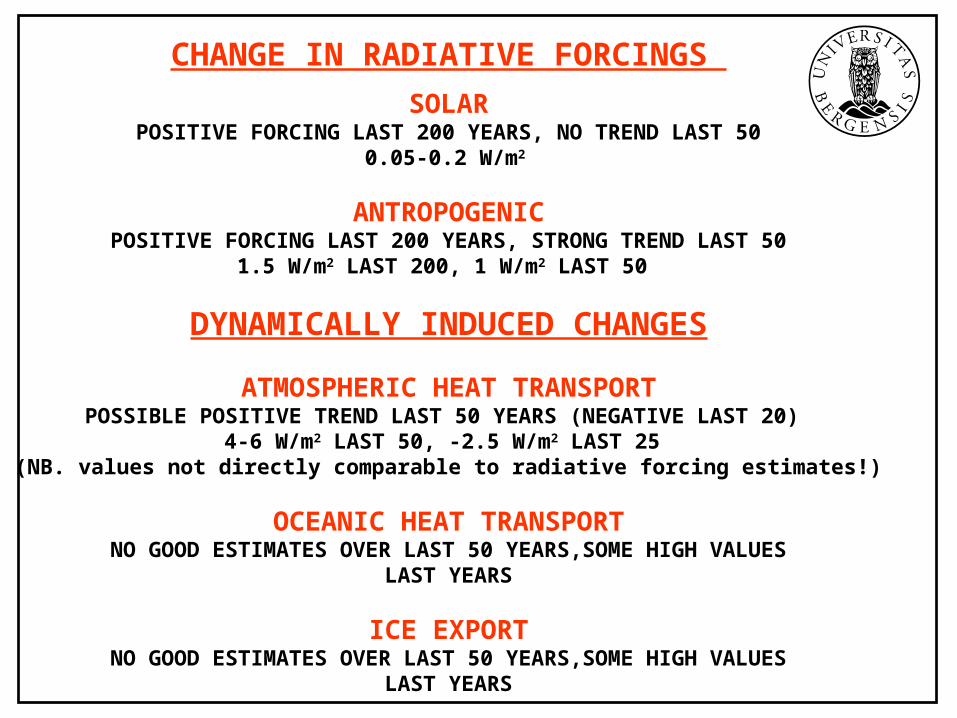
CHANGE IN RADIATIVE FORCINGS
SOLARPOSITIVE FORCING LAST 200 YEARS, NO TREND LAST 50
0.05-0.2 W/m2
ANTROPOGENICPOSITIVE FORCING LAST 200 YEARS, STRONG TREND LAST 50
1.5 W/m2 LAST 200, 1 W/m2 LAST 50
DYNAMICALLY INDUCED CHANGES
ATMOSPHERIC HEAT TRANSPORTPOSSIBLE POSITIVE TREND LAST 50 YEARS (NEGATIVE LAST 20)
4-6 W/m2 LAST 50, -2.5 W/m2 LAST 25 (NB. values not directly comparable to radiative forcing estimates!)
OCEANIC HEAT TRANSPORTNO GOOD ESTIMATES OVER LAST 50 YEARS,SOME HIGH VALUES
LAST YEARS
ICE EXPORTNO GOOD ESTIMATES OVER LAST 50 YEARS,SOME HIGH VALUES
LAST YEARS
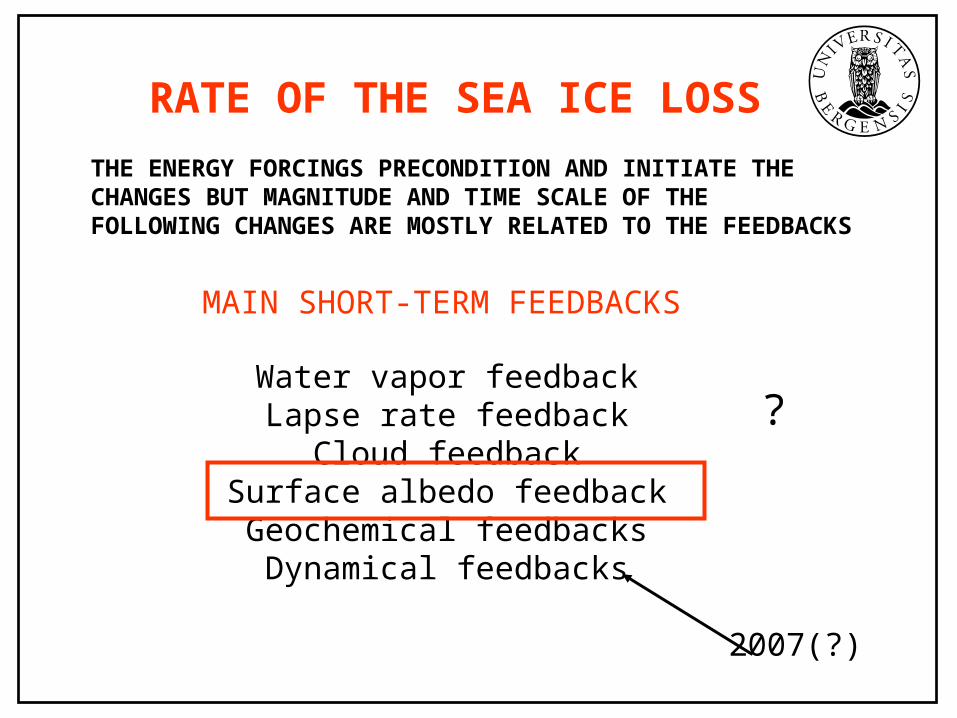
RATE OF THE SEA ICE LOSS
THE ENERGY FORCINGS PRECONDITION AND INITIATE THE CHANGES BUT MAGNITUDE AND TIME SCALE OF THE FOLLOWING CHANGES ARE MOSTLY RELATED TO THE FEEDBACKS
MAIN SHORT-TERM FEEDBACKS
Water vapor feedbackLapse rate feedback
Cloud feedbackSurface albedo feedbackGeochemical feedbacksDynamical feedbacks
?
2007(?)
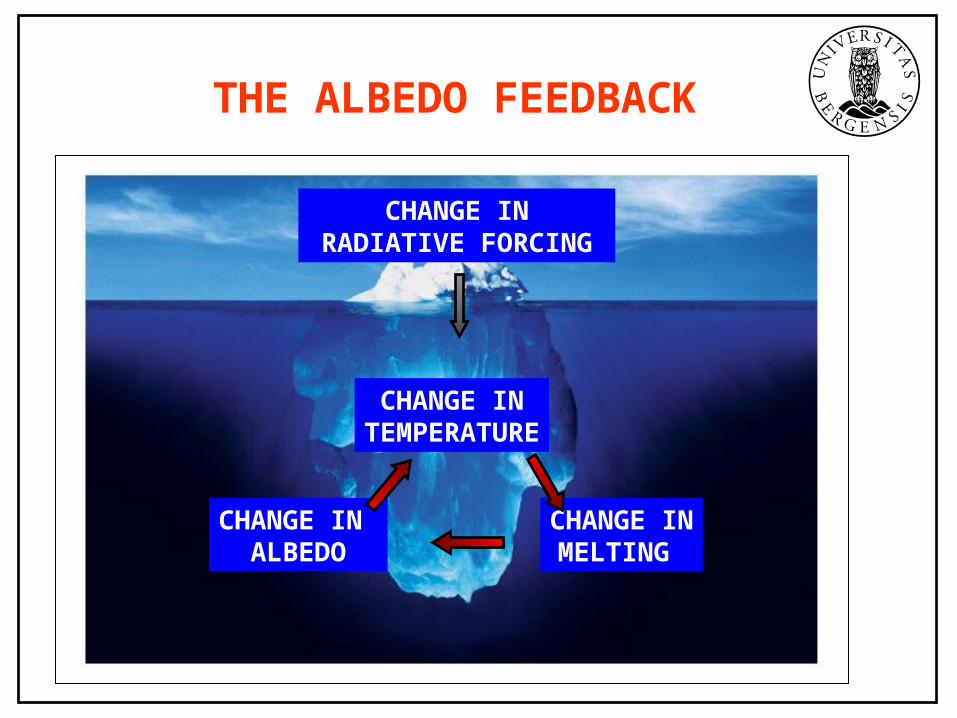
CHANGE IN RADIATIVE FORCING
CHANGE IN ALBEDO
CHANGE INTEMPERATURE
CHANGE INMELTING
THE ALBEDO FEEDBACK
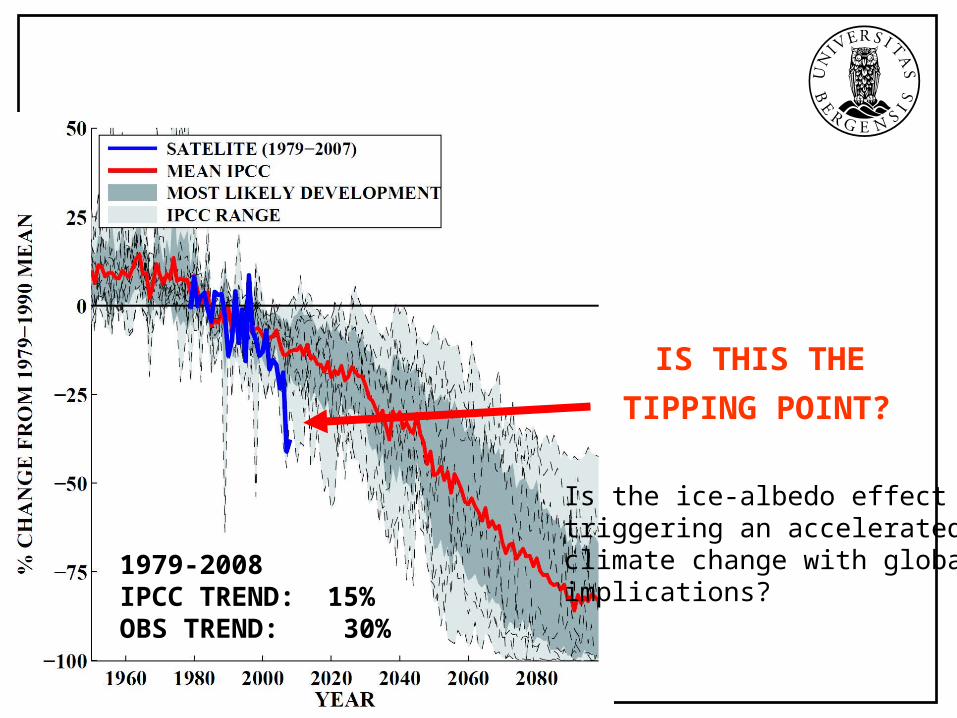
1979-2008IPCC TREND: 15% OBS TREND: 30%
IS THIS THE
TIPPING POINT?
Is the ice-albedo effect triggering an accelerated climate change with global implications?
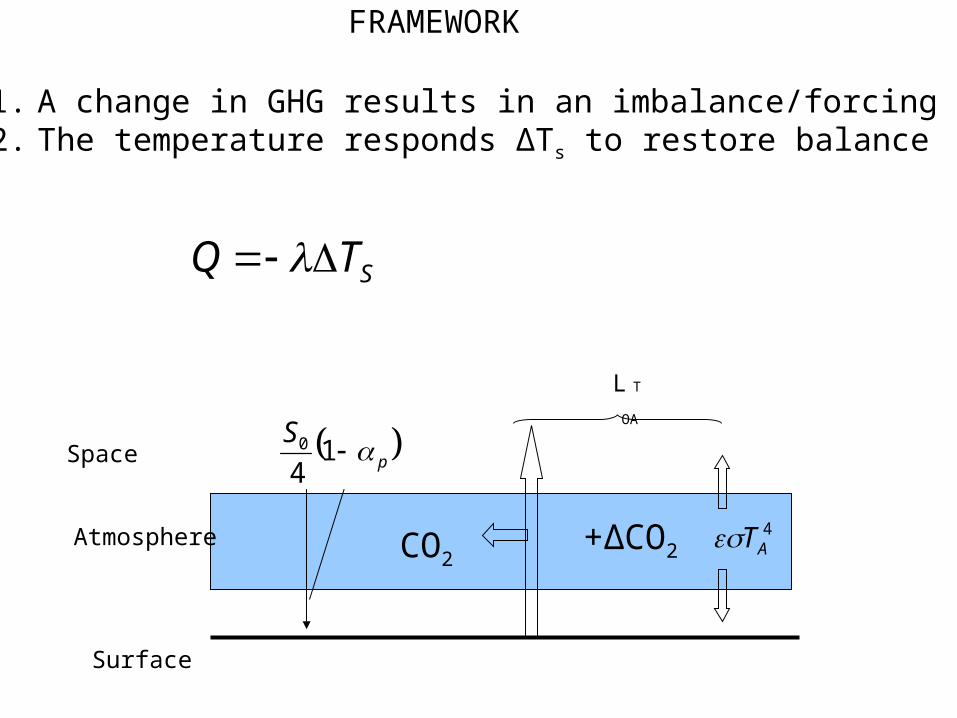
Surface
Atmosphere
Space
L T
OA
CO2+ΔCO2
pS 14
0
ii
SS
QTTQ
1. A change in GHG results in an imbalance/forcing Q2. The temperature responds ∆Ts to restore balance
4AT
FRAMEWORK
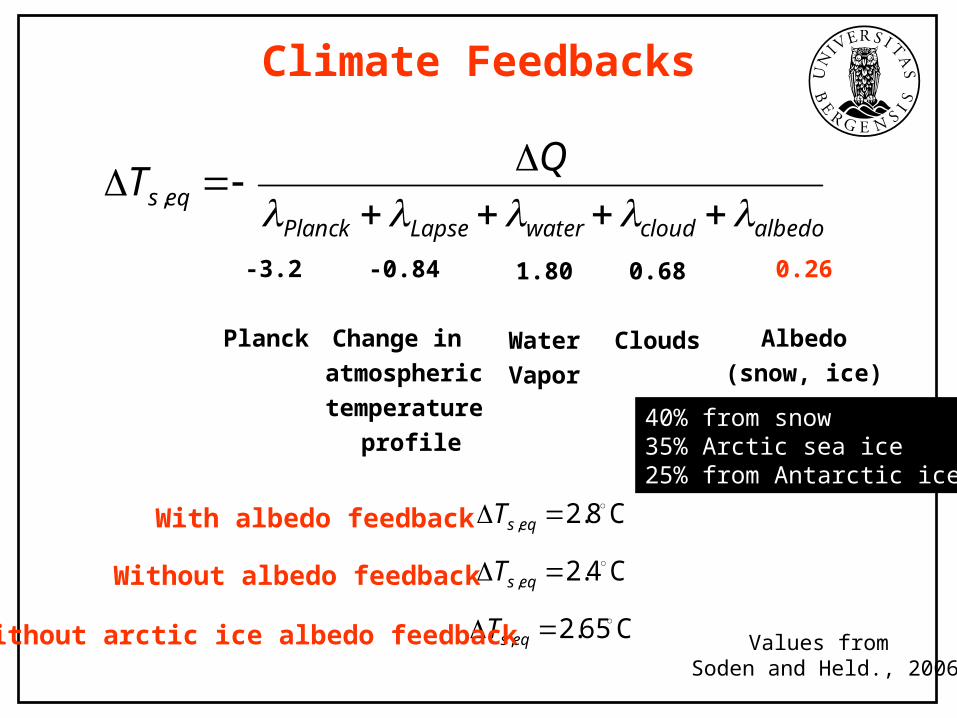
Climate Feedbacks
-3.2
Planck
1.80
WaterVapor
0.68
Clouds
0.26
Albedo(snow, ice)
-0.84
Change in atmospherictemperature
profile
Values from Soden and Held., 2006
albedocloudwaterLapsePlanckeqs
QT
,
40% from snow35% Arctic sea ice25% from Antarctic ice
C8.2, eqsT
C65.2, eqsT
C4.2, eqsT
With albedo feedback
Without albedo feedback
Without arctic ice albedo feedback
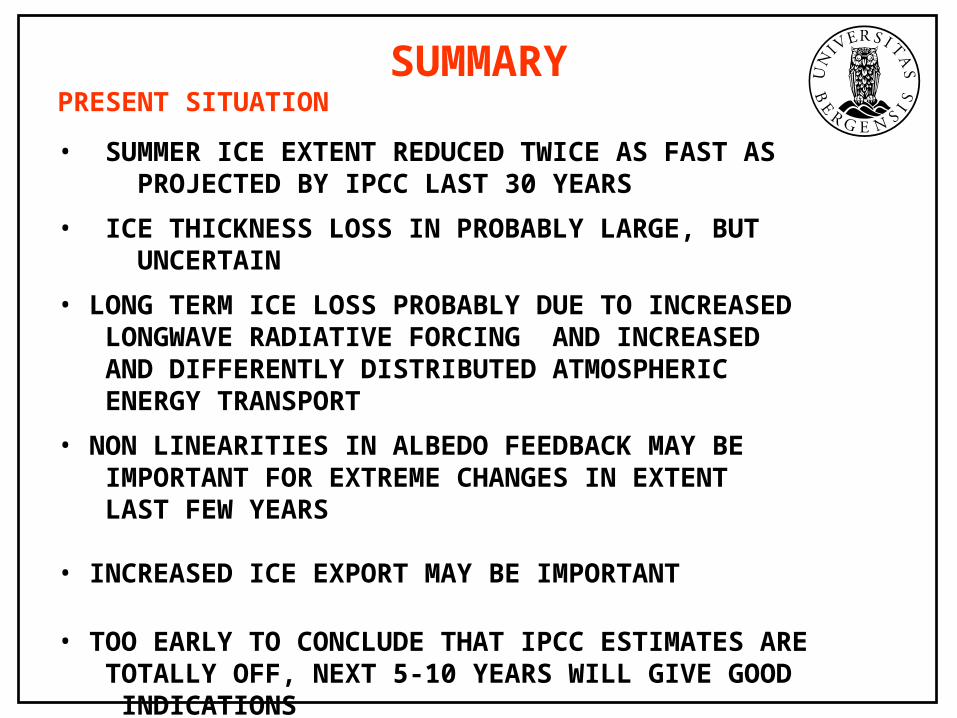
PRESENT SITUATION
• SUMMER ICE EXTENT REDUCED TWICE AS FAST AS PROJECTED BY IPCC LAST 30 YEARS
• ICE THICKNESS LOSS IN PROBABLY LARGE, BUT UNCERTAIN
• LONG TERM ICE LOSS PROBABLY DUE TO INCREASED LONGWAVE RADIATIVE FORCING AND INCREASED AND DIFFERENTLY DISTRIBUTED ATMOSPHERIC ENERGY TRANSPORT
• NON LINEARITIES IN ALBEDO FEEDBACK MAY BE IMPORTANT FOR EXTREME CHANGES IN EXTENT LAST FEW YEARS
• INCREASED ICE EXPORT MAY BE IMPORTANT
• TOO EARLY TO CONCLUDE THAT IPCC ESTIMATES ARE TOTALLY OFF, NEXT 5-10 YEARS WILL GIVE GOOD INDICATIONS
SUMMARY
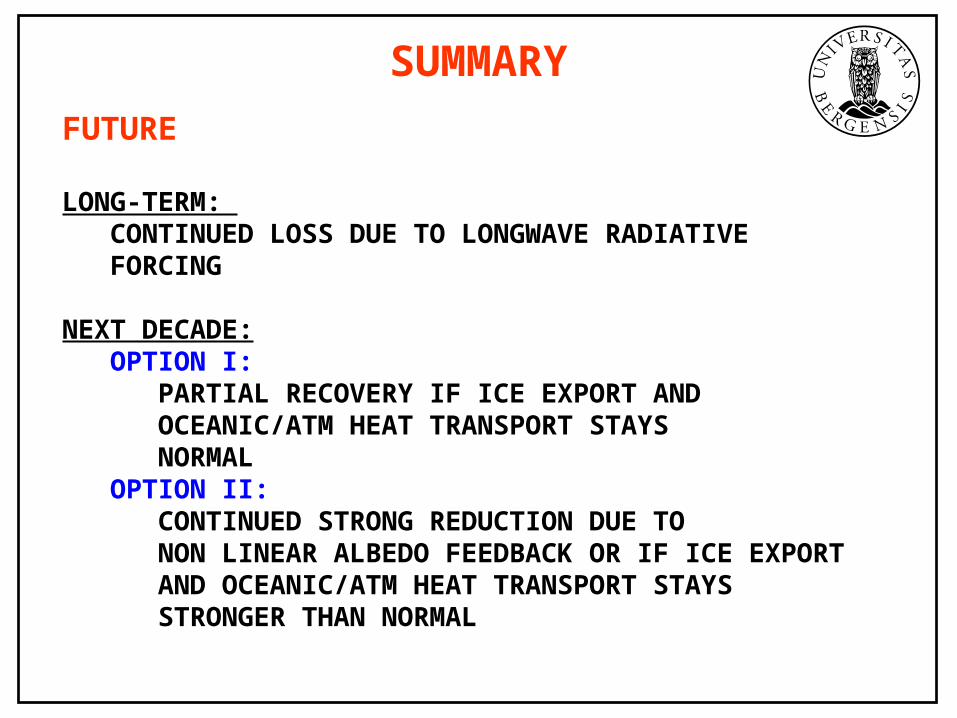
FUTURE
LONG-TERM: CONTINUED LOSS DUE TO LONGWAVE RADIATIVE FORCING
NEXT DECADE: OPTION I:
PARTIAL RECOVERY IF ICE EXPORT AND OCEANIC/ATM HEAT TRANSPORT STAYS NORMAL
OPTION II:CONTINUED STRONG REDUCTION DUE TONON LINEAR ALBEDO FEEDBACK OR IF ICE EXPORT AND OCEANIC/ATM HEAT TRANSPORT STAYS STRONGER THAN NORMAL
SUMMARY
GLOBAL IMPLICATIONS
ARCTIC SEA ICE IS IMPORTANT FOR ARCTIC ECOSYSTEM AND CULTURE , PROBABLY NOT VERY IMPORTANT FOR THE GLOBE
SUMMARY
That’s all folks!…