Embed Size (px)
Citation preview
ARDMORE SHIPPING CORPORATION
First Quarter 2017
Earnings Presentation
Modern Fleet of Eco-design and Eco-mod built at high quality Korean and Japanese shipyards with upgrades to improve fuel efficiency and commercial capability
2
Disclaimer
This presentation contains certain statements that may be deemed to be “forward-looking statements” within the
meaning of applicable U.S. federal securities laws. All statements, other than statements of historical facts, that
address activities, events or developments that Ardmore Shipping Corporation (“Ardmore” or the “Company”)
expects, projects, believes or anticipates will or may occur in the future, including, without limitation, statements
about: future operating or financial results; global and regional economic conditions and trends; pending vessel
acquisitions or possible upgrades to vessels; the Company’s business strategy and expected capital spending or
operating expenses; competition in the tanker industry; shipping market trends; the Company’s financial condition
and liquidity, including ability to obtain financing in the future to fund capital expenditures, acquisitions and other
general corporate activities; the Company’s share repurchase program; ability to enter into fixed-rate charters after
the current charters expire and the Company’s ability to earn income in the spot market; expectations of the
availability of vessels to purchase and the time it may take to construct new vessels and vessels’ useful lives are
forward-looking statements. Although the Company believes that its expectations stated in this presentation are
based on reasonable assumptions, actual results may differ from those projected in the forward-looking
statements.
Factors that might cause or contribute to such a discrepancy include, but are not limited to, the risk factors
described in the Company's filings with the Securities and Exchange Commission (the "SEC"), including the
Company’s Annual Report on Form 20-F for the year ended December 31, 2016. This presentation is for
information purposes only and does not constitute an offer to buy or sell securities of the Company. For more
complete information about the Company, the information in this presentation should be read together with the
Company's filings with the SEC which may be accessed on the SEC website at www.sec.gov.
Modern Fleet of Eco-design and Eco-mod built at high quality Korean and Japanese shipyards with upgrades to improve fuel efficiency and commercial capability
3
Earnings Release: First Quarter 2017
Performance and Recent Activity
Product and Chemical Tanker Markets
Fleet Update
Financial Review
Summary
Appendix
Agenda

Modern Fleet of Eco-design and Eco-mod built at high quality Korean and Japanese shipyards with upgrades to improve fuel efficiency and commercial capability
4
Highlights
Modern Fleet of Eco-design and Eco-mod built at high quality Korean and Japanese shipyards with upgrades to improve fuel efficiency and commercial capability
5
Performance and Recent Market Activity
Highlights
Reported EBITDA of $11.7 million and net loss $2.2 million,
equating to loss of $0.06 per share in the first quarter; compared to
net loss of $3.7 million or $0.11 per share in fourth quarter 2016
Recently acquired 6 x Eco-Design MR’s highly accretive, generated
$0.8 million equating to 42% increase in operating income
Delivered satisfactory chartering performance in soft market with:
o Spot and pool MR tankers averaging $13,131 per day in 1Q17 vs.
$12,113 in 4Q16
o Chemical tankers averaging $12,907 per day in 1Q17 vs $12,502 in
4Q16
Maintained tight control of operating costs and overhead expenses
Demand impacted in the short-term by high levels of refined product
inventories; evidence that drawdown is well underway
Fundamentals remain strong; demand set to exceed supply in 2017
which should result in rebound in charter rates as early as 4Q17
Maintained dividend policy of paying out 60% of earnings from
continuing operations. Consistent with policy, the Company is
declaring no dividend for 1Q17
6
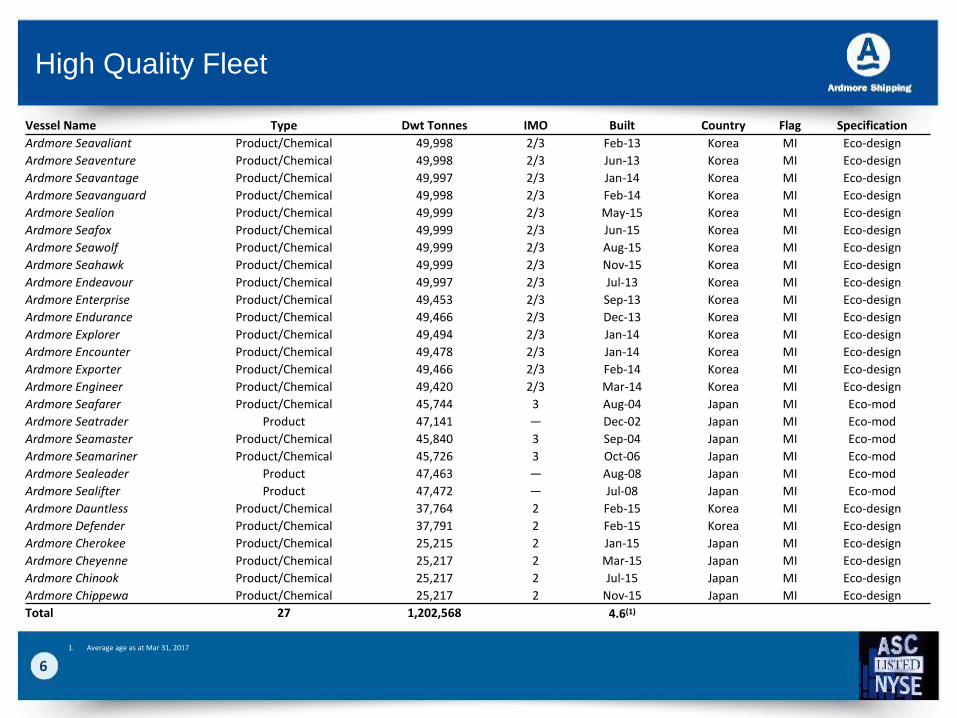
High Quality Fleet
1. Average age as at Mar 31, 2017
Vessel Name Type Dwt Tonnes IMO Built Country Flag Specification
Ardmore Seavaliant Product/Chemical 49,998 2/3 Feb-13 Korea MI Eco-design
Ardmore Seaventure Product/Chemical 49,998 2/3 Jun-13 Korea MI Eco-design
Ardmore Seavantage Product/Chemical 49,997 2/3 Jan-14 Korea MI Eco-design
Ardmore Seavanguard Product/Chemical 49,998 2/3 Feb-14 Korea MI Eco-design
Ardmore Sealion Product/Chemical 49,999 2/3 May-15 Korea MI Eco-design
Ardmore Seafox Product/Chemical 49,999 2/3 Jun-15 Korea MI Eco-design
Ardmore Seawolf Product/Chemical 49,999 2/3 Aug-15 Korea MI Eco-design
Ardmore Seahawk Product/Chemical 49,999 2/3 Nov-15 Korea MI Eco-design
Ardmore Endeavour Product/Chemical 49,997 2/3 Jul-13 Korea MI Eco-design
Ardmore Enterprise Product/Chemical 49,453 2/3 Sep-13 Korea MI Eco-design
Ardmore Endurance Product/Chemical 49,466 2/3 Dec-13 Korea MI Eco-design
Ardmore Explorer Product/Chemical 49,494 2/3 Jan-14 Korea MI Eco-design
Ardmore Encounter Product/Chemical 49,478 2/3 Jan-14 Korea MI Eco-design
Ardmore Exporter Product/Chemical 49,466 2/3 Feb-14 Korea MI Eco-design
Ardmore Engineer Product/Chemical 49,420 2/3 Mar-14 Korea MI Eco-design
Ardmore Seafarer Product/Chemical 45,744 3 Aug-04 Japan MI Eco-mod
Ardmore Seatrader Product 47,141 — Dec-02 Japan MI Eco-mod
Ardmore Seamaster Product/Chemical 45,840 3 Sep-04 Japan MI Eco-mod
Ardmore Seamariner Product/Chemical 45,726 3 Oct-06 Japan MI Eco-mod
Ardmore Sealeader Product 47,463 — Aug-08 Japan MI Eco-mod
Ardmore Sealifter Product 47,472 — Jul-08 Japan MI Eco-mod
Ardmore Dauntless Product/Chemical 37,764 2 Feb-15 Korea MI Eco-design
Ardmore Defender Product/Chemical 37,791 2 Feb-15 Korea MI Eco-design
Ardmore Cherokee Product/Chemical 25,215 2 Jan-15 Japan MI Eco-design
Ardmore Cheyenne Product/Chemical 25,217 2 Mar-15 Japan MI Eco-design
Ardmore Chinook Product/Chemical 25,217 2 Jul-15 Japan MI Eco-design
Ardmore Chippewa Product/Chemical 25,217 2 Nov-15 Japan MI Eco-design
Total 27 1,202,568 4.6(1)
Modern Fleet of Eco-design and Eco-mod built at high quality Korean and Japanese shipyards with upgrades to improve fuel efficiency and commercial capability
7
Product and Chemical Tanker Market
$10,000
$12,000
$14,000
$16,000
$18,000
$20,000
$22,000
$24,000
$26,000
$28,000
$30,000
1Q
14
2Q
14
3Q
14
4Q
14
1Q
15
2Q
15
3Q
15
4Q
15
1Q
16
2Q
16
3Q
16
4Q
16
1Q
17
0%
5%
10%
15%
20%
25%
30%
35%
40%
45%
50%
0
10
20
30
40
50
60
70
80
90
100
19
96
19
97
19
98
19
99
20
00
20
01
20
02
20
03
20
04
20
05
20
06
20
07
20
08
20
09
20
10
20
11
20
12
20
13
20
14
20
15
20
16
20
17
OB
as
% F
leet
Mill
ion
DW
T
8
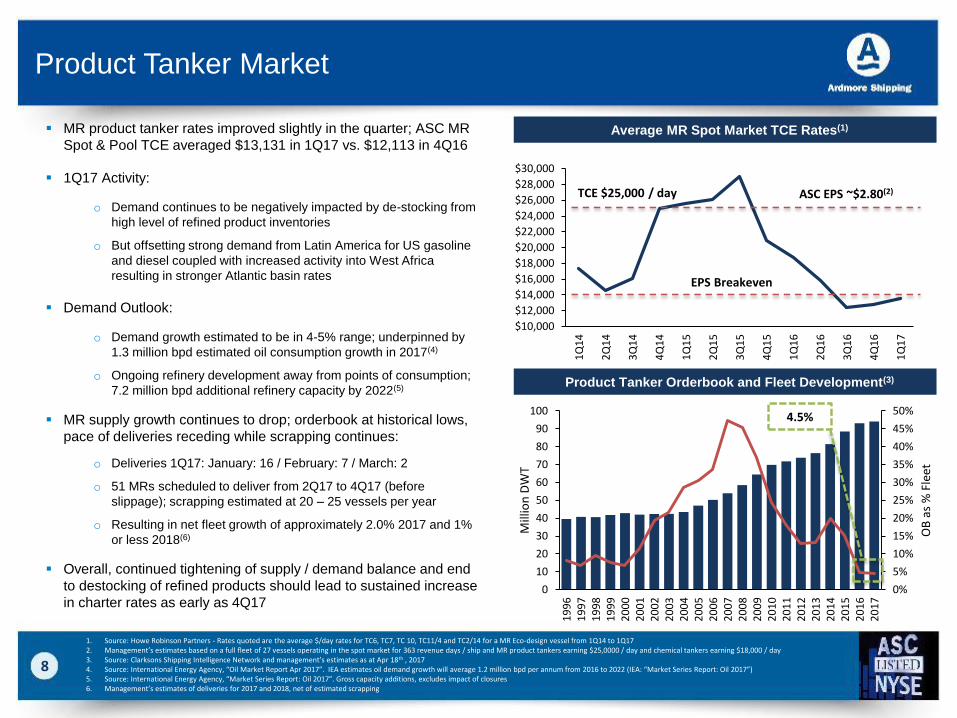
Product Tanker Market
Average MR Spot Market TCE Rates(1)
Product Tanker Orderbook and Fleet Development(3)
MR product tanker rates improved slightly in the quarter; ASC MR
Spot & Pool TCE averaged $13,131 in 1Q17 vs. $12,113 in 4Q16
1Q17 Activity:
o Demand continues to be negatively impacted by de-stocking from
high level of refined product inventories
o But offsetting strong demand from Latin America for US gasoline
and diesel coupled with increased activity into West Africa
resulting in stronger Atlantic basin rates
Demand Outlook:
o Demand growth estimated to be in 4-5% range; underpinned by
1.3 million bpd estimated oil consumption growth in 2017(4)
o Ongoing refinery development away from points of consumption;
7.2 million bpd additional refinery capacity by 2022(5)
MR supply growth continues to drop; orderbook at historical lows,
pace of deliveries receding while scrapping continues:
o Deliveries 1Q17: January: 16 / February: 7 / March: 2
o 51 MRs scheduled to deliver from 2Q17 to 4Q17 (before
slippage); scrapping estimated at 20 – 25 vessels per year
o Resulting in net fleet growth of approximately 2.0% 2017 and 1%
or less 2018(6)
Overall, continued tightening of supply / demand balance and end
to destocking of refined products should lead to sustained increase
in charter rates as early as 4Q17
1. Source: Howe Robinson Partners - Rates quoted are the average $/day rates for TC6, TC7, TC 10, TC11/4 and TC2/14 for a MR Eco-design vessel from 1Q14 to 1Q172. Management’s estimates based on a full fleet of 27 vessels operating in the spot market for 363 revenue days / ship and MR product tankers earning $25,0000 / day and chemical tankers earning $18,000 / day3. Source: Clarksons Shipping Intelligence Network and management’s estimates as at Apr 18th , 20174. Source: International Energy Agency, “Oil Market Report Apr 2017”. IEA estimates oil demand growth will average 1.2 million bpd per annum from 2016 to 2022 (IEA: “Market Series Report: Oil 2017”)5. Source: International Energy Agency, “Market Series Report: Oil 2017”. Gross capacity additions, excludes impact of closures6. Management’s estimates of deliveries for 2017 and 2018, net of estimated scrapping
4.5%
EPS Breakeven
ASC EPS ~$2.80(2) TCE $25,000 / day
0%
10%
20%
30%
40%
50%
60%
70%
80%
0
5
10
15
20
25
30
35
40
19
96
19
97
19
98
19
99
20
00
20
01
20
02
20
03
20
04
20
05
20
06
20
07
20
08
20
09
20
10
20
11
20
12
20
13
20
14
20
15
20
16
20
17
OB
as
% F
leet
Mill
ion
DW
T
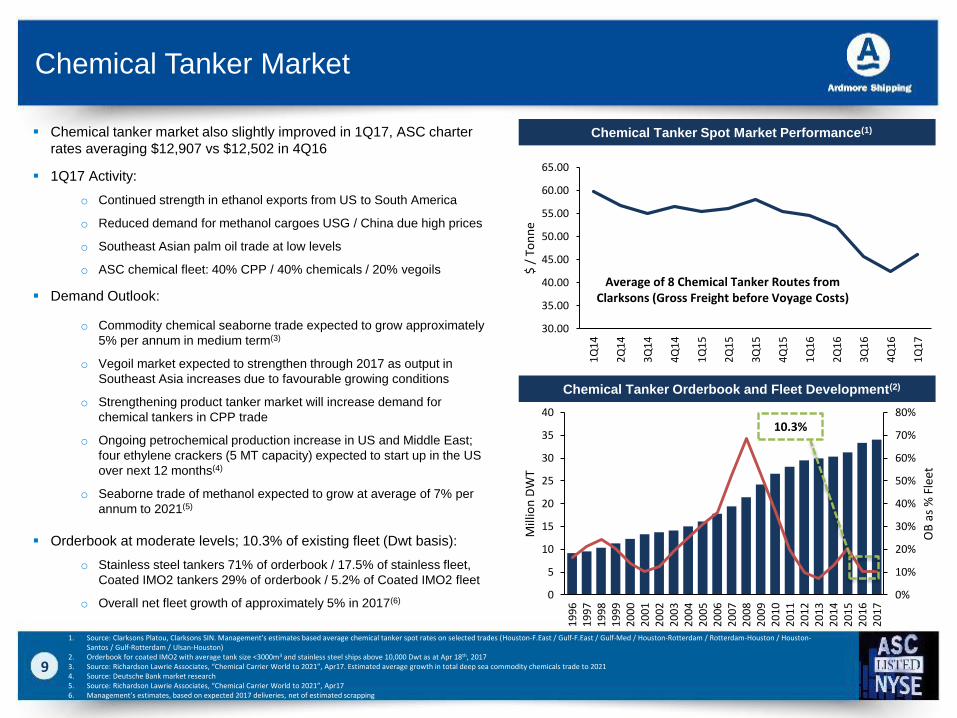
Chemical tanker market also slightly improved in 1Q17, ASC charter
rates averaging $12,907 vs $12,502 in 4Q16
1Q17 Activity:
o Continued strength in ethanol exports from US to South America
o Reduced demand for methanol cargoes USG / China due high prices
o Southeast Asian palm oil trade at low levels
o ASC chemical fleet: 40% CPP / 40% chemicals / 20% vegoils
Demand Outlook:
o Commodity chemical seaborne trade expected to grow approximately
5% per annum in medium term(3)
o Vegoil market expected to strengthen through 2017 as output in
Southeast Asia increases due to favourable growing conditions
o Strengthening product tanker market will increase demand for
chemical tankers in CPP trade
o Ongoing petrochemical production increase in US and Middle East;
four ethylene crackers (5 MT capacity) expected to start up in the US
over next 12 months(4)
o Seaborne trade of methanol expected to grow at average of 7% per
annum to 2021(5)
Orderbook at moderate levels; 10.3% of existing fleet (Dwt basis):
o Stainless steel tankers 71% of orderbook / 17.5% of stainless fleet,
Coated IMO2 tankers 29% of orderbook / 5.2% of Coated IMO2 fleet
o Overall net fleet growth of approximately 5% in 2017(6)
9
Chemical Tanker Market
Chemical Tanker Spot Market Performance(1)
Chemical Tanker Orderbook and Fleet Development(2)
1. Source: Clarksons Platou, Clarksons SIN. Management’s estimates based average chemical tanker spot rates on selected trades (Houston-F.East / Gulf-F.East / Gulf-Med / Houston-Rotterdam / Rotterdam-Houston / Houston-Santos / Gulf-Rotterdam / Ulsan-Houston)
2. Orderbook for coated IMO2 with average tank size <3000m3 and stainless steel ships above 10,000 Dwt as at Apr 18th, 20173. Source: Richardson Lawrie Associates, “Chemical Carrier World to 2021”, Apr17. Estimated average growth in total deep sea commodity chemicals trade to 20214. Source: Deutsche Bank market research 5. Source: Richardson Lawrie Associates, “Chemical Carrier World to 2021”, Apr17 6. Management’s estimates, based on expected 2017 deliveries, net of estimated scrapping
10.3%
30.00
35.00
40.00
45.00
50.00
55.00
60.00
65.00
1Q
14
2Q
14
3Q
14
4Q
14
1Q
15
2Q
15
3Q
15
4Q
15
1Q
16
2Q
16
3Q
16
4Q
16
1Q
17
$ /
To
nn
e
Average of 8 Chemical Tanker Routes from Clarksons (Gross Freight before Voyage Costs)
Modern Fleet of Eco-design and Eco-mod built at high quality Korean and Japanese shipyards with upgrades to improve fuel efficiency and commercial capability
10
Fleet Update
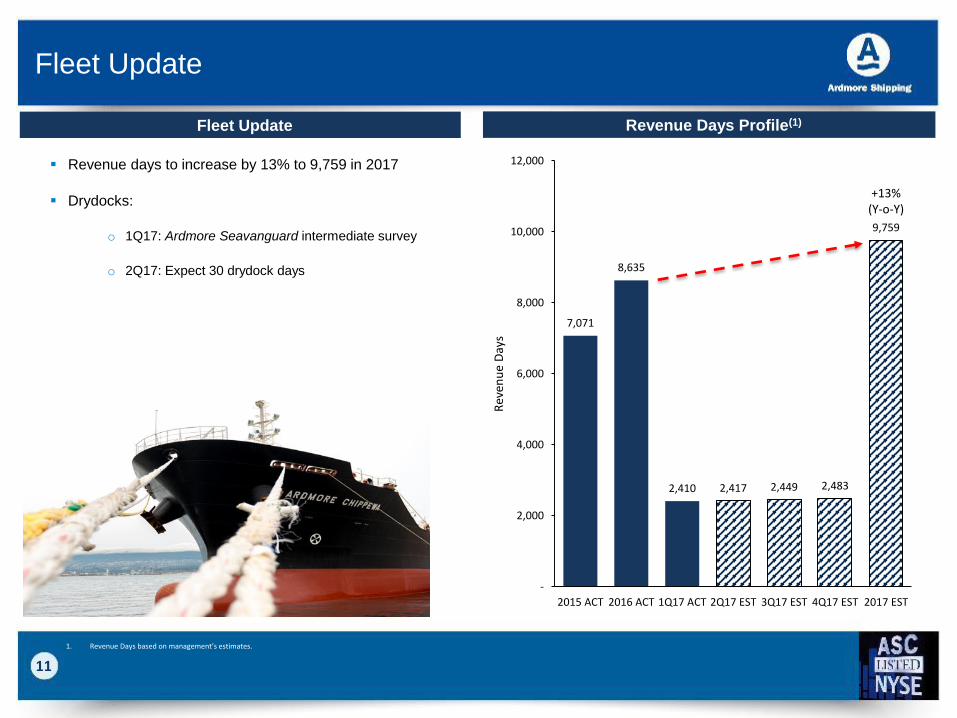
7,071
8,635
2,410 2,417 2,449 2,483
9,759
-
2,000
4,000
6,000
8,000
10,000
12,000
2015 ACT 2016 ACT 1Q17 ACT 2Q17 EST 3Q17 EST 4Q17 EST 2017 EST
Rev
enu
e D
ays
11
Fleet Update
Revenue Days Profile(1)Fleet Update
1. Revenue Days based on management’s estimates.
+13% (Y-o-Y)
Revenue days to increase by 13% to 9,759 in 2017
Drydocks:
o 1Q17: Ardmore Seavanguard intermediate survey
o 2Q17: Expect 30 drydock days

Modern Fleet of Eco-design and Eco-mod built at high quality Korean and Japanese shipyards with upgrades to improve fuel efficiency and commercial capability
12
Financial
Modern Fleet of Eco-design and Eco-mod built at high quality Korean and Japanese shipyards with upgrades to improve fuel efficiency and commercial capability
13
Financial Performance
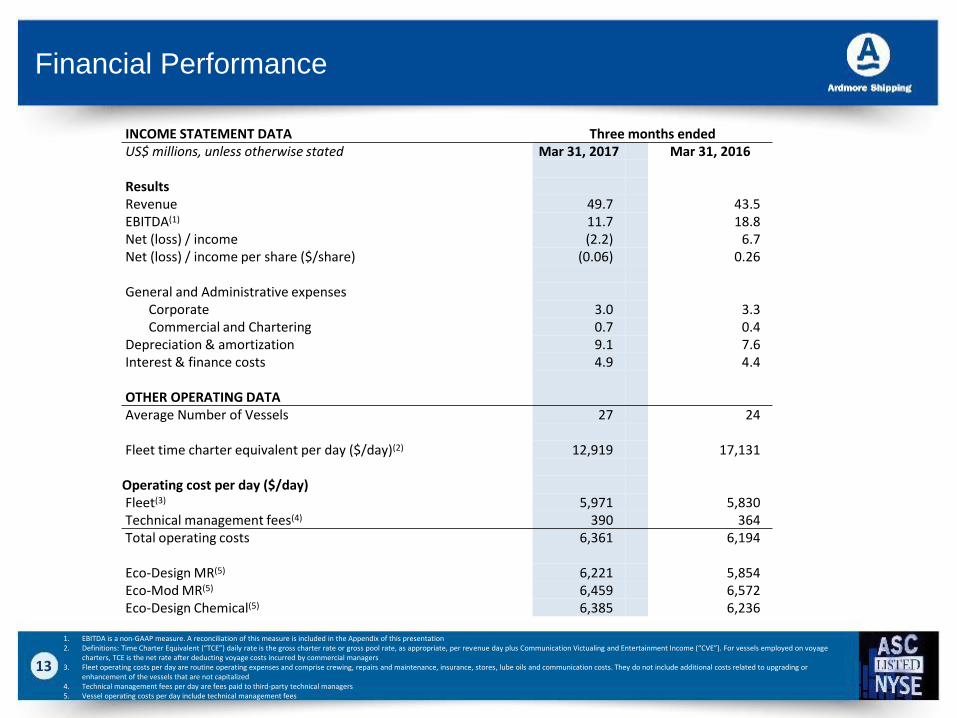
1. EBITDA is a non-GAAP measure. A reconciliation of this measure is included in the Appendix of this presentation2. Definitions: Time Charter Equivalent (“TCE”) daily rate is the gross charter rate or gross pool rate, as appropriate, per revenue day plus Communication Victualing and Entertainment Income (“CVE”). For vessels employed on voyage
charters, TCE is the net rate after deducting voyage costs incurred by commercial managers3. Fleet operating costs per day are routine operating expenses and comprise crewing, repairs and maintenance, insurance, stores, lube oils and communication costs. They do not include additional costs related to upgrading or
enhancement of the vessels that are not capitalized 4. Technical management fees per day are fees paid to third-party technical managers 5. Vessel operating costs per day include technical management fees
INCOME STATEMENT DATA Three months endedUS$ millions, unless otherwise stated Mar 31, 2017 Mar 31, 2016
ResultsRevenue 49.7 43.5EBITDA(1) 11.7 18.8Net (loss) / income (2.2) 6.7Net (loss) / income per share ($/share) (0.06) 0.26
General and Administrative expensesCorporate 3.0 3.3Commercial and Chartering 0.7 0.4
Depreciation & amortization 9.1 7.6Interest & finance costs 4.9 4.4
OTHER OPERATING DATAAverage Number of Vessels 27 24
Fleet time charter equivalent per day ($/day)(2) 12,919 17,131
Operating cost per day ($/day)Fleet(3) 5,971 5,830Technical management fees(4) 390 364Total operating costs 6,361 6,194
Eco-Design MR(5) 6,221 5,854Eco-Mod MR(5) 6,459 6,572Eco-Design Chemical(5) 6,385 6,236
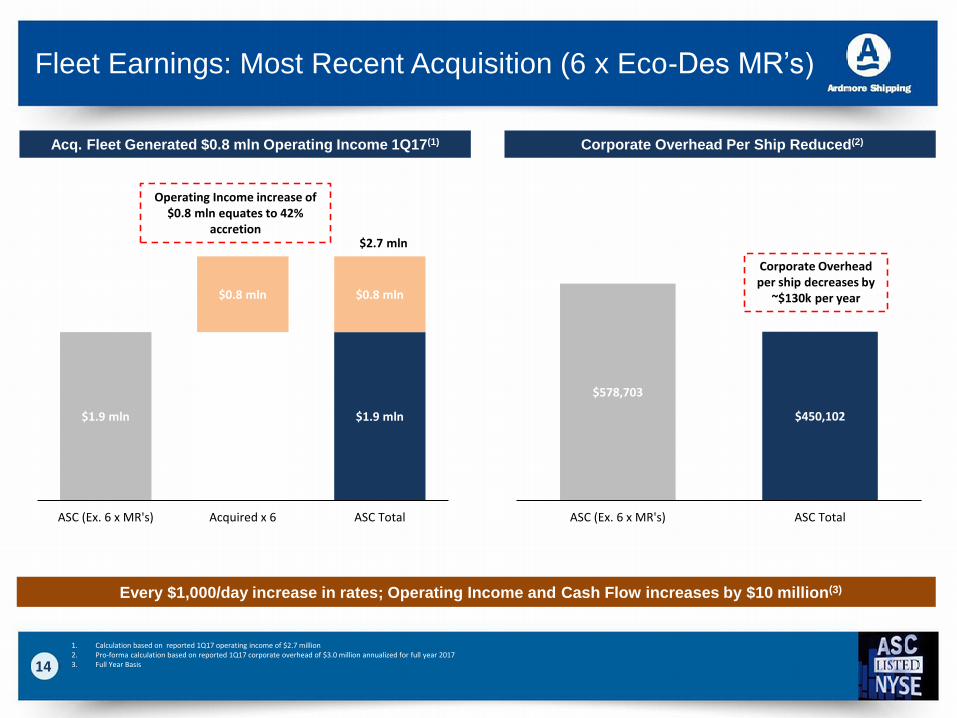
$1.9 mln $1.9 mln $1.9 mln
$0.8 mln $0.8 mln
ASC (Ex. 6 x MR's) Acquired x 6 ASC Total
$578,703
$450,102
ASC (Ex. 6 x MR's) ASC Total
Fleet Earnings: Most Recent Acquisition (6 x Eco-Des MR’s)
14
Corporate Overhead Per Ship Reduced(2)
Corporate Overhead per ship decreases by
~$130k per year
1. Calculation based on reported 1Q17 operating income of $2.7 million2. Pro-forma calculation based on reported 1Q17 corporate overhead of $3.0 million annualized for full year 20173. Full Year Basis
Acq. Fleet Generated $0.8 mln Operating Income 1Q17(1)
Operating Income increase of $0.8 mln equates to 42%
accretion$2.7 mln
Every $1,000/day increase in rates; Operating Income and Cash Flow increases by $10 million(3)
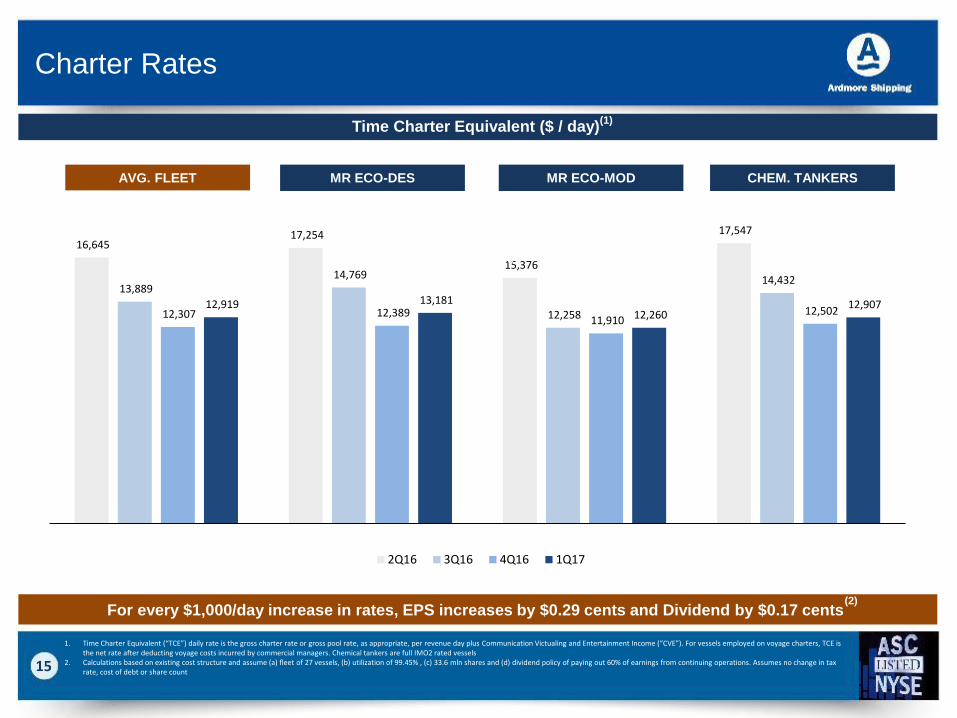
16,645 17,254
15,376
17,547
13,889 14,769
12,258
14,432
12,307 12,389 11,910
12,502 12,919 13,181
12,260 12,907
AVG. FLEET TCE MR ECO-DES MR ECO-MOD PROD/CHEM ECO-DES
2Q16 3Q16 4Q16 1Q17
15
Charter Rates
1. Time Charter Equivalent (“TCE”) daily rate is the gross charter rate or gross pool rate, as appropriate, per revenue day plus Communication Victualing and Entertainment Income (“CVE”). For vessels employed on voyage charters, TCE is the net rate after deducting voyage costs incurred by commercial managers. Chemical tankers are full IMO2 rated vessels
2. Calculations based on existing cost structure and assume (a) fleet of 27 vessels, (b) utilization of 99.45% , (c) 33.6 mln shares and (d) dividend policy of paying out 60% of earnings from continuing operations. Assumes no change in tax rate, cost of debt or share count
For every $1,000/day increase in rates, EPS increases by $0.29 cents and Dividend by $0.17 cents(2)
Time Charter Equivalent ($ / day)(1)
+37% YoY
AVG. FLEET MR ECO-DES MR ECO-MOD CHEM. TANKERS
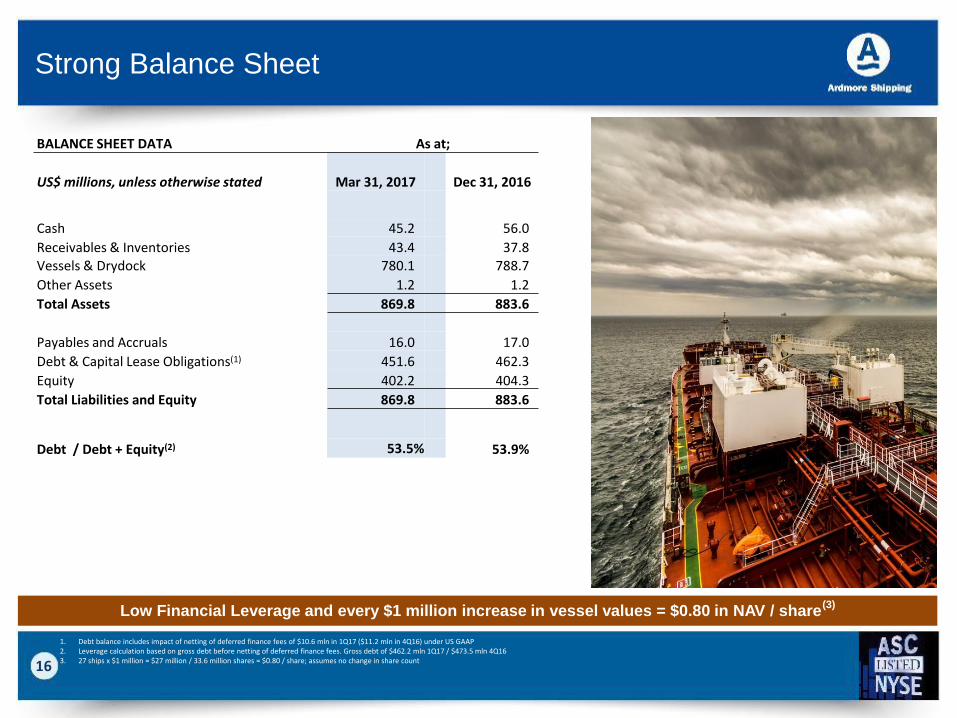
Low Financial Leverage and every $1 million increase in vessel values = $0.80 in NAV / share(3)
16
Strong Balance Sheet
1. Debt balance includes impact of netting of deferred finance fees of $10.6 mln in 1Q17 ($11.2 mln in 4Q16) under US GAAP2. Leverage calculation based on gross debt before netting of deferred finance fees. Gross debt of $462.2 mln 1Q17 / $473.5 mln 4Q16 3. 27 ships x $1 million = $27 million / 33.6 million shares = $0.80 / share; assumes no change in share count
BALANCE SHEET DATA As at;
US$ millions, unless otherwise stated Mar 31, 2017 Dec 31, 2016
Cash 45.2 56.0
Receivables & Inventories 43.4 37.8Vessels & Drydock 780.1 788.7
Other Assets 1.2 1.2
Total Assets 869.8 883.6
Payables and Accruals 16.0 17.0
Debt & Capital Lease Obligations(1) 451.6 462.3
Equity 402.2 404.3
Total Liabilities and Equity 869.8 883.6
Debt / Debt + Equity(2) 53.5% 53.9%
17
Conservative Capital Structure
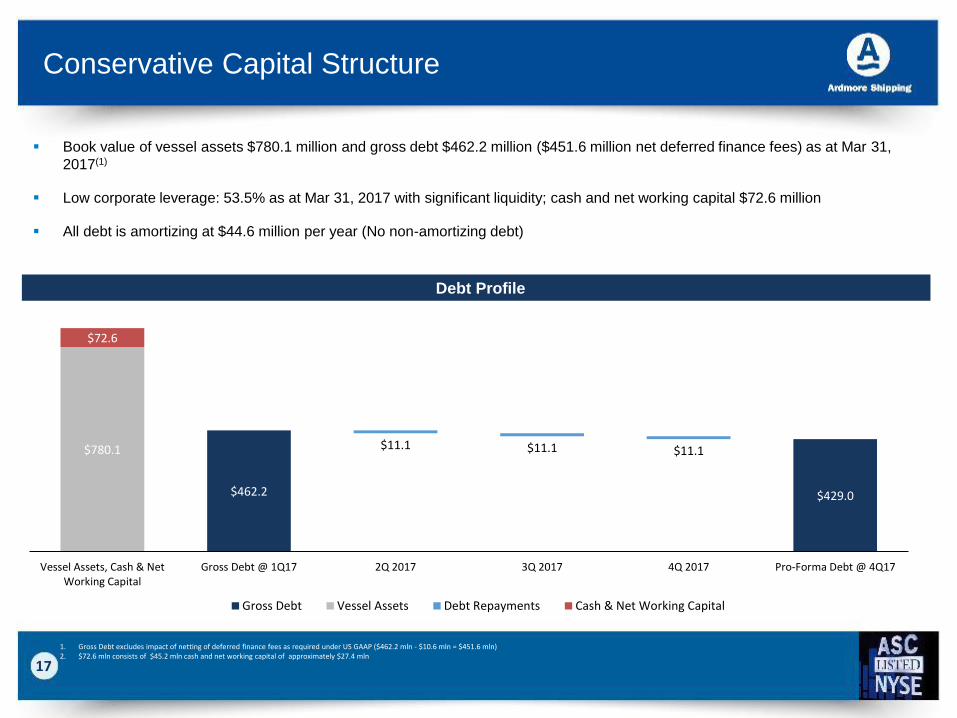
Book value of vessel assets $780.1 million and gross debt $462.2 million ($451.6 million net deferred finance fees) as at Mar 31,
2017(1)
Low corporate leverage: 53.5% as at Mar 31, 2017 with significant liquidity; cash and net working capital $72.6 million
All debt is amortizing at $44.6 million per year (No non-amortizing debt)
Debt Profile
1. Gross Debt excludes impact of netting of deferred finance fees as required under US GAAP ($462.2 mln - $10.6 mln = $451.6 mln)2. $72.6 mln consists of $45.2 mln cash and net working capital of approximately $27.4 mln
$462.2 $429.0
$780.1 $11.1 $11.1 $11.1
$72.6
Vessel Assets, Cash & NetWorking Capital
Gross Debt @ 1Q17 2Q 2017 3Q 2017 4Q 2017 Pro-Forma Debt @ 4Q17
Gross Debt Vessel Assets Debt Repayments Cash & Net Working Capital

Modern Fleet of Eco-design and Eco-mod built at high quality Korean and Japanese shipyards with upgrades to improve fuel efficiency and commercial capability
18
Company Review and Summary
Modern Fleet of Eco-design and Eco-mod built at high quality Korean and Japanese shipyards with upgrades to improve fuel efficiency and commercial capability
19
Summary
Reported EBITDA of $11.7 million and net loss $2.2 million, equating to loss of $0.06 per share in the first quarter;
compared to net loss of $3.7 million or $0.11 per share in fourth quarter of 2016
Our recently acquired 6 x Eco-Design MR’s highly accretive, generated $0.8 million in 1Q17 equating to 42% increase
in operating income
MR spot rates improved slightly in 1Q17 due to strong demand from Latin America coupled with increased activity into
West Africa, resulting in strong Atlantic basin rates
Demand negatively impacted in the short-term by high levels of refined product inventories; evidence that drawdown is
well underway and may conclude in 4Q17
Fundamentals remain strong; demand growth estimated to be 4-5% range, underpinned by 1.3 million bpd oil
consumption growth, ongoing refinery development, and increasing trade complexity
Supply growth continues to drop; orderbook at historical lows, resulting net fleet growth approximately 2% in 2017 and
1% or lower in 2018, which sets the stage for significant rebound in charter rates as early as 4Q17
Through a combination of fully-delivered high-quality fleet, ongoing focus on spot chartering performance and cost
efficiency, Ardmore has significant earnings power where every $1,000 / day equates to 29 cents in EPS and 17 cents
in dividends(1)
1. Calculations based on existing cost structure and assume (a) fleet of 27 vessels, (b) utilization of 99.45% , (c) 33.6 mln shares and (d) dividend policy of paying out 60% of earnings from continuing operations. Assumes no change in tax rate, cost of debt or share count. No dividend payable in period where earnings are negative

Modern Fleet of Eco-design and Eco-mod built at high quality Korean and Japanese shipyards with upgrades to improve fuel efficiency and commercial capability
20
Appendix
21
Non-GAAP Measures
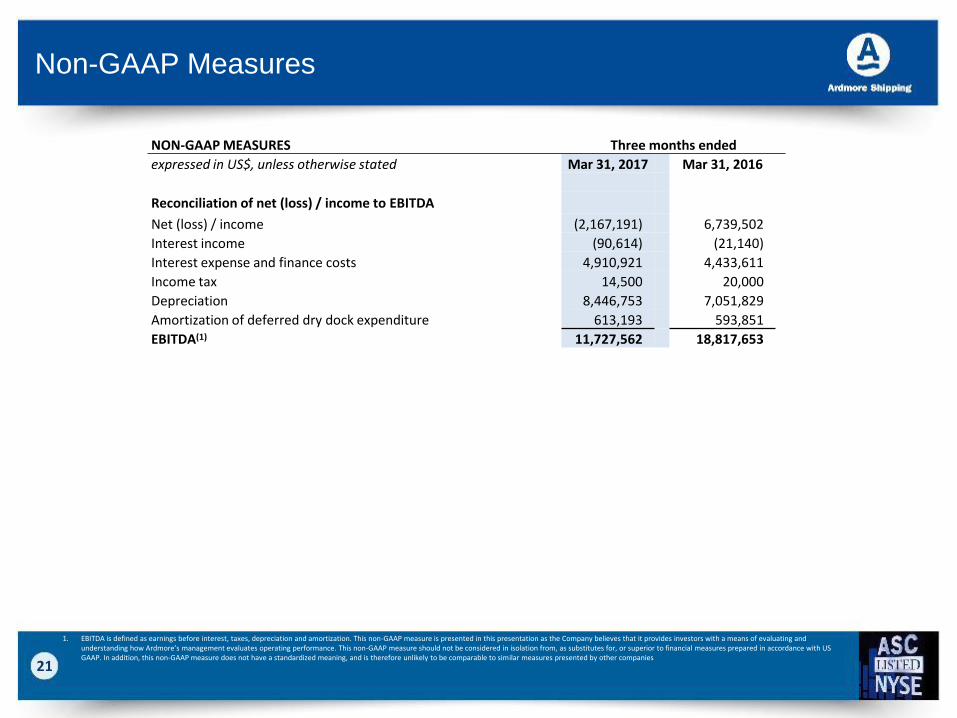
1. EBITDA is defined as earnings before interest, taxes, depreciation and amortization. This non-GAAP measure is presented in this presentation as the Company believes that it provides investors with a means of evaluating and understanding how Ardmore’s management evaluates operating performance. This non-GAAP measure should not be considered in isolation from, as substitutes for, or superior to financial measures prepared in accordance with US GAAP. In addition, this non-GAAP measure does not have a standardized meaning, and is therefore unlikely to be comparable to similar measures presented by other companies
NON-GAAP MEASURES Three months ended
expressed in US$, unless otherwise stated Mar 31, 2017 Mar 31, 2016
Reconciliation of net (loss) / income to EBITDA
Net (loss) / income (2,167,191) 6,739,502
Interest income (90,614) (21,140)
Interest expense and finance costs 4,910,921 4,433,611
Income tax 14,500 20,000
Depreciation 8,446,753 7,051,829
Amortization of deferred dry dock expenditure 613,193 593,851
EBITDA(1) 11,727,562 18,817,653