Embed Size (px)
Citation preview

Arduino-Based Foot Neuropathy Analyzer
Maya Varma
Presentation High School
San Jose, California
Project ID: micro13MV273

2
A video on the project has been posted on YouTube at
www.youtube.com/watch?v=BAnNmmAUcsk&feature=youtu.be
This can also be accessed using the shortened URL
http://goo.gl/7YDQNO

3
Table of Contents Abstract Page 4 Introduction Page 5 Materials and Methods Page 6 Results Page 11 Discussion Page 12 Conclusion Page 12 Summary Page 13 Acknowledgments Page 14 References Page 14 Schematics Page 15 Source Code Page 20 Images Page 28
4
Abstract Diabetes is one of the major causes of premature illness and death worldwide. Diabetes brings with it neurovascular complications, which result in the development of high pressure areas in the feet and hands. Patients with diabetic neuropathy often lose sensations in their feet while walking or standing, because peripheral neuropathy causes nerve damage in arms and legs. If not treated correctly, it could cause injury in the feet and eventually result in ulceration and even amputation. My objective in this project is to design and build a low-cost pressure measurement and analysis system based on an Arduino microcontroller, which a patient can use at home to measure his or her foot pressure. If the system detects a problem, it can send an alert to the doctor. In the future, this system can be used to measure other vital statistics of the patient as well. I have successfully designed and built a prototype system using a set of eight FlexiForce sensors distributed on a shoe. An Arduino microcontroller is used to measure the pressure sensor outputs and transmit the information through an Xbee wireless transmitter. I have also built a display device that receives the wireless signal and displays the foot pressure information on a LED bar graph display. The device can also compare the pressure distribution against a reference distribution and show any anomalies. The results show that such a device can be built at a low cost and can accurately measure the foot pressure distribution to detect anomalies.

5
Introduction Motivation
Diabetes is one of the major causes of premature illness and death worldwide. According to the World Diabetes Foundation, approximately 300 million people in the world today (corresponding to 6.6% of the adult population) have diabetes, mostly type 2. Each year the number is increasing by 7 million, reaching 438 million in the year 2030, or 7.8% of the adult population. This is a rise of 54% in 20 years. In many poor countries of Africa, diabetes is reaching the scale of an epidemic. Diabetes brings with it neurovascular complications, which result in the development of high pressure areas in the feet and hands. Patients with diabetic neuropathy often lose sensations in their feet while walking or standing, because peripheral neuropathy causes nerve damage in arms and legs. If not treated correctly, it could cause injury in the feet and eventually result in ulceration and even amputation. This is a huge burden on the healthcare system. Locating abnormal pressure patterns under the foot enables the early detection and treatment of foot neuropathy, preventing its serious consequences. My objective in this project is to design and build a low-cost pressure measurement and analysis system based on an Arduino microcontroller, which a patient can use at home to measure his or her foot pressure. If the system detects a problem, it can send an alert to the doctor. In the future, this system can be used to measure other vital statistics of the patient as well. Engineering Goal
The goal of this project is to design and build a low cost system where the patient can step on the foot analyzer device in his/her own home. The pressure points are color-coded and can be viewed on devices such as a phone or tablet. If the device detects a problem with the foot pressure it sends a message to the doctor. The doctor can then treat the patient early and the problem of neuropathy can be controlled. This can save the patient from falls, ulcers and amputation thus saving healthcare costs.
The device must be compact and inexpensive. The system must work reliably and must detect problems with the pressure distribution under the foot, thus saving time and eliminating costly medical complications.
6
Materials and Methods Materials Used
Transmitter: (1) Shoe Sole, (8) FlexiForce Pressure Sensors, Electrical Tape, (1) XBee Wireless Transmitter, (1) Arduino Nano Microcontroller, Electrical Wires, (1) 9 volt battery, (1) Breadboard, (1) On/Off Switch
Receiver: (1) Breadboard, (1) On/Off Switch, (1) 8x8 LED Display, (1) Arduino Pro Mini Microcontroller, (1) XBee Wireless Receiver, Various Electrical Parts, Wires The total cost of materials does not exceed $200.
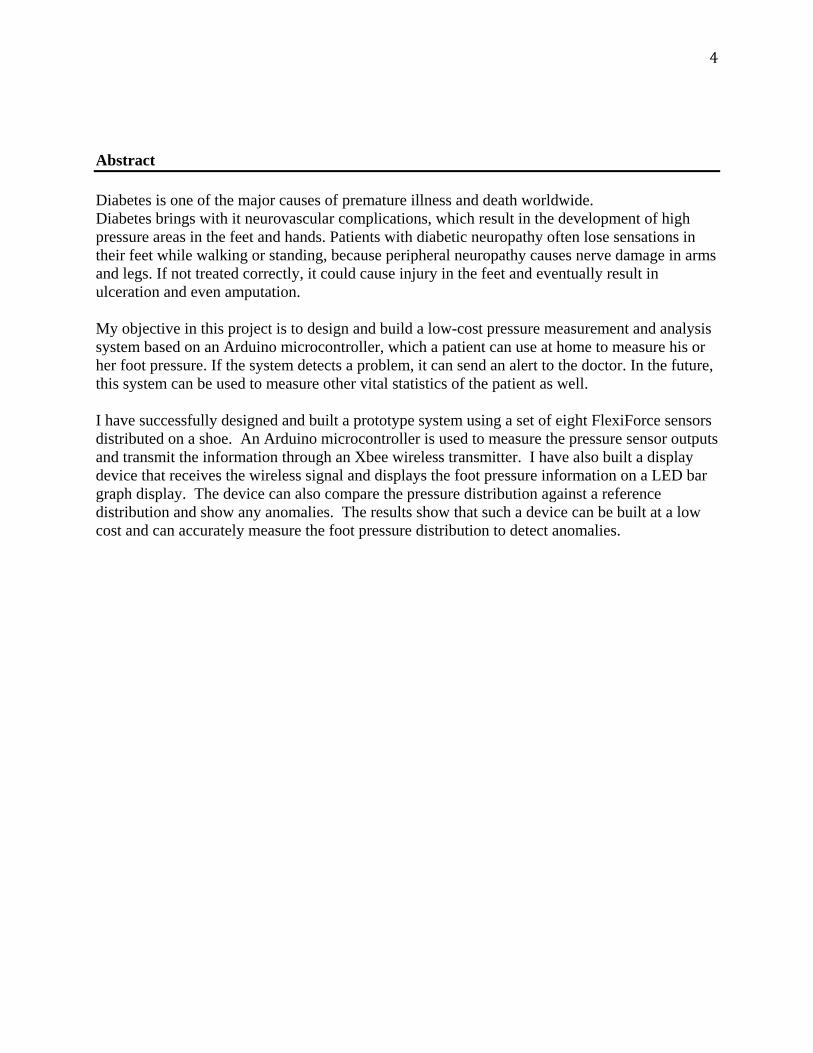
Method or Procedures
The system is illustrated in the block diagram above. The foot pressure distribution is measured by a set of FlexiForce pressure sensors[3] distributed under the shoe. The output signals of the sensors are read by the Arduino microcontroller and transmitted through a Bluetooth transmitter. A software application running on a cell phone, PC, or tablet can receive the signal through its Bluetooth receiver and display it. The software can also detect abnormalities in the distribution and send e-mail messages to a healthcare provider.
Detailed Plan For Transmitter
I used FlexiForce pressure sensors to measure the pressure under various areas of the foot. The FlexiForce sensor is based on a force-sensing resistor, whose resistance varies inversely with the applied force. With no load, the resistance is very high (more than 1 MegaOhm). As load is applied, the resistance decreases as shown below.
ArduinoMicrocontroller
XBEETransmitter
Antenna

7
By connecting it in an electrical circuit, the change in resistance can be converted to a change in voltage, which can then be sensed by the Arduino microcontroller. The following circuit can be used to convert the change in the resistance of the sensor to a change in voltage.
Abu-Faraj [2] determined that sensors must be placed on eight areas of the foot to measure the pressure distribution accurately. These areas are categorized into high, medium and low-pressure areas.
High-pressure areas: Heel, Metatarsal Head and Metatarsal Head 1 Medium-pressure areas: Metatarsal Head 5, Toe and Arch 1 Low-pressure areas: Fing and Arch 2
These areas are marked in the figure. I placed the pressure sensors on a rubber sole according to this layout.
8
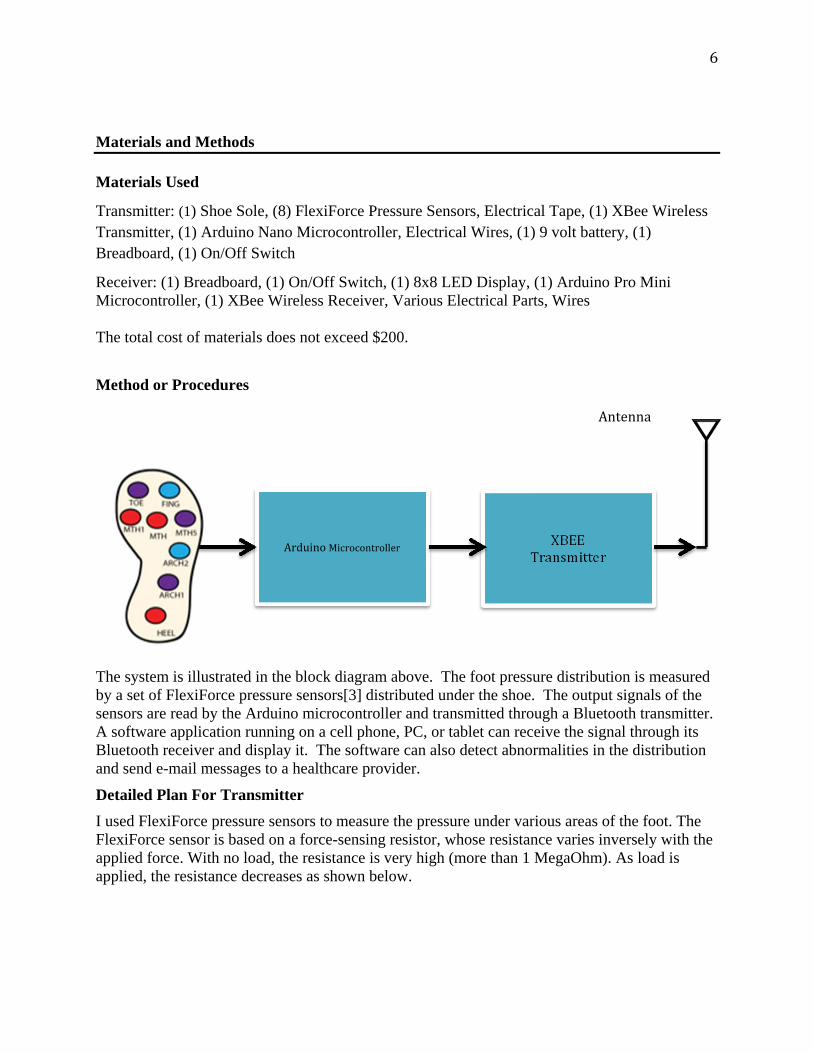
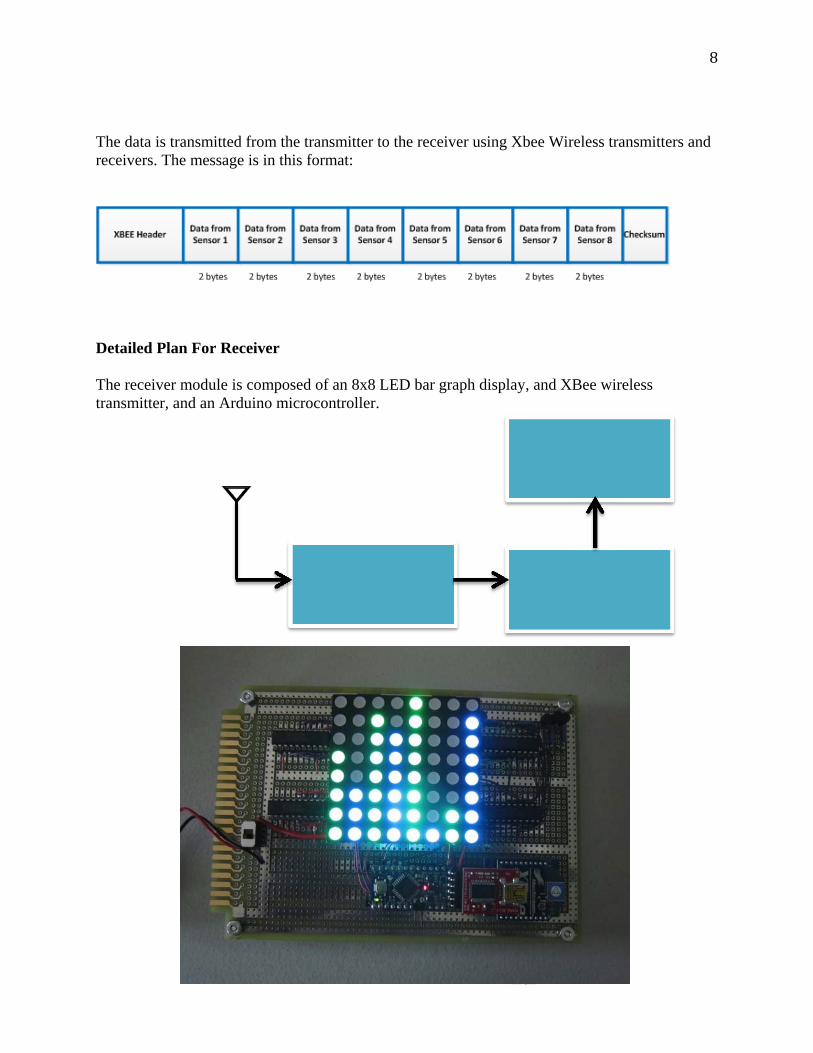
The data is transmitted from the transmitter to the receiver using Xbee Wireless transmitters and receivers. The message is in this format:
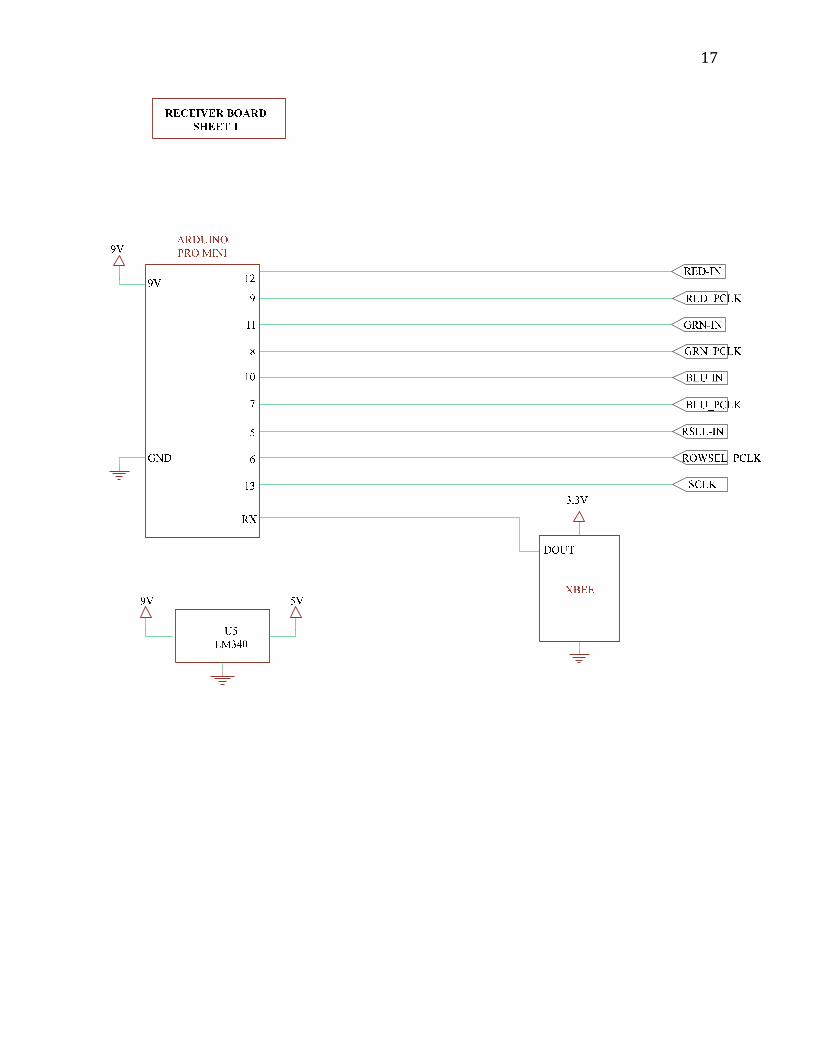
Detailed Plan For Receiver The receiver module is composed of an 8x8 LED bar graph display, and XBee wireless transmitter, and an Arduino microcontroller.

9
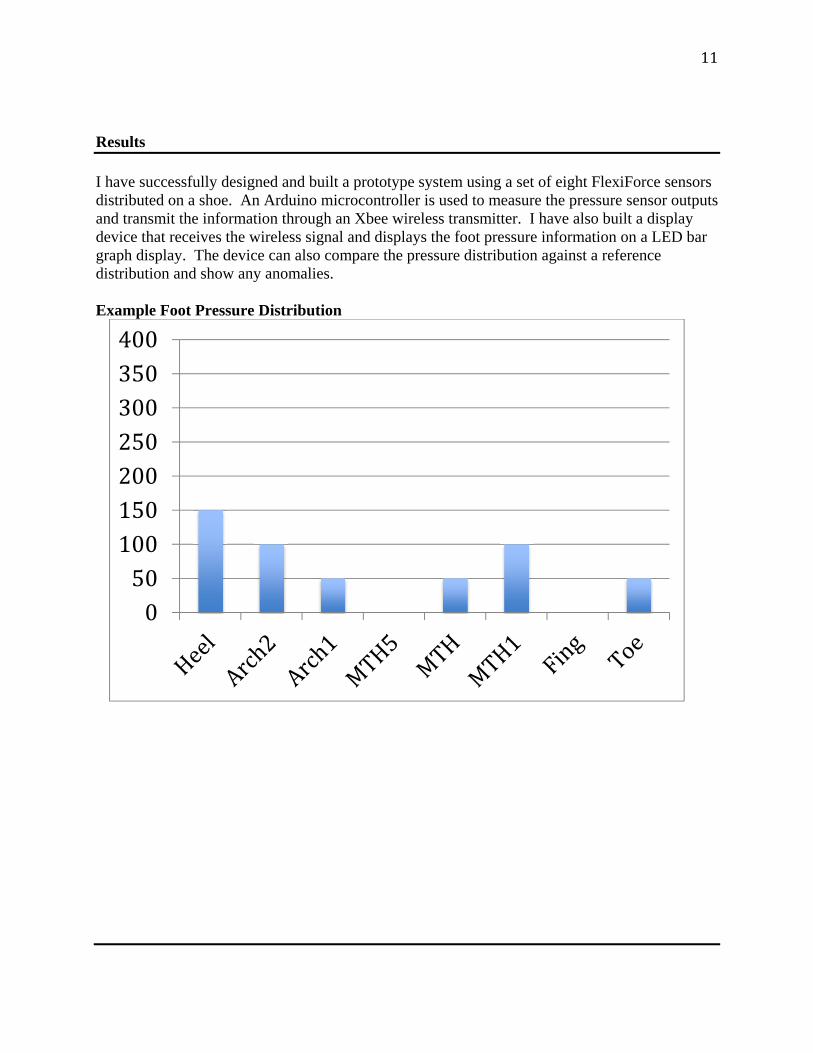
Calibration I used a cheap homemade calibration system to calibrate the foot sensors. This system can accurately measure the force on each sensor. By varying the pressure with a 3/8” puck and test weights and measuring the corresponding voltage at the input of the Arduino microcontroller, I calibrated each of the eight sensors. This allowed my device to display the pressure distribution under the foot accurately. Patil [1] showed that the pressure in various areas of the foot varied from 50 to 400 KiloPascals for normal subjects (1 KiloPascal is equal to 0.1 Newtons/cm2 ). My device will display a bar graph of the pressure distribution under the foot. The following figure shows an example of the pressure distribution in the three high-pressure areas: Metatarsal Head, Metatarsal Head 1, and Heel.
In the bar graph, the current distribution responds to the most recently measured values and the reference distribution can be the “normal” distribution programmed by the physician, or the average of the measured values over time. Foot neuropathy results in significantly higher pressure values in the Metatarsal Head and Head 1 areas [1], so a large deviation of the measured values from MTH and MTH1 sensors is treated as a potential symptom of neuropathy. This can then be used to alert the patient and/or doctor, thus avoiding further damage to the foot.
10
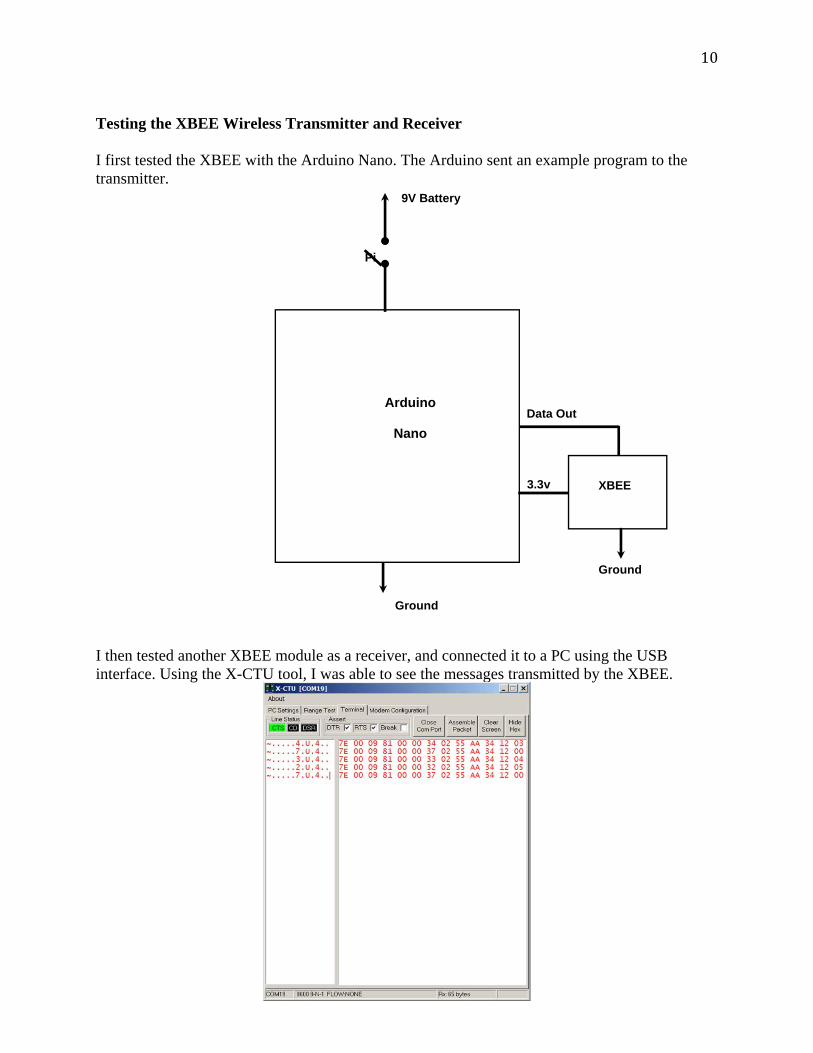
Testing the XBEE Wireless Transmitter and Receiver I first tested the XBEE with the Arduino Nano. The Arduino sent an example program to the transmitter. I then tested another XBEE module as a receiver, and connected it to a PC using the USB interface. Using the X-CTU tool, I was able to see the messages transmitted by the XBEE.
Arduino
Nano
Ground
3.3v
Pi
9V Battery
Ground
XBEE
Data Out
11
Results I have successfully designed and built a prototype system using a set of eight FlexiForce sensors distributed on a shoe. An Arduino microcontroller is used to measure the pressure sensor outputs and transmit the information through an Xbee wireless transmitter. I have also built a display device that receives the wireless signal and displays the foot pressure information on a LED bar graph display. The device can also compare the pressure distribution against a reference distribution and show any anomalies. Example Foot Pressure Distribution
050100150200250300350400

12
Discussion I learned many valuable things from this project. Having used Arduino microcontrollers in previous projects, it was easy for me to get started on the design. However, I had to learn about the FlexiForce sensors and how to design with them. A difficult challenge was to calibrate the sensors. Having no access to testing machines and reference weights, I built a cheap calibration structure myself using a bathroom scale, where I could vary the force on each sensor and plot its resistance versus force graph. Another challenge was in designing the wireless link between the measurement device and the display device. I had originally wanted to use Bluetooth for this, but found the software to be too complex. Instead I used XBee devices which are much easier to program. I found an XBee board that can connect to an iPhone or iPad through an interface cable, thus allowing the pressure data to be accessible to an application running on it. Finally, I learned how to test my system step by step, and solve many problems along the way. Although my project won the grand prize across all categories at the California State Science Fair, I have continued to work on improving it. In the future, I would like to develop an iPhone/iPad app for the device. I would also like to test the device on more diabetes patients to improve the anomaly detection algorithms. Finally, I would like to turn my prototype into a real product. Conclusion The results show that such a device can be built at a low cost and can accurately measure the foot pressure distribution to detect anomalies. There are many applications for this Arduino-based foot neuropathy analyzer. It can be used to detect and control neuropathy, analyze areas of possible ulceration, monitor foot disorders, assist in footwear research ad design, and assess the effects of orthotics on feet. The low production cost can allow it to be beneficial in poorer countries, where diabetes is currently reaching the scale of an epidemic. In the future, I hope to create an iPhone, iPad, or Android app that will receive the signal from the transmitter module and alert a healthcare provider if there are abnormalities in the foot pressure distribution. I would also like to test my device on neuropathy patients and compare the results with a normal foot pressure distribution map.

13
Summary (Application to Judging Criteria) Use of Microcontroller: This Arduino-based foot neuropathy analyzer uses two Arduino microcontrollers – an Arduino Nano as part of the transmitter and an Arduino Pro Mini as part of the receiver. These microcontrollers control the functioning of the entire device. The transmitter microcontroller processes the data from the FlexiForce sensors and sends the data to the XBEE wireless transmitter. The receiver microcontroller evaluates the data received and passes it to the bar graph display. Innovation: This device has potential to dramatically lower the number of neuropathy-related amputations that occur each year. It is inexpensive, portable, and effective for patients to use at home. The projected cost of my entire device is between $100 and $200, which makes it a cheap alternative to the foot pressure distribution analyzer systems that exist today. Current neuropathy analyzer devices, such as F-Scan and MatScan, are extremely expensive and can only be used in doctor’s offices. Execution: The prototype effectively evaluates the pressure distribution at each of eight pressure points on the foot. It is a compact device and was created specifically for patient use. The trials conducted on a neuropathy patient affirm that the device works accurately. Utility: This device has the potential to dramatically improve neuropathy treatment for diabetic patients. In the military, between 12% and 20% of retired individuals experience post traumatic stress disorder, which has been proven to cause an increased risk of diabetes. [7] Therefore, this device will help improve military medicine, especially because of its portability and ease of use.

14
Acknowledgments Most of my research was done at home. I received guidance from my science teacher and my father Dr. Anujan Varma. My father helped me identify the relevant references for my project, provided tools (soldering iron, multimeter, etc.), and helped order the parts for my devices. I used results from two key references in my work: 1. Abu-Faraj and others, Evaluation of a Rehabilitative Pedorthic: Plantat Pressure Alterations with Scaphoid Pad Application, IEEE Transactions on Rehabilitation Engineering, December 1986. The positioning of my sensors on the insole is based on their recommendations. 2. Patel and others, Development of Planter Foot Pressure Distribution System Using FlexiForce Sensors, Sensors and Transducers Journal, September 1009. They originally proposed the anomaly detection algorithm used in my device. References
1. S. L. Patil, Madhuri A. Thatte, U. M. Chaskar, “Development of Planter Foot Pressure Distribution System Using Flexi Force Sensors,” Sensors and Transducers Journal, Vol. 108, Issue 9, September 2009, pp. 73–79.
2. Z. O. Abu-Faraj, G. F. Harris, A-H. Chang, M. J. Shereff, “Planter Pressure Alterations with Scphoid Pad,” IEEE Transactions on Rehabilitation Engineering, Vol. 4, Dec. 1996, pp. 328–336.
3. FlexiForce Sensor Documentation, www.tekscan.com
4. ELF Force and Load Measurement System, www.tekscan.com
5. Diabetes Facts: worlddiabetesfoundation.org
6. Arduino documentation, www.arduino.cc
7. http://care.diabetesjournals.org/content/33/8/1771.abstract
8. M. Hebel and H. Bricker, “Getting Started with XBee RF Modules,” http://www.parallax.com

15
Schematics

16
A2
A3
A4
A5
A6
A7
TX
A1
GND
5V
+5VARDUINO NANO 3.0
+3.3V
+5V +5V +5V +5V +5V +5V +5V +5V
A0
XBEE
R10
2K
TRANSMITTER BOARD
DIN
17

18

19
330
+5V
1K
R
G
B
ROW
8 x 8 RGB LED MATRIX
T1 – T82N3905
330
330
ROW 1
RED C1
GRN C1
BLU C1
8x8 RGB LED (only 1 row and column shown
R1 – R8
R9 – R16
R17 – R24
R25 – R32
RECEIVER BOARDSHEET 3

20
Source Code: Transmitter
21
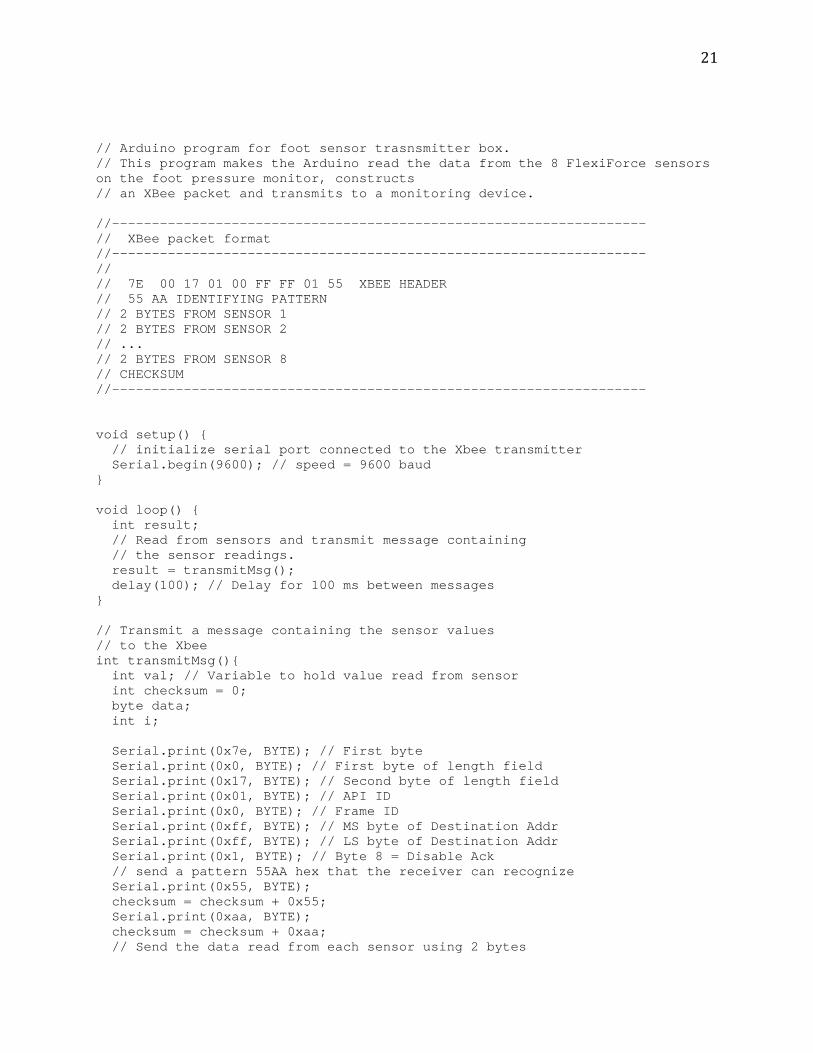
// Arduino program for foot sensor trasnsmitter box. // This program makes the Arduino read the data from the 8 FlexiForce sensors on the foot pressure monitor, constructs // an XBee packet and transmits to a monitoring device. //------------------------------------------------------------------- // XBee packet format //------------------------------------------------------------------- // // 7E 00 17 01 00 FF FF 01 55 XBEE HEADER // 55 AA IDENTIFYING PATTERN // 2 BYTES FROM SENSOR 1 // 2 BYTES FROM SENSOR 2 // ... // 2 BYTES FROM SENSOR 8 // CHECKSUM //------------------------------------------------------------------- void setup() { // initialize serial port connected to the Xbee transmitter Serial.begin(9600); // speed = 9600 baud } void loop() { int result; // Read from sensors and transmit message containing // the sensor readings. result = transmitMsg(); delay(100); // Delay for 100 ms between messages } // Transmit a message containing the sensor values // to the Xbee int transmitMsg(){ int val; // Variable to hold value read from sensor int checksum = 0; byte data; int i; Serial.print(0x7e, BYTE); // First byte Serial.print(0x0, BYTE); // First byte of length field Serial.print(0x17, BYTE); // Second byte of length field Serial.print(0x01, BYTE); // API ID Serial.print(0x0, BYTE); // Frame ID Serial.print(0xff, BYTE); // MS byte of Destination Addr Serial.print(0xff, BYTE); // LS byte of Destination Addr Serial.print(0x1, BYTE); // Byte 8 = Disable Ack // send a pattern 55AA hex that the receiver can recognize Serial.print(0x55, BYTE); checksum = checksum + 0x55; Serial.print(0xaa, BYTE); checksum = checksum + 0xaa; // Send the data read from each sensor using 2 bytes
22
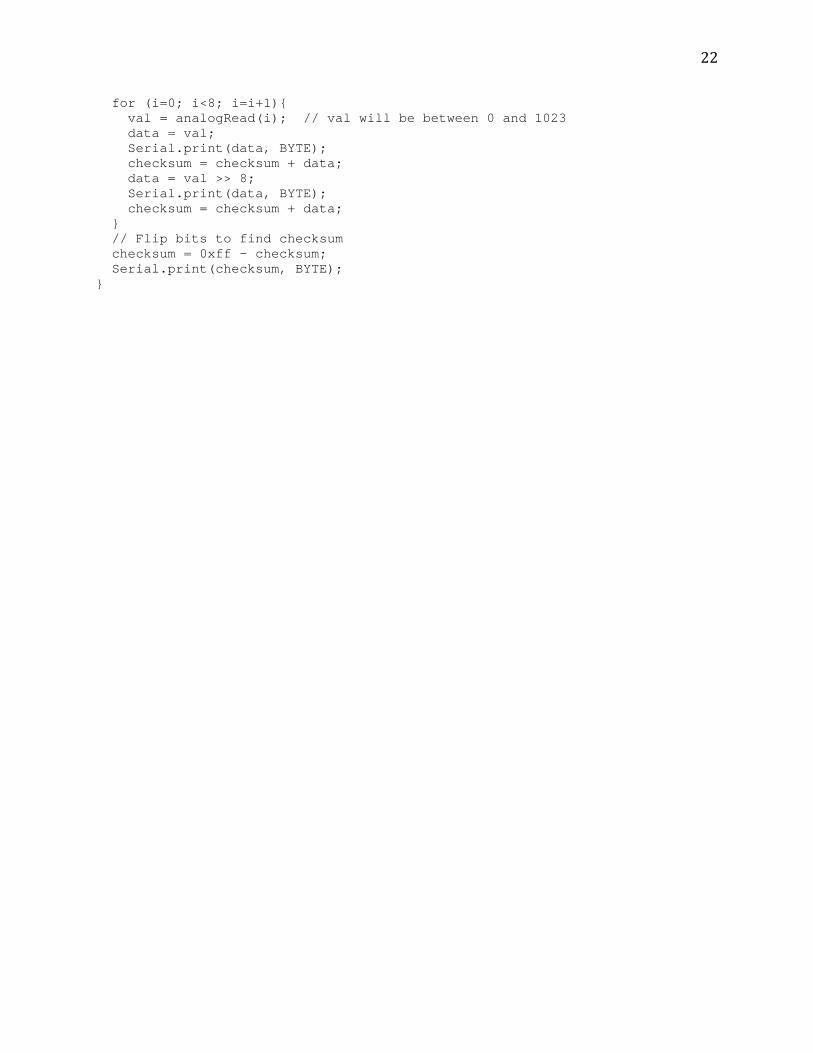
for (i=0; i<8; i=i+1){ val = analogRead(i); // val will be between 0 and 1023 data = val; Serial.print(data, BYTE); checksum = checksum + data; data = val >> 8; Serial.print(data, BYTE); checksum = checksum + data; } // Flip bits to find checksum checksum = 0xff - checksum; Serial.print(checksum, BYTE); }

23
Source Code: Receiver

24
// Complete Arduino program for receiver //--------------------------------------------------- #include "TimerOne.h" // Needed for using the Arduino timer library // Arduino pin definitions int RedDataPin = 12; int GreenDataPin = 11; int BlueDataPin = 10; int RedParClockPin = 9; int GreenParClockPin = 8; int BlueParClockPin = 7; int SerialClockPin = 13; int RowSelectDataPin = 5; int RowSelectParClockPin = 6; // The following arrays are used to display the LED BARs, one array for each color. // Array element [i] is an integer representing Row i of the 8x8 LED display. Bit j of this element // turns on the LED in Column j of the 8x8 display. // Example: Element [0] = 3 means that the first two LEDs of the first low will light up. byte redValues[8] = { 0, 0, 0, 0, 0, 0, 0, 0}; byte greenValues[8] = { 0, 0, 0, 0, 0, 0, 0, 0}; byte blueValues[8] = { 0, 0, 0, 0, 0, 0, 0, 0}; // Threshold values for turning on a LED. These are the "steps" in the BAR graph. int yAxisSteps[8] = { 100, 160, 220, 280, 340, 400, 460, 520}; int currentDisplayRow = 0; // Points to the current row being scanned. void setup() { // Set up Arduino pins pinMode(RedDataPin, OUTPUT); // Drives RED shift register data pin pinMode(GreenDataPin, OUTPUT); // Drives GREEN shift register data pin pinMode(BlueDataPin, OUTPUT); // Drives BLUE shift register data pin pinMode(RedParClockPin, OUTPUT); // Drives RED shift register parallel clock pin pinMode(GreenParClockPin, OUTPUT); // Drives GREEN shift register parallel clock pin pinMode(BlueParClockPin, OUTPUT); // Drives BLUE shift register parallel clock pin pinMode(SerialClockPin, OUTPUT); // Drives the serial clock pin of all shift registers pinMode(RowSelectDataPin, OUTPUT); // Drives Row Selection shift register data pin

25
pinMode(RowSelectParClockPin, OUTPUT); // Drives Row Selection shift register parallel clock pin Serial.begin(9600); // Initialize timer to 2 milliseconds, to change the display row // every 2 milliseconds. Timer1.initialize(2000); Timer1.attachInterrupt(refreshRow); // When timer goes off, call this function } void loop() { int val; int sensorData; byte greenLEDBar[8]; int i; // Check for a new packet from the XBee. // The pattern 55AA hex marks the start of a packet. while (Serial.available()==0){ }; val = Serial.read(); if (val == 0x55){ while (Serial.available()==0){ }; val = Serial.read(); if (val == 0xaa){ for (i=0; i<8; i++){ while (Serial.available()==0){ }; val = Serial.read(); // Get sensor data. There are 8 sensors and 2 bytes per sensor. sensorData = val; while (Serial.available()==0){ }; val = Serial.read(); sensorData = sensorData + val*256; // Display data on the LEDs greenLEDBar[i] = setLEDBar(sensorData); } // Update LED Bars greenValues[7] = greenLEDBar[0]; // Heel greenValues[6] = greenLEDBar[2]; // Arch2 greenValues[5] = greenLEDBar[6]; // Arch1 greenValues[4] = greenLEDBar[3]; // MTH5 greenValues[3] = greenLEDBar[5]; // MTH greenValues[2] = greenLEDBar[4]; // MTH1 greenValues[1] = greenLEDBar[7]; // FING greenValues[0] = greenLEDBar[1]; // Toe for (i=0; i<8; i++) blueValues[i] = greenValues[i]; // Display both green and blue LEDs to make them purple. } } }

26
byte setLEDBar(int val){ // Convert the sensor data to the LED bar format. byte ledBar = 0; if (val > yAxisSteps[0]) ledBar = ledBar + 1; if (val > yAxisSteps[1]) ledBar = ledBar + 2; if (val > yAxisSteps[2]) ledBar = ledBar + 4; if (val > yAxisSteps[3]) ledBar = ledBar + 8; if (val > yAxisSteps[4]) ledBar = ledBar + 16; if (val > yAxisSteps[5]) ledBar = ledBar + 32; if (val > yAxisSteps[6]) ledBar = ledBar + 64; if (val > yAxisSteps[7]) ledBar = ledBar + 128; return ledBar; } void refreshRow(){ // Display one row of 8 LEDs on the LED display. // The variable currentDisplayRow points to the row to be displayed. // This function is called every 2 ms to refresh the display. byte red = 0; byte green = 0; byte blue = 0; int i; byte colNum = 0; byte rowBit = (1 << currentDisplayRow); byte index = 1; // Transfer data to the display serially through the shift registers. digitalWrite(RowSelectDataPin, LOW); for (i=0; i<8; i++){ digitalWrite(SerialClockPin, HIGH); // serial clock digitalWrite(SerialClockPin, LOW); } digitalWrite(RowSelectParClockPin, HIGH); digitalWrite(RowSelectParClockPin, LOW); for (i=0; i<8; i++){ if (redValues[i] & rowBit) digitalWrite(RedDataPin, HIGH); else digitalWrite(RedDataPin, LOW); if (greenValues[i] & rowBit) digitalWrite(GreenDataPin, HIGH); else digitalWrite(GreenDataPin, LOW); if (blueValues[i] & rowBit) digitalWrite(BlueDataPin, HIGH); else digitalWrite(BlueDataPin, LOW); // Select the row on the display if (rowBit & index) digitalWrite(RowSelectDataPin, HIGH); else

27
digitalWrite(RowSelectDataPin, LOW); digitalWrite(SerialClockPin, HIGH); // serial clock digitalWrite(SerialClockPin, LOW); index = index << 1; } // Once the data is shifted into the shift registers, we need to give a pulse on // the parallel clock inputs to transfer the data to their outputs. digitalWrite(RedParClockPin, HIGH); // Red parallel clock digitalWrite(RedParClockPin, LOW); digitalWrite(GreenParClockPin, HIGH); // Green parallel clock digitalWrite(GreenParClockPin, LOW); digitalWrite(BlueParClockPin, HIGH); // Blue parallel clock digitalWrite(BlueParClockPin, LOW); digitalWrite(RowSelectParClockPin, HIGH); digitalWrite(RowSelectParClockPin, LOW); // Increment the row number to get it ready for the next refresh cycle currentDisplayRow = (currentDisplayRow+1) % 8; }

28
Images
Transmitter and Sensors

29
Receiver