Embed Size (px)
Citation preview
Are Capital Controls Countercyclical?
by
A.Fernandez A.Rebucci M.Uribe
June 16, 2015
1
Capital Controls: From Villain To Hero
• Early 1990s: large capital inflows to emerging countries. Capi-
tal controls were viewed, with few exceptions, as distortions that
hindered the efficient allocation of capital across countries and
thus impeded economic growth. To a large extent, policymakers
allowed capital to flow unfettered.
• Many of the booms of the early 1990s ended in sudden stops
and financial and/or exchange-rate crises (Southeast Asia and
Russia in the late 1990s, South America in the early 2000s, and
peripheral Europe in the late 2000s). Since then policymakers
view capital controls with more benign eyes.
• The strongest indication of this change of sentiment is that
the IMF now sees capital controls as an appropriate tool for
macroeconomic stabilization (IMF, 2011).
2
Prudential Capital Controls
Capital controls are imposed during booms and relaxed during
contractions.
3
Prudential Capital Controls: Theories
• Collateralized borrowing with value of collateral depending on
a price that individuals take as given: Lorenzoni, 2008; Korinek
2010; Jeanne and Korinek, 2011; Bianchi, 2011; Bianchi and
Mendoza, 2010 and 2013; Fernandez-Arias and Lombardo, 1998;
Benigno, Chen, Otrok, and Rebucci, 2012a,b; and Uribe, 2006,
2007.
• Nominal rigidity (e.g., downward nominal wage rigidity) and
suboptimal monetary policy (e.g. currency pegs): Schmitt-
Grohe and Uribe, 2012a,b; and Farhi and Werning, 2012; Ot-
tonello, 2013.
• The frictions highlighted by both of these theories generate
externalities that cause overborrowing and overspending during
booms and the reverse during contractions. Prudential capital
control policy allows agents to internalize these externalities.
4
This Paper addresses the question
Do countries in practice apply capital controls prudentially
as suggested by the new theories?
5

Preview of Main Findings
• Capital controls are remarkably stable; small standard deviation
of cyclical component.
• Unconditionally, capital controls are virtually acyclical: The
correlation between capital controls and output is about zero.
• Contrary to what a prudential stance would suggest, controls
on inflows are positively correlated with controls on outflows.
• Capital controls are virtually unchanged during economic booms
or busts.
6
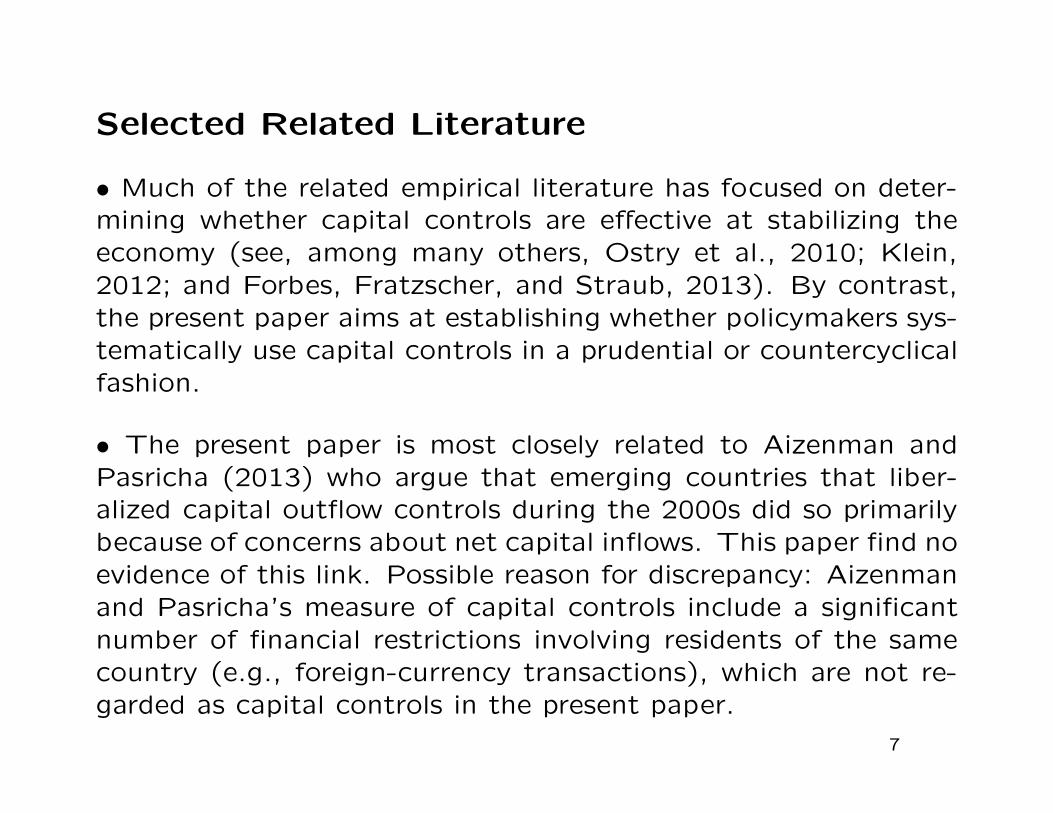
Selected Related Literature
• Much of the related empirical literature has focused on deter-
mining whether capital controls are effective at stabilizing the
economy (see, among many others, Ostry et al., 2010; Klein,
2012; and Forbes, Fratzscher, and Straub, 2013). By contrast,
the present paper aims at establishing whether policymakers sys-
tematically use capital controls in a prudential or countercyclical
fashion.
• The present paper is most closely related to Aizenman and
Pasricha (2013) who argue that emerging countries that liber-
alized capital outflow controls during the 2000s did so primarily
because of concerns about net capital inflows. This paper find no
evidence of this link. Possible reason for discrepancy: Aizenman
and Pasricha’s measure of capital controls include a significant
number of financial restrictions involving residents of the same
country (e.g., foreign-currency transactions), which are not re-
garded as capital controls in the present paper.
7
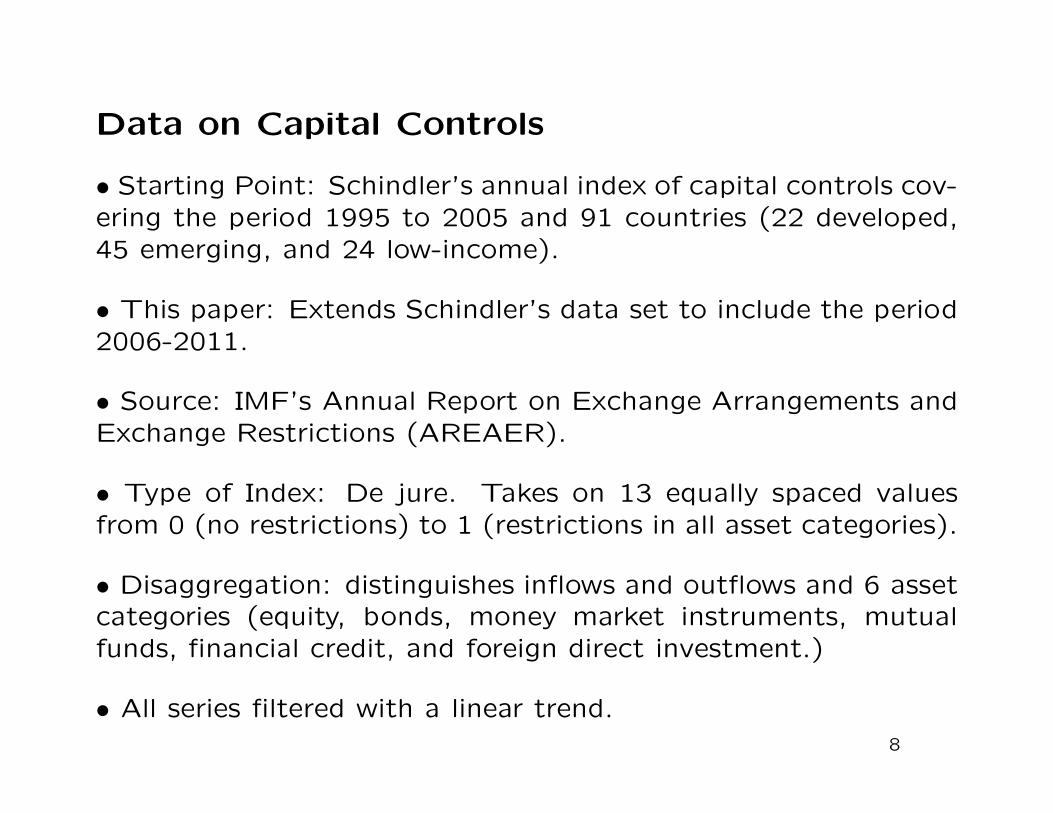
Data on Capital Controls
• Starting Point: Schindler’s annual index of capital controls cov-ering the period 1995 to 2005 and 91 countries (22 developed,45 emerging, and 24 low-income).
• This paper: Extends Schindler’s data set to include the period2006-2011.
• Source: IMF’s Annual Report on Exchange Arrangements andExchange Restrictions (AREAER).
• Type of Index: De jure. Takes on 13 equally spaced valuesfrom 0 (no restrictions) to 1 (restrictions in all asset categories).
• Disaggregation: distinguishes inflows and outflows and 6 assetcategories (equity, bonds, money market instruments, mutualfunds, financial credit, and foreign direct investment.)
• All series filtered with a linear trend.
8
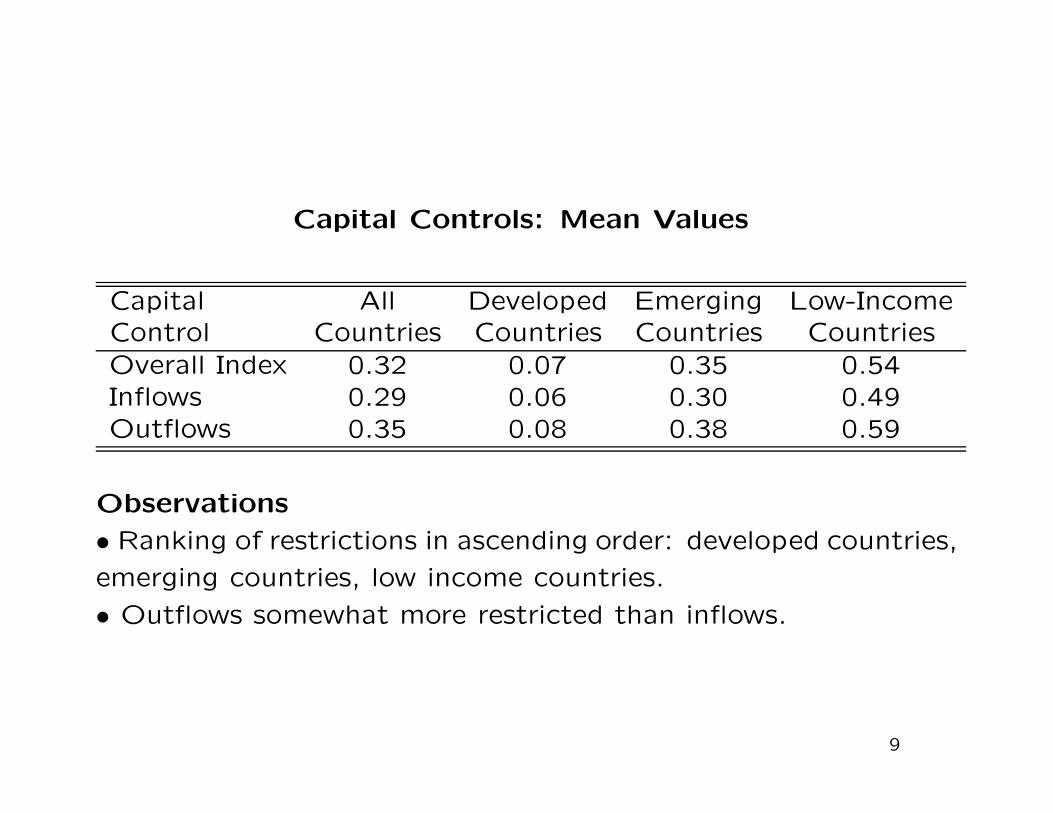
Capital Controls: Mean Values
Capital All Developed Emerging Low-IncomeControl Countries Countries Countries Countries
Overall Index 0.32 0.07 0.35 0.54Inflows 0.29 0.06 0.30 0.49Outflows 0.35 0.08 0.38 0.59
Observations
• Ranking of restrictions in ascending order: developed countries,
emerging countries, low income countries.
• Outflows somewhat more restricted than inflows.
9
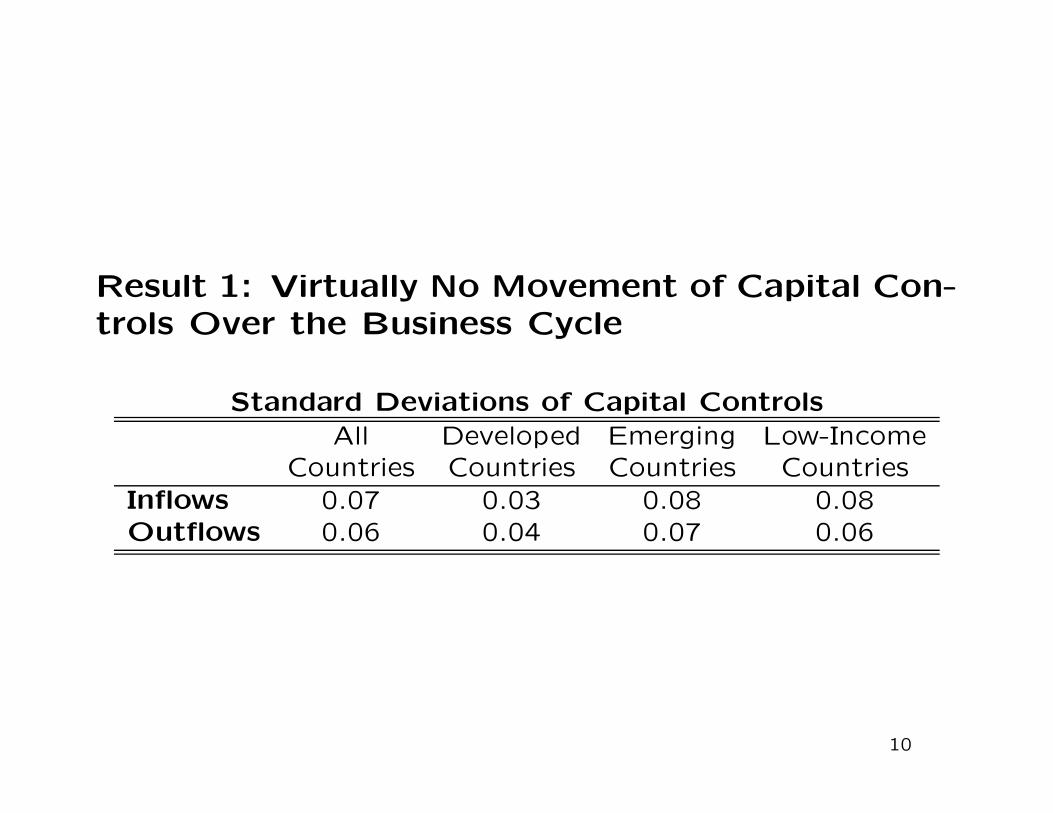
Result 1: Virtually No Movement of Capital Con-trols Over the Business Cycle
Standard Deviations of Capital Controls
All Developed Emerging Low-IncomeCountries Countries Countries Countries
Inflows 0.07 0.03 0.08 0.08Outflows 0.06 0.04 0.07 0.06
10
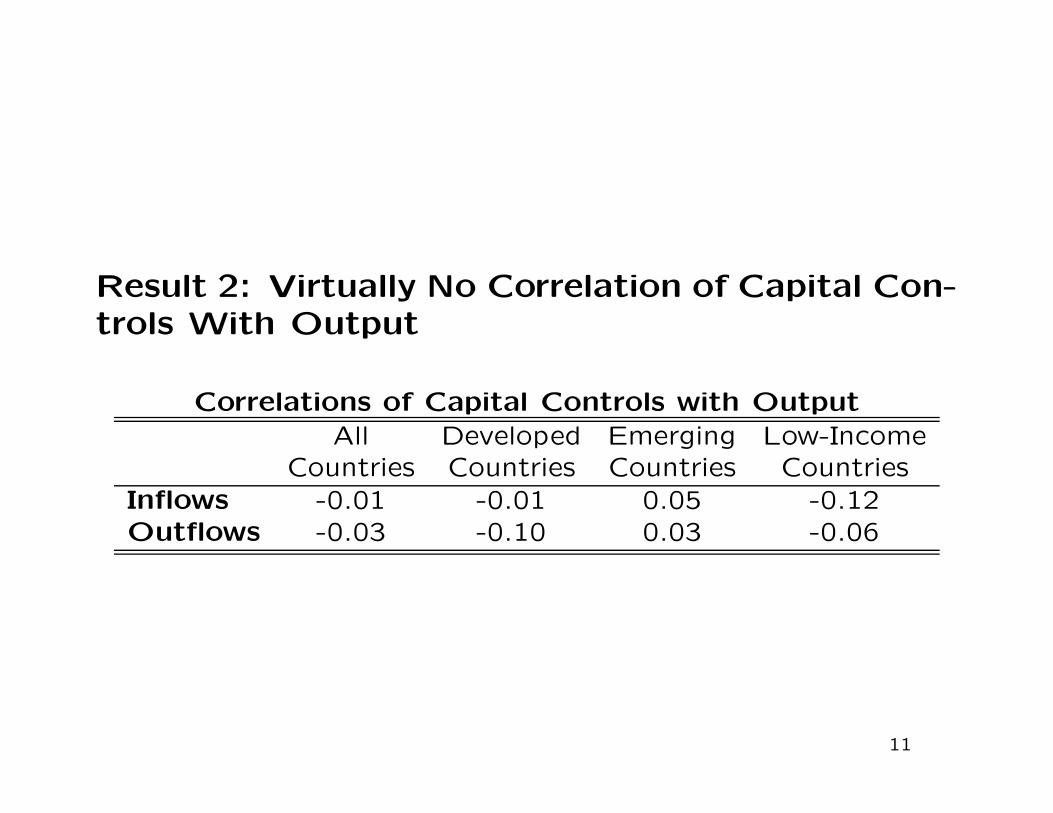
Result 2: Virtually No Correlation of Capital Con-trols With Output
Correlations of Capital Controls with Output
All Developed Emerging Low-IncomeCountries Countries Countries Countries
Inflows -0.01 -0.01 0.05 -0.12Outflows -0.03 -0.10 0.03 -0.06
11
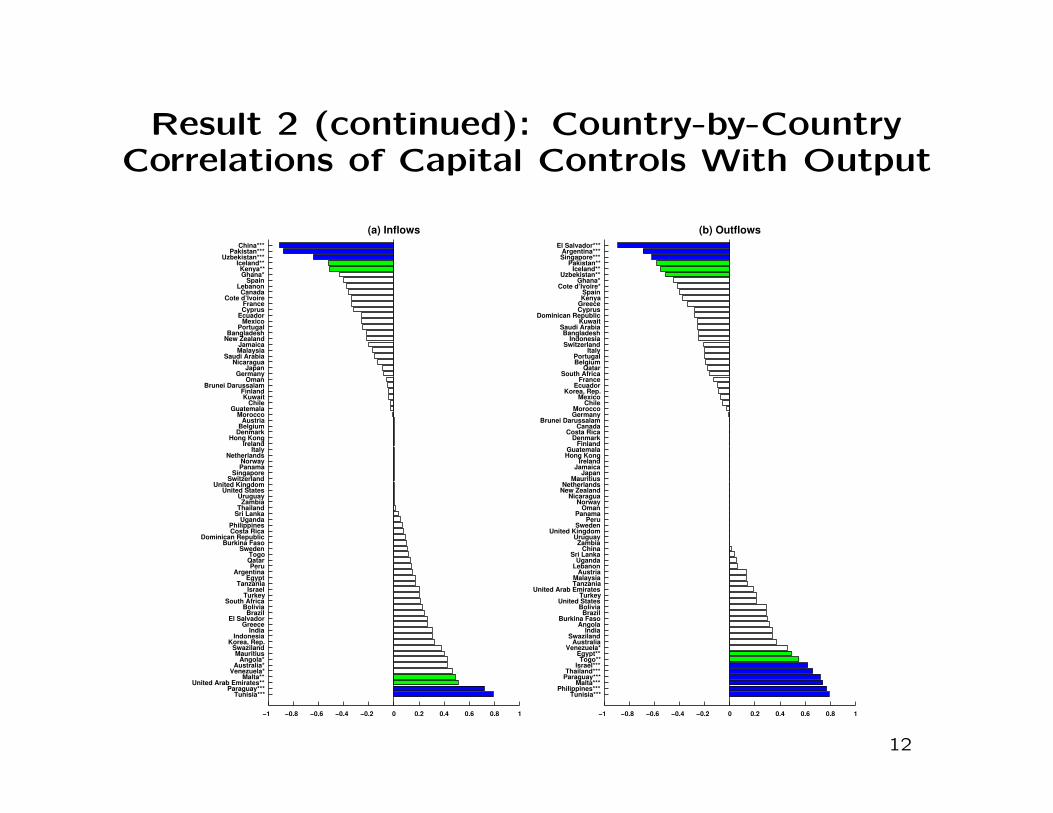
Result 2 (continued): Country-by-CountryCorrelations of Capital Controls With Output
−1 −0.8 −0.6 −0.4 −0.2 0 0.2 0.4 0.6 0.8 1
China***Pakistan***
Uzbekistan***Iceland**Kenya**Ghana*
SpainLebanon
CanadaCote d’Ivoire
FranceCyprus
EcuadorMexico
PortugalBangladesh
New ZealandJamaicaMalaysia
Saudi ArabiaNicaragua
JapanGermany
OmanBrunei Darussalam
FinlandKuwait
ChileGuatemala
MoroccoAustria
BelgiumDenmark
Hong KongIreland
ItalyNetherlands
NorwayPanama
SingaporeSwitzerland
United KingdomUnited States
UruguayZambia
ThailandSri Lanka
UgandaPhilippinesCosta Rica
Dominican RepublicBurkina Faso
SwedenTogoQatarPeru
ArgentinaEgypt
TanzaniaIsrael
TurkeySouth Africa
BoliviaBrazil
El SalvadorGreece
IndiaIndonesia
Korea, Rep.SwazilandMauritius
Angola*Australia*
Venezuela*Malta**
United Arab Emirates**Paraguay***
Tunisia***
(a) Inflows
−1 −0.8 −0.6 −0.4 −0.2 0 0.2 0.4 0.6 0.8 1
El Salvador***Argentina***Singapore***
Pakistan**Iceland**
Uzbekistan**Ghana*
Cote d’Ivoire*SpainKenya
GreeceCyprus
Dominican RepublicKuwait
Saudi ArabiaBangladesh
IndonesiaSwitzerland
ItalyPortugalBelgium
QatarSouth Africa
FranceEcuador
Korea, Rep.Mexico
ChileMoroccoGermany
Brunei DarussalamCanada
Costa RicaDenmark
FinlandGuatemalaHong Kong
IrelandJamaica
JapanMauritius
NetherlandsNew Zealand
NicaraguaNorway
OmanPanama
PeruSweden
United KingdomUruguayZambia
ChinaSri Lanka
UgandaLebanon
AustriaMalaysiaTanzania
United Arab EmiratesTurkey
United StatesBoliviaBrazil
Burkina FasoAngola
IndiaSwaziland
AustraliaVenezuela*
Egypt**Togo**
Israel***Thailand***
Paraguay***Malta***
Philippines***Tunisia***
(b) Outflows
12

Result 3: Positive Correlation Between Controlson Inflows and Controls on Outflows
Correlations Between Capital Controls on Inflows
and Capital Controls on Output
All Developed Emerging Low-IncomeCountries Countries Countries Countries
0.28 0.21 0.32 0.31
13
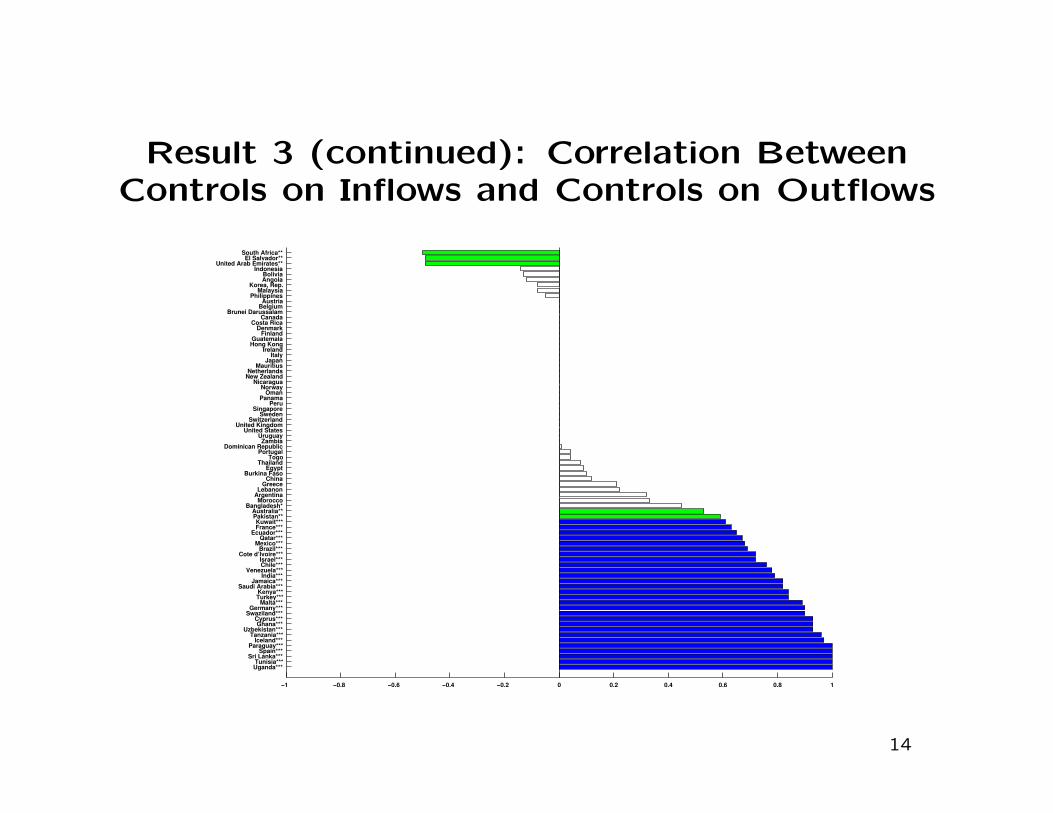
Result 3 (continued): Correlation BetweenControls on Inflows and Controls on Outflows
−1 −0.8 −0.6 −0.4 −0.2 0 0.2 0.4 0.6 0.8 1
South Africa**El Salvador**
United Arab Emirates**Indonesia
BoliviaAngola
Korea, Rep.Malaysia
PhilippinesAustria
BelgiumBrunei Darussalam
CanadaCosta Rica
DenmarkFinland
GuatemalaHong Kong
IrelandItaly
JapanMauritius
NetherlandsNew Zealand
NicaraguaNorway
OmanPanama
PeruSingapore
SwedenSwitzerland
United KingdomUnited States
UruguayZambia
Dominican RepublicPortugal
TogoThailand
EgyptBurkina Faso
ChinaGreece
LebanonArgentinaMorocco
Bangladesh*Australia**Pakistan**Kuwait***France***
Ecuador***Qatar***
Mexico***Brazil***
Cote d’Ivoire***Israel***Chile***
Venezuela***India***
Jamaica***Saudi Arabia***
Kenya***Turkey***
Malta***Germany***
Swaziland***Cyprus***Ghana***
Uzbekistan***Tanzania***
Iceland***Paraguay***
Spain***Sri Lanka***
Tunisia***Uganda***
14
The Behavior of Capital Controls AroundBooms and Busts
Definition of a Boom (Bust): At least 3 consecutive years of
output above (below) trend.
Features of Idenfified Booms (Busts):
• Average magnitude of peaks (troughs), 8% above (below)
trend.
• Average duration of booms (busts), 7 years.
15

Boom-Bust Episodes and Capital Controls
−2 −1 0 1 2−0.31
0
0.34
Years
Boom
0
5
10
−2 −1 0 1 2−0.34
0
0.38
Years
Bust
−8
−7
−6
−5
−4
−3
−2
−2 −1 0 1 2−0.34
0
0.33
Years
Boom
0
5
10
−2 −1 0 1 2−0.36
0
0.42
Years
Bust
−8
−7
−6
−5
−4
−3
−2
−2 −1 0 1 2−0.37
0
0.39
Years
Boom
0
5
10
−2 −1 0 1 2−0.4
0
0.44
Years
Bust
−8
−7
−6
−5
−4
−3
−2
Average Index (lhs) Average Output Gap (rhs) Two Standard Deviation for the Index (lhs)
(a) Overall Index
(b) Inflows
(c) Outflows
16
Boom-Bust Episodes and Capital Controls: FourDecompositions
• By level of development.
• By Exchange-Rate Regime.
• By level of external indebtedness.
• By asset category.
17
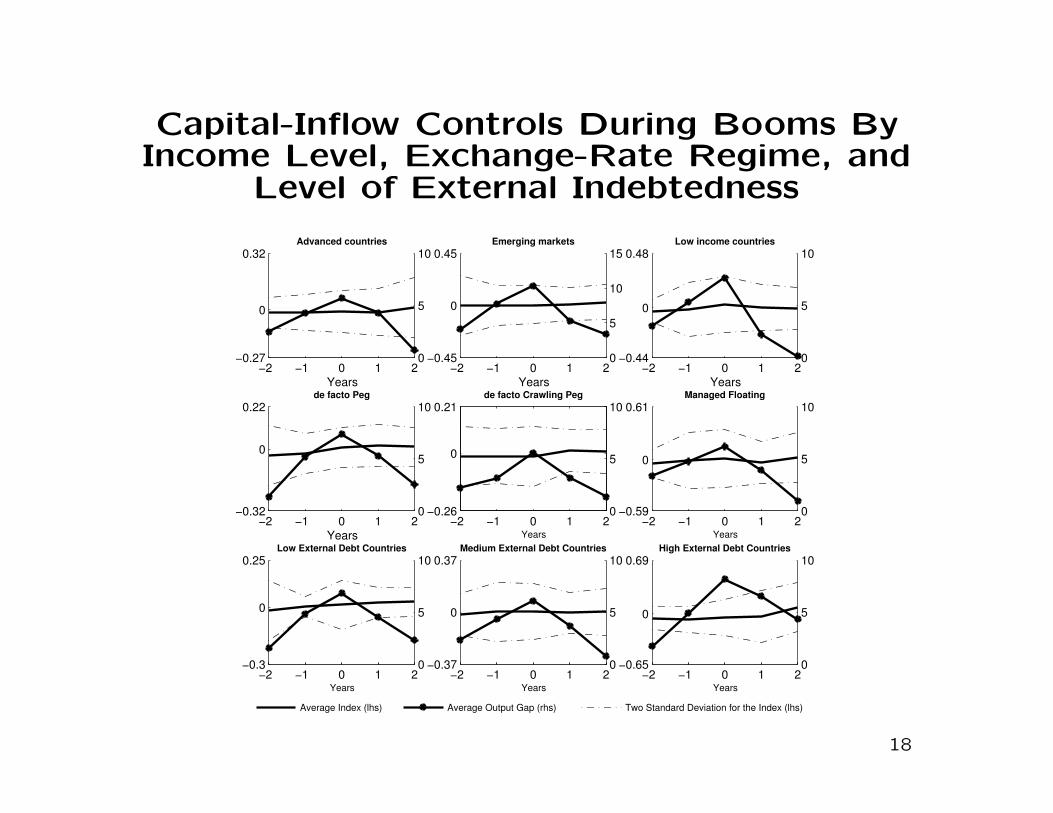
Capital-Inflow Controls During Booms ByIncome Level, Exchange-Rate Regime, and
Level of External Indebtedness
−2 −1 0 1 2−0.27
0
0.32
Years
Advanced countries
0
5
10
−2 −1 0 1 2−0.45
0
0.45
Years
Emerging markets
0
5
10
15
−2 −1 0 1 2−0.44
0
0.48
Years
Low income countries
0
5
10
−2 −1 0 1 2−0.32
0
0.22
Years
de facto Peg
0
5
10
−2 −1 0 1 2−0.26
0
0.21
Years
de facto Crawling Peg
0
5
10
−2 −1 0 1 2−0.59
0
0.61
Years
Managed Floating
0
5
10
−2 −1 0 1 2−0.3
0
0.25
Years
Low External Debt Countries
0
5
10
−2 −1 0 1 2−0.37
0
0.37
Years
Medium External Debt Countries
0
5
10
−2 −1 0 1 2−0.65
0
0.69
Years
High External Debt Countries
0
5
10
Average Index (lhs) Average Output Gap (rhs) Two Standard Deviation for the Index (lhs)
18

Acyclicality of Granular Measures ofCapital-Inflow Controls
−2 −1 0 1 2−0.49
0
0.49
Years
eq
0
5
10
−2 −1 0 1 2−0.46
0
0.43
Years
bo
0
5
10
−2 −1 0 1 2−0.54
0
0.56
Years
di
0
5
10
−2 −1 0 1 2−0.63
0
0.66
Years
eq−plbn
0
5
10
−2 −1 0 1 2−0.6
0
0.63
Years
bo−plbn
0
5
10
−2 −1 0 1 2−0.56
0
0.63
Years
dii
0
5
10
−2 −1 0 1 2−0.56
0
0.54
Years
eq−siar
0
5
10
−2 −1 0 1 2−0.66
0
0.6
Years
bo−siar
0
5
10
−2 −1 0 1 2−0.48
0
0.49
Years
ldi
0
5
10
Average Inflow Index (lhs) Average Output Gap(rhs) Two Standard Deviation for the Index(lhs)
19
Capital Controls, the Real Exchange Rate,and the Current Account
• Based on a meta analysis of more than 30 empirical studies,
Magud, Reinhart, and Rogoff (2011), find that two important
reasons why policymakers impose capital controls are:
– To reduce real exchange-rate pressure.
– To reduce the volume of capital flows.
20
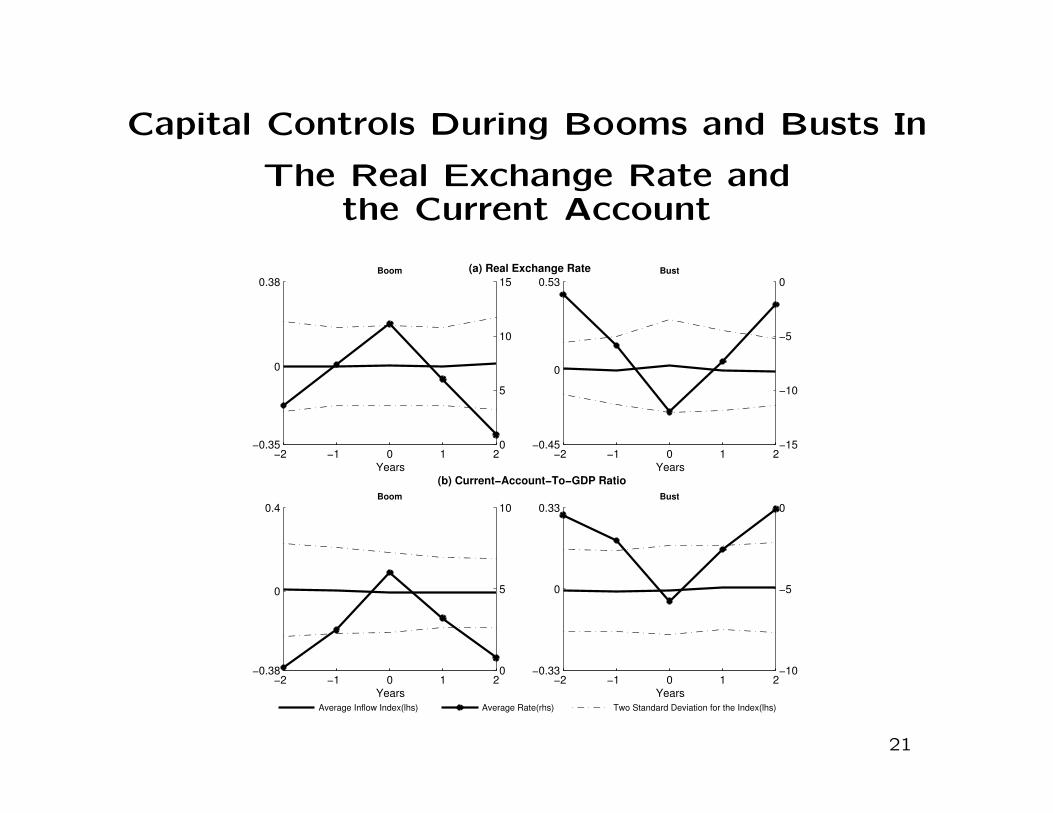
Capital Controls During Booms and Busts In
The Real Exchange Rate andthe Current Account
−2 −1 0 1 2−0.35
0
0.38
Years
Boom
0
5
10
15
−2 −1 0 1 2−0.45
0
0.53
Years
Bust
−15
−10
−5
0
−2 −1 0 1 2−0.38
0
0.4
Years
Boom
0
5
10
−2 −1 0 1 2−0.33
0
0.33
Years
Bust
−10
−5
0
Average Inflow Index(lhs) Average Rate(rhs) Two Standard Deviation for the Index(lhs)
(a) Real Exchange Rate
(b) Current−Account−To−GDP Ratio
21
Capital Controls Around the Great Contraction
• Endogeneity Problem: Some recessions may not be identi-
fied precisely because capital controls were successful at making
them not happen.
• The global recession of 2007-2009 is a useful natural experi-
ment. It originated in the United States and then spread globally.
For most countries, it was an exogenous negative shock.
• Question: Do we observe any systematic movement in cap-
ital controls across countries before, during, or after the great
contraction?
22
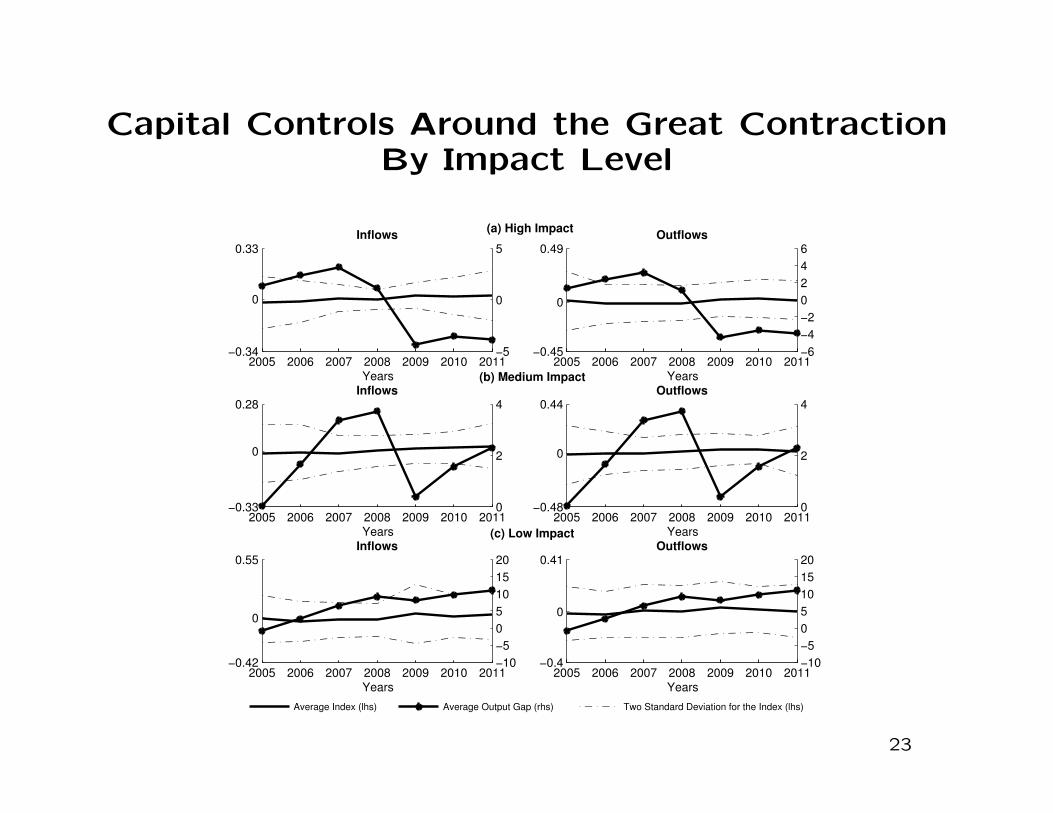
Capital Controls Around the Great ContractionBy Impact Level
2005 2006 2007 2008 2009 2010 2011−0.34
0
0.33
Years
Inflows
−5
0
5
2005 2006 2007 2008 2009 2010 2011−0.45
0
0.49
Years
Outflows
−6
−4
−2
0
2
4
6
2005 2006 2007 2008 2009 2010 2011−0.33
0
0.28
Years
Inflows
0
2
4
2005 2006 2007 2008 2009 2010 2011−0.48
0
0.44
Years
Outflows
0
2
4
2005 2006 2007 2008 2009 2010 2011−0.42
0
0.55
Years
Inflows
−10
−5
0
5
10
15
20
2005 2006 2007 2008 2009 2010 2011−0.4
0
0.41
Years
Outflows
−10
−5
0
5
10
15
20
Average Index (lhs) Average Output Gap (rhs) Two Standard Deviation for the Index (lhs)
(a) High Impact
(b) Medium Impact
(c) Low Impact
23
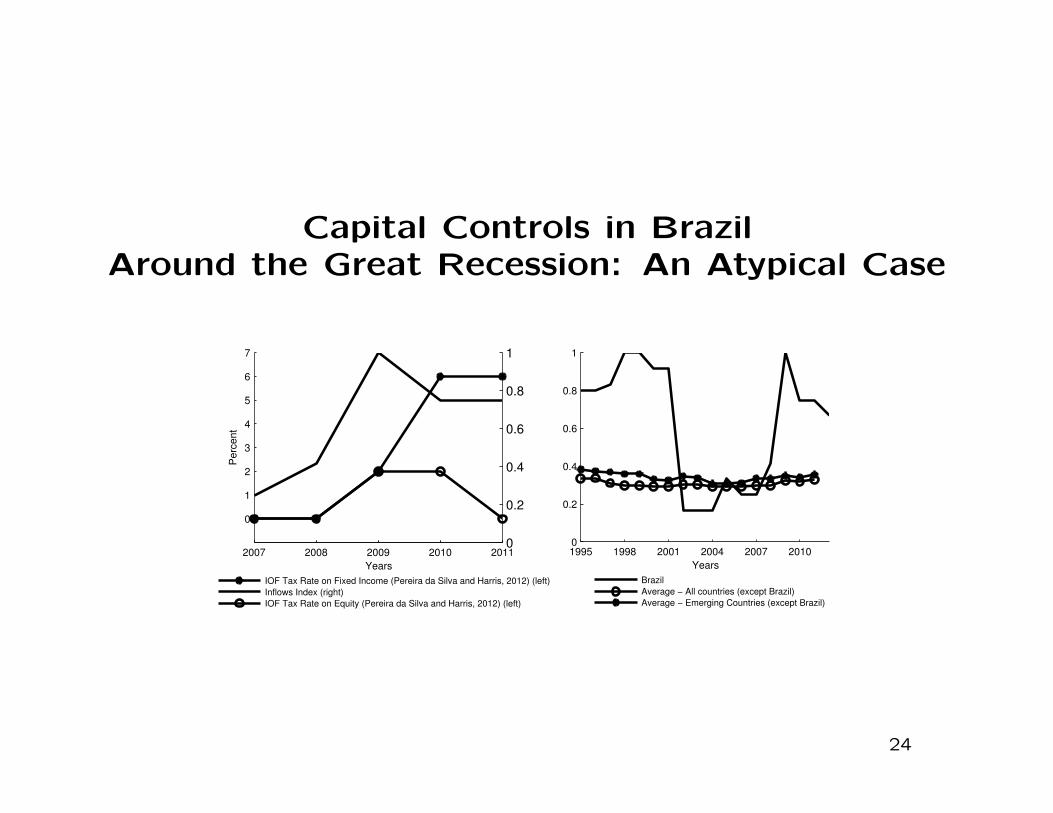
Capital Controls in BrazilAround the Great Recession: An Atypical Case
1995 1998 2001 2004 2007 20100
0.2
0.4
0.6
0.8
1
Years
Brazil
Average − All countries (except Brazil)
Average − Emerging Countries (except Brazil)
2007 2008 2009 2010 2011
0
1
2
3
4
5
6
7
Years
Perc
ent
0
0.2
0.4
0.6
0.8
1
IOF Tax Rate on Fixed Income (Pereira da Silva and Harris, 2012) (left)
Inflows Index (right)
IOF Tax Rate on Equity (Pereira da Silva and Harris, 2012) (left)
24
Observations
(1) The updated Schindler index for Brazil captures well recently
observed movements in the Brazilian IOF capital control tax,
which takes intensity into account since it measures the actual
tax rate.
(2) Brazilian capital controls around the global recession are
atypical, in the sense that they move much more markedly than
observed in the rest of the world.
25
Alternative Indices of Capital Controls and Coun-tries with Active Capital Control Policy
– The Quinn index.
– The Chinn-Ito index
• (3) Episodic Capital Controls
26
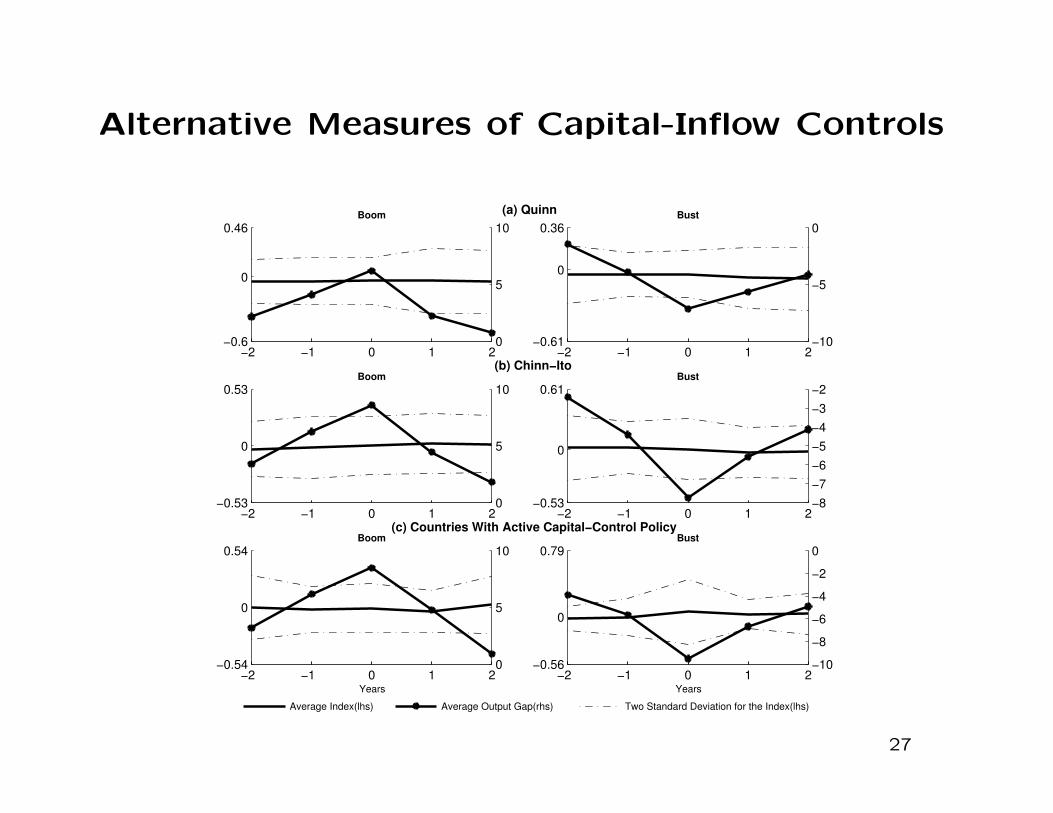
Alternative Measures of Capital-Inflow Controls
−2 −1 0 1 2−0.6
0
0.46Boom
0
5
10
−2 −1 0 1 2−0.61
0
0.36Bust
−10
−5
0
−2 −1 0 1 2−0.53
0
0.53Boom
0
5
10
−2 −1 0 1 2−0.53
0
0.61Bust
−8
−7
−6
−5
−4
−3
−2
−2 −1 0 1 2−0.54
0
0.54
Years
Boom
0
5
10
−2 −1 0 1 2−0.56
0
0.79
Years
Bust
−10
−8
−6
−4
−2
0
Average Index(lhs) Average Output Gap(rhs) Two Standard Deviation for the Index(lhs)
(a) Quinn
(b) Chinn−Ito
(c) Countries With Active Capital−Control Policy
27
Conclusion
• New theories of capital controls suggest that they should be
applied in a prudential or countercyclical fashion.
• The present empirical investigation finds that on average pol-
icymakers have not applied capital controls in ways consistent
with the new theories.
• In particular, on average capital controls are remarkably acycli-
cal.
• Two Interpretations:
(1) We are in the presence of a case of theory running ahead of
policymaking. Under this view, observed movements in capital
controls (or lack thereof) are suboptimal. As time goes by and
theories percolate policy circles, we should observe changes in
the cyclical behavior of capital controls.
(2) Policymakers know more than theorists. Under this view,
actual capital control policy may be optimal, and more feedback
from policy to theory is needed.
28