Embed Size (px)
Citation preview
Are Gold Plated Room & Board Charges Important Drivers
of College Cost?
Robert B. Archibald
College of William and Mary
David H. Feldman
College of William and Mary
College of William and Mary
Department of Economics
Working Paper Number 99
August 2010
COLLEGE OF WILLIAM AND MARY DEPARTMENT OF ECONOMICS WORKING PAPER # 99 August 2010
Are Gold Plated Room & Board Charges Important Drivers
of College Cost?
JEL Codes: I22 Keywords: Room and Board, gold plating, college cost Robert B. Archibald David H. Feldman Department of Economics Department of Economics College of William and Mary College of William and Mary Williamsburg, VA 23187-8795 Williamsburg, VA 23187-8795 [email protected] [email protected]
Are Gold Plated Room & Board
Drivers of College Cost? By Robert B. Archibald and David H. Feldman Colleges are developing a country club mentality that has little to do to think, says Leon Botstein, president of Bard College in Annandale
``There should be a more Spartan aspect to education that is more conducive to learning,'' says Botstein, 58, whose college will cost students an estimated $41,800 in the school year beginning this fall. ``You are looking at a culture driven by Hollywood and vulgarity, people who are more interested in hot tubs than in what goes on in the classroom. Are we spending on education or
There is nothing like a juicy quote and a few pictures to get the conversation
flowing, so we’ll begin with two images of dormitories on our own campus. One of the
housing options available to William and Mary sophomores, j
Dominion Hall. Figure 1 gives a schematic of the first floor of Old Dominion Hall. It was
opened in 1927, and it had its most recent full renovation in 1974. Air conditioning was
added with this renovation, but the basic footprin
typical floor in this three-storey building houses 40 students. There are two bathrooms per
floor, so each one serves roughly 20 students. The building has kitchen facilities and
lounges on all three floors.
Another option for the same students is Jamestown North. This building and its
twin (Jamestown South) were opened to students in the fall of 2006. Figure 2 shows a
Room & Board Charges Important
Drivers of College Cost?
By Robert B. Archibald and David H. Feldman
Colleges are developing a country club mentality that has little to do with acquiring knowledge and learning to think, says Leon Botstein, president of Bard College in Annandale-on-Hudson, New York.
``There should be a more Spartan aspect to education that is more conducive to learning,'' says Botstein, 58, cost students an estimated $41,800 in the school year beginning this fall. ``You are
looking at a culture driven by Hollywood and vulgarity, people who are more interested in hot tubs than in what goes on in the classroom. Are we spending on education or a cruise for entertainment?''
There is nothing like a juicy quote and a few pictures to get the conversation
flowing, so we’ll begin with two images of dormitories on our own campus. One of the
housing options available to William and Mary sophomores, juniors, and seniors is Old
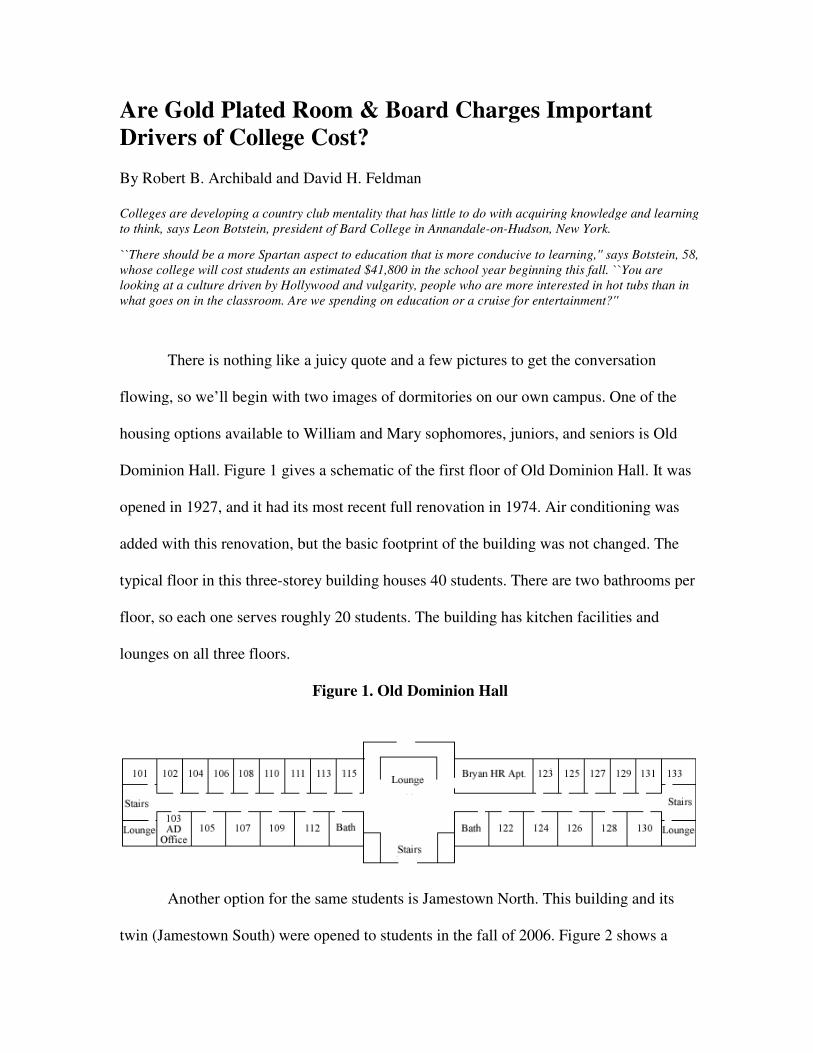
Dominion Hall. Figure 1 gives a schematic of the first floor of Old Dominion Hall. It was
opened in 1927, and it had its most recent full renovation in 1974. Air conditioning was
added with this renovation, but the basic footprint of the building was not changed. The
storey building houses 40 students. There are two bathrooms per
floor, so each one serves roughly 20 students. The building has kitchen facilities and
Figure 1. Old Dominion Hall
Another option for the same students is Jamestown North. This building and its
twin (Jamestown South) were opened to students in the fall of 2006. Figure 2 shows a
Important
with acquiring knowledge and learning Hudson, New York.
``There should be a more Spartan aspect to education that is more conducive to learning,'' says Botstein, 58, cost students an estimated $41,800 in the school year beginning this fall. ``You are
looking at a culture driven by Hollywood and vulgarity, people who are more interested in hot tubs than in a cruise for entertainment?''
There is nothing like a juicy quote and a few pictures to get the conversation
flowing, so we’ll begin with two images of dormitories on our own campus. One of the
uniors, and seniors is Old
Dominion Hall. Figure 1 gives a schematic of the first floor of Old Dominion Hall. It was
opened in 1927, and it had its most recent full renovation in 1974. Air conditioning was
t of the building was not changed. The
storey building houses 40 students. There are two bathrooms per
floor, so each one serves roughly 20 students. The building has kitchen facilities and
Another option for the same students is Jamestown North. This building and its
twin (Jamestown South) were opened to students in the fall of 2006. Figure 2 shows a
2
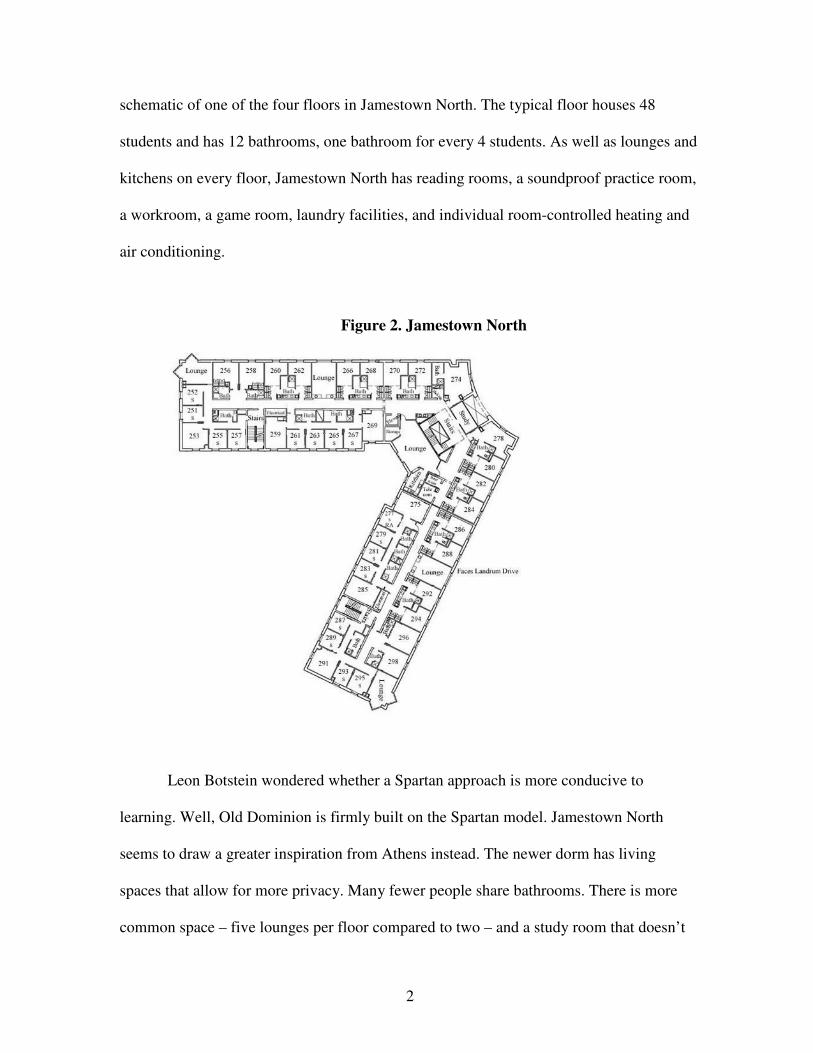
schematic of one of the four floors in Jamestown North. The typical floor houses 48
students and has 12 bathrooms, one bathroom for every 4 students. As well as lounges and
kitchens on every floor, Jamestown North has reading rooms, a soundproof practice room,
a workroom, a game room, laundry facilities, and individual room-controlled heating and
air conditioning.
Figure 2. Jamestown North
Leon Botstein wondered whether a Spartan approach is more conducive to
learning. Well, Old Dominion is firmly built on the Spartan model. Jamestown North
seems to draw a greater inspiration from Athens instead. The newer dorm has living
spaces that allow for more privacy. Many fewer people share bathrooms. There is more
common space – five lounges per floor compared to two – and a study room that doesn’t
3
exist in the older building. Students in Jamestown North also do not have to live with the
temperature set by a thermostat governing the entire floor. The college does price
dormitories differently – Jamestown North currently has a $430 premium per semester
over Old Dominion – so no student is ‘forced’ into a higher priced space. In any case,
there is an excess demand for most on-campus housing. Since the college does not let the
price rise to clear the market, this necessitates a complex lottery system to determine who
gets what space. The lottery system (which is common at universities) is evidence that
schools do not exercise all the market power that they have, so they leave potential
revenue on the table.
Like most schools, William & Mary is not shy about advertising its amenities to
potential students and their families. The web page that advertises the college’s housing
and dining options begins with “Wireless and Starbucks? Thomas Jefferson never had it
this good.” In addition to touting the “awesome amenities” of the new Jamestown
dormitories, the promotion includes such loaded language as “forget everything you think
you know about college food,” followed by tantalizing descriptions of Brazilian roast
pork, spicy arugula pasta or sushi prepared to order. Advertising of this sort is a double-
edged public relations sword. Schools clearly want to impress potential students with their
lifestyle offerings. But after descriptions like these, the college’s use of the term “spare no
expense” would seem to confirm president Botstein’s worst fears about Hollywood and
vulgarity.
What constitutes gold plating? Is the presence of arugula pasta and fresh sushi on
the college menu a dead giveaway? On this aspect of the question we will remain
steadfastly agnostic. Common descriptions of college campuses as country clubs and
4
playgrounds reflect a sense of aesthetic revulsion that the word vulgarity captures quite
well. In addition it’s very easy to find alumni who marvel at modern dormitories and at the
food services options available to today’s students, and who wonder as well if today’s
students have it too good. These are questions of taste and of values where we fear to
tread. On the other hand, there is a lot of good information available that allows us to say
something about how the living costs at colleges and universities actually have evolved
over time compared to the living costs off campus. Placing colleges and universities
squarely in the context of the overall economy offers us a useful vantage point. It allows
us to challenge some views about the college experience that have achieved iconic status
in the popular discussion of college cost.
Let us start by putting room & board charges in the context of the whole price of a
year of college for students who live on campus and who use the university food service.
For our own school, an out-of-state student arriving in the late summer of 1960 would
have faced a tuition bill of $722 and room & board expenses of $782. Room & board
charges actually exceeded tuition. A similar student enrolling for the 2009-2010 academic
year paid $30,964 in tuition, but only $9,018 in room & board charges, presuming they
lived in an “average” dorm, but purchased the most extensive (and expensive) meal plan.
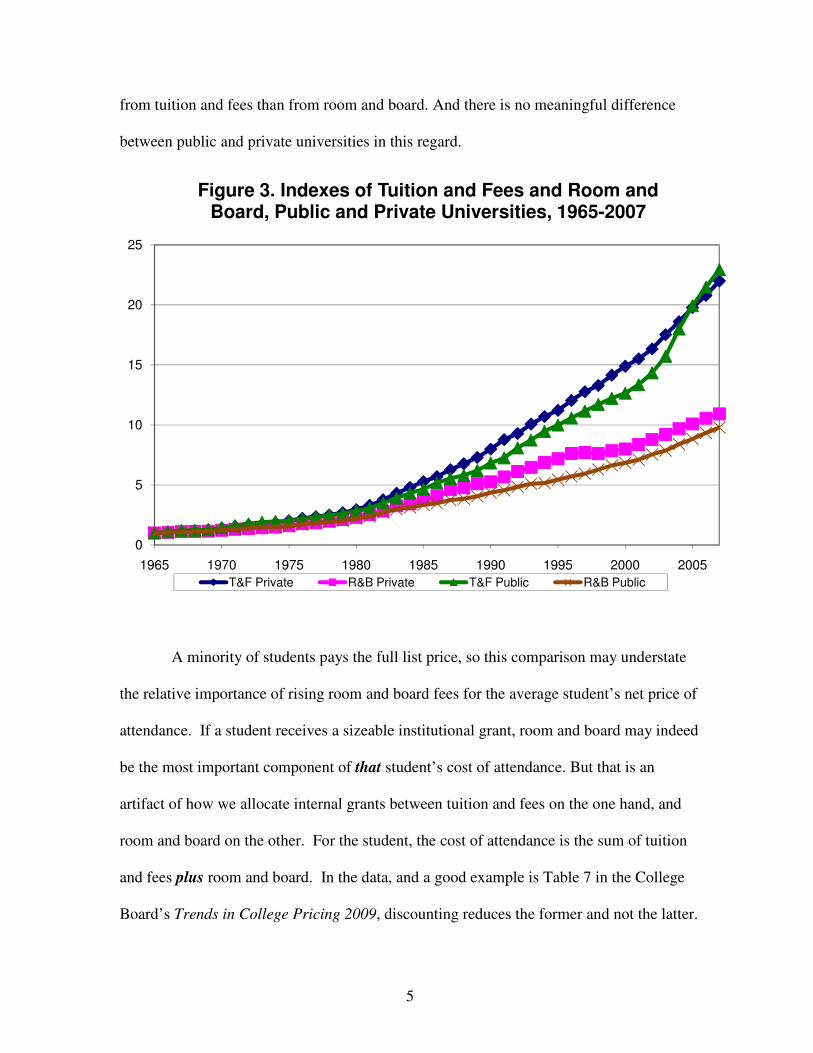
The national data tell a similar story. The points in Figure 3 are index numbers set
equal to 1.00 in 1965. The entries tell us the increase in list-price tuition and fees and the
increase in room and board relative to 1965. List price tuition and fees have increased by a
factor of 22 (private) or 23 (public) between 1965 and 2007, while room and board
charges have increased only by a factor of 10 or 11. If you want to look for a smoking gun
that explains the rise in the list price of college attendance, you’ll find more powder burns
5
from tuition and fees than from room and board. And there is no meaningful difference
between public and private universities in this regard.
A minority of students pays the full list price, so this comparison may understate
the relative importance of rising room and board fees for the average student’s net price of
attendance. If a student receives a sizeable institutional grant, room and board may indeed
be the most important component of that student’s cost of attendance. But that is an
artifact of how we allocate internal grants between tuition and fees on the one hand, and
room and board on the other. For the student, the cost of attendance is the sum of tuition
and fees plus room and board. In the data, and a good example is Table 7 in the College
Board’s Trends in College Pricing 2009, discounting reduces the former and not the latter.
0
5
10
15
20
25
1965 1970 1975 1980 1985 1990 1995 2000 2005
Figure 3. Indexes of Tuition and Fees and Room and Board, Public and Private Universities, 1965-2007
T&F Private R&B Private T&F Public R&B Public
6
These data thus ignore the fact that the student is buying an aggregate product, and the
allocation of the grant award among the two is only an accounting issue. For this reason
we do not think it is sensible to compare net tuition, as it is typically measured, with list
price charges for room and board. Also, for students who do not receive any financial aid,
the list price numbers are real prices.
Despite the fact that the costs of providing room and board have not increased as
rapidly as list price tuition and fees, some people clearly think that they have gone up
more than they should have. “Too much,” and “should have,” sound terribly subjective,
but this doesn’t have to be the case. There are numerous price indexes that tell us what has
happened to the price of comparable housing and food in the economy at large. If the price
of college housing and college meal plans have risen much more than these price indexes
suggest, perhaps the increases in dormitory and/or dining costs on campus have been
excessive.
Gold Plated Dormitories?
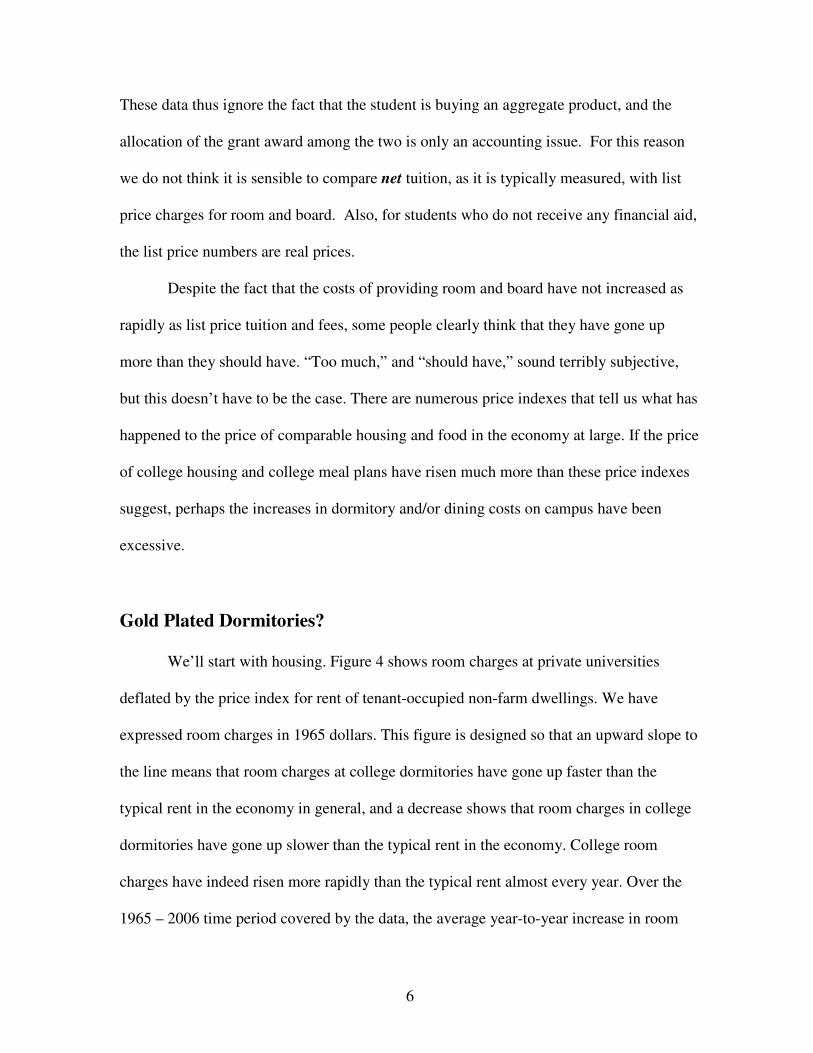
We’ll start with housing. Figure 4 shows room charges at private universities
deflated by the price index for rent of tenant-occupied non-farm dwellings. We have
expressed room charges in 1965 dollars. This figure is designed so that an upward slope to
the line means that room charges at college dormitories have gone up faster than the
typical rent in the economy in general, and a decrease shows that room charges in college
dormitories have gone up slower than the typical rent in the economy. College room
charges have indeed risen more rapidly than the typical rent almost every year. Over the
1965 – 2006 time period covered by the data, the average year-to-year increase in room
7
charges at private universities is 6.46 percent. The average year-to-year increase in the
price index for tenant-occupied non-farm dwellings is 4.37 percent. This difference causes
the decided upward slope in Figure 4. As Figure 3 suggests, a corresponding diagram for
room charges at public universities likely would tell a similar story.
If you stop the analysis at this point, a reasonable person could be persuaded that
this information nails down the case against colleges and universities? Dorm fees are
going up faster than the nearest competitor in the private economy (apartment rents). And,
since the dorm fees are just designed to cover costs, colleges and universities must be
making dorms much too fancy. This conclusion is several steps too fast. We need to
consider two important points.
0
100
200
300
400
500
600
700
800
900
1000
1965 1970 1975 1980 1985 1990 1995 2000 2005
Figure 4. Room Charges at Private Universities Deflated by the Price Index for Rent of Tenant-
Occupied Nonfarm Dwellings, 1965 Dollars, 1965-2006
8
First, there is a significant measurement issue involved in the comparison in Figure
4. The information on dormitory prices reported to the Department of Education is the
charge for the typical room on campus. There is no attempt to correct for changes in the
characteristics of the typical room. As new dorms are brought on line and old dorms are
renovated – which adds amenities such as air conditioning, elevators, and extra lounges –
the characteristics of the typical room change. Part of the increase in the charge for the
typical room on campus reflects the increase in the quality of the room, and part of the
increase in the charge reflects pure price increase.
The issue, of course, is whether or not the quality improvements in college
dormitories are excessive or not, and you cannot know this by comparing the price
increase of the “average” dorm experience to the price increase of the “average”
apartment. The reason is that when these same types of quality improvements occur in the
general housing stock, the government statisticians correct the data for the rent of tenant-
occupied non-farm dwellings to account for the changes in quality. The only part of the
increase in rents that is reflected in the price index is a measure of the pure price increase.
The effect of the quality improvements on the price is eliminated. In the private market
quality improvements generally are regarded with less suspicion, and the price index is
designed to measure just pure price inflation.
Quality correcting a price series is a very difficult task, and there are those who
think that the quality corrections are imperfect. Yet the numbers for apartment rents are
quality corrected while the Department of Education numbers for dormitory charges are
not. In plain language, if the square footage of the average apartment rises over time the
price index will be scaled back to reflect the fact that the price increase is actually buying
9
you something of importance (more square feet of living space). The college dorm price is
not scaled back to reflect quality improvement in dormitories, so the index of dorm prices
automatically rises faster than the index of apartment rent. Apple meets orange. The
mismatch between the two prices series distorts the comparison.
The lack of any correction for quality change in dormitory charges overstates the
extent to which these charges are rising more rapidly than the overall rents in the larger
economy. We cannot be sure how important this factor is, but clearly some of the increase
in dormitory rents is caused by quality change, or we would not be talking about gold
plating, and this part of the increase in rents should be eliminated before the data on
dormitory rents are compared to a quality corrected price index of apartments. If we had
sufficient information to quality correct the data on dormitory rents, we might find that
they behaved very similarly to other quality-adjusted rents. At the very least, we can say
that the line in Figure 4 would not have quite as steep an upward slope.
The second part of the story is related. We think that colleges and universities have
increased the quality of their living options in an attempt to keep pace with what is
happening to housing in general. Some will argue that this represents bad judgment on the
part of colleges and universities; that the dormitory of the 1960s or 1970s should be just
fine for today’s college student. The difficulty with this normative argument is that it
ignores what has happened to the houses and apartments that today’s college students call
home.
As economic growth has pushed up the standard of living the average size of
houses and the amenities included in those houses have risen. In addition, the average size
of a family has decreased. The result is that the average number of square feet of living
10
space per person has risen substantially. The amenities contained within this housing stock
have also improved dramatically over the years. These changes put pressures on colleges
and universities. There is a comfort zone that defines a range of acceptable college
housing for a student, and this zone likely includes some territory that is lower in quality
than the housing the student has at home. As the quality of the housing students come
from and the quality of the off-campus housing options available to them go up, a college
or university has to update its dormitories to keep students in their comfort zone. A school
that kept the quality of its residential options stagnant would not be doing a good job.
Unless it was isolated geographically (and willing to exercise its local monopoly), such a
school eventually could have difficulty filling its dormitories, or its first year class.
The comparison can be made less abstract. There is a lot of evidence about the
rising quality of the U.S. housing stock. Data from the Census Bureau on the average size
of a newly constructed single-family house are startling. In 1973 the average size of newly
constructed single family home was 1,660 square feet. In 2009 the average size was 2,438
square feet, so the average newly constructed house was almost fifty percent larger. At the
same time the average household size was decreasing by almost half a person. Data from
the Census Bureau indicate that the average household had 3.01 people in 1973 and that
number had decreased to 2.57 in 2009. The result is that fewer people are living in the
average house at the same time the average house is getting bigger. The effects are large.
As a result of the increase in the size of houses and a decrease in the average household
size, the average square footage of living space per person in a newly constructed house
almost doubled, from 551.5 square feet in 1973 to 948.6 square feet in 2009.
11
There exists no real data on how basic amenities of dormitories have evolved over
time, so we can’t really compare in any thorough way the quality upgrade in the market
for homes and apartments to what has happened on college campuses. Nonetheless the
simple anecdote of Jamestown North versus Old Dominion gives the flavor of such a
comparison. The square footage of room and common space available to each student in
Old Dominion with its 1920’s floor plan is roughly 214. A student with a lucky lottery
number who chooses Jamestown North enjoys a more spacious 265 square feet per
student. Besides being substantially less than what is available to the average single-
family home dweller, this is not even as large a percentage change as in the market for
newly constructed homes over the 1973-2009 time period.
Not only are new houses bigger in 2009 than they were in 1973, but they have
more amenities. In 1973, 49 percent of the newly constructed single-family homes had
central air conditioning. By 2009 that percentage had risen to 88 percent. In 1973, 22
percent of the newly constructed single-family homes had no garage or carport. By 2006
that percentage had decreased to 12 percent. Finally, in 1973 40 percent of the newly
constructed single-family homes had 1.5 or fewer bathrooms. By 2009 that percentage had
decreased to a mere 8 percent.
Of course the current statistics on newly constructed single-family homes
overstates the change in the characteristics of the overall housing stock. Many people live
in houses that are nowhere close to being new, just like many students live in dorms like
Old Dominion. Yet the housing stock does turn over, and older dwellings are renovated.
Concerning the turnover of the housing stock, data from the 2000 census of housing
indicated that 51.3 percent of the total housing stock was constructed in 1970 or thereafter,
12
and 17 percent was constructed between 1990 and 2000. On average, the homes that
college students are coming today from are much more spacious, and much more lavishly
appointed than the homes their parents lived in when they went off to college.
One should never divorce what is taking place on college campuses from the
broader economic environment. The standard of living today for the average American is
substantially higher than in the recent past. Real income per capita in 2008, for instance,
was 2.8 times higher than in 1960. This difference is profound, and any understanding of
gold plating in college amenities that does not begin from that basic fact may easily
wander into finger-wagging moralizing.
The gold plating of college housing and dining options sometimes is presented as a
wasteful competitive arms race among schools. In this telling, each institution is
concerned primarily with its position in the Peterson’s Guide hierarchy and the absolute
quality of the service it provides is a side issue. Arms races are about relative position. If
falling behind, even by just a little, creates great damage then people in an arms race may
be willing to spend large amounts to stay where they are in the pecking order. An arms
race story would suggest that College A’s motive for improving its amenities is wholly
defensive, namely the fear that College B will improve its ranking at A’s expense. The
social value produced by all that spending may be quite low, yet the schools involved
simply cannot help themselves. A key part of an arm race story is the idea that a treaty that
halted the arms race would leave all parties better off, including the students who are the
ultimate consumer.
Again, we are skeptics. Our explanation for quality upgrading on college campuses
does not fit this format. We argue that the quality characteristics of college dormitories are
13
formed in large part by the expectations of students and their families. These expectations
are driven by rising overall living standards in the economy. This is the same force that
has also led to substantial improvements in the characteristics of the overall housing stock.
People are free to believe that the same gold plating is at work in the rising quality of the
average American house or apartment, but this moves us into the ethics of consumer
choice and takes us far away from the rising cost of higher education. In many places
college dormitories must compete with off-campus housing options, which have improved
in response to market demand.
Dormitories do face competition with the dormitories at other colleges and
universities, but this competition seems driven largely by consumer expectations and not
by any arms race dynamics. We suspect that a treaty to call off improvements in college
dormitories would not leave everyone better off, even if it succeeded in reducing dorm
costs. The public may well value the potential dorm improvements more than the extra
cost that they entail, and the rising quality available in the private market is strong
evidence for that position. Even supposing such a treaty could be made to stand, the most
likely outcome is that eventually colleges would have trouble filling their dormitories as
students migrated off campus to housing options in their comfort zone. The real market for
student housing is much more complex than the competition described by a positional
arms race.
We cannot say that all amenities are warranted, or that no subset of the higher
education market engages in socially costly amenity competitions that needlessly push up
costs of attendance. Perhaps president Botstein’s Bard College is among the offenders.
One cannot prove that there is no gold plating of dormitories. What we can be sure of is
14
that the comparison suggested by Figure 4 very much overstates any problem. There is no
good evidence that the quality of dormitory rooms has increased any more rapidly than the
quality of the overall housing stock. In the end, putting together the fact that charges for
tuition and fees has risen much more rapidly than the room and board charges and the fact
that much of the reason for increases in room charges can be traced to increases in quality
expected by students, we see no reason to think that exorbitant charges for housing are a
large part of the story of rising college cost.
Gold Plated Meal Plans?
We now turn to the case of arugula pasta and fresh sushi. Like most services, the
price of a meal plan has risen faster than the overall inflation rate. Yet as in the case of
housing, if we want a meaningful comparison we must relate meal charges at colleges and
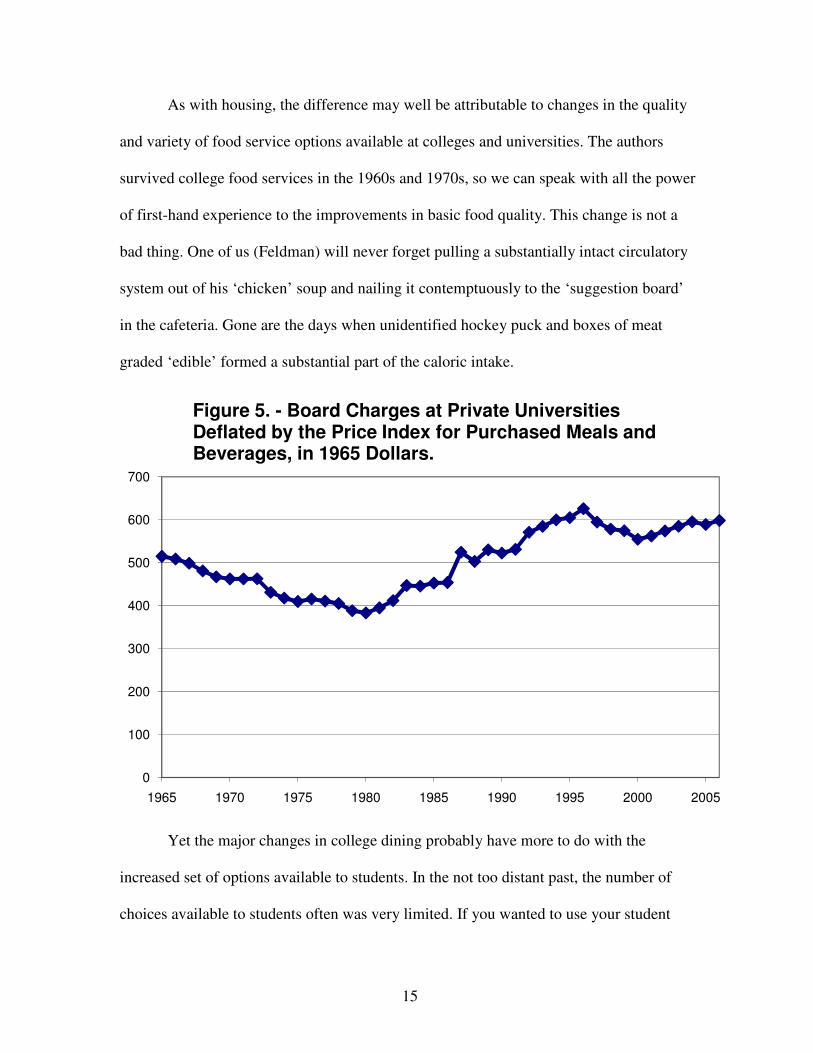
universities to their closest relation in the private market. Figure 5 shows board charges
for private universities deflated by the price index for purchased meals and beverages.
Again the story for meal charges at public universities would be very similar. While the
line in Figure 4 for room charges was almost always upward sloping, the line in this figure
shows periods of decrease as well as increase. Overall there is a small rise, so meal
charges at schools did, on average, increase more rapidly than the price of purchased
meals and beverages in the market. Still, the difference in the rate of increase was not
large. The average year-to-year change in the price index for purchased meals and
beverages was 4.66 percent from 1965 to 2006. This is just slightly lower than the average
year-to-year change in meal charges at private universities of 5.02 percent.
15
As with housing, the difference may well be attributable to changes in the quality
and variety of food service options available at colleges and universities. The authors
survived college food services in the 1960s and 1970s, so we can speak with all the power
of first-hand experience to the improvements in basic food quality. This change is not a
bad thing. One of us (Feldman) will never forget pulling a substantially intact circulatory
system out of his ‘chicken’ soup and nailing it contemptuously to the ‘suggestion board’
in the cafeteria. Gone are the days when unidentified hockey puck and boxes of meat
graded ‘edible’ formed a substantial part of the caloric intake.
Yet the major changes in college dining probably have more to do with the
increased set of options available to students. In the not too distant past, the number of
choices available to students often was very limited. If you wanted to use your student
0
100
200
300
400
500
600
700
1965 1970 1975 1980 1985 1990 1995 2000 2005
Figure 5. - Board Charges at Private Universities Deflated by the Price Index for Purchased Meals and Beverages, in 1965 Dollars.
16
meal plan, you were restricted to what they happened to serve in the cafeteria or dining
hall. Often that meant just one option in the dining hall and only two or three options in
the cafeteria. One of us (Archibald) remembers his time as a ‘waiter’ in a small dining hall
in a women’s dormitory. When the following evening was ‘liver night’ the students were
polled to determine how many would show up … so much for options. Those days are
long gone. Even students who attend fairly small institutions have many choices.
Increasing the variety available to students likely adds to cost, and this could easily
explain the small difference between the rate of increase of college meal plans and the rate
of increase in the national price index of purchased meals and beverages.
This is exactly the same issue we pointed out earlier when we compared
dormitory charges with rents in the private market. The index for rent and the index for
purchased meals and beverages are adjusted for quality change. The statisticians who track
prices in the overall economy are attempting to measure the price of a constant quality
bundle of services. On the other hand the data for meal charges at universities is not
corrected for quality change. These data simply measure the price of purchasing a meal
plan, and part of the price of a meal plan will reflect the costs of providing more options.
If the price of meal plans had been corrected for quality change, the line in Figure 5 might
not show any increase at all in college food costs relative to the national index for
purchased meals.
There are other parallels to the discussion of housing. We argued that college
housing at any particular school competes with college housing at other institutions, with
the expectations of the students based on the housing they are coming from, and with the
off-campus options that are available in their area. Meal plans have the same three
17
competitors. The decision to attend one college over another could be affected by a
comparison of the quality of the food services, but that is likely to be very far down the list
of concerns. And that competition likely has little to do with a wasteful positional arms
race. Also, students probably have a comfort zone for food, and the competition is not just
mom’s (or dad’s) cooking. The average family consumes a significant number of
restaurant meals, so that forms part of the comparison that families make in deciding what
is acceptable. Finally, college meal plans compete with off campus eating options.
Colleges and universities have to keep their food attractive to their students, or they will
all go off campus to eat. Few students will tell you that the meal plans at their school are
beating the outside competition soundly. At most colleges and universities, the three big
advantages that the college cafeterias have over the competition is the same advantage the
dormitories have – location, location, location. These are big advantages, but they can be
overcome if the quality of what is offered is too low.
Conclusion: The Real Cost Drivers
The message of figure 3 is that tuition and fees are more of a driver of the total list
price of a year in college than are the ancillary expenses like room and board. Yet both are
rising faster than inflation, and this allows us to make a broader point about college cost
and price. Like higher education itself, housing and food plans are both services.
Services tend to go up in price more rapidly than manufactured goods since productivity
increases are harder to come by in most service industries. This is the well-known ‘cost
disease’ phenomenon, and it afflicts housing and food services in the private sector as well
as at colleges and universities. What we have argued is that in the case of room and
18
board, the “disease” is no more pernicious at colleges and universities than it is elsewhere
in the economy.
Why then are the educational costs rising so much? This is an important topic we
take up in our recent book, Why Does College Cost so Much? Here we will offer only the
briefest summary. There is a technological trio of forces driving educational costs
upward. The first is indeed cost disease, which we argue is the dominant long-term engine
of cost growth in higher education and in most other personal services. All of the
industries whose costs behave similarly to higher education are service industries, and this
is not a coincidence.
The second technological force is actually the most important one in explaining
why educational expenses have soared since the early 1980s. Beginning in the late 1970s
the incomes of the well educated began to outrace the incomes of the less well educated.
The reasons for this are complex, and the literature is vast. But recent work by Claudia
Goldin and Lawrence Katz (2008) offers perhaps the most persuasive general argument,
and one rooted in technological change. As they tell the story, the rapid growth in wages
of the highly educated results from a race between two forces, technological progress that
pushes up the demand for highly educated labor, and educational attainment, which
augments the supply. For much of the 20th century the race was won by supply, and by
the middle of the century the college wage premium was at its low point. But starting in
the late 1970s educational attainment stagnated, while the computer revolution continued
the upward process of raising the demand for labor whose stock of human capital
contained more and more years of formal schooling.
19
As a result, all service industries that use highly educated labor intensively began
to experience rapid cost growth. Higher education is not unique in facing both cost disease
and the rising cost of a highly educated work force. The same forces affect other
important personal service industries, including dental services, legal services, and the
services of hospitals and physicians, to name a few, all of which have experienced cost
pressures very similar to the higher education industry.
The final force pushing up educational costs is the direct impact of new technology
on what higher education actually produces. Technological change always has two
possible effects on an industry. New techniques can reduce the cost of making the same
old thing. Alternatively, new ways can improve the quality of what we do or they can
make the product or service we provide different from the older version in ways that
benefit the buyer. Technology has transformed many important services in recent years,
including higher education and medicine. Technological changes in higher education have
been largely cost increasing, driven by the needs of students and employers in the
contemporary labor market. In plain language, our product is different today in important
ways, and being up-to-date has raised cost.
There is an important difference between our earlier analysis of the evolution of
room and board costs and what we have just said about the costs of providing the
education itself. For room and board costs we clearly recognized that the quality of
dormitory rooms and cafeteria meals have increased in demonstrable ways. We make a
different and less expansive claim about the cost of the education colleges and universities
provide. We do not argue that today’s education is better than what prior generations of
students received, only that is it different in ways that make it more expensive to produce.
20
Today’s education uses advanced technology throughout the campus, not just in the
complex laboratory equipment used in the sciences. A contemporary education also takes
the IT consultants and qualified technicians needed to run and to maintain the university’s
more complex systems and capital. This equipment and these systems are expensive to
obtain and to maintain. Colleges and universities that ignore the changing world around
them risk committing a form of educational malpractice. We make no claim that today’s
graduates are better in some absolute sense than the graduates of the past. We remain
steadfastly agnostic about the quality of the education provided. Our claim is only that
providing a modern up-to-date education is more expensive.
The Last Word
In looking at how room and board expenses affect the average cost of attendance
we have not uncovered any smoking guns. Charges for these important optional fees have
indeed gone up somewhat more rapidly than the relevant price indexes for similar services
in the broader economy. But when we recognize that the indexes for apartments and for
food in the private economy are adjusted for changes in quality, most or all of that
difference evaporates. There is not much to the idea that gold plating is a substantial force
driving up room and board charges, unless one wishes to argue that modern apartments
and contemporary restaurant services also are needlessly gold plated. That is a value
judgment we steadfastly refuse to make.
21
References Cited
Archibald, Robert B. and David H. Feldman, Why Does College Cost So Much? (Oxford University Press, 2011). Goldin, Claudia and Lawrence Katz, The Race Between Education and Technology, (Harvard University Press, 2008). National Association of Home Builders, U.S. Census Bureau, http://www.census.gov/population/socdemo/hh-fam/hh4.xls U.S. Census Bureau, http://www.census.gov/const/www/charindex.html#singlecomplete U. S. Department of Education, Digest of Educational Statistics 2005, Table 312, page 510-512. Willen, Liz, “U.S. Colleges Get Swanky: Golf Courses, Climbing Walls, Saunas, Bloomberg.com, June 14, 2005, http://www.bloomberg.com/apps/news?pid=newsarchive&sid=aMJLUNQEijjA&refer=us