Embed Size (px)
Citation preview
158
American Economic Journal: Applied Economics 3 (July 2011): 158–187http://www.aeaweb.org/articles.php?doi=10.1257/app.3.3.158
At nine months old, there are no detectable cognitive differences between black and white babies (Fryer and Steven D. Levitt forthcoming). Differences
emerge as early as age two, and by the time black children enter kindergarten they lag whites by 0.64 standard deviations in math and 0.40 in reading (Fryer and Levitt 2004). On every subject at every grade level, there are large achievement differ-ences between blacks and whites that continue to grow as children progress through school (for example, see Jay R. Campbell, Catherine M. Hombo, and John Mazzeo 2000; Derek Neal 2006; Fryer 2011). Even accounting for a host of background factors, the achievement gap remains large and statistically significant (Christopher Jencks and Meredith Phillips 1998; Fryer 2011).
There have been many attempts to close the achievement gap. Early childhood interventions such as Head Start, Nurse-Family Partnership, and the Abecedarian Project boost kindergarten readiness, but the effects on achievement often fade once
* Dobbie: Public Policy Doctoral Program, Harvard University Kennedy School of Government, 44 Brattle Street, 5th Floor, Cambridge, MA 02138 (e-mail: [email protected]); Fryer: Department of Economics, Harvard University, 44 Brattle Street, 5th Floor, Cambridge, MA 02138, and the Education Innovation Laboratory at Harvard University (EdLabs) and National Bureau of Economic Research (e-mail: [email protected]). We are extraordinarily grateful to Geoffrey Canada, Betina Jean-Louis, Bessie Wilkerson, Joel Klein, Jennifer Bell-Ellwanger, Joanna Cannon, Aparna Prasad, Gavin Samms, and Scott Walker for their endless cooperation in col-lecting the data necessary to perform our analysis and for hours of discussions and comments. Eduard Bogel, Vilsa E. Curto, Peter Evangelaki, and Jonathan Scherr provided exceptional research assistance. Support from the Eli and Edythe Broad Foundation, through EdLabs, is gratefully acknowledged. The usual caveat applies.
† To comment on this article in the online discussion forum, or to view additional materials, visit the article page at http://www.aeaweb.org/articles.php?doi=10.1257/app.3.3.158.
Are High-Quality Schools Enough to Increase Achievement Among the Poor?
Evidence from the Harlem Children’s Zone†
By Will Dobbie and Roland G. Fryer, Jr.*
Harlem Children’s Zone (HCZ), an ambitious social experiment, combines community programs with charter schools. We provide the first empirical test of the causal impact of HCZ charters on educa-tional outcomes. Both lottery and instrumental variable identifica-tion strategies suggest that the effects of attending an HCZ middle school are enough to close the black-white achievement gap in math-ematics. The effects in elementary school are large enough to close the racial achievement gap in both mathematics and ELA. We con-clude with evidence that suggests high-quality schools are enough to significantly increase academic achievement among the poor. Community programs appear neither necessary nor sufficient. (JEL H75, I21, I28, J13, R23)
ContentsAre High-Quality Schools Enough to Increase Achievement Among the Poor? Evidence from the Harlem Children’s Zone† 158
I. Harlem’s Children Zone 161II. Data and Research Design 163III. The Impact of the Promise Academy Charter Schools on Student Achievement 170A. Promise Academy in HCZ–Middle School 170B. Promise Academy–Elementary School 173IV. Communities, Schools, or Both? 176V. Discussion 179Appendix 181References 185
VoL. 3 No. 3 159DoBBiE AND FryEr: THE HArLEM CHiLDrEN’S ZoNE
children enter school (Janet Currie and Duncan Thomas 1995; David Olds 2006; Fryer 2011).1 More aggressive strategies that place disadvantaged students in better schools through busing (Joshua D. Angrist and Kevin Lang 2004) and school choice plans (Ceclia Elena Rouse 1998; Alan B. Krueger and Pei Zhu 2004; Julie Berry Cullen, Brian A. Jacob, and Levitt 2005; Justine S. Hastings, Thomas J. Kane, and Douglas O. Staiger 2006) have also left the racial achievement gap essentially unchanged. There are several successful charter schools and charter-management organizations, but the bulk of the evidence finds only modest success (Caroline Hoxby and Jonah Rockoff 2004; Eric A. Hanushek et al. 2005; Hoxby and Sonali Murarka 2009; Gleason et al. 2010). Even the most reform minded districts have not been able to substantially reduce the achievement gap (Fryer 2011).2
The lack of progress has fed into a long-standing and rancorous debate among scholars, policymakers, and practitioners as to whether schools alone can close the achievement gap, or whether the challenges children bring to school are too much for even the best educators to overcome. Proponents of the school-centered approach refer to anecdotes of excellence in particular schools or examples of other countries where poor children in superior schools outperform average Americans (Karin Chenoweth 2007). Advocates of the community-focused approach argue that teachers and school administrators are dealing with issues that originate out-side the classroom, citing research that shows racial and socioeconomic achieve-ment gaps are present before children enter school (Fryer and Levitt 2004, 2006) and that one-third to one-half of the gap can be explained by family-environment indicators (Meredith Phillips, James Crouse, and John Ralph 1998; Fryer and Levitt 2004). In this scenario, combating poverty and having more constructive out-of-school time may lead to better and more-focused instruction in school. Indeed, James S. Coleman et al. (1966), in their famous report on equality of edu-cational opportunity, argue that schools alone cannot treat the problem of chronic underachievement in urban schools.
HCZ is a 97-block area in Harlem (a neighborhood in the New York City bor-ough of Manhattan) that combines “No Excuses” charter schools with a web of community services designed to ensure the social environment outside of school is positive and supportive for children from birth to college graduation.3 This provides a rich laboratory to understand whether communities, schools, or a combination of
1 There is some evidence that Head Start, Perry Preschool, and Nurse-Family Partnership may have positive long-term impacts on outcomes such as crime, high school graduation, and labor-market outcomes (Currie and Thomas 2000; Jens Ludwig and Douglas L. Miller 2007; Olds 2006; David Deming 2009).
2 Strategies in these districts include smaller schools and classrooms (Charles M. Achilles et al. 1993; Barbara A. Nye et al. 1995; Krueger 1999; Krueger and Diane M. Whitmore 2001; Christopher Jepsen and Steven Rivkin 2002), mandatory summer school (Jacob and Lars Lefgren 2004) merit pay for principals, teachers, and students (Michael J. Podgursky and Matthew G. Springer 2007; Fryer 2010a, 2010b), after-school programs (Patricia A. Lauer et al. 2006; Zakia Redd et al. 2002), budget, curricula, and assessment reorganization (Geoffrey D. Borman and Gina M. Hewes 2004; Borman et al. 2007; Thomas D. Cook, H. David Hunt, and Robert F. Murphy 2000), and policies to lower the barrier to teaching via alternative paths to accreditation (Paul T. Decker, Daniel P. Mayer, and Steven Glaserman 2004; Kane, Rockoff, and Staiger 2008).
3 While definitions vary, “No Excuses” schools typically allow the principal considerable administrative free-dom, set measurable goals that are regularly tested using interim assessments, emphasize parent participation, and create a culture of universal achievement that make no excuses based on the students’ background (Samuel Casey Carter 2000). The KIPP (Knowledge is Power Program) or Achievement First charter networks typify the “No Excuses” model.
160 AMEriCAN ECoNoMiC JourNAL: APPLiED ECoNoMiCS JuLy 2011
the two are the main drivers of student achievement. The answer to this question is of tremendous importance for global public policy as it goes to the heart of how communities and public goods should be allocated to alleviate racial and economic inequality. Many organizations around the world—from Houston to Hungary—are developing plans similar to the HCZ model. Currently, these initiatives focus on replicating HCZ’s community programs.
To account for the fact that students who attend the Promise Academy charter schools in HCZ may not be a random sample, we exploit the fact that the Promise Academy is required to select students by lottery when the number of applicants exceeds the number of available slots for admission. The treatment group is com-posed of students who are lottery winners and the control group consists of students who are lottery losers. This allows us to provide a set of causal estimates of the effect of being offered admission into the Promise Academy on a range of outcomes, including test scores, attendance, and grade completion.
Our lottery identification strategy has important caveats. Lottery files are not available for the first middle school cohort or the most recent elementary or middle school cohorts, and the Promise Academy elementary school was not significantly oversubscribed in its first year, making it difficult to estimate the effect of being offered admission for this cohort. To complement the lotteries, our second identi-fication strategy uses the interaction between a student’s cohort year and whether she lives inside or outside of the Zone’s boundaries as an instrumental variable. This approach takes advantage of two important features of the Promise Academy: anyone is eligible to enroll in the schools, but only students living inside HCZ are actively recruited by HCZ staff; and there are cohorts of children that are ineli-gible due to the timing of the schools’ opening and their age. Our identification is driven by the between-cohort comparison of outcomes within the Zone, using the outcomes of children outside the Zone to control for natural year-to-year variation in test scores. If the interaction between a student’s address and cohort only affects his or her achievement through its effect on enrollment in the charter school, this provides another set of causal estimates.
Both statistical approaches lead us to the same conclusion. The Promise Academy charter schools in HCZ are effective at increasing the achievement of the poorest minority children. Students who enroll in the middle school gain about 0.2 standard deviations in math per year. Taken at face value, these effects are enough to close the black-white achievement gap in mathematics by ninth grade. Students in the Promise Academy elementary school gain approximately 0.2 stan-dard deviations in both math and English Language Arts (ELA) per year, closing the racial achievement gap in both subjects by third grade. These results are robust across identification strategies, model specifications, and subsamples of the data. Students with higher previous test scores benefit more from attending the Promise Academy middle school than other students, but there are no other differences among subsamples.
There are two pieces of evidence that, taken together, suggest that high quality schools are enough to significantly increase the achievement of poor minority students (see also Atila Abdulkadiroglu et al. 2009 and Angrist et al. 2010). First, students who live outside the Zone garner the same benefit from attending the Promise Academy as

VoL. 3 No. 3 161DoBBiE AND FryEr: THE HArLEM CHiLDrEN’S ZoNE
the students inside the Zone, suggesting that proximity to the community programs is not important. Second, siblings of Promise Academy students who have access to the same community programs but were ineligible for the Promise Academy because of their age show no detectable gains in achievement.
The paper is structured as follows. Section I provides a brief overview of Harlem Children’s Zone. Section II introduces the data and our research design. Section III presents estimates of the impact of attending Promise Academy middle and elementary schools on educational outcomes. Section IV discusses whether communities, schools, or both are most responsible for the results. Section V concludes. There are three online Appendices: Appendix A outlines each program offered by Harlem Children’s Zone; Appendix B is a data Appendix that details our sample and variable construc-tion; and Appendix C conducts a back-of-the-envelope cost-benefit calculation.
I. Harlem’s Children Zone
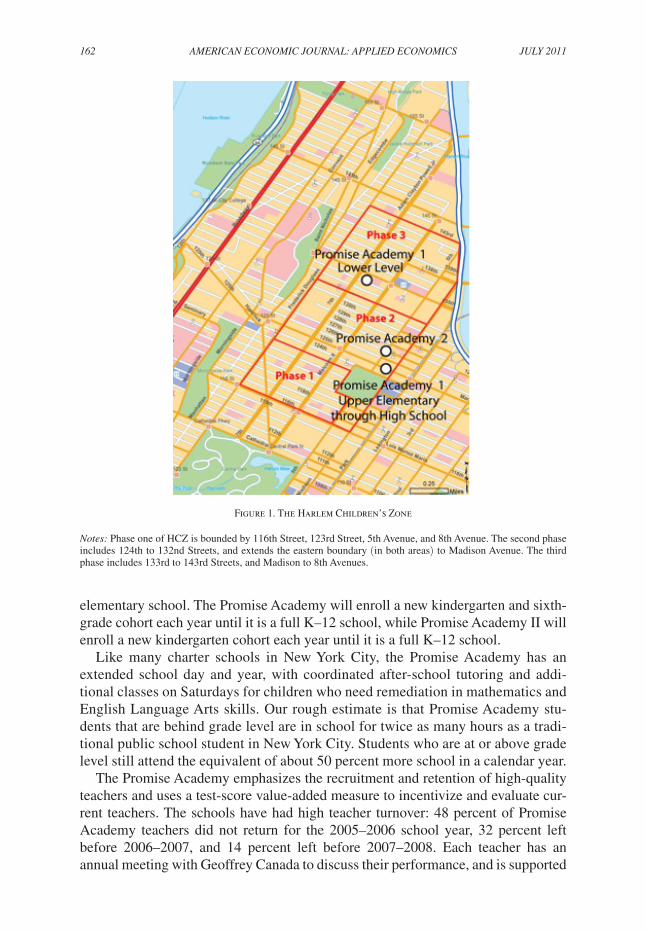
The Rheedlen Centers for Children and Families began in 1970 as an amalgam of after-school programs, truancy prevention services, and anti-violence training for teenagers in schools. The president of Rheedlen, Geoffrey Canada, questioned their piecemeal strategy, feeling that the organization helped a handful of children while letting most slip through the cracks. In 1997, Canada created HCZ to address all the problems that poor children in Harlem were facing—housing, schools, crime, asthma, and so on—through a “conveyor belt” of services from birth to college. The approach is based on the assumption that one must improve both communities and schools to affect student achievement. Starting with a 24-block area in central Harlem, the Zone expanded to a 64-block area in 2004 and a 97-block area in 2007. Figure 1 provides a map of Harlem Children’s Zone and its expansion path.
HCZ offers a number of programs, which we have partitioned into “commu-nity” and “school” inputs. Community programs are available to anyone living near HCZ, and served 8,058 youth and 5,291 adults in 2007–2008. School inputs are pro-vided to the approximately 1,300 students who attend the Promise Academy charter schools in HCZ.
Community Programs.—HCZ has over 20 programs which are broad investments in community development and available to any child in New York City. These include early childhood programs (e.g., Baby College); public elementary, middle, and high school programs (e.g., karate, dance, after-school tutoring); a college success office; family, community, and health programs; foster care prevention services; tax help and guidance; and so on. Online Appendix A provides a description of all programs run by HCZ. HCZ’s vision is to “create a tipping point” in the neighborhood so that children are surrounded by an enriching environment of college-oriented peers and supportive adults. This is consistent with the vision articulated by those who argue that changing communities is essential to closing the achievement gap.
School Programs.—The Promise Academy charter schools in HCZ began in the fall of 2004 with the opening of the Promise Academy elementary and middle schools, followed in the fall of 2005 with the opening of the Promise Academy II
162 AMEriCAN ECoNoMiC JourNAL: APPLiED ECoNoMiCS JuLy 2011
elementary school. The Promise Academy will enroll a new kindergarten and sixth-grade cohort each year until it is a full K–12 school, while Promise Academy II will enroll a new kindergarten cohort each year until it is a full K–12 school.
Like many charter schools in New York City, the Promise Academy has an extended school day and year, with coordinated after-school tutoring and addi-tional classes on Saturdays for children who need remediation in mathematics and English Language Arts skills. Our rough estimate is that Promise Academy stu-dents that are behind grade level are in school for twice as many hours as a tradi-tional public school student in New York City. Students who are at or above grade level still attend the equivalent of about 50 percent more school in a calendar year.
The Promise Academy emphasizes the recruitment and retention of high-quality teachers and uses a test-score value-added measure to incentivize and evaluate cur-rent teachers. The schools have had high teacher turnover: 48 percent of Promise Academy teachers did not return for the 2005–2006 school year, 32 percent left before 2006–2007, and 14 percent left before 2007–2008. Each teacher has an annual meeting with Geoffrey Canada to discuss their performance, and is supported
Figure 1. The Harlem Children’s Zone
Notes: Phase one of HCZ is bounded by 116th Street, 123rd Street, 5th Avenue, and 8th Avenue. The second phase includes 124th to 132nd Streets, and extends the eastern boundary (in both areas) to Madison Avenue. The third phase includes 133rd to 143rd Streets, and Madison to 8th Avenues.
VoL. 3 No. 3 163DoBBiE AND FryEr: THE HArLEM CHiLDrEN’S ZoNE
by myriad behind-the-scenes efforts to make sure their time is spent primarily on teaching and not administrative tasks.
The schools provide free medical, dental, and mental health services (students are screened upon entry and receive regular checkups through a partnership with the Children’s Health Fund); student incentives for achievement; nutritious cafeteria meals; support for parents in the form of food baskets, meals, bus fare, and so forth; and less tangible benefits, such as the support of a committed staff. The schools also make a concerted effort to change the culture of achievement, emphasizing the importance of hard work in achieving success.
These types of school inputs are consistent with those that argue high-quality schools are enough to close the achievement gap. The Promise Academy is remark-ably similar to other “No Excuses” charter schools, such as the Boston-area charter schools studied in Abdulkadiroglu et al. (2009) and Angrist et al. (2010), with three exceptions. First, the Promise Academy does not require parents or students to sign a behavioral contract. HCZ argues that only the most motivated and trusting par-ents are willing to sign a contract, even if it is nonbinding. Second, at least for the most recent elementary school students, the Promise Academy enrolls students at a younger age (three years old) than other charter schools. Third, Promise Academy students are exposed to a wide range of wrap-around services that are not typically available at other “No Excuses” charter schools.
II. Data and Research Design
We merge data from two sources: information from files at HCZ and admin-istrative data on student demographics and outcomes from the New York City Department of Education (NYCDOE).
The data from HCZ consist of lottery files from the 2004 and 2005 elementary school lotteries and the 2005 and 2006 middle school lotteries (HCZ 2004–2006).4 To insure that all students in the lottery have an equal chance of being admitted to the Promise Academy, we drop students with a sibling that received a winning lot-tery number in a previous year (who are automatically admitted), or if they have a sibling entered in a lottery in the same year (because even if one sibling wins the lot-tery, both are allowed to enroll). Including these data do not alter the results. When students enter more than one lottery, we only include the first lottery file. A typical student’s data include her name, birth date, parents’ or guardians’ names, home address, and lottery outcome.
The HCZ data were matched to the New York City administrative data using the max-imum amount of information available. Match keys were used in the following order:
(1) last name, first name, date of birth with various versions of the names (abbre-viations, alternative spellings, hyphenated versus non-hyphenated);
4 The middle school lottery was not held in 2007, and test scores are not available for elementary cohorts who enrolled after 2006 as they are too young. Lottery files are missing for the 2004 and 2008 middle school cohorts and the 2006 elementary school cohort. We are able to include all three missing cohorts in our distance × cohort IV strategy.

164 AMEriCAN ECoNoMiC JourNAL: APPLiED ECoNoMiCS JuLy 2011
(2) last name, first name, and various versions of the date of birth (most often the month and day reversed);
(3) last name, first name, prior school, and prior grade with various likely adjust-ments to prior grade;
(4) name, date of birth, and prior grade.
Once these match keys had been run, the remaining data were matched by hand considering all available variables. In our final elementary school sample we only include students who we have test scores for in 2009–2010, the most recent year available. Match rates to this sample were 84.1 percent for the winners of the kin-dergarten lottery (N = 212), and 78.4 percent for the losers of the kindergarten lot-tery (N = 217). In our final middle school sample we only include students who we have test scores for through eighth grade, including students who may have dropped out in high school. Match rates to this sample are: 82.9 percent for the winners of the middle school lottery (N = 211), and 79.2 percent for the losers of the mid-dle school lottery (N = 401). Match rates to the NYCDOE administrative data are approximately 10 percent higher than the match rates to the analysis sample due to attrition. Details of the match rates and attrition for each lottery cohort are reported in Table 1. Our match rates and attrition are similar to previous work using charter lottery data (e.g., Hoxby and Muraka 2009).
The NYCDOE data contain student-level administrative data on approximately 1.1 million students across the five boroughs of the New York City metropolitan area (NYCDOE 1999–2010). The data include information on student race, gen-der, free and reduced-price lunch eligibility, behavior, attendance, and matriculation with course grades for all students, and state math and ELA test scores for students in grades three through eight. The data also include a student’s first and last name,
Table 1—Lottery and Match Summary
Lottery Lottery Grades Number of Winner Fraction in Number of Loser Fraction ingrade year observed winners match rate final data losers match rate final data
K 2004 3rd–5th 94 0.95 0.88 37 0.92 0.76K 2005 3rd–4th 118 0.95 0.81 180 0.96 0.79K 2006 3rd — — — — — —6th 2004 6th–8th — — — — — —6th 2005 6th–8th 107 0.93 0.79 228 0.91 0.786th 2006 6th–8th 104 0.93 0.87 173 0.86 0.815th 2008 5th–6th — — — — — —
Notes: This table summarizes the match from the Promise Academy Lottery Data to the NYCDOE administrative data. The sample is restricted to students entered in the Kindergarten or sixth grade lotteries from 2004 through 2006. We do not have lottery data from the 2004 6th grade lottery, the 2006 Kindergarten lottery, or the 2008 5th grade lottery. Each of these cohorts is included in the distance sample. The initial match rate is to any year of the NYCDOE data. The final sample for the middle school sample is restricted to students with test score data through 8th grade. The final sample for the elementary school sample is restricted to students with test score data in 2009–2010, the most recent year available. Students with sibling preference are dropped. For the middle school, a lottery winner is defined as either having a winning lottery number or having a waitlist number that is below the average highest number across all years. For the elementary school, a lottery winner is defined as being offered a spot before the start of the school year.
VoL. 3 No. 3 165DoBBiE AND FryEr: THE HArLEM CHiLDrEN’S ZoNE
birth date, and address. We have complete NYCDOE data spanning the 2003–2004 to 2009–2010 school years, with test score and basic demographic data available through the 1999–2000 school year.
The state math and ELA tests, developed by McGraw-Hill, are high-stakes exams conducted in the winters of third through eighth grade. Students in third, fifth, and seventh grades must score level 2 or above (out of 4) on both tests to advance to the next grade without attending summer school. The math test includes questions on number sense and operations, algebra, geometry, measurement, and statistics. Tests in the earlier grades emphasize more basic content such as number sense and opera-tions, while later tests focus on advanced topics such as algebra and geometry. The ELA test is designed to assess students on three learning standards—information and understanding, literary response and expression, critical analysis and evalua-tion—and includes multiple-choice and short-response sections based on a reading and listening section, along with a brief editing task.
All public school students, including those attending charters, are required to take the math and ELA tests unless they are medically excused or have a severe dis-ability. Students with moderate disabilities or who are English Language Learners must take both tests, but may be granted special accommodations (additional time, translation services, and so on) at the discretion of school or state administrators. In our analysis, the test scores are normalized to have a mean of zero and a standard deviation of one for each grade and year across the entire New York City sample.
We construct measures of absenteeism and matriculation using the NYCDOE data. Absenteeism is measured as the total number of absences a student accu-mulates during the first 180 days of the school year. After the first 180 days, the NYCDOE no longer collects absence data from schools. Matriculation is an indi-cator for whether a student is “on time” given her expected grade. We impute an expected grade using the student’s birth date and New York law on school entry age. We compute a student’s cohort using the same information.
Using the student addresses provided by the NYCDOE, we also calculated the distance from each student’s home to the nearest point on the boundary of the HCZ using arcGIS. When multiple addresses are available for a single student, we use the earliest available address.5 A student is defined as living “in the Zone” if they live completely inside or on the boundaries of the original 24-block Zone.6
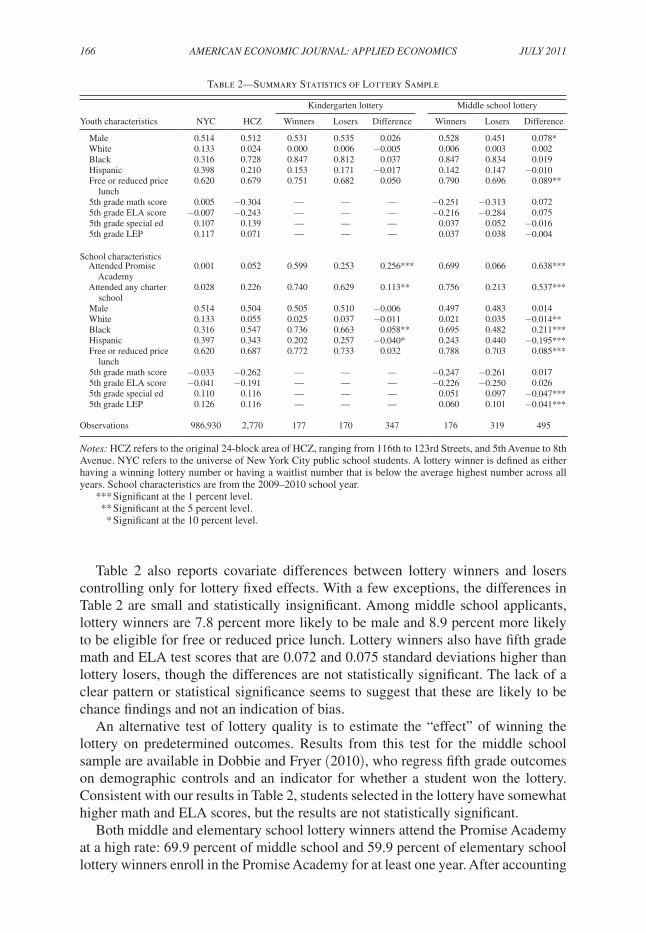
Summary statistics for the variables that we use in our core specifications are dis-played in Table 2. Students who entered the elementary or middle school lottery are more likely to be black, but no more likely to be eligible for free lunch than the typi-cal New York City student. Students enrolled in the middle school lottery score about the same on fifth grade math and ELA tests as other students living in the Zone, but score 0.294 standard deviations and 0.263 standard deviations below the typical New York City student in fifth grade math and ELA, respectively.
5 Another approach is to use the student’s address closest to the date of the lottery. The results are not sensitive to this alternative.
6 While the Zone expanded to a 64-block area in 2004 and a 97-block area in 2007, HCZ’s efforts continue to be focused in the original 24-block Zone (personal communication with HCZ). For that reason, we focus on that area, though results are qualitatively similar, though less precise, when we allow the definition of the Zone to change over time.
166 AMEriCAN ECoNoMiC JourNAL: APPLiED ECoNoMiCS JuLy 2011
Table 2 also reports covariate differences between lottery winners and losers controlling only for lottery fixed effects. With a few exceptions, the differences in Table 2 are small and statistically insignificant. Among middle school applicants, lottery winners are 7.8 percent more likely to be male and 8.9 percent more likely to be eligible for free or reduced price lunch. Lottery winners also have fifth grade math and ELA test scores that are 0.072 and 0.075 standard deviations higher than lottery losers, though the differences are not statistically significant. The lack of a clear pattern or statistical significance seems to suggest that these are likely to be chance findings and not an indication of bias.
An alternative test of lottery quality is to estimate the “effect” of winning the lottery on predetermined outcomes. Results from this test for the middle school sample are available in Dobbie and Fryer (2010), who regress fifth grade outcomes on demographic controls and an indicator for whether a student won the lottery. Consistent with our results in Table 2, students selected in the lottery have somewhat higher math and ELA scores, but the results are not statistically significant.
Both middle and elementary school lottery winners attend the Promise Academy at a high rate: 69.9 percent of middle school and 59.9 percent of elementary school lottery winners enroll in the Promise Academy for at least one year. After accounting
Table 2—Summary Statistics of Lottery Sample
Kindergarten lottery Middle school lottery
Youth characteristics NYC HCZ Winners Losers Difference Winners Losers Difference
Male 0.514 0.512 0.531 0.535 0.026 0.528 0.451 0.078* White 0.133 0.024 0.000 0.006 −0.005 0.006 0.003 0.002 Black 0.316 0.728 0.847 0.812 0.037 0.847 0.834 0.019 Hispanic 0.398 0.210 0.153 0.171 −0.017 0.142 0.147 −0.010 Free or reduced price lunch
0.620 0.679 0.751 0.682 0.050 0.790 0.696 0.089**
5th grade math score 0.005 −0.304 — — — −0.251 −0.313 0.072 5th grade ELA score −0.007 −0.243 — — — −0.216 −0.284 0.075 5th grade special ed 0.107 0.139 — — — 0.037 0.052 −0.016 5th grade LEP 0.117 0.071 — — — 0.037 0.038 −0.004
School characteristics Attended Promise Academy
0.001 0.052 0.599 0.253 0.256*** 0.699 0.066 0.638***
Attended any charter school
0.028 0.226 0.740 0.629 0.113** 0.756 0.213 0.537***
Male 0.514 0.504 0.505 0.510 −0.006 0.497 0.483 0.014 White 0.133 0.055 0.025 0.037 −0.011 0.021 0.035 −0.014** Black 0.316 0.547 0.736 0.663 0.058** 0.695 0.482 0.211*** Hispanic 0.397 0.343 0.202 0.257 −0.040* 0.243 0.440 −0.195*** Free or reduced price lunch
0.620 0.687 0.772 0.733 0.032 0.788 0.703 0.085***
5th grade math score −0.033 −0.262 — — — −0.247 −0.261 0.017 5th grade ELA score −0.041 −0.191 — — — −0.226 −0.250 0.026 5th grade special ed 0.110 0.116 — — — 0.051 0.097 −0.047*** 5th grade LEP 0.126 0.116 — — — 0.060 0.101 −0.041***
Observations 986,930 2,770 177 170 347 176 319 495
Notes: HCZ refers to the original 24-block area of HCZ, ranging from 116th to 123rd Streets, and 5th Avenue to 8th Avenue. NYC refers to the universe of New York City public school students. A lottery winner is defined as either having a winning lottery number or having a waitlist number that is below the average highest number across all years. School characteristics are from the 2009–2010 school year.
*** Significant at the 1 percent level. ** Significant at the 5 percent level. * Significant at the 10 percent level.
VoL. 3 No. 3 167DoBBiE AND FryEr: THE HArLEM CHiLDrEN’S ZoNE
for lottery fixed effects, elementary school lottery winners are 11.3 percent more likely to have attended a charter school compared to lottery losers. This suggests that, at least for the elementary school, our estimates capture the effectiveness of the Promise Academy relative to other charter schools that those who lose the lottery attend. In contrast, middle school lottery winners are 53.7 percent more likely to have attended a charter school.
research Design.—We estimate two empirical models, which provide a set of causal estimates of the effect of attending the Promise Academy charter schools in HCZ on academic outcomes. The first empirical model exploits the fact that the Promise Academy is required to select students by lottery when demand exceeds supply. The second statistical model uses the interaction between cohort year and whether or not a student lives within the Zone’s boundaries as an instrumental variable.
Let the effect of the Promise Academy on student achievement be a linear func-tion of the number of years spent at the school (P A igt ):
(1) achievemen t igt = α t + λ g + β X i + ρP A igt + ε igt ,
where α t and λ g are year-of-test and grade-of-test effects; and X i is a vector of demo-graphic controls including gender, race, free lunch status, and, in the middle school regressions, previous test score in the same subject, special education status in pre-vious grades, and whether the student spoke English as a second language in previ-ous grades. ε igt is an error term that captures random variation in test scores.
The causal effect of attending the Promise Academy is ρ. If the number of years a student spends at the Promise Academy is randomly assigned, ordinary least squares (OLS) estimates of equation (1) would capture the average causal effect of years spent at the Promise Academy. Because students and parents selectively choose whether to enroll at the Promise Academy, however, OLS estimates are likely to be biased by correlation between school choice and unobserved characteristics related to student ability, motivation, or background.
Our first strategy identifies ρ by comparing the average outcomes of students who “won” the lottery to the average outcomes of students who “lost” the lottery in years with complete data. The lottery losers therefore form the control group correspond-ing to the counterfactual state that would have occurred for students in the treatment group if they had not been offered a spot in the charter school.
Under several assumptions (that the treatment group assignment is random and that winning the lottery only affects outcomes through Promise Academy enroll-ment), we can estimate the average effect of treatment for students induced into enrollment by the lottery offer. The parameter is estimated through a two-stage least squares regression of student outcomes on years of enrollment (P A igt ) with the lot-tery offer as an instrumental variable for enrollment.
The first-stage equations for IV estimation take the form:
(2) P A igt = χ t + κ g + ∑ j
μ j lotter y ij + γ X i + π Z i + η igt ,
168 AMEriCAN ECoNoMiC JourNAL: APPLiED ECoNoMiCS JuLy 2011
where the lottery indicators lotter y ij control for which lottery the student entered; and π captures the effect of the lottery offer ( Z i ) on the number of years a student spends at the Promise Academy. We define lottery winners as students who receive a winning lottery number or whose waitlist number was below the average highest number called across all years. Given the size of the estimated treatment effect, our results are robust to other definitions of “lottery winner.”
To compliment our lottery strategy, our second statistical approach exploits whether a student lives within the Zone’s boundaries interacted with cohort year as an instru-mental variable. Two forces drive our identification. First, we compare outcomes between children living in the Zone who were eligible for its charter schools and students living in the Zone who were not eligible. For example, students who started kindergarten in 2003 were ineligible for the Promise Academy, which began enroll-ing kindergarten students in 2004. As the 2003 cohort is likely to be quite similar to the 2004 cohort, they provide a plausible counterfactual. Second, we compare the outcomes of children living outside the Zone in the two cohorts to adjust for year-to-year variation that may come about through broad citywide reforms. While anyone is eligible to enroll in the schools, only those students living inside the Zone are actively recruited by HCZ staff. If these recruitment efforts are effective, there should be a relationship between address and the probability of enrollment for eligible cohorts.
The first-stage equations for our second strategy let enrollment in Promise Academy be a function of student characteristics ( X i ), home address (inZon e i ), cohort year (cohor t i ), and the interaction between address and cohort year:
(3) P A igt = α t + λ g + β X igt + γinZon e i + δcohor t i
+ η(inZon e i × cohor t i ) + ε igt .
The residual of this equation captures other factors that are correlated with enroll-ment in Promise Academy that may be related to student outcomes. The key iden-tifying assumptions of our approach are that (1) the interaction between address (in or out of Zone boundaries) and cohort year is correlated with enrollment, and (2) the interaction between address and cohort year only affects student outcomes through its effects on the probability of enrollment, not through any other factor or unobserved characteristic.
The first assumption is testable. Appendix Table 1 presents first-stage results. We pool outcomes across grades, and regress years of enrollment on controls for grade, gender, race, lunch status, cohort, whether a student lives within the original 24-block HCZ, and the interaction between cohort and whether a student lives within the original 24-block HCZ. The middle school regression also controls for special edu-cation status, whether the student speaks English as a second language, and previous test scores. The coefficients on our excluded instruments—the interaction between address and cohort—are large, positive, and statistically significant for nearly all of the cohorts eligible for the Promise Academy.7 The one exception is the coefficient
7 The 2008 middle school cohort entered the Promise Academy in fifth grade, but middle school cohorts are defined using sixth grade. As a result, this cohort is labeled as the 2009 cohort in our regression.
VoL. 3 No. 3 169DoBBiE AND FryEr: THE HArLEM CHiLDrEN’S ZoNE
on the interaction term for the 2005 middle school cohort, which is negative and imprecisely estimated. For cohorts that are not eligible for the Promise Academy, the estimated impact of living in the Zone is small and of inconsistent sign.8 A joint F-test with the null that the excluded instruments are jointly equal to zero is strongly rejected ( p-value 0.000) in both the elementary and middle school regressions.
The validity of our second identifying assumption—that the instruments only affect student outcomes through the probability of enrollment—is more difficult to assess. To be violated, the interaction between a student’s address and cohort year must be correlated with her outcomes after controlling for the student’s background characteristics, address, and cohort year. This assumes, for instance, that parents do not selectively move into the Children’s Zone based on their child’s cohort. Given that all children, regardless of their address, are eligible for HCZ programs, this seems a plausible assumption. Motivated parents can enroll their children in the pro-grams no matter where they live; the relationship between distance to the Zone and enrollment comes about primarily through increased knowledge about the programs or cost of attending, not eligibility. We also assume that shocks either affect everyone in a given cohort regardless of address, or affect everyone at a given address regard-less of cohort. If there is something that shifts achievement test scores for third grad-ers living inside the Children’s Zone, but not third graders outside the Zone or fourth graders inside the Zone, our second identifying assumption is violated.
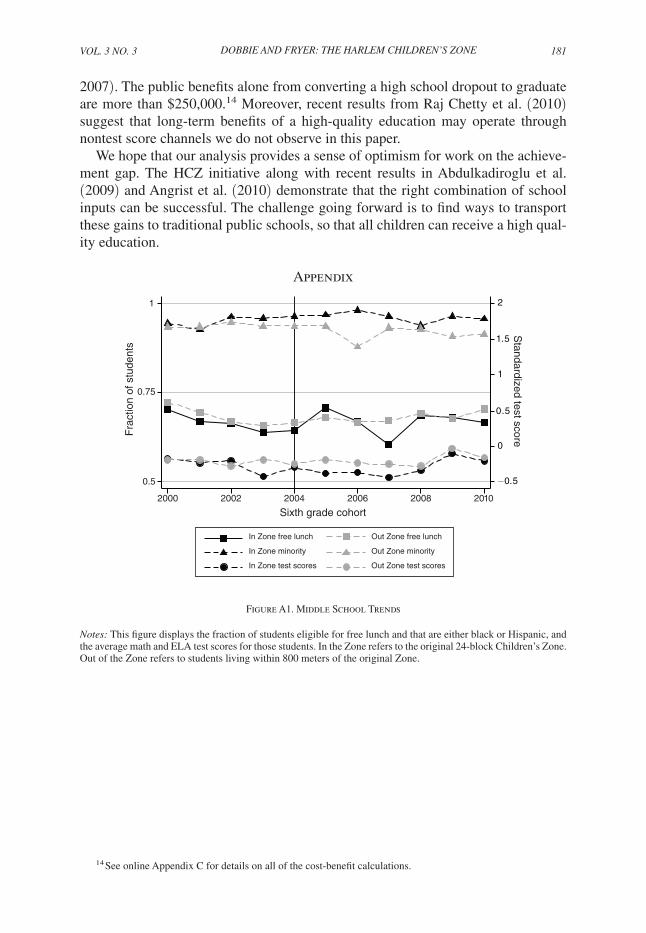
If our second identifying assumption is valid, there should be no difference in the relationship between eligible and ineligible students living inside the Zone and the relationship between eligible and ineligible students living outside the Zone. An informal test of this assumption is to look for differential trends in the characteristics of students living inside and outside of the Zone. Appendix Figures 1 and 2 plot the fraction of students who are either black or Hispanic and the fraction eligible for free lunch for our middle school and elementary school IV samples, respectively. The middle school plot also includes the average math and ELA test scores in fifth grade, one year before students are eligible for the Promise Academy. There is no evidence of a differential trend in any of the characteristics examined. Students liv-ing in and outside of the Zone are remarkably similar across cohorts. A more for-mal test of this assumption is to see if there is an “effect” of attending the Promise Academy on predetermined variables. Dobbie and Fryer (2010) show that the effect of attending the Promise Academy middle school on fifth grade test scores—a year before students enroll at the school—is small and statistically insignificant.
Under these assumptions (and a monotonicity assumption that being born into an eligible cohort in the Zone does not make a student less likely to enroll), we can estimate the causal impact of enrolling in the Promise Academy. The identi-fied parameter measures the average effect of treatment for students induced into enrollment by the instrument. The parameter is estimated though a two-stage least squares regression of student outcomes on years of enrollment (P A igt ) with the inter-action between address and cohort as an instrumental variable for enrollment.
8 Students in ineligible cohorts can enroll in the Promise Academy if they skip a grade or are held back. This may help explain why there is a small but statistically significant effect of living in the Zone on enrollment for some of the ineligible cohorts.
170 AMEriCAN ECoNoMiC JourNAL: APPLiED ECoNoMiCS JuLy 2011
III. The Impact of the Promise Academy Charter Schools on Student Achievement
A. Promise Academy in HCZ–Middle School
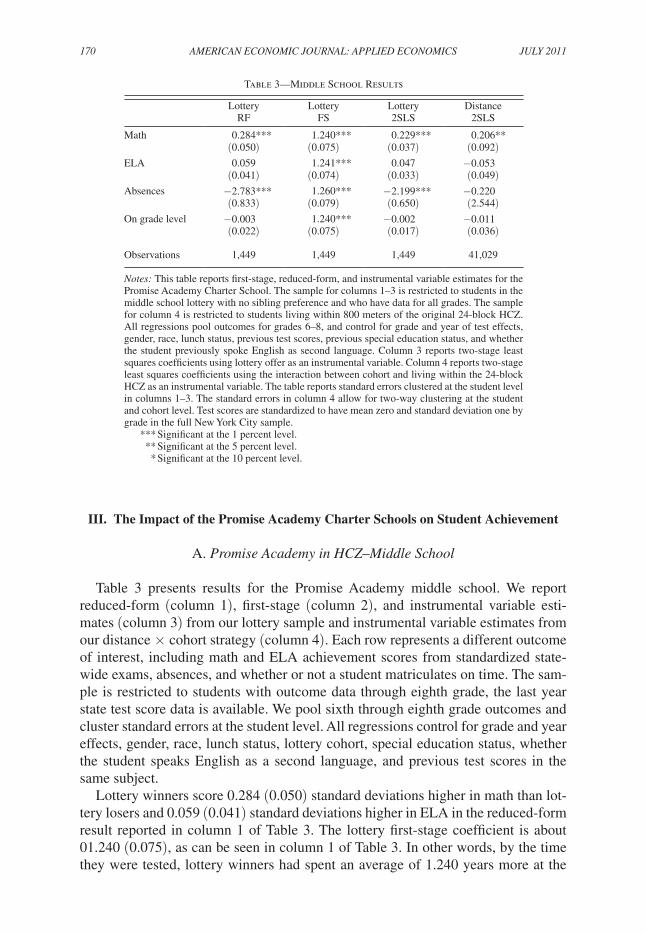
Table 3 presents results for the Promise Academy middle school. We report reduced-form (column 1), first-stage (column 2), and instrumental variable esti-mates (column 3) from our lottery sample and instrumental variable estimates from our distance × cohort strategy (column 4). Each row represents a different outcome of interest, including math and ELA achievement scores from standardized state-wide exams, absences, and whether or not a student matriculates on time. The sam-ple is restricted to students with outcome data through eighth grade, the last year state test score data is available. We pool sixth through eighth grade outcomes and cluster standard errors at the student level. All regressions control for grade and year effects, gender, race, lunch status, lottery cohort, special education status, whether the student speaks English as a second language, and previous test scores in the same subject.
Lottery winners score 0.284 (0.050) standard deviations higher in math than lot-tery losers and 0.059 (0.041) standard deviations higher in ELA in the reduced-form result reported in column 1 of Table 3. The lottery first-stage coefficient is about 01.240 (0.075), as can be seen in column 1 of Table 3. In other words, by the time they were tested, lottery winners had spent an average of 1.240 years more at the
Table 3—Middle School Results
Lottery Lottery Lottery DistanceRF FS 2SLS 2SLS
Math 0.284*** 1.240*** 0.229*** 0.206**(0.050) (0.075) (0.037) (0.092)
ELA 0.059 1.241*** 0.047 −0.053(0.041) (0.074) (0.033) (0.049)
Absences −2.783*** 1.260*** −2.199*** −0.220(0.833) (0.079) (0.650) (2.544)
On grade level −0.003 1.240*** −0.002 −0.011(0.022) (0.075) (0.017) (0.036)
Observations 1,449 1,449 1,449 41,029
Notes: This table reports first-stage, reduced-form, and instrumental variable estimates for the Promise Academy Charter School. The sample for columns 1–3 is restricted to students in the middle school lottery with no sibling preference and who have data for all grades. The sample for column 4 is restricted to students living within 800 meters of the original 24-block HCZ. All regressions pool outcomes for grades 6–8, and control for grade and year of test effects, gender, race, lunch status, previous test scores, previous special education status, and whether the student previously spoke English as second language. Column 3 reports two-stage least squares coefficients using lottery offer as an instrumental variable. Column 4 reports two-stage least squares coefficients using the interaction between cohort and living within the 24-block HCZ as an instrumental variable. The table reports standard errors clustered at the student level in columns 1–3. The standard errors in column 4 allow for two-way clustering at the student and cohort level. Test scores are standardized to have mean zero and standard deviation one by grade in the full New York City sample.
*** Significant at the 1 percent level. ** Significant at the 5 percent level. * Significant at the 10 percent level.
VoL. 3 No. 3 171DoBBiE AND FryEr: THE HArLEM CHiLDrEN’S ZoNE
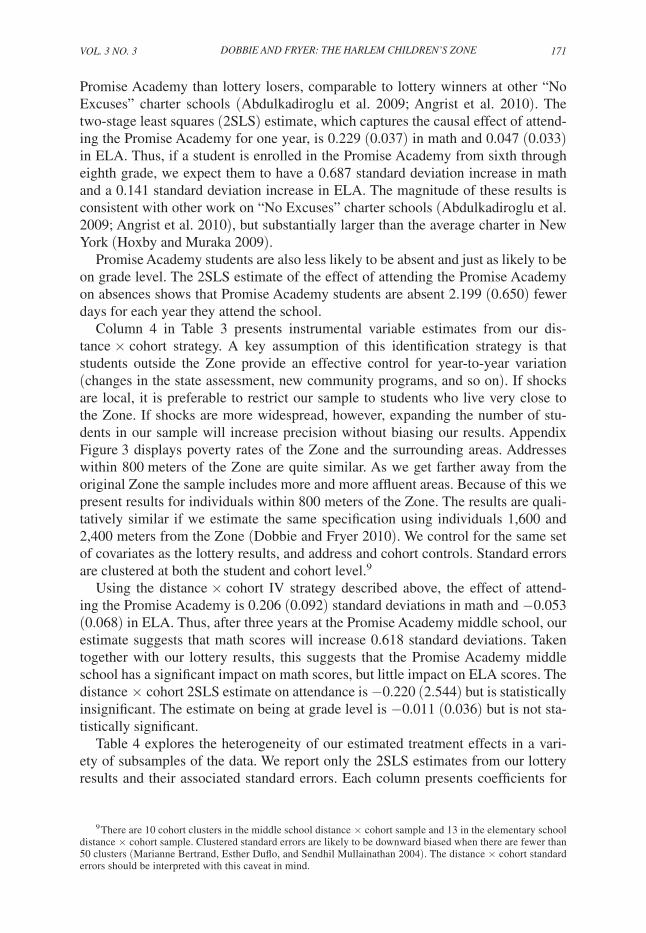
Promise Academy than lottery losers, comparable to lottery winners at other “No Excuses” charter schools (Abdulkadiroglu et al. 2009; Angrist et al. 2010). The two-stage least squares (2SLS) estimate, which captures the causal effect of attend-ing the Promise Academy for one year, is 0.229 (0.037) in math and 0.047 (0.033) in ELA. Thus, if a student is enrolled in the Promise Academy from sixth through eighth grade, we expect them to have a 0.687 standard deviation increase in math and a 0.141 standard deviation increase in ELA. The magnitude of these results is consistent with other work on “No Excuses” charter schools (Abdulkadiroglu et al. 2009; Angrist et al. 2010), but substantially larger than the average charter in New York (Hoxby and Muraka 2009).
Promise Academy students are also less likely to be absent and just as likely to be on grade level. The 2SLS estimate of the effect of attending the Promise Academy on absences shows that Promise Academy students are absent 2.199 (0.650) fewer days for each year they attend the school.
Column 4 in Table 3 presents instrumental variable estimates from our dis-tance × cohort strategy. A key assumption of this identification strategy is that students outside the Zone provide an effective control for year-to-year variation (changes in the state assessment, new community programs, and so on). If shocks are local, it is preferable to restrict our sample to students who live very close to the Zone. If shocks are more widespread, however, expanding the number of stu-dents in our sample will increase precision without biasing our results. Appendix Figure 3 displays poverty rates of the Zone and the surrounding areas. Addresses within 800 meters of the Zone are quite similar. As we get farther away from the original Zone the sample includes more and more affluent areas. Because of this we present results for individuals within 800 meters of the Zone. The results are quali-tatively similar if we estimate the same specification using individuals 1,600 and 2,400 meters from the Zone (Dobbie and Fryer 2010). We control for the same set of covariates as the lottery results, and address and cohort controls. Standard errors are clustered at both the student and cohort level.9
Using the distance × cohort IV strategy described above, the effect of attend-ing the Promise Academy is 0.206 (0.092) standard deviations in math and −0.053 (0.068) in ELA. Thus, after three years at the Promise Academy middle school, our estimate suggests that math scores will increase 0.618 standard deviations. Taken together with our lottery results, this suggests that the Promise Academy middle school has a significant impact on math scores, but little impact on ELA scores. The distance × cohort 2SLS estimate on attendance is −0.220 (2.544) but is statistically insignificant. The estimate on being at grade level is −0.011 (0.036) but is not sta-tistically significant.
Table 4 explores the heterogeneity of our estimated treatment effects in a vari-ety of subsamples of the data. We report only the 2SLS estimates from our lottery results and their associated standard errors. Each column presents coefficients for
9 There are 10 cohort clusters in the middle school distance × cohort sample and 13 in the elementary school distance × cohort sample. Clustered standard errors are likely to be downward biased when there are fewer than 50 clusters (Marianne Bertrand, Esther Duflo, and Sendhil Mullainathan 2004). The distance × cohort standard errors should be interpreted with this caveat in mind.
172 AMEriCAN ECoNoMiC JourNAL: APPLiED ECoNoMiCS JuLy 2011
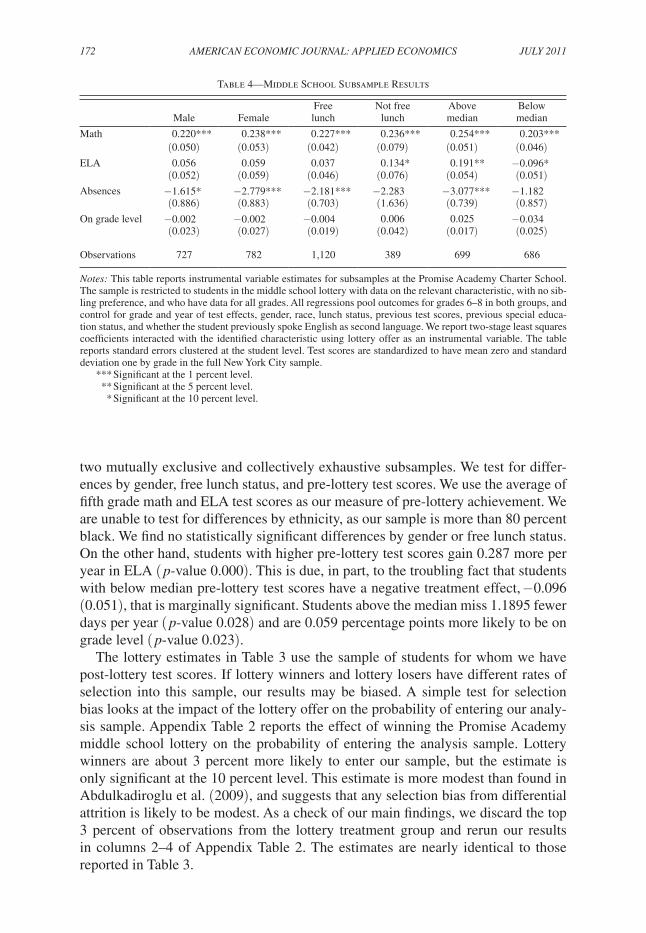
two mutually exclusive and collectively exhaustive subsamples. We test for differ-ences by gender, free lunch status, and pre-lottery test scores. We use the average of fifth grade math and ELA test scores as our measure of pre-lottery achievement. We are unable to test for differences by ethnicity, as our sample is more than 80 percent black. We find no statistically significant differences by gender or free lunch status. On the other hand, students with higher pre-lottery test scores gain 0.287 more per year in ELA ( p-value 0.000). This is due, in part, to the troubling fact that students with below median pre-lottery test scores have a negative treatment effect, −0.096 (0.051), that is marginally significant. Students above the median miss 1.1895 fewer days per year ( p-value 0.028) and are 0.059 percentage points more likely to be on grade level ( p-value 0.023).
The lottery estimates in Table 3 use the sample of students for whom we have post-lottery test scores. If lottery winners and lottery losers have different rates of selection into this sample, our results may be biased. A simple test for selection bias looks at the impact of the lottery offer on the probability of entering our analy-sis sample. Appendix Table 2 reports the effect of winning the Promise Academy middle school lottery on the probability of entering the analysis sample. Lottery winners are about 3 percent more likely to enter our sample, but the estimate is only significant at the 10 percent level. This estimate is more modest than found in Abdulkadiroglu et al. (2009), and suggests that any selection bias from differential attrition is likely to be modest. As a check of our main findings, we discard the top 3 percent of observations from the lottery treatment group and rerun our results in columns 2–4 of Appendix Table 2. The estimates are nearly identical to those reported in Table 3.
Table 4—Middle School Subsample Results
Free Not free Above BelowMale Female lunch lunch median median
Math 0.220*** 0.238*** 0.227*** 0.236*** 0.254*** 0.203***(0.050) (0.053) (0.042) (0.079) (0.051) (0.046)
ELA 0.056 0.059 0.037 0.134* 0.191** −0.096*(0.052) (0.059) (0.046) (0.076) (0.054) (0.051)
Absences −1.615* −2.779*** −2.181*** −2.283 −3.077*** −1.182(0.886) (0.883) (0.703) (1.636) (0.739) (0.857)
On grade level −0.002 −0.002 −0.004 0.006 0.025 −0.034(0.023) (0.027) (0.019) (0.042) (0.017) (0.025)
Observations 727 782 1,120 389 699 686
Notes: This table reports instrumental variable estimates for subsamples at the Promise Academy Charter School. The sample is restricted to students in the middle school lottery with data on the relevant characteristic, with no sib-ling preference, and who have data for all grades. All regressions pool outcomes for grades 6–8 in both groups, and control for grade and year of test effects, gender, race, lunch status, previous test scores, previous special educa-tion status, and whether the student previously spoke English as second language. We report two-stage least squares coefficients interacted with the identified characteristic using lottery offer as an instrumental variable. The table reports standard errors clustered at the student level. Test scores are standardized to have mean zero and standard deviation one by grade in the full New York City sample.
*** Significant at the 1 percent level. ** Significant at the 5 percent level. * Significant at the 10 percent level.

VoL. 3 No. 3 173DoBBiE AND FryEr: THE HArLEM CHiLDrEN’S ZoNE
B. Promise Academy–Elementary School
Table 5 is identical to Table 3 for the Promise Academy elementary school. As before, we report reduced-form (column 1), first-stage (column 2), and instrumental variable estimates (column 3) from our lottery sample and instrumental variable estimates from our distance × cohort strategy (column 4). Each row represents a different outcome of interest, including math and ELA achievement scores from standardized statewide exams, absences, and whether or not a student matriculates on time. The sample includes all students with data in 2009–2010, the most recent available. All regressions control for grade and year effects, lottery cohort, gender, race, and lunch status. The distance × cohort regressions also control for address and cohort effects. Standard errors are clustered at the student level in the lottery regres-sions and both the student and cohort level in the distance × cohort regressions.
The reduced form estimates suggest that children who attend the elementary school gain 0.160 (0.097) standard deviations in math and 0.095 (0.083) standard deviations in ELA per year. Students have 2.045 (1.178) fewer absences per year and appear no less likely to advance on time. The first stage for the lottery IV is 0.834, so one can multiply the reduced form effects by 1.21 to obtain the 2SLS esti-mates based on the lottery sample. Our 2SLS estimates imply that students who are enrolled in the Promise Academy schools from kindergarten through fifth grade are expected to gain 1.146 standard deviations in math and 0.570 standard deviations in
Table 5—Elementary School Results
Lottery Lottery Lottery DistanceRF FS 2SLS 2SLS
Math 0.160 0.834*** 0.191 0.324***(0.097) (0.253) (0.116) (0.084)
ELA 0.095 0.834*** 0.114 0.420***(0.083) (0.253) (0.095) (0.075)
Absences −2.045* 0.834*** −2.412* −2.533***(1.178) (0.253) (1.413) (0.550)
On grade level 0.016 0.834*** 0.019 −0.058***(0.027) (0.253) (0.033) (0.020)
Observations 748 748 748 34,148
Notes: This table reports first-stage, reduced-form and instrumental variable estimates for the Promise Academy Charter School. The sample for columns 1–3 is restricted to students in the elementary school lottery with no sibling preference who are in the most recent year of data. The sample for column 4 is restricted to students living within 800 meters of the origi-nal 24-block HCZ. All regressions pool outcomes for grades 3–5, and control for grade and year of test effects, gender, race, and lunch status. Column 3 reports two-stage least squares coefficients using lottery offer as an instrumental variable. Column 4 reports two-stage least squares coefficients using the interaction between cohort and living within the 24-block HCZ as an instrumental variable. The table reports standard errors clustered at the student level in columns 1–3. The standard errors in column 4 allow for two-way clustering at the student and cohort level. Test scores are standardized to have mean zero and standard deviation one by grade in the full New York City sample.
*** Significant at the 1 percent level. ** Significant at the 5 percent level. * Significant at the 10 percent level.
174 AMEriCAN ECoNoMiC JourNAL: APPLiED ECoNoMiCS JuLy 2011
ELA relative to the control group. Promise Academy students are also less likely to be absent and no less likely to be on grade level.
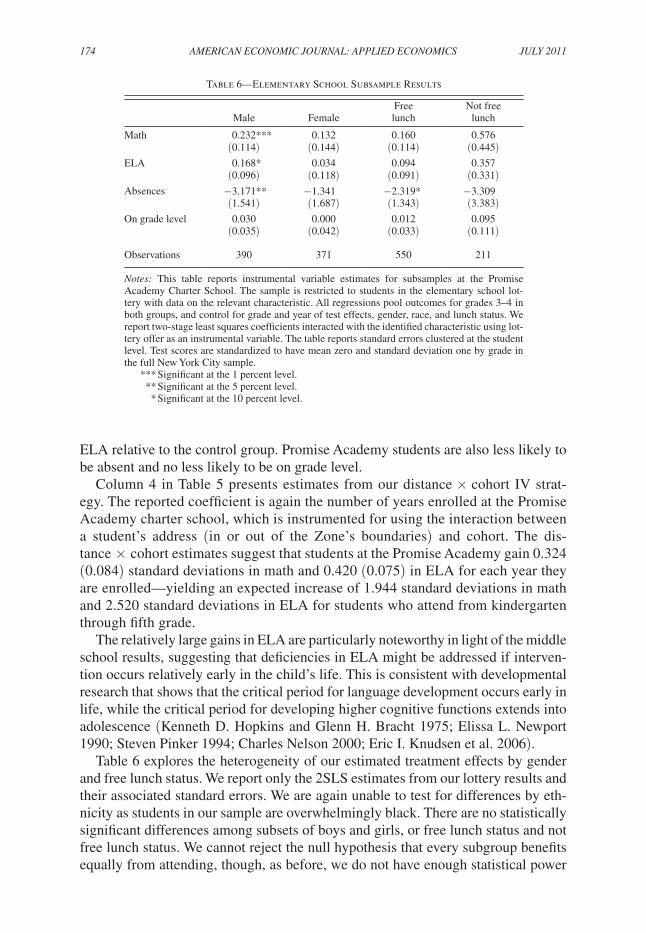
Column 4 in Table 5 presents estimates from our distance × cohort IV strat-egy. The reported coefficient is again the number of years enrolled at the Promise Academy charter school, which is instrumented for using the interaction between a student’s address (in or out of the Zone’s boundaries) and cohort. The dis-tance × cohort estimates suggest that students at the Promise Academy gain 0.324 (0.084) standard deviations in math and 0.420 (0.075) in ELA for each year they are enrolled—yielding an expected increase of 1.944 standard deviations in math and 2.520 standard deviations in ELA for students who attend from kindergarten through fifth grade.
The relatively large gains in ELA are particularly noteworthy in light of the middle school results, suggesting that deficiencies in ELA might be addressed if interven-tion occurs relatively early in the child’s life. This is consistent with developmental research that shows that the critical period for language development occurs early in life, while the critical period for developing higher cognitive functions extends into adolescence (Kenneth D. Hopkins and Glenn H. Bracht 1975; Elissa L. Newport 1990; Steven Pinker 1994; Charles Nelson 2000; Eric I. Knudsen et al. 2006).
Table 6 explores the heterogeneity of our estimated treatment effects by gender and free lunch status. We report only the 2SLS estimates from our lottery results and their associated standard errors. We are again unable to test for differences by eth-nicity as students in our sample are overwhelmingly black. There are no statistically significant differences among subsets of boys and girls, or free lunch status and not free lunch status. We cannot reject the null hypothesis that every subgroup benefits equally from attending, though, as before, we do not have enough statistical power
Table 6—Elementary School Subsample Results
Free Not freeMale Female lunch lunch
Math 0.232*** 0.132 0.160 0.576(0.114) (0.144) (0.114) (0.445)
ELA 0.168* 0.034 0.094 0.357(0.096) (0.118) (0.091) (0.331)
Absences −3.171** −1.341 −2.319* −3.309(1.541) (1.687) (1.343) (3.383)
On grade level 0.030 0.000 0.012 0.095(0.035) (0.042) (0.033) (0.111)
Observations 390 371 550 211
Notes: This table reports instrumental variable estimates for subsamples at the Promise Academy Charter School. The sample is restricted to students in the elementary school lot-tery with data on the relevant characteristic. All regressions pool outcomes for grades 3–4 in both groups, and control for grade and year of test effects, gender, race, and lunch status. We report two-stage least squares coefficients interacted with the identified characteristic using lot-tery offer as an instrumental variable. The table reports standard errors clustered at the student level. Test scores are standardized to have mean zero and standard deviation one by grade in the full New York City sample.
*** Significant at the 1 percent level. ** Significant at the 5 percent level. * Significant at the 10 percent level.
VoL. 3 No. 3 175DoBBiE AND FryEr: THE HArLEM CHiLDrEN’S ZoNE
to rule out small or medium-sized differences. This is particularly true for students not eligible for free lunch, which make up only a small fraction of the Promise Academy student body.
Appendix Table 3 tests for differential selection into our elementary school lottery sample. In column 1, we report the effect of winning the Promise Academy elemen-tary school lottery on the probability of entering the analysis sample. Lottery winners are 2.0 percent more likely to enter our sample, but the estimate is not statistically sig-nificant. Again, we check the main findings by discarding the top 2 percent of obser-vations from the lottery treatment group and rerunning our results in columns 2–4 of Appendix Table 3. The estimates are nearly identical to those reported in Table 5.
***
Let us put the magnitude of our estimates in perspective. Jacob and Ludwig (2008), in a survey of programs and policies designed to increase achievement among poor children, report that only three reforms pass a simple cost-benefit analysis: lowering class size, bonuses for teachers for teaching in hard-to-staff schools, and early child-hood programs. The effect of lowering class size from 24 to 16 students per teacher is approximately 0.22 (0.05) standard deviations on combined math and reading scores (Krueger 1999). While a 1 standard deviation increase in teacher quality raises math achievement by 0.15–0.24 standard deviations per year and reading achievement by 0.15–0.20 standard deviations per year (Rockoff 2004; Rivkin, Hanushek, and Kain 2005; Daniel Aaronson, Lisa Barrow, and William Sander 2007; Kane and Staiger 2008), value added measures are not strongly correlated with observable characteris-tics of teachers making it difficult to ex ante identify the best teachers. The effect of Teach for America, one attempt to bring more skilled teachers into poor performing schools, is 0.15 standard deviations in math and 0.03 in reading (Decker, Mayer, and Glaserman 2004). The effect of Head Start is 0.147 (0.103) standard deviations in applied problems and 0.319 (0.147) in letter identification on the Woodcock-Johnson exam, but the effects on test scores fade in elementary school (Currie and Thomas 1995; Ludwig and Deborah A. Phillips 2007). Fryer (2010a) finds that input based student incentives also pass a cost-benefit analysis, with an effect size of approximately 0.15 standard deviations in both math and reading depending on the nature of the incen-tives and the age of the student. All these effect sizes are a fraction of the impact of being offered admission into the Promise Academy charter schools. Abdulkadiroglu et al. (2009) and Angrist et al. (2010) find effect sizes closest to our own, with students enrolled in a set of Boston-area “No Excuses” charter middle schools gaining about 0.4 standard deviations a year in math and 0.1 standard deviations a year in reading.
Although the results for both middle and elementary school samples provide some optimism about the potential for a set of school-based investments to increase achievement among poor students, one worries that improvements on state exams may be driven by test specific preparatory activities at the expense of more gen-eral learning (Jacob 2005) or cheating (Jacob and Levitt 2003).10 Whether these
10 Using an algorithm similar to Jacob and Levitt (2003), we implement two statistical tests of cheating on the high-stakes state test at Promise Academy. First, we tested whether Promise Academy students are more likely to
176 AMEriCAN ECoNoMiC JourNAL: APPLiED ECoNoMiCS JuLy 2011
academic gains will translate into improved longer term outcomes (health, educa-tion, crime, wages) is an important open question.
IV. Communities, Schools, or Both?
Promise Academy students are exposed to a network of community services in the HCZ along with education investments ranging from a longer school day and year to after-school programs to mental and physical health services. The commu-nity services—the community centers, truancy-prevention programs, the network of targeted programs, such as the asthma and obesity initiatives, and so on—are available to any child in HCZ. These programs may plausibly affect student out-comes in any number of ways, from mitigating the physical and emotional barriers to success to providing a more supportive out-of-school learning environment.
Consider a simple model of education production where achievement is a function of school inputs (s), community inputs (c), and a range of other inputs (x) that might include parental involvement, teacher quality, and so on. For simplicity, we assume the production function f (s, c, x) is twice continuously differentiable and additively separable. In our distance × cohort IV strategy, we use the difference between eli-gible cohorts living in the Zone (whose treatment is equal to (∂f/∂s) + (∂f/∂c) + ( ∂ 2 f/∂s∂c)) to ineligible cohorts living in the Zone (whose treatment is equal to ∂f/∂c). The IV estimate therefore identifies the school and interaction effects (∂f/∂s + ∂ 2 f/∂s∂c). Lottery estimates identify identical parameters.
There are two pieces of evidence that suggest that high-quality schools are enough to explain the large treatment effects presented in the earlier section ( ∂ 2 f/∂s∂c ≈ 0). Our first piece of evidence comes from our lottery identification strategy, where we separately estimate the treatment effect of attending the Promise Academy for stu-dents who live inside the Zone’s boundaries (which identifies (∂f/∂s) + (∂f/∂c) + (∂ 2 f/∂s∂c)) and for students who live outside the Zone (which identifies ∂f/∂s).11
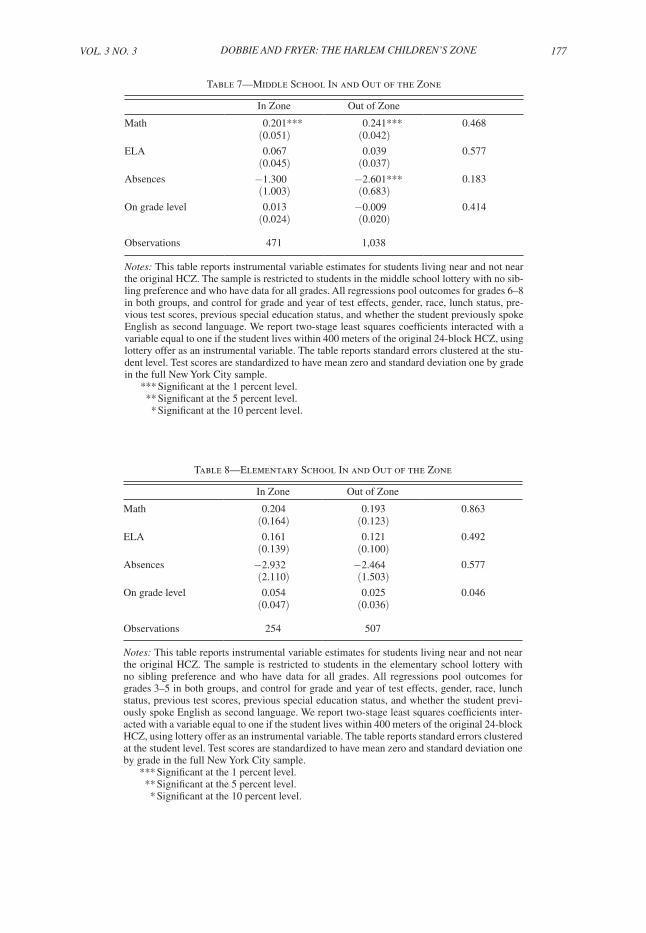
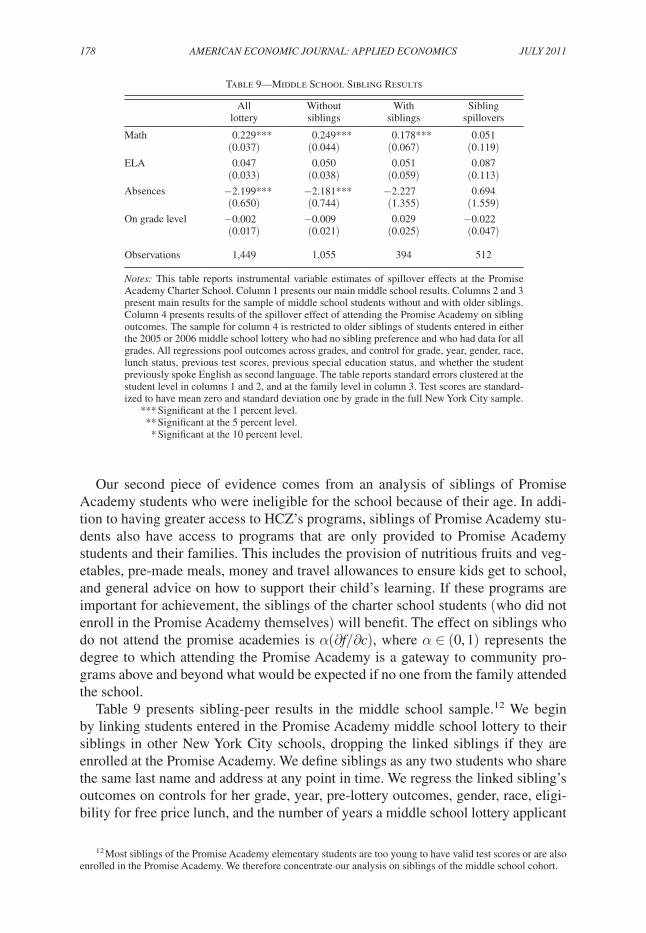
Tables 7 and 8 show the estimated treatment effect of attending the Promise Academy for students who live within 400 meters of the Zone and students who do not for the middle and elementary school lottery samples, respectively. We report instrumental variable estimates and their associated standard errors clustered at the student level. There are no statistically significant differences among students who live near and not near the Zone in math, ELA, or absences. Students who attend the Promise Academy elementary school are somewhat more likely to be on grade level if they live close to the Zone ( p-value 0.046), but there is no statistically significant difference for the middle school. Taken together, these results are consistent with the idea that students do not benefit more from attending the Promise Academy if they live close to the Zone. Changing the definition of “close” to 200 or 600 meters away does not change the results.
have an unusual block of consecutive identical answers, and second, we tested whether Promise Academy students systematically underperform on easy questions while over-performing on hard questions. Neither approach detects cheating at Promise Academy.
11 While students who live outside the Zone may participate in community programs within the Zone, adminis-trative data from HCZ show it is very unlikely.
VoL. 3 No. 3 177DoBBiE AND FryEr: THE HArLEM CHiLDrEN’S ZoNE
Table 8 —Elementary School In and Out of the Zone
In Zone Out of Zone
Math 0.204 0.193 0.863(0.164) (0.123)
ELA 0.161 0.121 0.492(0.139) (0.100)
Absences −2.932 −2.464 0.577(2.110) (1.503)
On grade level 0.054 0.025 0.046(0.047) (0.036)
Observations 254 507
Notes: This table reports instrumental variable estimates for students living near and not near the original HCZ. The sample is restricted to students in the elementary school lottery with no sibling preference and who have data for all grades. All regressions pool outcomes for grades 3–5 in both groups, and control for grade and year of test effects, gender, race, lunch status, previous test scores, previous special education status, and whether the student previ-ously spoke English as second language. We report two-stage least squares coefficients inter-acted with a variable equal to one if the student lives within 400 meters of the original 24-block HCZ, using lottery offer as an instrumental variable. The table reports standard errors clustered at the student level. Test scores are standardized to have mean zero and standard deviation one by grade in the full New York City sample.
*** Significant at the 1 percent level. ** Significant at the 5 percent level. * Significant at the 10 percent level.
Table 7—Middle School In and Out of the Zone
In Zone Out of Zone
Math 0.201*** 0.241*** 0.468(0.051) (0.042)
ELA 0.067 0.039 0.577(0.045) (0.037)
Absences −1.300 −2.601*** 0.183(1.003) (0.683)
On grade level 0.013 −0.009 0.414(0.024) (0.020)
Observations 471 1,038
Notes: This table reports instrumental variable estimates for students living near and not near the original HCZ. The sample is restricted to students in the middle school lottery with no sib-ling preference and who have data for all grades. All regressions pool outcomes for grades 6–8 in both groups, and control for grade and year of test effects, gender, race, lunch status, pre-vious test scores, previous special education status, and whether the student previously spoke English as second language. We report two-stage least squares coefficients interacted with a variable equal to one if the student lives within 400 meters of the original 24-block HCZ, using lottery offer as an instrumental variable. The table reports standard errors clustered at the stu-dent level. Test scores are standardized to have mean zero and standard deviation one by grade in the full New York City sample.
*** Significant at the 1 percent level. ** Significant at the 5 percent level. * Significant at the 10 percent level.
178 AMEriCAN ECoNoMiC JourNAL: APPLiED ECoNoMiCS JuLy 2011
Our second piece of evidence comes from an analysis of siblings of Promise Academy students who were ineligible for the school because of their age. In addi-tion to having greater access to HCZ’s programs, siblings of Promise Academy stu-dents also have access to programs that are only provided to Promise Academy students and their families. This includes the provision of nutritious fruits and veg-etables, pre-made meals, money and travel allowances to ensure kids get to school, and general advice on how to support their child’s learning. If these programs are important for achievement, the siblings of the charter school students (who did not enroll in the Promise Academy themselves) will benefit. The effect on siblings who do not attend the promise academies is α(∂f/∂c), where α ∈ (0, 1) represents the degree to which attending the Promise Academy is a gateway to community pro-grams above and beyond what would be expected if no one from the family attended the school.
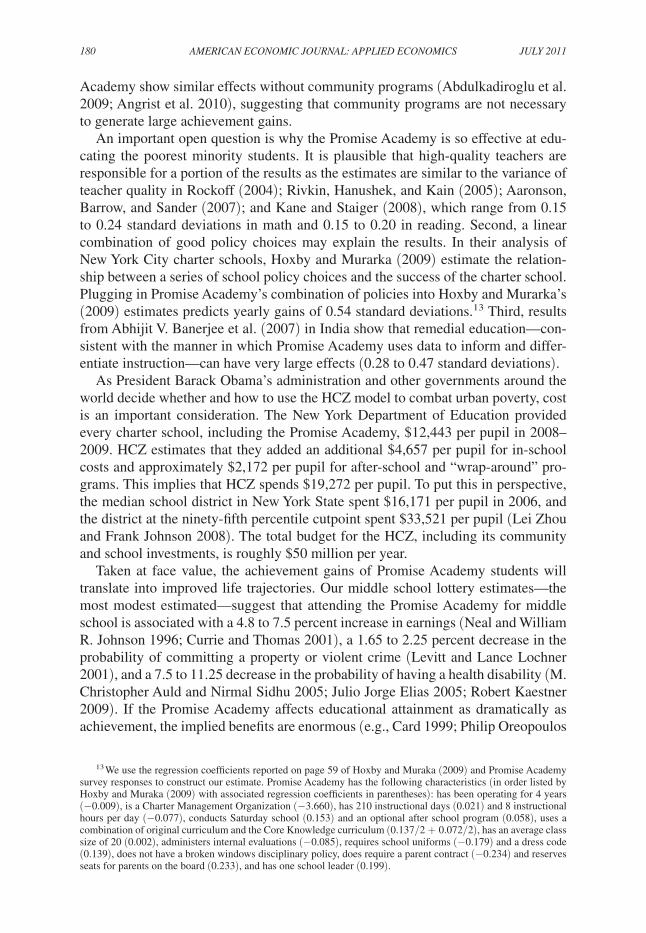
Table 9 presents sibling-peer results in the middle school sample.12 We begin by linking students entered in the Promise Academy middle school lottery to their siblings in other New York City schools, dropping the linked siblings if they are enrolled at the Promise Academy. We define siblings as any two students who share the same last name and address at any point in time. We regress the linked sibling’s outcomes on controls for her grade, year, pre-lottery outcomes, gender, race, eligi-bility for free price lunch, and the number of years a middle school lottery applicant
12 Most siblings of the Promise Academy elementary students are too young to have valid test scores or are also enrolled in the Promise Academy. We therefore concentrate our analysis on siblings of the middle school cohort.
Table 9—Middle School Sibling Results
All Without With Siblinglottery siblings siblings spillovers
Math 0.229*** 0.249*** 0.178*** 0.051(0.037) (0.044) (0.067) (0.119)
ELA 0.047 0.050 0.051 0.087(0.033) (0.038) (0.059) (0.113)
Absences −2.199*** −2.181*** −2.227 0.694(0.650) (0.744) (1.355) (1.559)
On grade level −0.002 −0.009 0.029 −0.022(0.017) (0.021) (0.025) (0.047)
Observations 1,449 1,055 394 512
Notes: This table reports instrumental variable estimates of spillover effects at the Promise Academy Charter School. Column 1 presents our main middle school results. Columns 2 and 3 present main results for the sample of middle school students without and with older siblings. Column 4 presents results of the spillover effect of attending the Promise Academy on sibling outcomes. The sample for column 4 is restricted to older siblings of students entered in either the 2005 or 2006 middle school lottery who had no sibling preference and who had data for all grades. All regressions pool outcomes across grades, and control for grade, year, gender, race, lunch status, previous test scores, previous special education status, and whether the student previously spoke English as second language. The table reports standard errors clustered at the student level in columns 1 and 2, and at the family level in column 3. Test scores are standard-ized to have mean zero and standard deviation one by grade in the full New York City sample.
*** Significant at the 1 percent level. ** Significant at the 5 percent level. * Significant at the 10 percent level.

VoL. 3 No. 3 179DoBBiE AND FryEr: THE HArLEM CHiLDrEN’S ZoNE
spent at the Promise Academy. We instrument for the lottery applicant’s years of enrollment using lottery number. Standard errors are clustered at the family level.
To address concerns that the subset of Promise Academy students with siblings may be different than the subset without siblings, we replicate our main results from Table 3 for both groups. Students with and without siblings experience nearly iden-tical gains to Promise Academy enrollment.
The effect on a sibling of a lottery applicant enrolling at Promise Academy appears to be relatively small on test scores, though large standard errors make sharper con-clusions impossible. Siblings of enrolled lottery winners gain approximately 0.051 (0.119) standard deviations in math and 0.087 (0.113) standard deviations in ELA for each year a student is enrolled at the Promise Academy. Taken at face value, this suggests that there is likely little to no effect on achievement test scores from the combination of the community and student-family programs.
We have provided some evidence that the Promise Academy’s success in rais-ing test scores is unlikely to be driven by the bundle of community services, either directly or indirectly, and that the combined effects of the student-family and com-munity programs on test scores are, at best, modest. This suggests that the Promise Academy charter schools are the main driver of our results. This result is important particularly given the movement across the United States and around the world to develop Children’s Zones with an emphasis on community programs.
V. Discussion
The racial achievement gap in education is one of America’s most pressing social concerns. The typical black 17-year-old reads at the proficiency level of the typi-cal white 13-year-old (Campbell, Hombo, and Mazzeo 2000). On the Scholastic Aptitude Test there is little overlap in the distribution of scores (David Card and Jesse Rothstein 2007). There has been very little progress in closing the achieve-ment gap.
The Promise Academy is successful at boosting achievement in math and ELA in elementary school and math in middle school. The impact of being offered admis-sion into the Promise Academy middle school on ELA achievement is likely posi-tive, but less dramatic. We provide two pieces of evidence—a comparison of lottery winners who live outside the Zone with those who live inside the Zone and a com-parison of siblings of lottery entrants—that suggests our results are driven by the school inputs at the Promise Academy and not the community programs provided by HCZ.
These results are consistent with recent evaluations of the Moving to Opportunity experiment (MTO) and “No Excuses” charter schools similar to the Promise Academy. MTO, which relocated individuals from high-poverty to lower poverty neighborhoods while keeping the quality of schools roughly constant, showed null results for girls and negative results for boys (Lisa Sanbonmatsu et al. 2006; Jeffrey R. Kling, Jeffrey B Liebman and Lawrence F. Katz 2007). This suggests that a better community, as measured by poverty rate, does not significantly raise test scores if school quality remains essentially unchanged. Recent analyses of other “No Excuses” charter schools with many of the same school inputs as the Promise
180 AMEriCAN ECoNoMiC JourNAL: APPLiED ECoNoMiCS JuLy 2011
Academy show similar effects without community programs (Abdulkadiroglu et al. 2009; Angrist et al. 2010), suggesting that community programs are not necessary to generate large achievement gains.
An important open question is why the Promise Academy is so effective at edu-cating the poorest minority students. It is plausible that high-quality teachers are responsible for a portion of the results as the estimates are similar to the variance of teacher quality in Rockoff (2004); Rivkin, Hanushek, and Kain (2005); Aaronson, Barrow, and Sander (2007); and Kane and Staiger (2008), which range from 0.15 to 0.24 standard deviations in math and 0.15 to 0.20 in reading. Second, a linear combination of good policy choices may explain the results. In their analysis of New York City charter schools, Hoxby and Murarka (2009) estimate the relation-ship between a series of school policy choices and the success of the charter school. Plugging in Promise Academy’s combination of policies into Hoxby and Murarka’s (2009) estimates predicts yearly gains of 0.54 standard deviations.13 Third, results from Abhijit V. Banerjee et al. (2007) in India show that remedial education—con-sistent with the manner in which Promise Academy uses data to inform and differ-entiate instruction—can have very large effects (0.28 to 0.47 standard deviations).
As President Barack Obama’s administration and other governments around the world decide whether and how to use the HCZ model to combat urban poverty, cost is an important consideration. The New York Department of Education provided every charter school, including the Promise Academy, $12,443 per pupil in 2008–2009. HCZ estimates that they added an additional $4,657 per pupil for in-school costs and approximately $2,172 per pupil for after-school and “wrap-around” pro-grams. This implies that HCZ spends $19,272 per pupil. To put this in perspective, the median school district in New York State spent $16,171 per pupil in 2006, and the district at the ninety-fifth percentile cutpoint spent $33,521 per pupil (Lei Zhou and Frank Johnson 2008). The total budget for the HCZ, including its community and school investments, is roughly $50 million per year.
Taken at face value, the achievement gains of Promise Academy students will translate into improved life trajectories. Our middle school lottery estimates—the most modest estimated—suggest that attending the Promise Academy for middle school is associated with a 4.8 to 7.5 percent increase in earnings (Neal and William R. Johnson 1996; Currie and Thomas 2001), a 1.65 to 2.25 percent decrease in the probability of committing a property or violent crime (Levitt and Lance Lochner 2001), and a 7.5 to 11.25 decrease in the probability of having a health disability (M. Christopher Auld and Nirmal Sidhu 2005; Julio Jorge Elias 2005; Robert Kaestner 2009). If the Promise Academy affects educational attainment as dramatically as achievement, the implied benefits are enormous (e.g., Card 1999; Philip Oreopoulos
13 We use the regression coefficients reported on page 59 of Hoxby and Muraka (2009) and Promise Academy survey responses to construct our estimate. Promise Academy has the following characteristics (in order listed by Hoxby and Muraka (2009) with associated regression coefficients in parentheses): has been operating for 4 years (−0.009), is a Charter Management Organization (−3.660), has 210 instructional days (0.021) and 8 instructional hours per day (−0.077), conducts Saturday school (0.153) and an optional after school program (0.058), uses a combination of original curriculum and the Core Knowledge curriculum (0.137/2 + 0.072/2), has an average class size of 20 (0.002), administers internal evaluations (−0.085), requires school uniforms (−0.179) and a dress code (0.139), does not have a broken windows disciplinary policy, does require a parent contract (−0.234) and reserves seats for parents on the board (0.233), and has one school leader (0.199).
VoL. 3 No. 3 181DoBBiE AND FryEr: THE HArLEM CHiLDrEN’S ZoNE
2007). The public benefits alone from converting a high school dropout to graduate are more than $250,000.14 Moreover, recent results from Raj Chetty et al. (2010) suggest that long-term benefits of a high-quality education may operate through nontest score channels we do not observe in this paper.
We hope that our analysis provides a sense of optimism for work on the achieve-ment gap. The HCZ initiative along with recent results in Abdulkadiroglu et al. (2009) and Angrist et al. (2010) demonstrate that the right combination of school inputs can be successful. The challenge going forward is to find ways to transport these gains to traditional public schools, so that all children can receive a high qual-ity education.
Appendix
14 See online Appendix C for details on all of the cost-benefit calculations.
Figure A1. Middle School Trends
Notes: This figure displays the fraction of students eligible for free lunch and that are either black or Hispanic, and the average math and ELA test scores for those students. In the Zone refers to the original 24-block Children’s Zone. Out of the Zone refers to students living within 800 meters of the original Zone.
−0.5
0
0.5
1
1.5
2
Standardized test score
0.5
0.75
1
Fra
ctio
n of
stu
dent
s
2000 2002 2004 2006 2008 2010
Sixth grade cohort
In Zone free lunch Out Zone free lunch
In Zone minority Out Zone minority
In Zone test scores Out Zone test scores
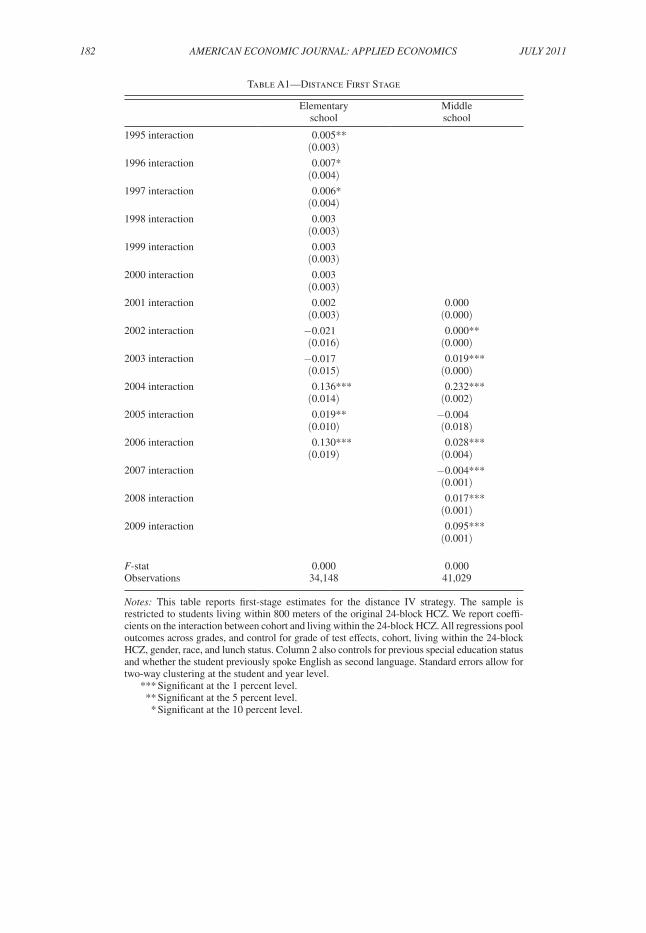
182 AMEriCAN ECoNoMiC JourNAL: APPLiED ECoNoMiCS JuLy 2011
Table A1—Distance First Stage
Elementary Middleschool school
1995 interaction 0.005**(0.003)
1996 interaction 0.007*(0.004)
1997 interaction 0.006*(0.004)
1998 interaction 0.003(0.003)
1999 interaction 0.003(0.003)
2000 interaction 0.003(0.003)
2001 interaction 0.002 0.000(0.003) (0.000)
2002 interaction −0.021 0.000**(0.016) (0.000)
2003 interaction −0.017 0.019***(0.015) (0.000)
2004 interaction 0.136*** 0.232***(0.014) (0.002)
2005 interaction 0.019** −0.004(0.010) (0.018)
2006 interaction 0.130*** 0.028***(0.019) (0.004)
2007 interaction −0.004***(0.001)
2008 interaction 0.017***(0.001)
2009 interaction 0.095***(0.001)
F-stat 0.000 0.000Observations 34,148 41,029
Notes: This table reports first-stage estimates for the distance IV strategy. The sample is restricted to students living within 800 meters of the original 24-block HCZ. We report coeffi-cients on the interaction between cohort and living within the 24-block HCZ. All regressions pool outcomes across grades, and control for grade of test effects, cohort, living within the 24-block HCZ, gender, race, and lunch status. Column 2 also controls for previous special education status and whether the student previously spoke English as second language. Standard errors allow for two-way clustering at the student and year level.
*** Significant at the 1 percent level. ** Significant at the 5 percent level. * Significant at the 10 percent level.
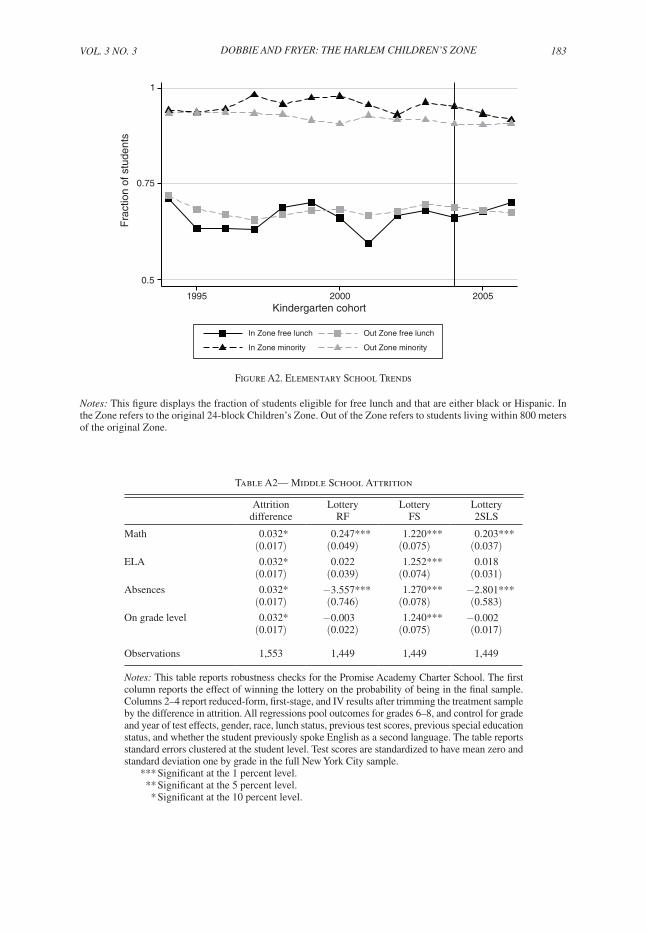
VoL. 3 No. 3 183DoBBiE AND FryEr: THE HArLEM CHiLDrEN’S ZoNE
Table A2— Middle School Attrition
Attrition Lottery Lottery Lotterydifference RF FS 2SLS
Math 0.032* 0.247*** 1.220*** 0.203***(0.017) (0.049) (0.075) (0.037)
ELA 0.032* 0.022 1.252*** 0.018(0.017) (0.039) (0.074) (0.031)
Absences 0.032* −3.557*** 1.270*** −2.801***(0.017) (0.746) (0.078) (0.583)
On grade level 0.032* −0.003 1.240*** −0.002(0.017) (0.022) (0.075) (0.017)
Observations 1,553 1,449 1,449 1,449
Notes: This table reports robustness checks for the Promise Academy Charter School. The first column reports the effect of winning the lottery on the probability of being in the final sample. Columns 2–4 report reduced-form, first-stage, and IV results after trimming the treatment sample by the difference in attrition. All regressions pool outcomes for grades 6–8, and control for grade and year of test effects, gender, race, lunch status, previous test scores, previous special education status, and whether the student previously spoke English as a second language. The table reports standard errors clustered at the student level. Test scores are standardized to have mean zero and standard deviation one by grade in the full New York City sample.
*** Significant at the 1 percent level. ** Significant at the 5 percent level. * Significant at the 10 percent level.
0.5
0.75
1
Fra
ctio
n of
stu
dent
s
1995 2000 2005Kindergarten cohort
In Zone free lunch Out Zone free lunch
In Zone minority Out Zone minority
Figure A2. Elementary School Trends
Notes: This figure displays the fraction of students eligible for free lunch and that are either black or Hispanic. In the Zone refers to the original 24-block Children’s Zone. Out of the Zone refers to students living within 800 meters of the original Zone.
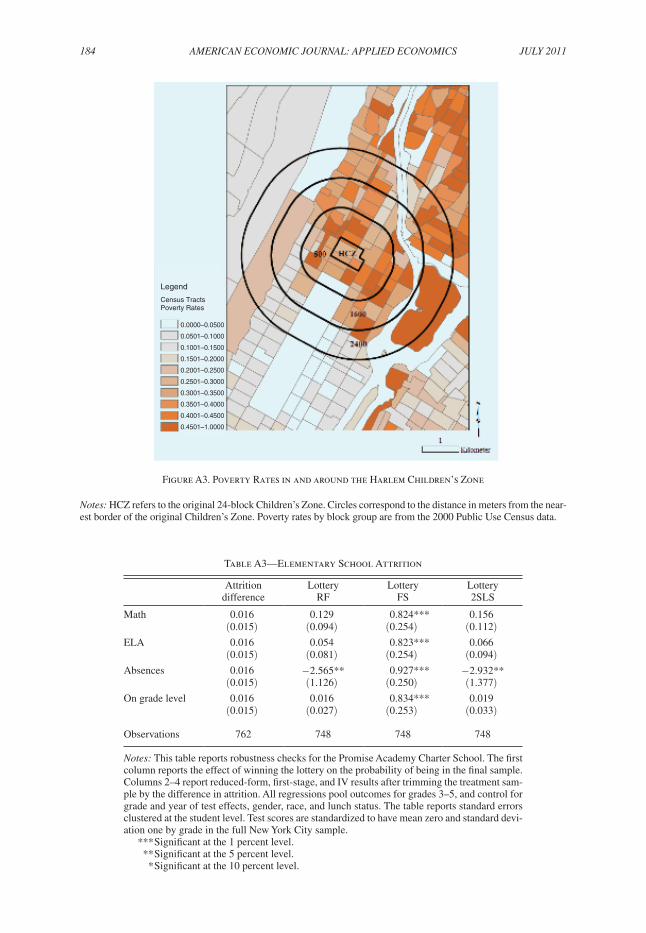
184 AMEriCAN ECoNoMiC JourNAL: APPLiED ECoNoMiCS JuLy 2011
Table A3—Elementary School Attrition
Attrition Lottery Lottery Lotterydifference RF FS 2SLS
Math 0.016 0.129 0.824*** 0.156(0.015) (0.094) (0.254) (0.112)
ELA 0.016 0.054 0.823*** 0.066(0.015) (0.081) (0.254) (0.094)
Absences 0.016 −2.565** 0.927*** −2.932**(0.015) (1.126) (0.250) (1.377)
On grade level 0.016 0.016 0.834*** 0.019(0.015) (0.027) (0.253) (0.033)
Observations 762 748 748 748
Notes: This table reports robustness checks for the Promise Academy Charter School. The first column reports the effect of winning the lottery on the probability of being in the final sample. Columns 2–4 report reduced-form, first-stage, and IV results after trimming the treatment sam-ple by the difference in attrition. All regressions pool outcomes for grades 3–5, and control for grade and year of test effects, gender, race, and lunch status. The table reports standard errors clustered at the student level. Test scores are standardized to have mean zero and standard devi-ation one by grade in the full New York City sample.
*** Significant at the 1 percent level. ** Significant at the 5 percent level. * Significant at the 10 percent level.
Figure A3. Poverty Rates in and around the Harlem Children’s Zone
Notes: HCZ refers to the original 24-block Children’s Zone. Circles correspond to the distance in meters from the near-est border of the original Children’s Zone. Poverty rates by block group are from the 2000 Public Use Census data.
0.0000–0.0500
0.0501–0.1000
0.1001–0.1500
0.1501–0.2000
0.2001–0.2500
0.2501–0.3000
0.3001–0.3500
0.3501–0.4000
0.4001–0.4500
0.4501–1.0000
Legend
Census TractsPoverty Rates
VoL. 3 No. 3 185DoBBiE AND FryEr: THE HArLEM CHiLDrEN’S ZoNE
REFERENCES
Aaronson, Daniel, Lisa Barrow, and William Sander. 2007. “Teachers and Student Achievement in the Chicago Public High Schools.” Journal of Labor Economics, 25(1): 95–135.
Abdulkadiroglu, Atila, Joshua Angrist, Sarah Cohodes, Susan Dynarski, Jon Fullerton, Thomas Kane, and Parag Pathak. 2009. informing the Debate: Comparing Boston’s Charter, Pilot and Tradi-tional Schools. Boston Foundation Report. Boston, January.
Achilles, Charles M., Barbara A. Nye, Jayne B. Zaharias, and B. DeWayne Fulton. 1993. “The Lasting Benefits Study (LBS) in Grades 4 and 5 (1990–1991): A Legacy from Tennessee’s Four-Year (K–3) Class-Size Study (1985–1989), Project STAR.” Tennessee State University, Center for Excellence for Research and Basic Skills Paper 7.
Angrist, Joshua D., Susan M. Dynarski, Thomas J. Kane, Parag A. Pathak, and Christopher R. Walters. 2010. “Who Benefits from KIPP?” National Bureau of Economic Research Working Paper 15740.
Angrist, Joshua D., and Kevin Lang. 2004. “Does School Integration Generate Peer Effects? Evidence from Boston’s Metco Program.” American Economic review, 94(5): 1613–34.
Auld, M. Christopher, and Nirmal Sidhu. 2005. “Schooling, Cognitive Ability and Health.” Health Economics, 14(10): 1019–34.
Banerjee, Abhijit V., Shawn Cole, Esther Duflo, and Leigh Linden. 2007. “Remedying Education: Evidence from Two Randomized Experiments in India.” Quarterly Journal of Economics, 122(3): 1235–64.
Bertrand, Marianne, Esther Duflo, and Sendhil Mullainathan. 2004. “How Much Should We Trust Differences-in-Differences Estimates?” Quarterly Journal of Economics, 119(1): 249–75.
Borman, Geoffrey D., and Gina M. Hewes. 2004. “The Long-Term Effects and Cost-Effectiveness of Success for All.” Educational Evaluation and Policy Analysis, 24(4): 243–66.
Borman, Geoffrey D., Robert E. Slavin, Alan C. K. Cheung, Anne M. Chamberlain, Nancy A. Madden, and Bette Chambers. 2007. “Final Reading Outcomes of the National Randomized Field Trial of Success for All.” American Educational research Journal, 44(3): 701–31.
Campbell, Jay R., Catherine M. Hombo, and John Mazzeo. 2000. NAEP 1999 Trends in Academic Progress: Three Decades of Student Performance. US Department of Education, National Center for Education Statistics. Washington, DC, August.
Card, David. 1999. “The Causal Effect of Education on Earnings.” In Handbook of Labor Econom-ics, Vol. 3A, ed. Orley Ashenfelter and David Card, 1801–63. Amsterdam: Elsevier Science, North-Holland.
Card, David, and Jesse Rothstein. 2007. “Racial Segregation and the Black-White Test Score Gap.” Journal of Public Economics, 91(11–12): 2158–84.
Carter, Samuel Casey. 2000. No Excuses: Lessons from 21 High-Performing, High-Poverty Schools. Washington, DC: Heritage Foundation.
Chenoweth, Karin. 2007. it’s Being Done: Academic Success in unexpected Schools. Cambridge, MA: Harvard Education Press.
Chetty, Raj, John N. Friedman, Nathaniel Hilger, Emmanuel Saez, Diane Whitmore Schanzenbach, and Danny Yagan. 2010. “How Does Your Kindergarten Classroom Affect Your Earnings? Evi-dence From Project STAR.” National Bureau of Economic Research Working Paper 16381.
Coleman, James S., Ernest Q. Campbell, Carol J. Hobson, James McPartland, Alexander M. Mood, Frederic D. Weinfeld, and Robert L. York. 1966. Equality of Educational opportunity. Washington, DC: US Government Printing Office.
Cook, Thomas D., H. David Hunt, and Robert F. Murphy. 2000. “Comer’s School Development Program in Chicago: A Theory-based Evaluation.” American Educational research Journal, 37(2): 535–97.
Cullen, Julie Berry, Brian A. Jacob, and Steven D. Levitt. 2005. “The Impact of School Choice on Student Outcomes: An Analysis of the Chicago Public Schools.” Journal of Public Economics, 89(5–6): 729–60.
Currie, Janet, and Duncan Thomas. 1995. “Does Head Start Make a Difference?” American Economic review, 85(3): 341–64.
Currie, Janet, and Duncan Thomas. 2000. “School Quality and the Longer-Term Effects of Head Start.” Journal of Human resources, 35(4): 755–74.
Currie, Janet, and Duncan Thomas. 2001. “Early Test Scores, School Quality and SES: Longrun Effects on Wage and Employment Outcomes.” In Worker Wellbeing in a Changing Labor Market, ed. Solomon W. Polachek, 103–32. Amsterdam: Elsevier Science.
Decker, Paul T., Daniel P. Mayer, and Steven Glaserman. 2004. “The Effects of Teach for America on Students: Findings from a National Evaluation.” Mathematica Policy Research Report 8792-750. Princeton, June.
186 AMEriCAN ECoNoMiC JourNAL: APPLiED ECoNoMiCS JuLy 2011
Deming, David. 2009. “Early Childhood Intervention and Life-Cycle Skill Development: Evidence from Head Start.” American Economic Journal: Applied Economics, 1(3): 111–34.
Deming, David, Justine Hastings, Thomas Kane, and Douglas Staiger. 2009. “School Choice and Col-lege Attendance: Evidence from Randomized Lotteries.” Unpublished.
Dobbie, Will, and Roland Fryer. 2010. “Are High-Quality Schools Enough to Increase Achievement Among the Poor? Evidence from the Harlem Children’s Zone.” Unpublished.
Dobbie, Will, and Roland Fryer. 2011. “Are High-Quality Schools Enough to Increase Achievement Among the Poor? Evidence from the Harlem Children’s Zone: Dataset.” http://www.aeaweb.org/articles.php?doi=10.1257/app.3.3.158.
Elias, Julio Jorge. 2005. The Effects of Ability and Family Background on Non-monetary Returns to Education. PhD diss. University of Chicago.
Fryer, Roland G., Jr. 2010a. “Financial Incentives and Student Achievement: Evidence from Random-ized Trials.” National Bureau of Economic Research Working Paper 15898.
Fryer, Roland. 2010b. “School-Based Merit Pay: An Experiment in 200 New York City Public Schools.” Unpublished.
Fryer, Roland G., Jr. 2011. “Racial Inequality in the 21st Century: The Declining Significance of Dis-crimination.” In Handbook of Labor Economics, Vol. 4B, ed. Orley Ashenfelter and David Card, 855–972. Amsterdam: North Holland.
Fryer, Roland G., Jr., and Steven D. Levitt. 2004. “Understanding the Black-White Test Score Gap in the First Two Years of School.” review of Economics and Statistics, 86(2): 447–64.
Fryer, Roland G., Jr., and Steven D. Levitt. 2006. “The Black-White Test Score Gap through Third Grade.” American Law and Economics review, 8(2): 249–81.
Fryer, Roland G. Jr., and Steven D. Levitt. Forthcoming. “Testing for Racial Differences in the Mental Ability of Young Children.” American Economic review.
Gleason, Philip, Melissa Clark, Christina Clark Tuttle, Emily Dwyoer, and Marsha Silverberg. 2010. “The Evaluation of Charter School Impacts.” Institute for Educational Sciences, US Department of Education.
Hanushek, Eric A., John F. Kain, Steven G. Rivkin, and Gregory F. Branch. 2005. “Charter School Quality and Parental Decision Making With School Choice.” National Bureau of Economic Research Working Paper 11252.
Harlem Children’s Zone. 2004–2006. “Promise Academy Lottery Records.”Hastings, Justine S., Thomas J. Kane, and Douglas O. Staiger. 2006. “Gender and Performance: Evidence
from School Assignment by Randomized Lottery.” American Economic review, 96(2): 232–36.Hopkins, Kenneth D., and Glenn H. Bracht. 1975. “Ten-Year Stability of Verbal and Nonverbal IQ
Scores.” American Educational research Journal, 12(4): 469–77.Hoxby, Caroline M., and Sonali Murarka. 2009. “Charter Schools in New York City: Who Enrolls and
How They Affect Their Students’ Achievement.” National Bureau of Economic Research Working Paper 14852.
Hoxby, Caroline, and Jonah Rockoff. 2004. “The Impact of Charter Schools on Student Achievement.” www.innovations.harvard.edu/download-doc.html?id=4992.
Jacob, Brian A. 2005. “Accountability, Incentives and Behavior: The Impact of High-Stakes Testing in the Chicago Public Schools.” Journal of Public Economics, 89(5–6): 761–96.
Jacob, Brian A., and Lars Lefgren. 2004. “Remedial Education and Student Achievement: A Regres-sion-Discontinuity Analysis.” review of Economics and Statistics, 86(1): 226–44.
Jacob, Brian A., and Steven D. Levitt. 2003. “Rotten Apples: An Investigation of the Prevalence and Predictors of Teacher Cheating.” Quarterly Journal of Economics, 118(3): 843–77.
Jacob, Brian, and Jens Ludwig. 2008. “Improving Educational Outcomes for Poor Children.” National Bureau of Economic Research Working Paper 14550.
Jencks, Christopher, and Meredith Phillips. 1998. “America’s Next Achievement Test: Closing the Black-White Test Score Gap.” American Prospect, 9(40): 44–53.
Jepsen, Christopher, and Steven Rivkin. 2002. “What is the Tradeoff Between Smaller Classes and Teacher Quality?” National Bureau of Economic Research Working Paper 9205.
Kaestner, Robert. 2009. “Adolescent Cognitive and Non-cognitive Correlates of Adult Health.” National Bureau of Economic Research Working Paper 14924.
Kane, Thomas J., Jonah E. Rockoff, and Douglas O. Staiger. 2008. “What Does Certification Tell Us about Teacher Effectiveness? Evidence from New York City.” Economics of Education review, 27(6): 615–31.
Kane, Thomas J., and Douglas O. Staiger. 2008. “Estimating Teacher Impacts on Student Achieve-ment: An Experimental Evaluation.” National Bureau of Economic Research Working Paper 14607.
Kling, Jeffrey R., Jeffrey B. Liebman, and Lawrence F. Katz. 2007. “Experimental Analysis of Neigh-borhood Effects.” Econometrica, 75(1): 83–119.
VoL. 3 No. 3 187DoBBiE AND FryEr: THE HArLEM CHiLDrEN’S ZoNE
Knudsen, Eric I., James J. Heckman, Judy L. Cameron, and Jack P. Shonkoff. 2006. “Economic, Neu-robiological, and Behavioral Perspectives on Building America’s Future Workforce.” Proceedings of the National Academy of Sciences, 103(27): 10155–62.
Krueger, Alan B. 1999. “Experimental Estimates of Education Production Functions.” Quarterly Jour-nal of Economics, 114(2): 497–532.
Krueger, Alan B., and Diane M. Whitmore. 2001. “The Effect of Attending a Small Class in the Early Grades on College-Test Taking and Middle School Test Results: Evidence from Project STAR.” Economic Journal, 111(468): 1–28.
Krueger, Alan B., and Pei Zhu. 2004. “Another Look at the New York City School Voucher Experi-ment.” American Behavioral Scientist, 47(5): 658–98
Lauer, Patricia A., Motoko Akiba, Stephanie B. Wilkerson, Helen S. Apthorp, David Snow, and Mya L. Martin-Glenn. 2006. “Out-of-School-Time Programs: A Meta-Analysis of Effects for At-Risk Students.” review of Educational research, 76(2): 275–313.
Lavy, Victor. 2009. “Performance Pay and Teachers’ Effort, Productivity, and Grading Ethics.” Ameri-can Economic review, 99(5): 1979–2011.
Levitt, Steven D., and Lance Lochner. 2001. “The Determinants of Juvenile Crime.” In risky Behavior Among youths: An Economic Analysis, ed. Jonathan Gruber, 327–73. Chicago: University of Chi-cago Press.
Ludwig, Jens, and Douglas L. Miller. 2007. “Does Head Start Improve Children’s Life Chances? Evi-dence from a Regression Discontinuity Design.” Quarterly Journal of Economics, 122(1): 159–208.
Ludwig, Jens, and Deborah A. Phillips. 2007. “The Benefits and Costs of Head Start.” National Bureau of Economic Research Working Paper 12973.
Neal, Derek. 2006. “Why Has Black-White Skill Convergence Stopped?” Handbook of Economics of Education, Vol. 1, ed. Eric Hanushek and Finis Welch, 511–76. Amsterdam: North Holland.
Neal, Derek A., and William R. Johnson. 1996. “The Role of Premarket Factors in Black-White Wage Differences.” Journal of Political Economy, 104(5): 869–95.
Nelson, Charles. 2000. “The Neurobiological Bases of Early Intervention.” In Handbook of Early Childhood intervention, second ed., ed. Jack Shonkoff and Samuel J. Meisels, 204–30. New York: Cambridge University Press.
Newport, Elissa L. 1990. “Maturational Constraints on Language Learning.” Cognitive Science, 14(1): 11–28.New York City Department of Education. 1999–2010. “Student Enrollment and State Test Files.”Nye, Barbara, B. DeWayne Fulton, Jayne Boyd-Zaharias, and Van A. Cain. 1995. The Lasting Ben-
efits Study, Eighth Grade Technical report. Center for Excellence for Research in Basic Skills, TN State University. Nashville.
Olds, David. 2006. “The Nurse-Family Partnership.” In The Crisis in youth Mental Health: Early inter-vention Programs and Policies, ed. Norman F. Watt, Catherine Ayoub, Robert H. Bradley, J. E. Puma, and W. A. LeBoeuf, 147–80. Westport, CT: Praeger.
Oreopoulos, Philip. 2007. “Do Dropouts Drop Out Too Soon? Wealth, Health and Happiness from Compulsory Schooling.” Journal of Public Economics, 91(11–12): 2213–29.
Phillips, Meredith, James Crouse, and John Ralph. 1998. “Does the Black-White Test Score Gap Widen after Children Enter School?” In The Black-White Test Score Gap, ed. Christopher Jencks and Meredith Phillips, 229–72. Washington, DC: The Brookings Institute.
Pinker, Steven. 1994. The Language instinct: How the Mind Creates Language. New York: W. Mor-row and Co.
Podgursky, Michael J., and Matthew G. Springer. 2007. “Teacher Performance Pay: A Review.” Jour-nal of Policy Analysis and Management, 26(4): 909–49.
Redd, Zakia, Stephanie Cochran, Elizabeth Hair, and Kristin Moore. 2002. Academic Achievement Programs and youth Development: A Synthesis. Child Trends Report. Washington DC, January.
Rivkin, Steven G., Eric A. Hanushek, and John F. Kain. 2005. “Teachers, Schools, and Academic Achievement.” Econometrica, 73(2): 417–58.
Rockoff, Jonah E. 2004. “The Impact of Individual Teachers on Student Achievement: Evidence from Panel Data.” American Economic review, 94(2): 247–52.
Rouse, Cecilia Elena. 1998. “Private School Vouchers and Student Achievement: An Evaluation of the Milwaukee Parental Choice Program.” Quarterly Journal of Economics, 113(2): 553–602.
Sanbonmatsu, Lisa, Jeffrey R. Kling, Greg J. Duncan, and Jeanne Brooks-Gunn. 2006. “Neighbor-hoods and Academic Achievement: Results from the Moving to Opportunity Experiment.” Journal of Human resources, 41(4): 649–91.
Zhou, Lei, and Frank Johnson. 2008. revenues and Expenditures for Public Elementary and Second-ary School Districts: School year 2005–06 (Fiscal year 2006). National Center for Education Sta-tistics, Institute of Education Sciences, US Department of Education. Washington, DC, July.
This article has been cited by:
1. JEREMY R. LEVINE, WILLIAM JULIUS WILSON. 2013. POVERTY, POLITICS, ANDA “CIRCLE OF PROMISE”: HOLISTIC EDUCATION POLICY IN BOSTON AND THECHALLENGE OF INSTITUTIONAL ENTRENCHMENT. Journal of Urban Affairs no-no.[CrossRef]
2. Douglas Almond, Janet Currie, Mariesa Herrmann. 2012. From infant to mother: Early diseaseenvironment and future maternal health. Labour Economics 19:4, 475-483. [CrossRef]
3. Celeste K. Carruthers. 2012. The Qualifications and Classroom Performance of TeachersMoving to Charter Schools. Education Finance and Policy 7:3, 233-268. [CrossRef]
4. JUSTIN M. WEINHARDT, JEFFREY B. VANCOUVER. 2012. Intelligent Interventions.Industrial and Organizational Psychology 5:2, 179-182. [CrossRef]
5. Joshua D. Angrist, Susan M. Dynarski, Thomas J. Kane, Parag A. Pathak, Christopher R.Walters. 2012. Who Benefits from KIPP?. Journal of Policy Analysis and Management n/a-n/a. [CrossRef]
6. Mark Ginsburg, Kristin Brady, Alexandra Draxler, Steven J. Klees, Paula Luff, HarryAnthony Patrinos, David Edwards. 2012. Public-Private Partnerships and the Global Reformof Education in Less Wealthy Countries—a Moderated Discussion. Comparative EducationReview 56:1, 155-175. [CrossRef]
7. D. J. Deming. 2011. Better Schools, Less Crime?. The Quarterly Journal of Economics .[CrossRef]
8. Christina Clark Tuttle, Philip Gleason, Melissa Clark. 2011. Using lotteries to evaluate schoolsof choice: Evidence from a national study of charter schools. Economics of Education Review. [CrossRef]
9. Celeste K. Carruthers. 2011. New schools, new students, new teachers: Evaluating theeffectiveness of charter schools. Economics of Education Review . [CrossRef]