Embed Size (px)
Citation preview
Are Latin American and Caribbean Biofuel Policies Consistent with their
Comparative Advantages?
Rafael Pérez Peña
Research Assistant, Dept. of Economics, Applied Statistics & International Business
New Mexico State University
Email: [email protected]
Ram N. Acharya
Associate Professor, Dept. of Ag Econ & Ag Business
New Mexico State University
Email: [email protected]
Selected Paper prepared for presentation at the Southern Agricultural Economics Association’s 2015 Annual Meeting, Atlanta, Georgia, January 31-February 3, 2015
Copyright 2015 by [authors]. All rights reserved. Readers may make verbatim copies of this
document for non-commercial purposes by any means, provided that this copyright notice appears
on all such copies.
1. Introduction
Biofuels have been included in the energetic agendas of many economies. In general terms,
the main reasons for biofuel promotion are: reduction on fossil fuel dependency, to encourage
rural development, and to tackle climate change. Some Latin American and Caribbean (LAC)
countries play a significant role in the biofuel dynamic. Pistonesi et al. (2008) mention that
the biofuel production in LAC could be seen as a strategy to achieve environment, energy
and agricultural development. In this sense, some countries in the region have been
developing policies to promote biofuels production based on big countries experiences as a
strategy to develop rural areas by the creation and retention of jobs.
Biofuels are alternative fuels from fossil energies made from biomass. In this context,
bioethanol, biodiesel and biogas constitute these types of alternative energies. Furthermore,
they can be divided in three categories according to their production source. First generation
biofuels are those produced from edible crops, second generation biofuels are produced from
non-edible crops, co-products from processes edible crops, or non-edible parts from edible
crops. Third generation biofuel are those made from algae biomass (Francis and Virgin, 2010,
p.178).
First generation ethanol is the largest scale produced biofuel. In 2011 the global fuel ethanol
production was 22,742 million gallons (Earth Policy, 2012). Brazil and the US are leading
the production of this type of bioenergy. Brazil produced 5,553 million gallons of ethanol
from sugarcane sharing 24% of the global production, while the US produced 14,319 million
gallons of corn based ethanol representing 62%. China, Canada, and the EU produced 9% of
the total share. The rest 5% was produced by all the other countries. In all cases second and
third generation ethanol production is marginal.
In 2011 world biodiesel production was 5,651 million gallons (Idem). The US shared 15%
of the world production with 841 million gallons, followed by Germany which produced 835
million gallons, Argentina shared 13% of the biodiesel production with 729 million gallons,
and Brazil produced 698 million gallons sharing 12%, France was the fifth leading producer
of biodiesel sharing 7% of the total production with 420 million gallons. Soybeans and oil
palm are the major crops from which first-generation biodiesel is produced.
In the Latin American and Caribbean Countries Brazil and Argentina are the leading
producers of ethanol and biodiesel, respectively. In both cases governmental policies
encouraged biofuel production (Sorda et al. 2010). Other countries in the region have
developed a legal framework on biofuels promotion. In this sense, by 2011 seventeen LAC
countries developed policies to encourage first-generation biofuel production.
Argentina, Brazil, Colombia, and Mexico are the four major producers of biofuel feedstock
in LAC. In 2013 these countries reached a production of 859.02 million tons of sugarcane
which represented 88% of the total amount of sugarcane produced in the region. Brazil lead
the sugarcane production with 739.2 million tons of sugarcane, sharing 76% of the regional
production. Mexico produced 61 million tons reaching 6% of the regional production.
Colombia produced 34.87 million tons and Argentina 23.7, representing 4% and 2% of the
production in Latin America and the Caribbean, respectively. Regarding the soybean
production, the LAC countries produced 146.14 million tons in 2013. Brazil leads the
production of this crop sharing 56% reaching a production of 81.69 million tons, Argentina
produced 49.30 million tons representing 34% of the regional production, Mexico and
Colombia’s contribution was marginal, representing 0.2 and 0.1%, respectively.
The objective of this article is to evaluate in what extend the comparative advantages of the
biofuel feedstock explain the biofuel policies in the LAC countries. With this aim the
following section explains the comparative advantage concept from the Ricardian
international trade theory. Additionally, the third section describes the biofuels policy context
in the LAC countries giving special emphasis to Argentina, Brazil, Colombia, and Mexico.
Furthermore, considering these economies there is specified an empirical model over the
period 1991-2011 evaluating two different comparative advantage measures. Then the results
are contrasted and discusses. The last section presents some concluding remarks.
2. Ricardian International Trade Theory
This section presents an overview of the international trade theory in which the article is
based. First there are mentioned the conditions that should be met for two economies to trade
according to the Ricardian theory. Additionally, there is included the concepts of absolute
advantage and comparative advantage.
Ricardian theory states as a necessary condition for international trade to take place the
presence of a comparative cost differential between countries. Considering two goods and
two countries, these costs can be defined as the ratio between individual or absolute costs of
both goods within the same country. Another way to define the relative costs is as the ratio
of the unit cost of the same good in the two countries (Gandolfo, 1998).
The sufficient condition for international trade is that the international terms of trade are
among the comparative costs. Thus, when the two conditions are satisfied, it will be
beneficial for each country to specialize in the production of a good. More specifically, each
country will specialize in the good in which it has the greatest comparative advantage or less
relative disadvantage (Ibidem).
Furthermore, Reinert (2012) explains the concept of absolute advantage as the possibility
that, due to differences in supply conditions, a country can produce a product at a lower price
than other country. In this sense, the comparative advantage is defined as a “situation in
which the autarkic relative price ratio in a country of a good in terms of another is rather
lower than that of other countries in the world” (Reinert 2012, 33).
3. Biofuels Context in the LAC Countries
This section presents the biofuel policy factors found in previous studies for developing
countries, in particular for the LAC countries. Additionally, there is described the
implemented policy instruments or the biofuel targets proposed in those economies.
Argentina, Brazil, Colombia, and Mexico receive special emphasis in this description since
these countries constitute the largest economies of the region.
3.1. Biofuel Policy Drivers in the LAC Economies
In general terms, economies promote biofuel policies to decrease fossil fuels dependency,
capture rural development opportunities in terms of agricultural employment and poverty
reduction, and to tackle climate change reducing GHG emissions (Doku and Di Falco 2012;
Duffey and Stange 2011; Sorda et al. 2010). Furthermore, UNCTAD (2013) identify
technology as a crucial factor for a successful biofuel policy in terms of join efforts between
research centers and universities, private and governmental sector.
In contrast with the developed economies which major objective for biofuel policies
implementation is GHG emission reduction, developing countries, particularly the LAC
economies, promote biofuel policies to generate agricultural employments and to reduce oil
imports (Pistonesi et al. 2008; Doku and Di Falco 2012; Sorda et al. 2010). Additionally,
Doku and Di Falco mention that “when one focuses on large agricultural developing
countries… comparative advantage such as fertile land and an appropriate weather should be
key drivers behind biofuel adoption (2012, 101)”. In this sense, similarly than Doku and Di
Falco (2012), this article focuses on comparative advantages, agricultural employment,
technology, and ability to protect their market.
3.2. Policy Instruments and Biofuel Crops in LAC
Within the LAC countries, Brazil and Argentina are the leading producers of ethanol and
biodiesel, respectively. In both cases governmental policies have promoted biofuel
production (Sorda et al. 2010). Moreover, other countries in the region have developed a
legal framework on biofuels promotion consisting in grants, guaranteed loans and tax
incentives for the production of biofuels, and consumer excise taxes exemption for biofuels
to help achieve targets on biofuel production and consumption (UNCTAD 2006; Valdes
2011). In this sense, by 2011 seventeen LAC countries developed policies to encourage
biofuel production. These countries were: Argentina, Bolivia, Brazil, Chile, Colombia, Costa
Rica, Ecuador, El Salvador, Guatemala, Honduras, Mexico, Nicaragua, Panama, Paraguay,
Peru, Dominican Republic, and Uruguay (Pistonesi et al. 2008).
Argentina, Brazil, Colombia, and Mexico are the four major producers of ethanol feedstock
in the LAC region. In 2013 these countries reached a production of 859.02 million tons of
sugarcane which represented 88% of the total amount of sugarcane produced in the region
(FAO 2013). Brazil lead the sugarcane production with 739.2 million tons of sugarcane,
sharing 76% of the regional production. Mexico produced 61 million tons reaching 6% of
the regional production. Colombia produced 34.87 million tons and Argentina 23.7,
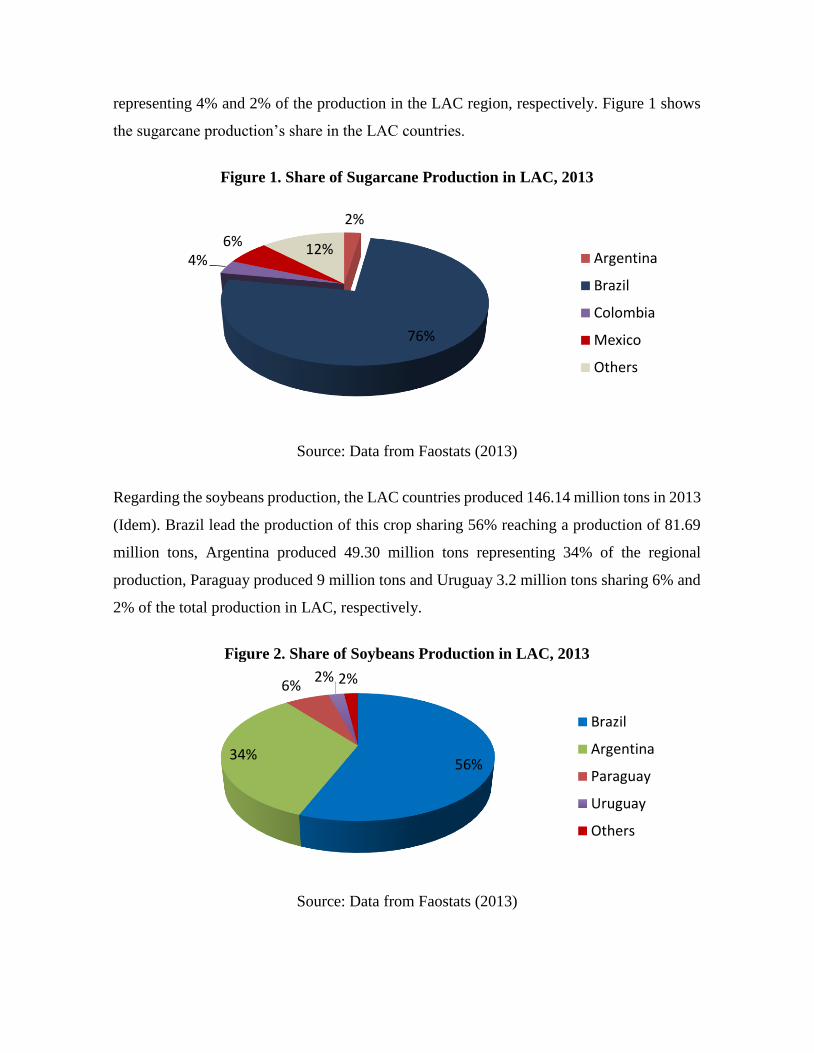
representing 4% and 2% of the production in the LAC region, respectively. Figure 1 shows
the sugarcane production’s share in the LAC countries.
Figure 1. Share of Sugarcane Production in LAC, 2013
Source: Data from Faostats (2013)
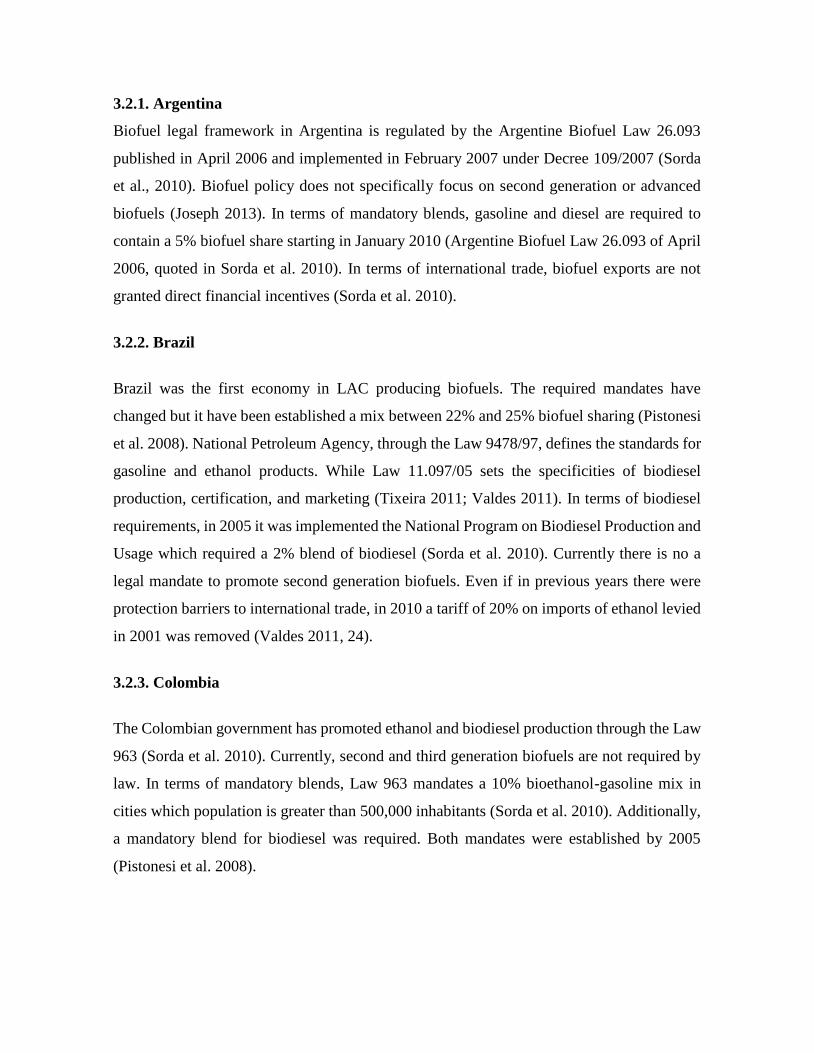
Regarding the soybeans production, the LAC countries produced 146.14 million tons in 2013
(Idem). Brazil lead the production of this crop sharing 56% reaching a production of 81.69
million tons, Argentina produced 49.30 million tons representing 34% of the regional
production, Paraguay produced 9 million tons and Uruguay 3.2 million tons sharing 6% and
2% of the total production in LAC, respectively.
Figure 2. Share of Soybeans Production in LAC, 2013
Source: Data from Faostats (2013)
2%
76%
4%6% 12%
Argentina
Brazil
Colombia
Mexico
Others
56%34%
6%2% 2%
Brazil
Argentina
Paraguay
Uruguay
Others
3.2.1. Argentina
Biofuel legal framework in Argentina is regulated by the Argentine Biofuel Law 26.093
published in April 2006 and implemented in February 2007 under Decree 109/2007 (Sorda
et al., 2010). Biofuel policy does not specifically focus on second generation or advanced
biofuels (Joseph 2013). In terms of mandatory blends, gasoline and diesel are required to
contain a 5% biofuel share starting in January 2010 (Argentine Biofuel Law 26.093 of April
2006, quoted in Sorda et al. 2010). In terms of international trade, biofuel exports are not
granted direct financial incentives (Sorda et al. 2010).
3.2.2. Brazil
Brazil was the first economy in LAC producing biofuels. The required mandates have
changed but it have been established a mix between 22% and 25% biofuel sharing (Pistonesi
et al. 2008). National Petroleum Agency, through the Law 9478/97, defines the standards for
gasoline and ethanol products. While Law 11.097/05 sets the specificities of biodiesel
production, certification, and marketing (Tixeira 2011; Valdes 2011). In terms of biodiesel
requirements, in 2005 it was implemented the National Program on Biodiesel Production and
Usage which required a 2% blend of biodiesel (Sorda et al. 2010). Currently there is no a
legal mandate to promote second generation biofuels. Even if in previous years there were
protection barriers to international trade, in 2010 a tariff of 20% on imports of ethanol levied
in 2001 was removed (Valdes 2011, 24).
3.2.3. Colombia
The Colombian government has promoted ethanol and biodiesel production through the Law
963 (Sorda et al. 2010). Currently, second and third generation biofuels are not required by
law. In terms of mandatory blends, Law 963 mandates a 10% bioethanol-gasoline mix in
cities which population is greater than 500,000 inhabitants (Sorda et al. 2010). Additionally,
a mandatory blend for biodiesel was required. Both mandates were established by 2005
(Pistonesi et al. 2008).
3.2.4. Mexico
The Law of Promotion and Development of Biofuels states the legal framework of biofuel
development in Mexico. This law encourages the promotion of second generation biofuels
but it doesn’t present any specificity regarding the source or a mandate in its consumption.
In terms of international there is not a clear restriction in biofuels imports.
3.2.5. Other LAC countries
Bolivia has a legal framework for renewable fuels regulated by the law 3.152 which was
promoted in 2005. This economy has stated a goal of 2.5% for 2007 reaching a 20% blend
by 2015 (Pistonesi et al. 2008). The following biofuel countries’ policy context were
retrieved from (Biotop 2009, quoted in Duffey and Stange 2011). In this sense, Chile, has a
non-mandatory required mix of 5% for biodiesel and ethanol. Costa Rica seeks to achieve an
ethanol mix of 7.5% and between a 2% and 5% for biodiesel. Ecuador biofuel policy in 2006
stated a target ethanol mix of 5% and 10% for biodiesel. By 2009 Dominican Republic
established a 5% ethanol mix intended to increase until 15% for 2015. El Salvador, had a
goal of an ethanol mix of 10% in all the country’s gasoline. DL-17-85 constitutes
Guatemala’s biofuel legal framework, this country has the government authorization of 5%
of ethanol. In Honduras the Law 144 constitutes the biofuel major which established the
interest of its government in biofuel research, production, and use. In Nicaragua the main
biofuel policy is stated by the Law D-42-2006. Panama, by 2007 has proposed a goal of 10%
ethanol mix. Paraguay, has stipulated a goal of a minimum 18% ethanol-gasoline mix for
2007. In terms of biodiesel this country has a target of 1% in 2007, 3% for 2008, and 5% in
2009 (Pistonesi et al. 2008). Peru, has a goal of 7.8% of ethanol and 2% for biodiesel by 2009
increasing to 5% by 2011 (idem). Finally, Uruguay has a biodiesel requirement stipulated in
2% by 2008 until 2012, and of 5% after 2012. Regarding the ethanol mix it is targeted a 5%
for 2014.
4. Methodology
This section describes the methodology applied to test in what extend the comparative
advantages in the LAC economies explain their biofuel policies. With this aim there are
described the empirical measures for comparative advantage considered for this study. Other
biofuel policy drivers identified in previous studies are considered. Then, there is included
the model specification; in this regard two equations are specified to differentiate between
ethanol and biodiesel policies. The analysis considers Argentina, Brazil, Colombia, and
Mexico for the period 1991 to 2011. The equations are estimated applying OLS by a panel
data method considering fixed effects.
4.1. Empirical Measures for Comparative Advantage
This section describes the empirical approach for the comparative advantage measures
applied to agricultural commodities. In this sense, there is described the comparative
advantage index proposed by Vollrath (1991). Then there is explained the approach to this
concept used by Doku and Di Falco (2012) based on Jumbe et al. (2009).
4.1.1. Revealed Comparative Advantage Index
The first approach to the comparative advantage concept is based on the RCAI proposed by
Vollrath (1991). Sugarcane and soybean are the largest feedstock for ethanol and biodiesel
production, respectively in the LAC countries (Duffey and Stange 2011; Pistonesi et al. 2012;
Sorda et al. 2010). Sugarcane cannot be transported for long distances due to its high
perishable characteristics, thus there is no international commerce for this crop. Sugarcane
producer needs to make the decision between producing ethanol or sugar once the crop is
harvested. In this regard, sugar raw centrifugal is used as a proxy for sugarcane to evaluate
the RCAI for the ethanol equation. Moreover, the RCAI for soybean is computed to evaluate
the comparative advantage for the biodiesel equation.
The equation to calculate the RCAI for commodity a in country i is given by:
𝑅𝐶𝐴𝑎𝑖 = 𝑅𝑋𝐴𝑎
𝑖 − 𝑅𝑀𝐴𝑎𝑖 (1)
Where,
𝑅𝑋𝐴𝑎𝑖 = (𝑋𝑎
𝑖 /𝑋𝑎𝑖 ) / (𝑋𝑎
𝑟/𝑋𝑛𝑟) (2)
𝑅𝑀𝐴𝑎𝑖 = (𝑀𝑎
𝑖 /𝑀𝑎𝑖 ) / (𝑀𝑎
𝑟/𝑀𝑛𝑟) (3)
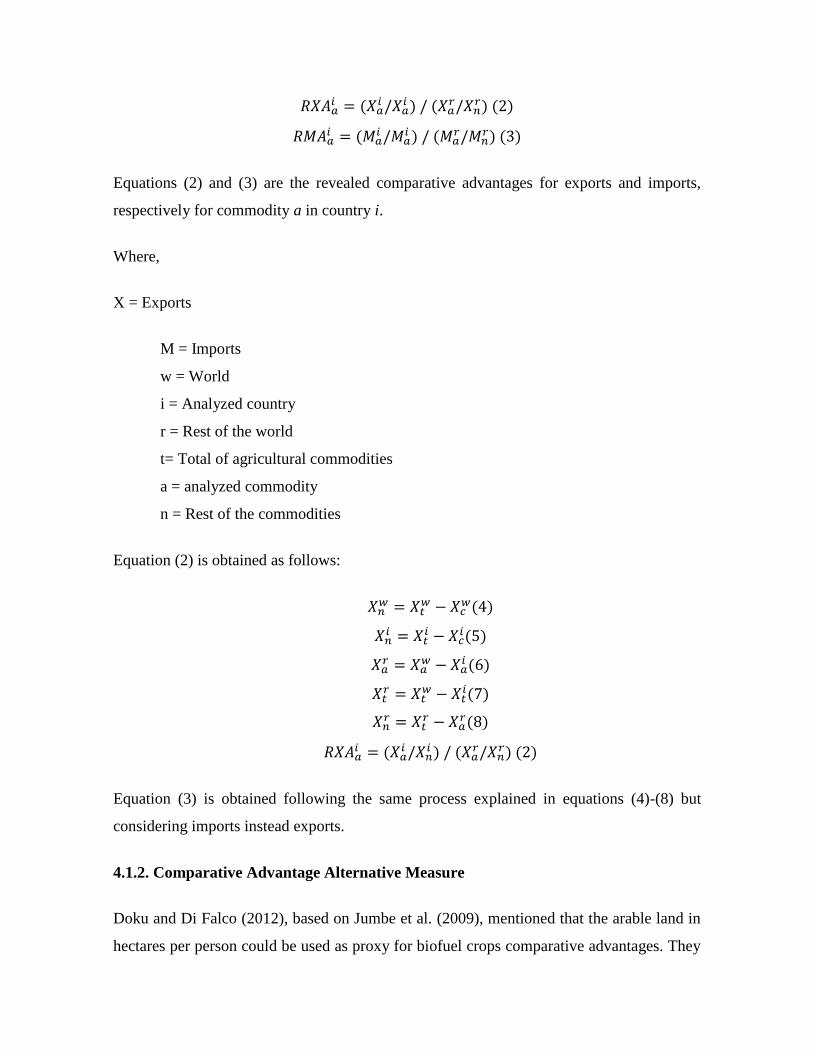
Equations (2) and (3) are the revealed comparative advantages for exports and imports,
respectively for commodity a in country i.
Where,
X = Exports
M = Imports
w = World
i = Analyzed country
r = Rest of the world
t= Total of agricultural commodities
a = analyzed commodity
n = Rest of the commodities
Equation (2) is obtained as follows:
𝑋𝑛𝑤 = 𝑋𝑡
𝑤 − 𝑋𝑐𝑤(4)
𝑋𝑛𝑖 = 𝑋𝑡
𝑖 − 𝑋𝑐𝑖(5)
𝑋𝑎𝑟 = 𝑋𝑎
𝑤 − 𝑋𝑎𝑖 (6)
𝑋𝑡𝑟 = 𝑋𝑡
𝑤 − 𝑋𝑡𝑖(7)
𝑋𝑛𝑟 = 𝑋𝑡
𝑟 − 𝑋𝑎𝑟(8)
𝑅𝑋𝐴𝑎𝑖 = (𝑋𝑎
𝑖 /𝑋𝑛𝑖 ) / (𝑋𝑎
𝑟/𝑋𝑛𝑟) (2)
Equation (3) is obtained following the same process explained in equations (4)-(8) but
considering imports instead exports.
4.1.2. Comparative Advantage Alternative Measure
Doku and Di Falco (2012), based on Jumbe et al. (2009), mentioned that the arable land in
hectares per person could be used as proxy for biofuel crops comparative advantages. They
justify this variable from the relevance of land requirement of biofuel production. More
specifically the authors mention that “in order to engage in biofuel production, agricultural
land is required, as is an appropriate climate, to grow certain crops (Doku and Di Falco 2012,
102)” thus “to measure natural endowment that proxies for comparative advantage we…use
land [in hectares per person] (Idem, 105)”.
4.2. Model Specification
This paper proposes two equations to differentiate between the possible drivers of ethanol
and biodiesel policies. The analysis considers Argentina, Brazil, Colombia and Mexico over
the period: 1991-2011. The variables considered in the model correspond to those proposed
by Doku and Di Falco (2012) and other authors (Pistonesi et al. 2008; Sorda et al. 2010;
UNCTAD 2013). Two sets of equation are estimated considering the comparative advantage
approach from Vollrath (1991) and Doku and Di Falco (2012). Both sets of equations are
estimated by OLS using a panel data method with fixed effects.
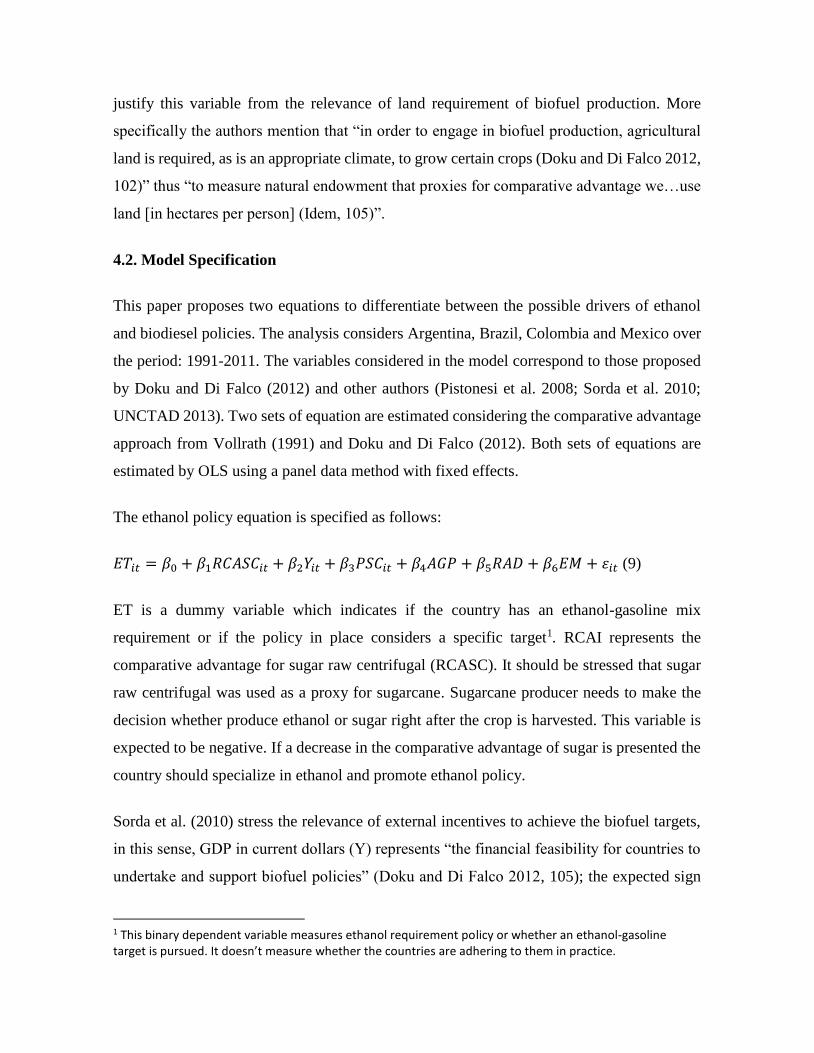
The ethanol policy equation is specified as follows:
𝐸𝑇𝑖𝑡 = 𝛽0 + 𝛽1𝑅𝐶𝐴𝑆𝐶𝑖𝑡 + 𝛽2𝑌𝑖𝑡 + 𝛽3𝑃𝑆𝐶𝑖𝑡 + 𝛽4𝐴𝐺𝑃 + 𝛽5𝑅𝐴𝐷 + 𝛽6𝐸𝑀 + 𝜀𝑖𝑡 (9)
ET is a dummy variable which indicates if the country has an ethanol-gasoline mix
requirement or if the policy in place considers a specific target1. RCAI represents the
comparative advantage for sugar raw centrifugal (RCASC). It should be stressed that sugar
raw centrifugal was used as a proxy for sugarcane. Sugarcane producer needs to make the
decision whether produce ethanol or sugar right after the crop is harvested. This variable is
expected to be negative. If a decrease in the comparative advantage of sugar is presented the
country should specialize in ethanol and promote ethanol policy.
Sorda et al. (2010) stress the relevance of external incentives to achieve the biofuel targets,
in this sense, GDP in current dollars (Y) represents “the financial feasibility for countries to
undertake and support biofuel policies” (Doku and Di Falco 2012, 105); the expected sign
1 This binary dependent variable measures ethanol requirement policy or whether an ethanol-gasoline target is pursued. It doesn’t measure whether the countries are adhering to them in practice.
for this variable is positive. PSC is the sugarcane price in current USD; the expected sign for
this variable is positive. Rural development promotion might be one of the ethanol policy
drivers in the LAC. In this sense, a higher feedstock price would increase the farmers’ profits,
contribute to rural development and thus it can be seen as an incentive to promote ethanol
policies.
AGP is the economically active population in agriculture which is expected to be positive.
UNCTAD (2013) mentions that technology is a relevant biofuel policy driver in the
developing countries. In this sense, technology is approached by research and development
(RAD) expenditure as a percentage of GDP; this variable is expected to be positive.
Furthermore, reduction of oil imports dependency is another possible factor for LAC
economies biofuel policies (Pistonesi et al. 2008; Doku and Di Falco 2012; Sorda et al. 2010).
In this regard, EM represents the net energy imports as a percentage of energy use2. This
variable is expected to be negative. All the variables are evaluated for the country i at the
time t.
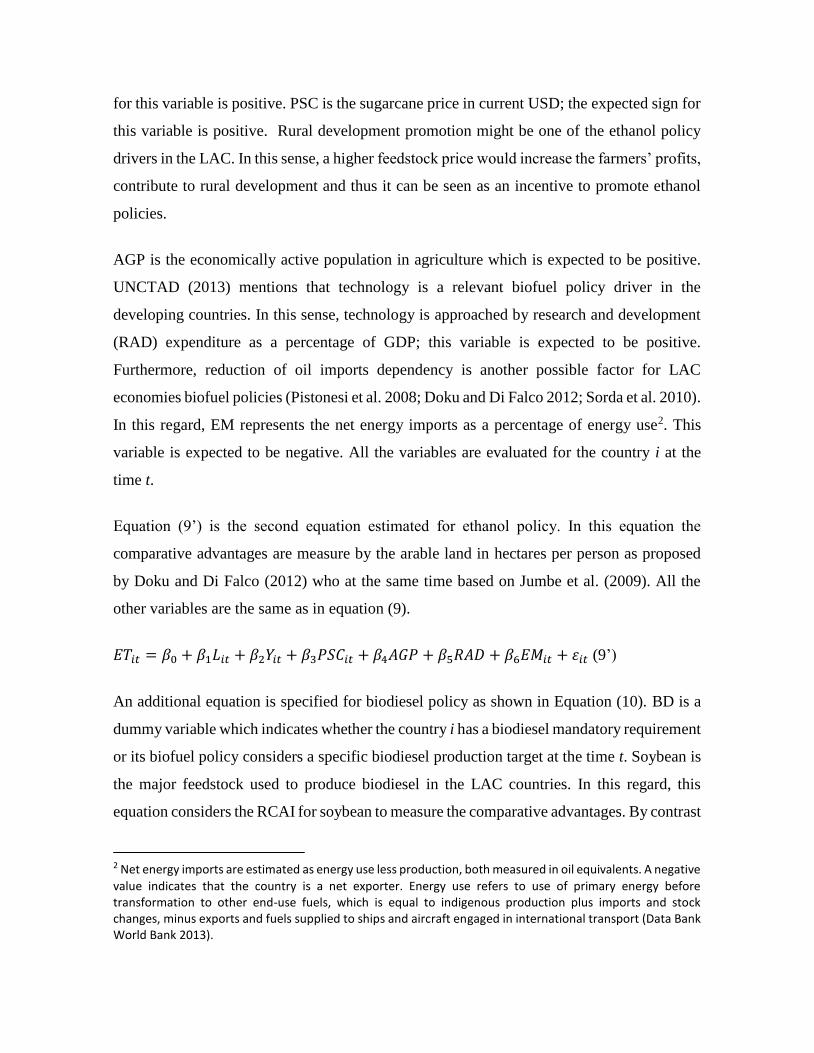
Equation (9’) is the second equation estimated for ethanol policy. In this equation the
comparative advantages are measure by the arable land in hectares per person as proposed
by Doku and Di Falco (2012) who at the same time based on Jumbe et al. (2009). All the
other variables are the same as in equation (9).
𝐸𝑇𝑖𝑡 = 𝛽0 + 𝛽1𝐿𝑖𝑡 + 𝛽2𝑌𝑖𝑡 + 𝛽3𝑃𝑆𝐶𝑖𝑡 + 𝛽4𝐴𝐺𝑃 + 𝛽5𝑅𝐴𝐷 + 𝛽6𝐸𝑀𝑖𝑡 + 𝜀𝑖𝑡 (9’)
An additional equation is specified for biodiesel policy as shown in Equation (10). BD is a
dummy variable which indicates whether the country i has a biodiesel mandatory requirement
or its biofuel policy considers a specific biodiesel production target at the time t. Soybean is
the major feedstock used to produce biodiesel in the LAC countries. In this regard, this
equation considers the RCAI for soybean to measure the comparative advantages. By contrast
2 Net energy imports are estimated as energy use less production, both measured in oil equivalents. A negative
value indicates that the country is a net exporter. Energy use refers to use of primary energy before transformation to other end-use fuels, which is equal to indigenous production plus imports and stock changes, minus exports and fuels supplied to ships and aircraft engaged in international transport (Data Bank World Bank 2013).
with the ethanol policy equation where sugar raw centrifugal was used as a proxy for
sugarcane and thus the interpretation needed to be adapted, soybean represent the principal
biodiesel feedstock. For this reason this variable is expected to be positive.
The price of soybean (PS) is also considered in the biodiesel equation for similar reasons than
in the ethanol equation the sign for this variable is expected to be positive. The rest of the
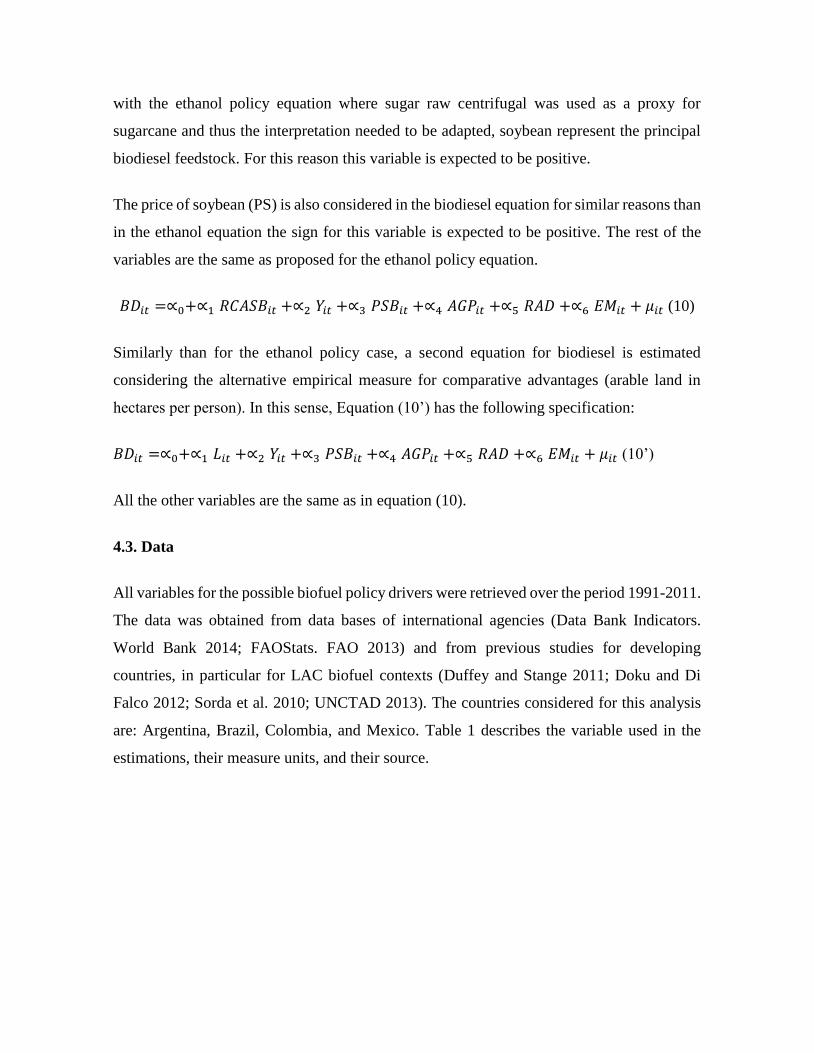
variables are the same as proposed for the ethanol policy equation.
𝐵𝐷𝑖𝑡 =∝0+∝1 𝑅𝐶𝐴𝑆𝐵𝑖𝑡 +∝2 𝑌𝑖𝑡 +∝3 𝑃𝑆𝐵𝑖𝑡 +∝4 𝐴𝐺𝑃𝑖𝑡 +∝5 𝑅𝐴𝐷 +∝6 𝐸𝑀𝑖𝑡 + 𝜇𝑖𝑡 (10)
Similarly than for the ethanol policy case, a second equation for biodiesel is estimated
considering the alternative empirical measure for comparative advantages (arable land in
hectares per person). In this sense, Equation (10’) has the following specification:
𝐵𝐷𝑖𝑡 =∝0+∝1 𝐿𝑖𝑡 +∝2 𝑌𝑖𝑡 +∝3 𝑃𝑆𝐵𝑖𝑡 +∝4 𝐴𝐺𝑃𝑖𝑡 +∝5 𝑅𝐴𝐷 +∝6 𝐸𝑀𝑖𝑡 + 𝜇𝑖𝑡 (10’)
All the other variables are the same as in equation (10).
4.3. Data
All variables for the possible biofuel policy drivers were retrieved over the period 1991-2011.
The data was obtained from data bases of international agencies (Data Bank Indicators.
World Bank 2014; FAOStats. FAO 2013) and from previous studies for developing
countries, in particular for LAC biofuel contexts (Duffey and Stange 2011; Doku and Di
Falco 2012; Sorda et al. 2010; UNCTAD 2013). The countries considered for this analysis
are: Argentina, Brazil, Colombia, and Mexico. Table 1 describes the variable used in the
estimations, their measure units, and their source.
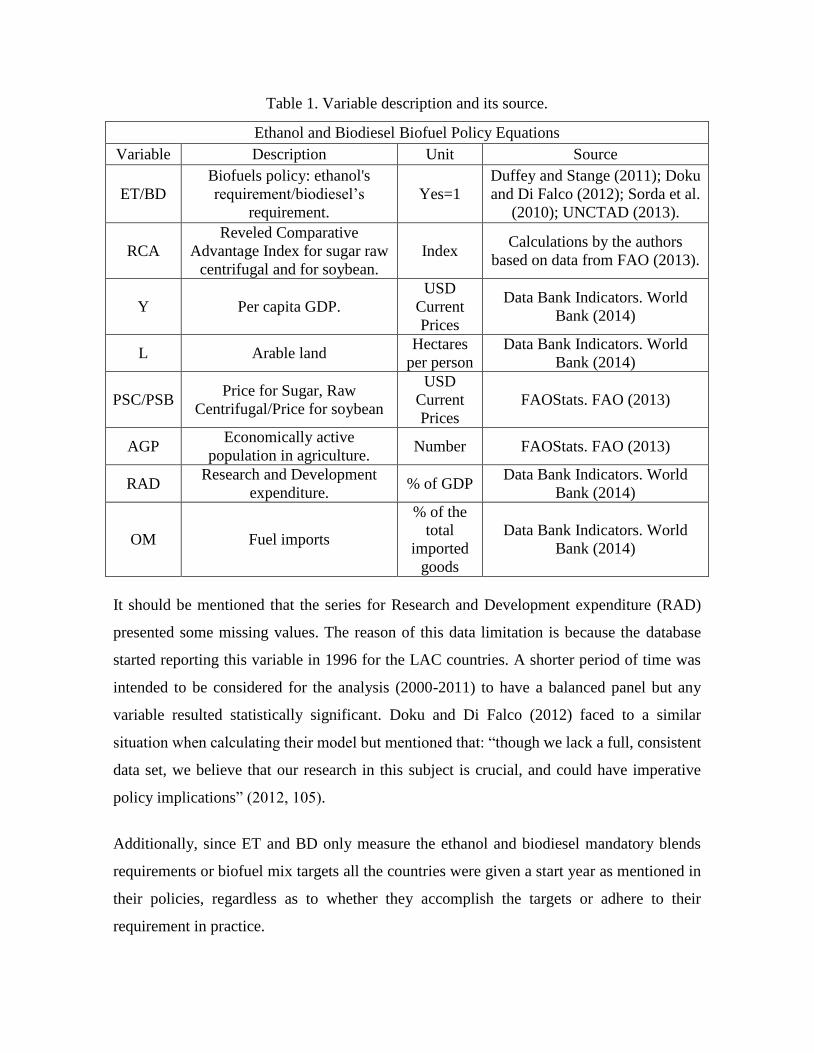
Table 1. Variable description and its source.
Ethanol and Biodiesel Biofuel Policy Equations
Variable Description Unit Source
ET/BD
Biofuels policy: ethanol's
requirement/biodiesel’s
requirement.
Yes=1
Duffey and Stange (2011); Doku
and Di Falco (2012); Sorda et al.
(2010); UNCTAD (2013).
RCA
Reveled Comparative
Advantage Index for sugar raw
centrifugal and for soybean.
Index Calculations by the authors
based on data from FAO (2013).
Y Per capita GDP.
USD
Current
Prices
Data Bank Indicators. World
Bank (2014)
L Arable land Hectares
per person
Data Bank Indicators. World
Bank (2014)
PSC/PSB Price for Sugar, Raw
Centrifugal/Price for soybean
USD
Current
Prices
FAOStats. FAO (2013)
AGP Economically active
population in agriculture. Number FAOStats. FAO (2013)
RAD Research and Development
expenditure. % of GDP
Data Bank Indicators. World
Bank (2014)
OM Fuel imports
% of the
total
imported
goods
Data Bank Indicators. World
Bank (2014)
It should be mentioned that the series for Research and Development expenditure (RAD)
presented some missing values. The reason of this data limitation is because the database
started reporting this variable in 1996 for the LAC countries. A shorter period of time was
intended to be considered for the analysis (2000-2011) to have a balanced panel but any
variable resulted statistically significant. Doku and Di Falco (2012) faced to a similar
situation when calculating their model but mentioned that: “though we lack a full, consistent
data set, we believe that our research in this subject is crucial, and could have imperative
policy implications” (2012, 105).
Additionally, since ET and BD only measure the ethanol and biodiesel mandatory blends
requirements or biofuel mix targets all the countries were given a start year as mentioned in
their policies, regardless as to whether they accomplish the targets or adhere to their
requirement in practice.
5. Results
This section explains the results for the equations specified in the methodology. A total of
four equations were estimated by OLS applying a panel method with fixed effect using the
software GRETL. The first set of equations consists in the regression for ethanol and
biodiesel policies using the RCA from Vollrath (1991) as the comparative advantage.
Furthermore, the second set includes the estimations for these policies considering the
alternative measure for comparative advantage as suggested by Doku and Di Falco (2012)
and Jumbe et al. (2009). The objective of this section is to explain in what extend the
comparative advantages of the biofuel feedstock explain the biofuel policies in the LAC
countries.
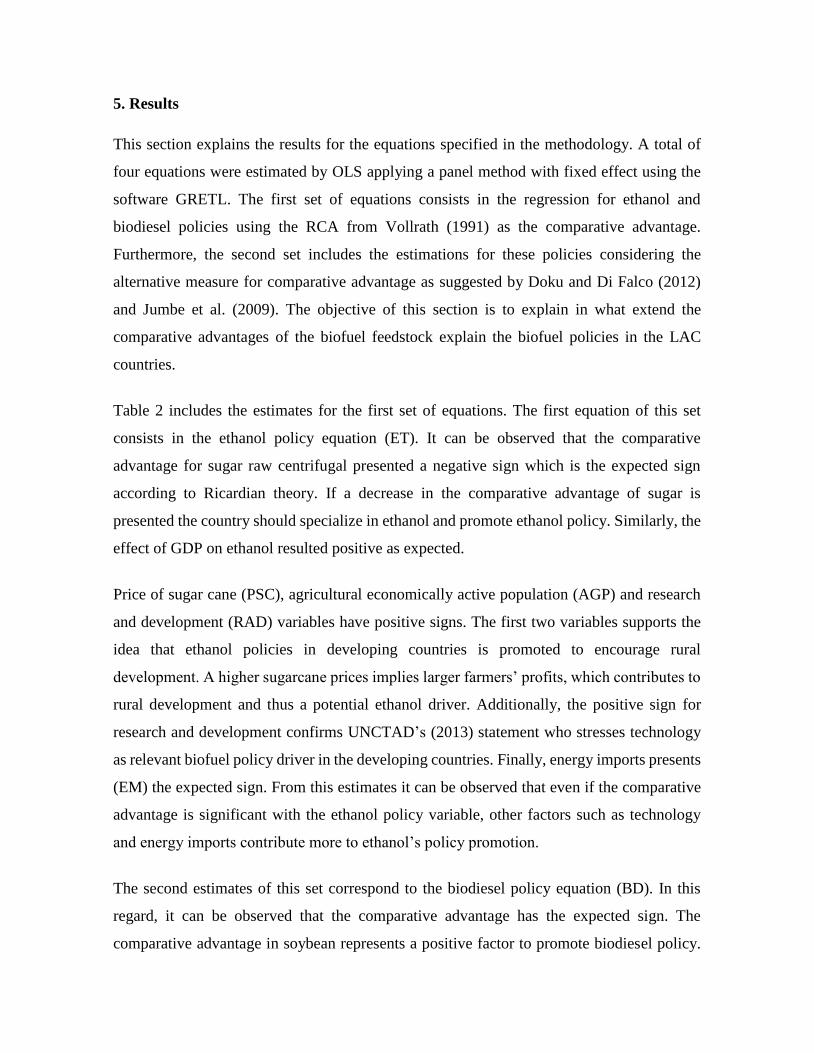
Table 2 includes the estimates for the first set of equations. The first equation of this set
consists in the ethanol policy equation (ET). It can be observed that the comparative
advantage for sugar raw centrifugal presented a negative sign which is the expected sign
according to Ricardian theory. If a decrease in the comparative advantage of sugar is
presented the country should specialize in ethanol and promote ethanol policy. Similarly, the
effect of GDP on ethanol resulted positive as expected.
Price of sugar cane (PSC), agricultural economically active population (AGP) and research
and development (RAD) variables have positive signs. The first two variables supports the
idea that ethanol policies in developing countries is promoted to encourage rural
development. A higher sugarcane prices implies larger farmers’ profits, which contributes to
rural development and thus a potential ethanol driver. Additionally, the positive sign for
research and development confirms UNCTAD’s (2013) statement who stresses technology
as relevant biofuel policy driver in the developing countries. Finally, energy imports presents
(EM) the expected sign. From this estimates it can be observed that even if the comparative
advantage is significant with the ethanol policy variable, other factors such as technology
and energy imports contribute more to ethanol’s policy promotion.
The second estimates of this set correspond to the biodiesel policy equation (BD). In this
regard, it can be observed that the comparative advantage has the expected sign. The
comparative advantage in soybean represents a positive factor to promote biodiesel policy.
GDP seen as the capacity of a country to protect their biodiesel market showed the expected
sign (positive). The price of soybean and technology had both a positive sign. Additionally,
the energy imports variable resulted to be negative. Similar results were obtained to those for
the ethanol equation in terms of comparative advantages; even comparative advantages in
soybean drives the biodiesel policy, other variables explain more the biodiesel policy
promotion.
Table 2. Set of Estimates for ET and BD Considering RCA for Comparative
Advantage Measure
Dependent Variable: ET
Constant RCASC Y PSC AGP RAD EM
-3.911* -0.0458** 7.27E-13* 0.0075688 4.26E-04 1.857*** -0.006***
(2.2229) (0.0210) (3.75E-13) (0.005) (0.0003) (0.6235) (0.0018)
R-squared 0.778
Dependent Variable: BD
Constant RCASB Y PSB AGP RAD EM
-3.903** 0.0213** 6.51E-13** 0.0009* 0.0003 2.327*** -0.006***
(1.5744) (0.0093) (3.1018E-13) (0.0005) (0.0002) (0.6210) 0.001
R-squared 0.744
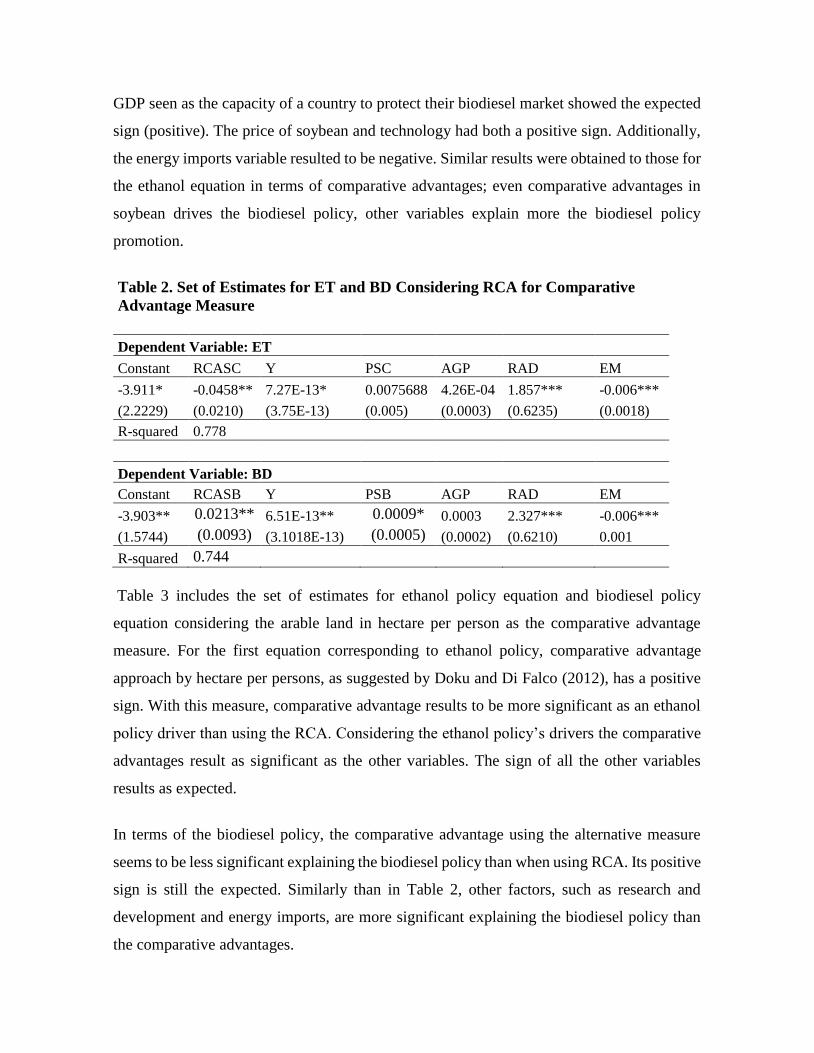
Table 3 includes the set of estimates for ethanol policy equation and biodiesel policy
equation considering the arable land in hectare per person as the comparative advantage
measure. For the first equation corresponding to ethanol policy, comparative advantage
approach by hectare per persons, as suggested by Doku and Di Falco (2012), has a positive
sign. With this measure, comparative advantage results to be more significant as an ethanol
policy driver than using the RCA. Considering the ethanol policy’s drivers the comparative
advantages result as significant as the other variables. The sign of all the other variables
results as expected.
In terms of the biodiesel policy, the comparative advantage using the alternative measure
seems to be less significant explaining the biodiesel policy than when using RCA. Its positive
sign is still the expected. Similarly than in Table 2, other factors, such as research and
development and energy imports, are more significant explaining the biodiesel policy than
the comparative advantages.
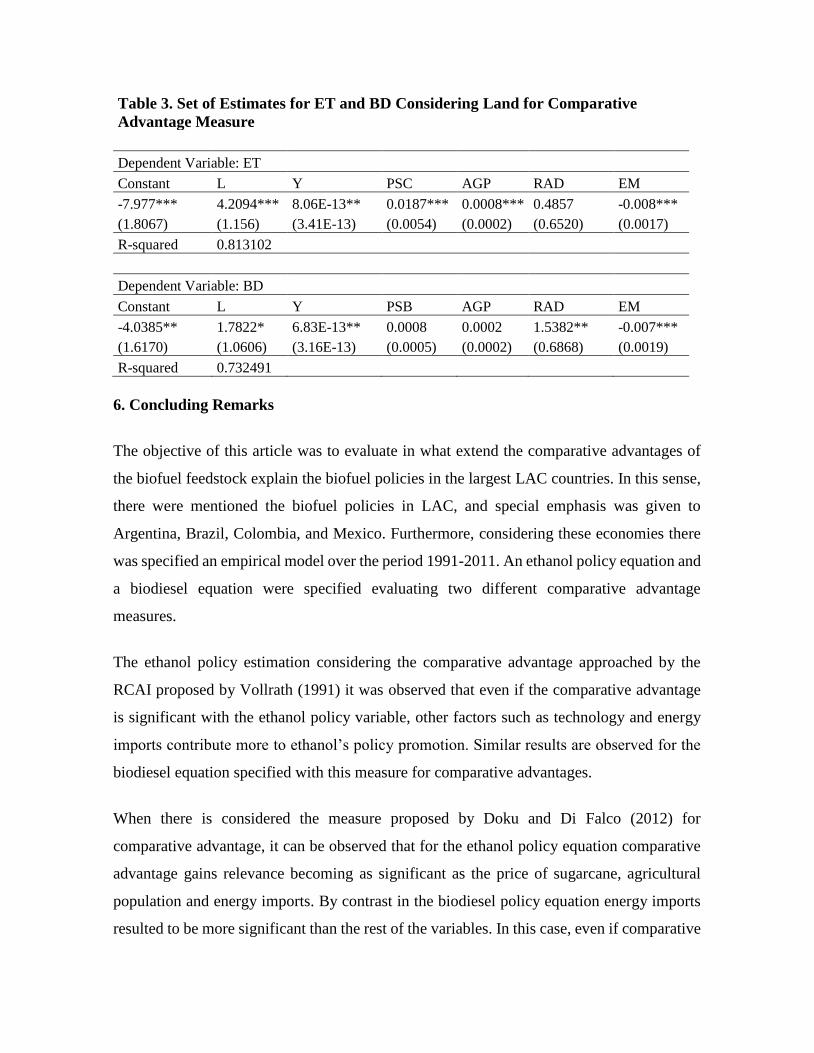
Table 3. Set of Estimates for ET and BD Considering Land for Comparative
Advantage Measure
Dependent Variable: ET
Constant L Y PSC AGP RAD EM
-7.977*** 4.2094*** 8.06E-13** 0.0187*** 0.0008*** 0.4857 -0.008***
(1.8067) (1.156) (3.41E-13) (0.0054) (0.0002) (0.6520) (0.0017)
R-squared 0.813102
Dependent Variable: BD
Constant L Y PSB AGP RAD EM
-4.0385** 1.7822* 6.83E-13** 0.0008 0.0002 1.5382** -0.007***
(1.6170) (1.0606) (3.16E-13) (0.0005) (0.0002) (0.6868) (0.0019)
R-squared 0.732491
6. Concluding Remarks
The objective of this article was to evaluate in what extend the comparative advantages of
the biofuel feedstock explain the biofuel policies in the largest LAC countries. In this sense,
there were mentioned the biofuel policies in LAC, and special emphasis was given to
Argentina, Brazil, Colombia, and Mexico. Furthermore, considering these economies there
was specified an empirical model over the period 1991-2011. An ethanol policy equation and
a biodiesel equation were specified evaluating two different comparative advantage
measures.
The ethanol policy estimation considering the comparative advantage approached by the
RCAI proposed by Vollrath (1991) it was observed that even if the comparative advantage
is significant with the ethanol policy variable, other factors such as technology and energy
imports contribute more to ethanol’s policy promotion. Similar results are observed for the
biodiesel equation specified with this measure for comparative advantages.
When there is considered the measure proposed by Doku and Di Falco (2012) for
comparative advantage, it can be observed that for the ethanol policy equation comparative
advantage gains relevance becoming as significant as the price of sugarcane, agricultural
population and energy imports. By contrast in the biodiesel policy equation energy imports
resulted to be more significant than the rest of the variables. In this case, even if comparative
advantages were a driver other variables explained more the biodiesel policies. It should be
mentioned that using this alternative measure, the comparative advantage factor presents a
larger effect in both, the ethanol and biodiesel equation, than using the RCA approach. Even
if the comparative advantage represent an important driver in the biofuel policy of the LAC4
countries, other factors are more significant explaining the ethanol and biodiesel policies.
7. Reference
Andrade, R. M. T., and Andrew Miccolis. Policies and institutional and legal frameworks in
the expansion of Brazilian biofuels. CIFOR, 2011.
Assessment on Technical Opportunities and Research Needs for Latin America, August,
(2009).
BioTop. Biofuels policies and legislation in Latin America, WP 2 – Task 2.6 – D2.4. Biofuels
(2009)
Doku, Angela, and Salvatore Di Falco. "Biofuels in developing countries: Are comparative
advantages enough?." Energy Policy 44 (2012): 101-117.
Duffey Anna, 2011, “Estudio regional sobre economía de los biocombustibles 2010: temas
clave para los países de América Latina y el Caribe”,
http://www.cepal.org/ddpe/agenda/2/42932/EstEconomiaBiocombustiblesDialPol.p
df.
Duffey, Annie, and Daniela Funge, Estudio regional sobre la economía de los
biocombustibles 2010: temas clave para los países de América Latina y el Caribe,
Dialogo de Políticas sobre desarrollo institucional e innovacion en biocombustibles
en América Latina y el Caribe, (March 2011): 1-100.
Earth Policy Institute, Climate Energy and Transportation, (2013): http://www.earth-
policy.org/data_center/C23, consulted on January 12, 2015.
FAO, Food and Agriculture Organization, FAOSTAT, Roma, (2012):
http://faostat.fao.org/site/703/DesktopDefault.aspx?PageID=703#ancor, consulted
on January 13, 2015.
Food and Agriculture Organization, FAO, 2012, FAOSTAT, Rome.
http://faostat.fao.org/site/703/DesktopDefault.aspx?PageID=703#ancor
Gandolfo Giancarlo, International Trade Theory and Policy, (Germany: Springer, 1998).
Johnson, Francis X., and Ivar Virgin. "Future trends in biomass resources for food and fuel."
(2010).
Joseph, Ken. “Argentina Biofuels Annual 2013”. Global Agricultural Information Network,
USDA Foreign Agricultural Service, (2013).
Jumbe, C.B.L.,Msiska, F.B.M.,Madjera,M., “Biofuels development in Sub-Saharan Africa:
are the policies conducive?” Energy Policy 37, (2009): 4980–4986.
Pistonesi Hector, Gustavo Nadal, Victor Bravo, Daniel Bouille, 2008, The contribution of
Biofuels to the Sustainability of Development in Latin America and the Caribbean:
Elements for Formulating Policy, Economic Comission for Latin America and the
Caribbean.
Reinert, Keneth, An Introduction to International Economics, (Nueva York: Cambridge
University Press, 2012).
Sorda Giovanni, Martin Banse, Caludia Kemfert, 2010, An overview of biofuel policies
across the world, Energy Policy, pp. 6977-6988.
Sorda, Giovanni, Martin Banse, and Claudia Kemfert. "An overview of biofuel policies
across the world." Energy policy 38, no. 11 (2010): 6977-6988.
UNCTAD, United Nations Conference on Trade and Development. The State of the Biofuels
Market (2013).
United Nations Conference on Trade and Development, UNCTAD, 2014, “The State of the
Biofuels Market: Regulatory, Trade and Development Perspective”,
http://unctad.org/en/PublicationsLibrary/ditcted2013d8_en.pdf.
Valdes, Constanza. "Brazil’s booming agriculture faces obstacles." Amber Waves 4, no. 5
(2006): 28-35.
Vollrath, Thomas L. "A theoretical evaluation of alternative trade intensity measures of
revealed comparative advantage." Weltwirtschaftliches Archiv 127, no. 2 (1991): 265-
280.
World Bank, 2014, World Data Bank, Washington D.C.
http://databank.worldbank.org/data/views/variableSelection/selectvariables.aspx?so
urce=world-development-indicators#.