Embed Size (px)
Citation preview
Are Longevity Risk and Market Risk Independent? A Review of Theories and Empirical Evidence
Bowen Yang, Jackie Li, Uditha Balasooriya
Outline
Introduction
Motivation of the study
Review of longevity and macroeconomy
Review of longevity and asset returns
Country analysis
Conclusion

Trends in mortality/longevity
60
65
70
75
80
85
USA UK FRA NOR JAP AUS
Life expectancy
1965
1975
1985
1995
2005
Source: Human Mortality Database
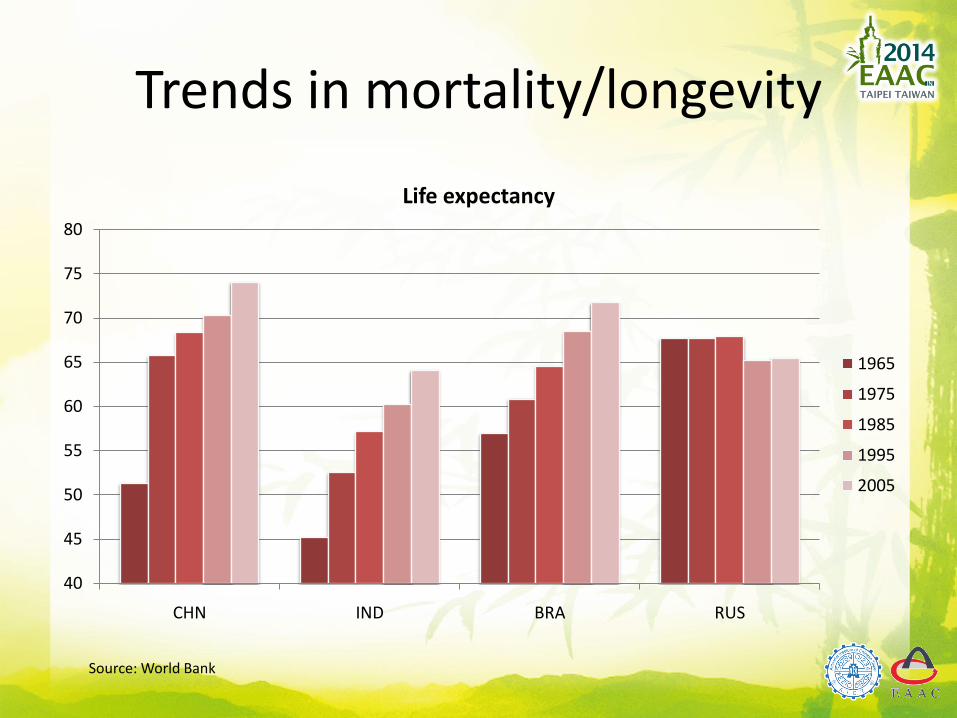
Trends in mortality/longevity
40
45
50
55
60
65
70
75
80
CHN IND BRA RUS
Life expectancy
1965
1975
1985
1995
2005
Source: World Bank
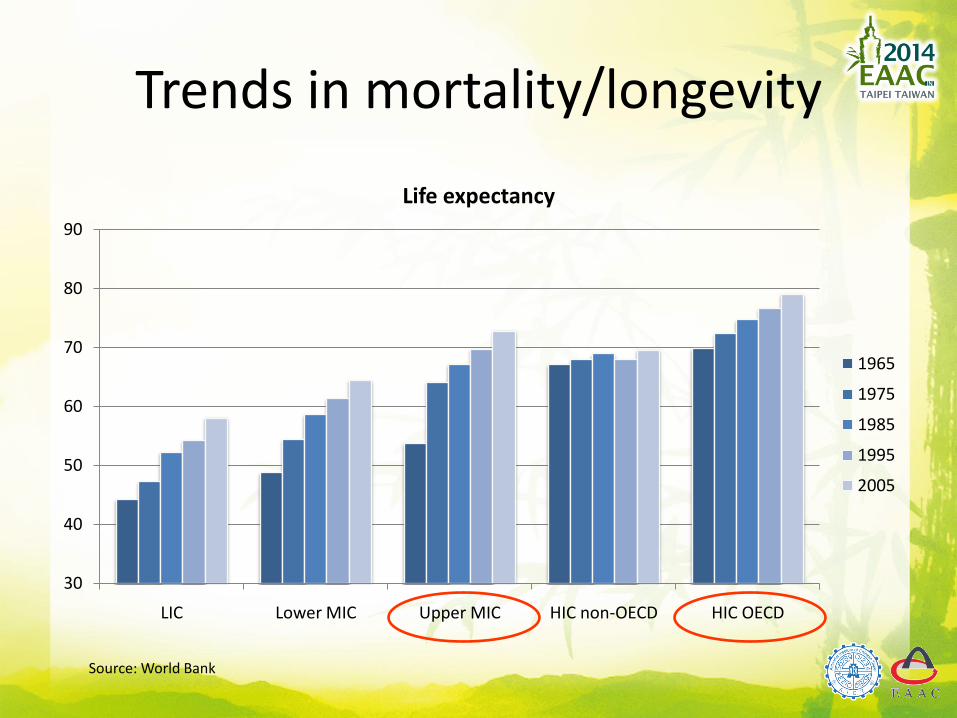
Trends in mortality/longevity
30
40
50
60
70
80
90
LIC Lower MIC Upper MIC HIC non-OECD HIC OECD
Life expectancy
1965
1975
1985
1995
2005
Source: World Bank
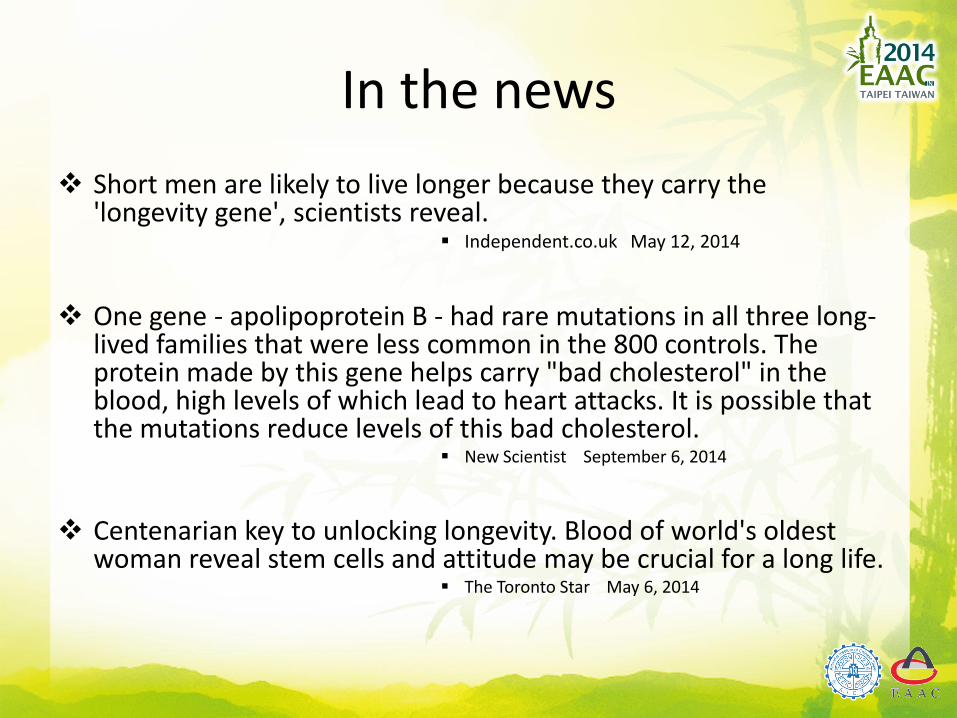
In the news
Short men are likely to live longer because they carry the 'longevity gene', scientists reveal.
Independent.co.uk May 12, 2014
One gene - apolipoprotein B - had rare mutations in all three long-lived families that were less common in the 800 controls. The protein made by this gene helps carry "bad cholesterol" in the blood, high levels of which lead to heart attacks. It is possible that the mutations reduce levels of this bad cholesterol.
New Scientist September 6, 2014
Centenarian key to unlocking longevity. Blood of world's oldest woman reveal stem cells and attitude may be crucial for a long life.
The Toronto Star May 6, 2014
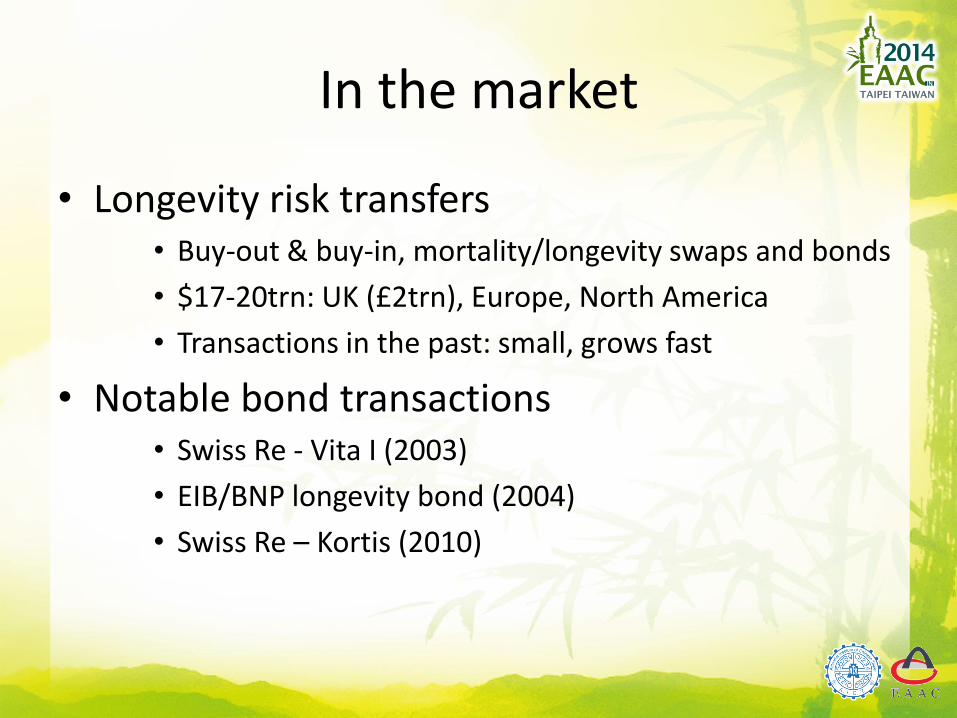
In the market
• Longevity risk transfers• Buy-out & buy-in, mortality/longevity swaps and bonds
• $17-20trn: UK (£2trn), Europe, North America
• Transactions in the past: small, grows fast
• Notable bond transactions• Swiss Re - Vita I (2003)
• EIB/BNP longevity bond (2004)
• Swiss Re – Kortis (2010)

Source: www.artemis.bm
Issuer Cedent Risks / Perils covered Size Date
Atlas IX Capital Limited (Series 2013-1)SCOR Global Life SE
Extreme mortality $180m Sep-2013
Mythen Re Ltd. (Series 2012-2) Swiss Re U.S. hurricane, UK extreme mortality $200m Nov-2012
Vita Capital V Ltd. Swiss Re Extreme mortality $275m Jul-2012
Vecta I Ltd. Aurigen ReEmbedded value securitization of life insurance mortality and lapse risk
C$120m Dec-2011
Vita Capital IV Ltd. (Series V and VI) Swiss Re Extreme mortality $180m Jul-2011
Kortis Capital Ltd. Swiss Re Longevity risk $50m Dec-2010
Vita Capital IV Ltd. Swiss Re Extreme mortality $300m Oct-2010
Nathan Ltd. Munich Re Extreme mortality $100m Feb-2008
Vita Capital III Ltd. Swiss Re Extreme mortality $705m Jan-2007
Vita Capital II Ltd. Swiss Re Extreme mortality $362m Apr-2005
Vita Capital Ltd. Swiss Re Extreme mortality $400m Dec-2003
Why study the dependency?
• Pricing of longevity products
– Risk-neutral pricing
• Wang transform (Wang, 2000; Lin and Cox, 2005;)
• Maximum entropy principle (Kogure and Kurachi, 2010, 2014; Li, 2012;)
– Risk-averse pricing
• Cubic model (Chen and Cummins, 2010)
Longevity and Macro-economy
• Overlapping-generations (OLG) model• Continuous-time vs. discrete-time
• Agent optimizing the utility function
• Flexible, varying focuses
• Results are mixed depending on the model setup and assumptions
• Positive association
• Negative association
• Hump-shaped relationship
• Depending on the type of social security system
Longevity and Macro-economy
• Empirical setup• Cross-sectional regression (Zhang et al., 2005)
• Panel regression (Bloom et al., 2007; Li et al., 2007)
• Correlation studies (Hanewald, 2012)
• Results are supportive of the following• Hump-shaped relationship
• Contingent on the type of social security system
Longevity and Asset Returns
• The channel of risk aversion• Bakshi and Chen (1994); Brooks (2002)
• Age-specific asset demand• Bergatino (1998); Poterba (2001)
• Life-cycle models• Yoo (1994); Abel (1999, 2001);
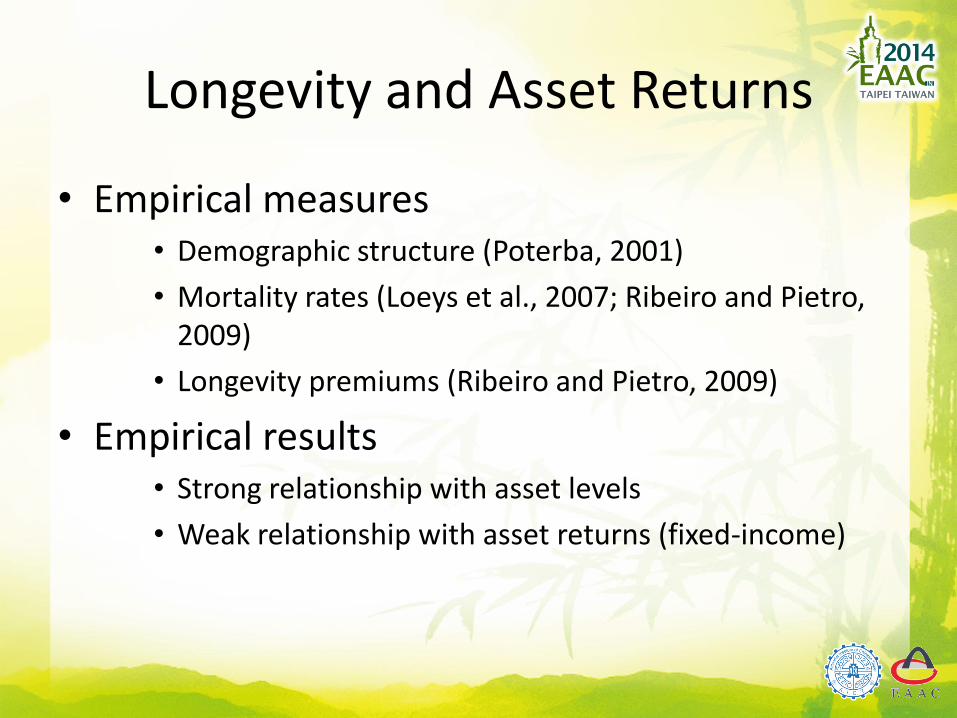
Longevity and Asset Returns
• Empirical measures• Demographic structure (Poterba, 2001)
• Mortality rates (Loeys et al., 2007; Ribeiro and Pietro, 2009)
• Longevity premiums (Ribeiro and Pietro, 2009)
• Empirical results• Strong relationship with asset levels
• Weak relationship with asset returns (fixed-income)
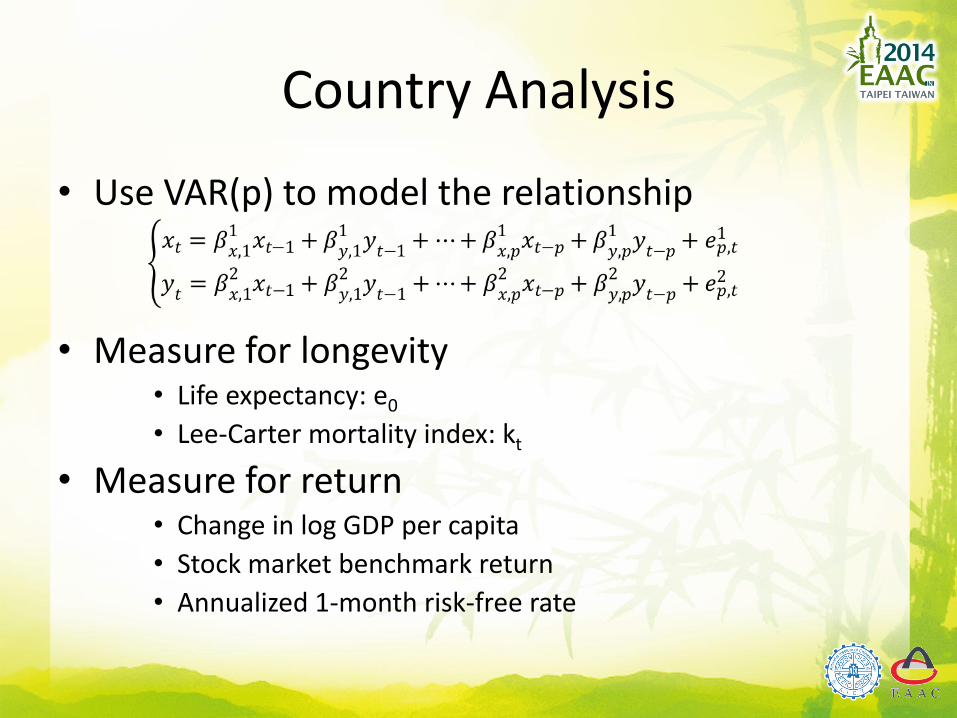
Country Analysis
• Use VAR(p) to model the relationship
• Measure for longevity• Life expectancy: e0
• Lee-Carter mortality index: kt
• Measure for return• Change in log GDP per capita
• Stock market benchmark return
• Annualized 1-month risk-free rate

Country Analysis
• Data source• World Bank Development Indicator
• Madison Project Database
• Bloomberg
• Datastream
• Kenneth French market return series
• Human Mortality Database
• Time period• The maximum length is 1960-2010
• Some series do not span the whole range
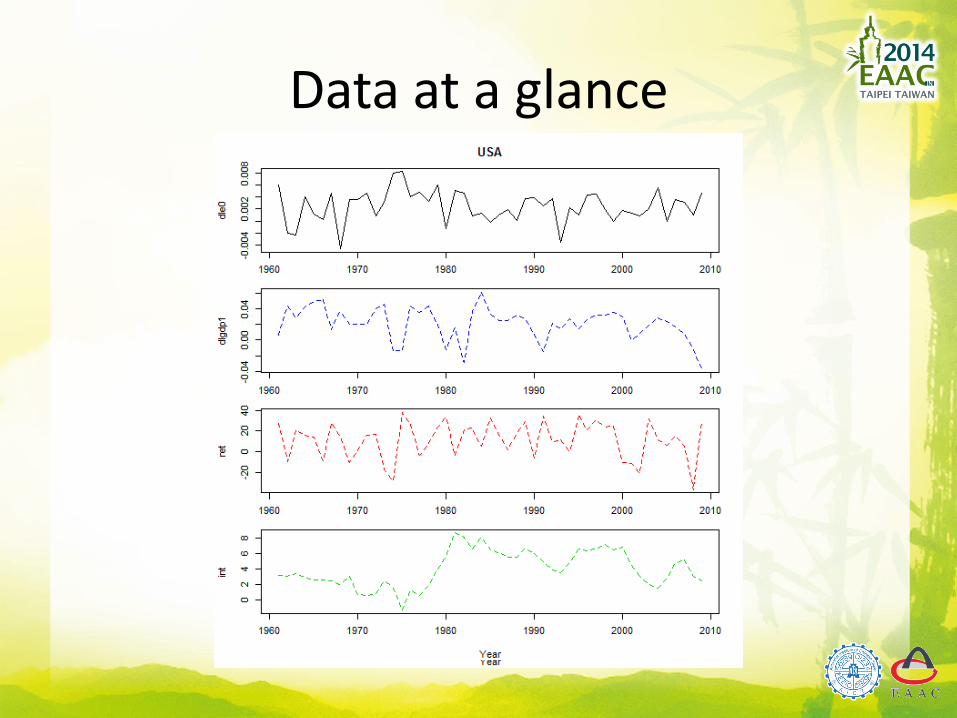
Data at a glance
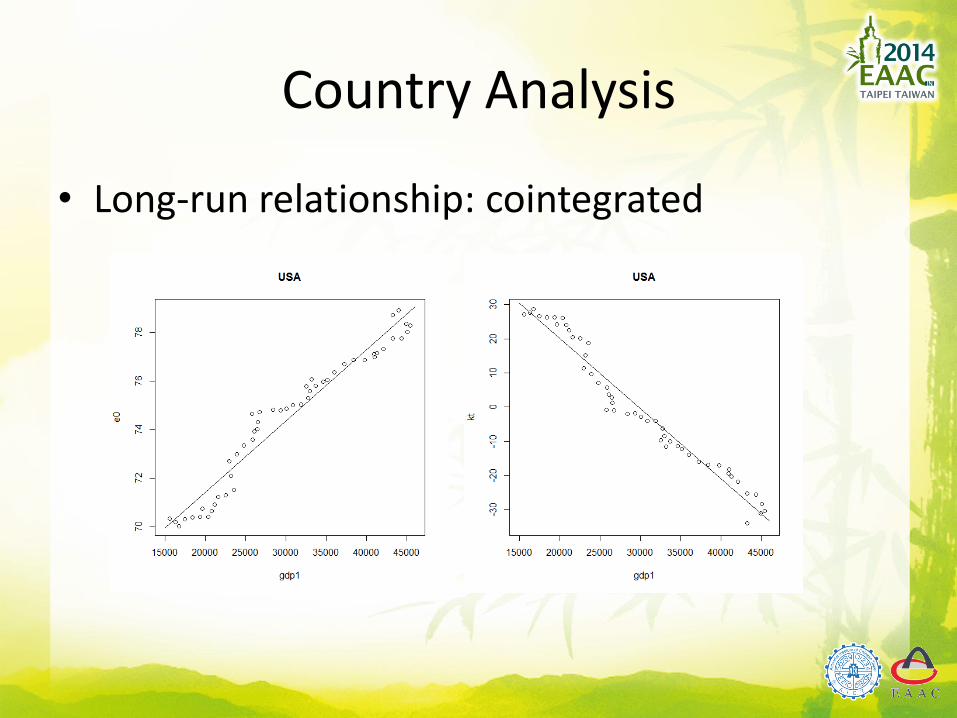
Country Analysis
• Long-run relationship: cointegrated
Country Analysis
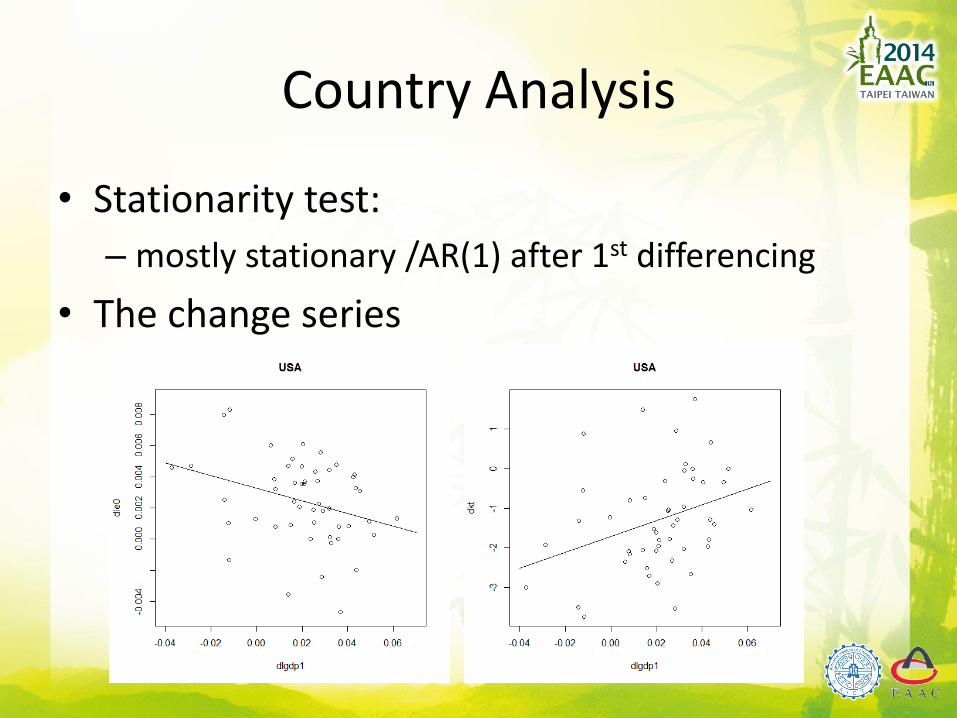
• Stationarity test:
– mostly stationary /AR(1) after 1st differencing
• The change series
USA CAN FRA GER UK JAP AUS SWZ NOR SWD
dle0 on dlgdp1 2+ 8+ 2- 2+ 9- 2- 1-
dlgdp1 on dle0 5-1+,2+,3+,5+,6+
dkt on dlgdp1 2- 2+ 2- 9+
dlgdp1 on dkt 5+ 5+ 5+ 5+ 6-
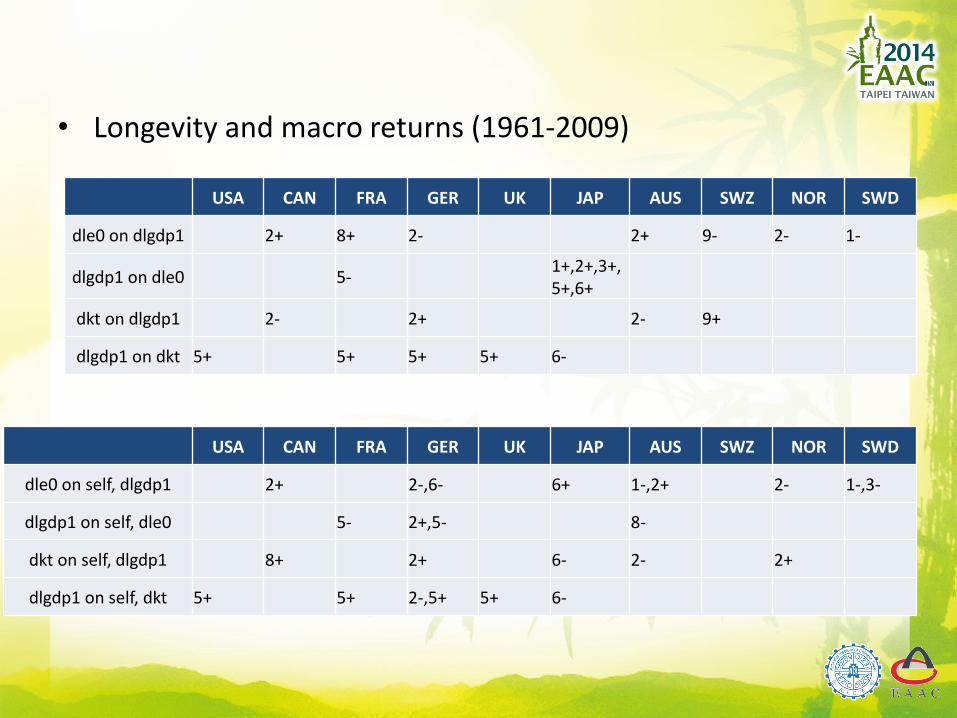
• Longevity and macro returns (1961-2009)
USA CAN FRA GER UK JAP AUS SWZ NOR SWD
dle0 on self, dlgdp1 2+ 2-,6- 6+ 1-,2+ 2- 1-,3-
dlgdp1 on self, dle0 5- 2+,5- 8-
dkt on self, dlgdp1 8+ 2+ 6- 2- 2+
dlgdp1 on self, dkt 5+ 5+ 2-,5+ 5+ 6-
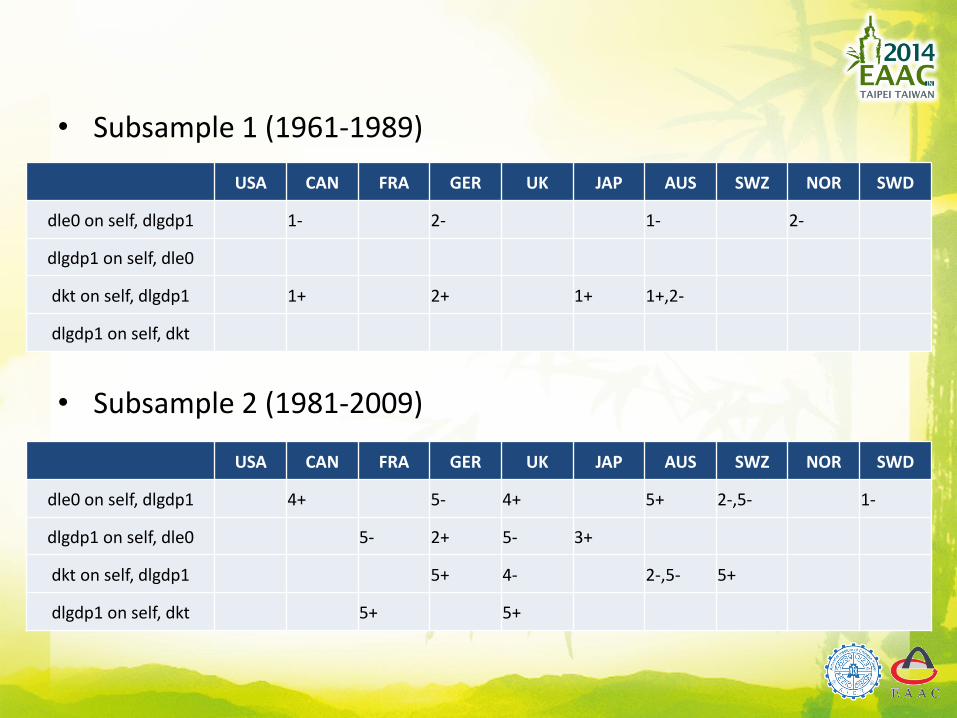
• Subsample 1 (1961-1989)
• Subsample 2 (1981-2009)
USA CAN FRA GER UK JAP AUS SWZ NOR SWD
dle0 on self, dlgdp1 1- 2- 1- 2-
dlgdp1 on self, dle0
dkt on self, dlgdp1 1+ 2+ 1+ 1+,2-
dlgdp1 on self, dkt
USA CAN FRA GER UK JAP AUS SWZ NOR SWD
dle0 on self, dlgdp1 4+ 5- 4+ 5+ 2-,5- 1-
dlgdp1 on self, dle0 5- 2+ 5- 3+
dkt on self, dlgdp1 5+ 4- 2-,5- 5+
dlgdp1 on self, dkt 5+ 5+
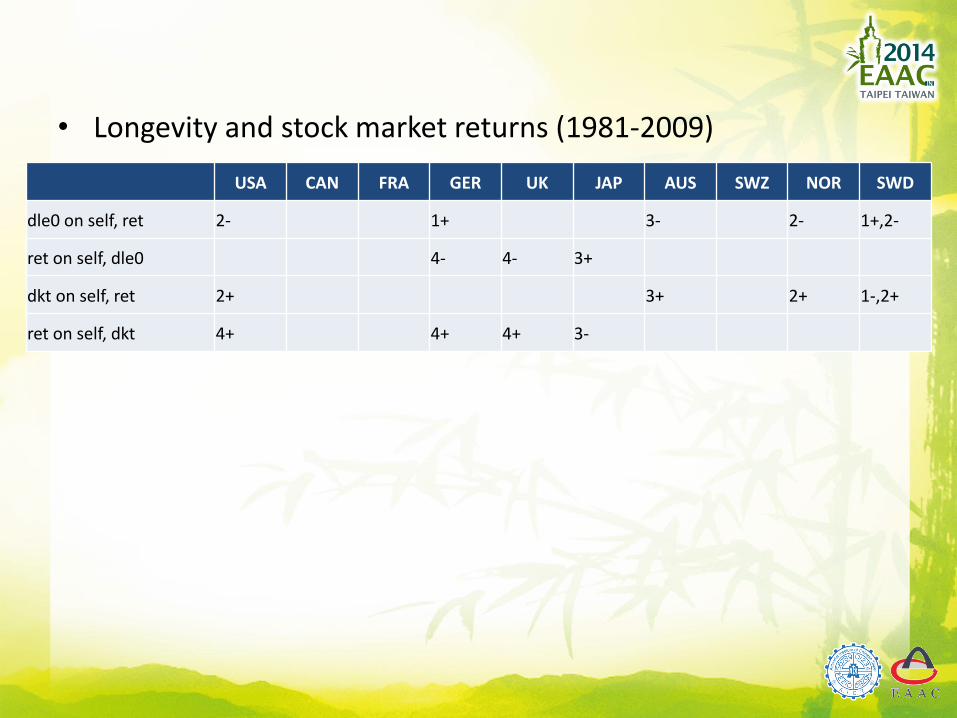
• Longevity and stock market returns (1981-2009)
USA CAN FRA GER UK JAP AUS SWZ NOR SWD
dle0 on self, ret 2- 1+ 3- 2- 1+,2-
ret on self, dle0 4- 4- 3+
dkt on self, ret 2+ 3+ 2+ 1-,2+
ret on self, dkt 4+ 4+ 4+ 3-

• Longevity and risk-free interest rate (1981-2009)
USA CAN FRA GER UK JAP AUS SWZ NOR SWD
dle0 on self, int
int on self, dle0 3+ 2+
dkt on self, int
int on self, dkt 3- 1-,2+ 2-

Conclusion
• Cointegrated with GDP in the long run
• Some relationship with GDP, not stable across countries and across sample periods
• Little relationship with stock market return and interest rate
• Useful for risk diversification

THANK YOU