Embed Size (px)
Citation preview

ORIGINAL RESEARCHpublished: 31 July 2018
doi: 10.3389/fphys.2018.00994
Frontiers in Physiology | www.frontiersin.org 1 July 2018 | Volume 9 | Article 994
Edited by:
Brian James Morris,
University of Sydney, Australia
Reviewed by:
Manuel Ramírez-Sánchez,
Universidad de Jaén, Spain
Vicente Lahera,
Complutense University of Madrid,
Spain
*Correspondence:
Anna Kollajtis-Dolowy
Specialty section:
This article was submitted to
Integrative Physiology,
a section of the journal
Frontiers in Physiology
Received: 27 February 2018
Accepted: 06 July 2018
Published: 31 July 2018
Citation:
Jeruszka-Bielak M, Kollajtis-Dolowy A,
Santoro A, Ostan R, Berendsen AAM,
Jennings A, Meunier N, Marseglia A,
Caumon E, Gillings R, de
Groot LCPGM, Franceschi C, Hieke S
and Pietruszka B (2018) Are
Nutrition-Related Knowledge and
Attitudes Reflected in Lifestyle and
Health Among Elderly People? A
Study Across Five European
Countries. Front. Physiol. 9:994.
doi: 10.3389/fphys.2018.00994
Are Nutrition-Related Knowledge andAttitudes Reflected in Lifestyle andHealth Among Elderly People? AStudy Across Five EuropeanCountriesMarta Jeruszka-Bielak 1, Anna Kollajtis-Dolowy 1*, Aurelia Santoro 2,3, Rita Ostan 2,3,
Agnes A. M. Berendsen 4, Amy Jennings 5, Nathalie Meunier 6, Anna Marseglia 7,
Elodie Caumon 6, Rachel Gillings 5, Lisette C. P. G. M. de Groot 4, Claudio Franceschi 2,8,
Sophie Hieke 9 and Barbara Pietruszka 1
1Department of Human Nutrition, Warsaw University of Life Sciences-SGGW, Warsaw, Poland, 2Department of
Experimental, Diagnostic and Specialty Medicine, University of Bologna, Bologna, Italy, 3C.I.G. Interdepartmental Centre
“L. Galvani”, University of Bologna, Bologna, Italy, 4Division of Human Nutrition and Health, Wageningen University &
Research, Wageningen, Netherlands, 5Norwich Medical School, University of East Anglia, Norwich, United Kingdom,6Centre Hospitalier Universitaire de Clermont Ferrand, Clermont-Ferrand, France, 7Care Sciences and Society, Department
of Neurobiology, Aging Research Center, Karolinska Institutet and Stockholm University, Stockholm, Sweden, 8 Institute of
Neurological Sciences (IRCCS), Bologna, Italy, 9 European Food Information Council, Brussels, Belgium
Background: Nutrition-related knowledge (NRK) and nutrition-related attitudes (NRAs)
are necessary for dietary changes toward healthier dietary patterns. In turn, healthier
dietary patterns can be beneficial in maintaining health of older adults. Therefore, the aim
of this cross-sectional study was to investigate whether NRK and NRAs were associated
with lifestyle and health features among older adults (65+ years) from five European
countries (France, Italy, Poland, the Netherlands and United Kingdom).
Methods: Within the European project NU-AGE, 1,144 healthy elderly volunteers (65–79
years) were randomly assigned to two groups: intervention (NU-AGE diet) or control.
After 1-year of follow-up, both NRK and NRAs were assessed during exit interviews,
in combination with a number of lifestyle and health variables (e.g., physical activity,
smoking, alcohol use, BMI, self-assessed health status). Multivariable linear regression
models were used in data analysis.
Results: In the NU-AGE study sample, good NRK was associated with lower BMI and
higher physical activity. More positive NRAs were related to lower BMI and self-reported
very good or good appetite. Moreover, both NRK and NRAs were associated with
some socio-economic determinants, like financial situation, age, education, living area
(for NRK), and country (for NRAs). Participants in the intervention group showed a
better NRK (β = 0.367 [95% CI: 0.117; 0.617], p = 0.004) and more positive NRAs
(β = 0.838 [95% CI: 0.318; 1.358], p = 0.002) than those in the control group.
Higher self-evaluated knowledge was also significantly related to more positive NRAs
(p < 0.001). The most popular sources of nutrition information were food labels, books
and magazines on health, the dietitian and the doctor’s office, although their importance

Jeruszka-Bielak et al. Nutrition-Related Knowledge and Attitudes
varied significantly among countries, and, to a lesser extent, between women and men
and between intervention and control group.
Conclusion: Higher NRK and NRA scores were associated with lower BMI and
higher physical activity level. Therefore, a good nutrition-related knowledge and positive
nutrition-related attitudes can strongly and positively influence the health status and
quality of life among the older population. These results offer a great opportunity for
policy makers to implement educational programs in order to counteract the epidemic
of obesity and to improve the health span of European population.
Keywords: nutrition-related knowledge, nutrition-related attitudes, lifestyle, health, the elderly
INTRODUCTION
The risk of various illnesses and disabilities increases with agewhat points out the importance of adequate nutritional intakefor elderly people (Dean et al., 2009). Inadequate nutrition(deficiencies or excesses of nutrients) can lead to a series ofbody dysfunctions such as decreased immunity, frailty, anda number of noncommunicable diseases (NCDs). The mostcommon NCDs in Europe are cardiovascular diseases (CVD;i.e., atherosclerosis, ischemic heart disease, and cerebrovasculardisease) which altogether account for 35% of all death causes (TheEuropean Health Report, 2012).
Overweight and obesity are unhealthy conditions thatsignificantly increase the risk of CVD, especially heart diseasesand stroke, diabetes, certain cancers, and mortality (von Ruestenet al., 2011). Currently, about 39% of adults is overweight and13% is obese, and these percentages are expected to increase in thecoming years (WHO, 2017). However, overweight and obesityare modifiable conditions that can be prevented with lifestyleinterventions aimed to improve dietary habits and physicalexercise.
One of such interventions is the NU-AGE project whicha main goal was to assess if a 1-year adherence to dietaryrecommendations based on Mediterranean-like dietary patterncan reduce inflammageing, optimize health and quality of life inEuropean older adults (Berendsen et al., 2014). Inflammageing,meaning the chronic low-grade inflammatory status resultedfrom age (Franceschi et al., 2000), is considered to be involvedin developing many age-related chronic diseases and geriatricsyndromes (Franceschi et al., 2000; Cevenini et al., 2013).
The Mediterranean diet due to its antioxidant, anti-inflammatory and prebiotic properties can counteractinflammageing and reduce risk of developing NCDs, includingCVD (Chatzianagnostou et al., 2015; Veronese et al., 2017).Typical Mediterranean foods contain nutritional hormetinsthat are able to activate specific stress-response pathways,among others: (1) phytochemicals (e.g., phenolic antioxidants,terpenoids, carotenoids, and allium derived sulfur compounds)present in olives, legumes, leafy green vegetables, tomatoes,garlic, and onion which activate nuclear factor erythroid 2(Nrf2); (2) resveratrol present in grapes and red wine whichregulates redox homeostasis, activates Nrf2 and sirtuin pathway,and blocks nuclear factor κB (NF-κB); (3) n-3 polyunsaturated
fatty acids present in fish and nuts which activate Nrf2 andblock NF-κB; (4) fiber present in legumes, unrefined whole-graincereals, fresh vegetables, and fruits which cooperates with cellularstress pathways (Martucci et al., 2017).
Nutrition-related knowledge (NRK) and nutrition-relatedattitudes (NRAs) concern the individual’s ability to understandfood-related and nutrition-related terminology as well as theattitudes (emotions, motivations, perceptions, and cognitivebeliefs) around the person’s eating behavior toward food (Macíasand Glasauer, 2014). Significant positive relationships betweenNRK and dietary intake and/or between NRAs and dietary intakewere reported in a meta-analysis (Axelson et al., 1985) and ina more recent systematic review (Spronk et al., 2014), althoughthe associations were quite weak. As many intrinsic and extrinsicfactors influence nutritional behavior, NRK and NRAs may notbe sufficient but they are necessary for dietary improvements(Macías and Glasauer, 2014).
NRK and NRAs can be influenced by a range of factors. Higheducational attainment has been linked to a better nutritionalawareness in older people (Moore et al., 1992; Lin and Lee,2005; Shatenstein et al., 2008; De Vriendt et al., 2009). Sex ofrespondents is another differentiating factor of NRK (Olson et al.,1982; Nichols et al., 1988; Hickman et al., 1993). A number ofstudies showed that old women have higher NRK than men(Hickman et al., 1993; Parmenter et al., 2000; Hendrie et al.,2008; Lin et al., 2011; Shatenstein et al., 2013), but other studieshave shown the opposite (Trent, 1992; Medeiros et al., 1993;Lin and Lee, 2005). Furthermore, age has been discussed as adiscriminating factor. Elderly people seem to have lower NRKthan their younger counterparts (Parmenter et al., 2000; Lin andLee, 2005; Hendrie et al., 2008). Lastly, lifestyle factors suchas smoking and alcohol consumption are also related to NRKor NRAs (Mukamal et al., 2003). For example, people with apositive attitude toward nutrition are more likely to be non-smokers (Mukamal, 2006). A better-perceived appetite is alsoassociated with positive attitudes toward nutrition (Shatensteinet al., 2013). Organoleptic properties (e.g., taste, smell, color, andfood consistency) are the basic food selection factors (Mooreet al., 1992; Backman et al., 2002; Cooke, 2004). Decreasedperception of organoleptic features in older adults contributes toa decreased appetite (Shahar et al., 2003).
Older consumers are at risk of poor nutrition and diet-relateddiseases, therefore, it is very important to introduce effective
Frontiers in Physiology | www.frontiersin.org 2 July 2018 | Volume 9 | Article 994

Jeruszka-Bielak et al. Nutrition-Related Knowledge and Attitudes
educational and intervention programs to promote better healthstatus of the elderly. It also means that we need a betterunderstanding of what older consumers think, how they makedecisions about food, nutrition and health, and which sourcesthey trust most.
In this cross-sectional study, we aim to investigate how NRKand NRAs are associated with lifestyle and health conditionsin the NU-AGE elderly participants from five countries(France, Italy, Poland, the Netherlands and United Kingdom).Additionally, we examine the sources of nutrition information tofind those most trustworthy in the opinion of the NU-AGE studysample.
MATERIALS AND METHODS
ParticipantsThe European NU-AGE study was carried out in five countries(France, Italy, Poland, the Netherlands and United Kingdom).Healthy European men and women aged 65–79 years, freeof clinically diagnosed overt disease for at least 2 years,free living and independent were included in the NU-AGEbaseline examination. Exclusion criteria were: overt diseasesuch as aggressive cancer or dementia; unstable organ failureor organ failure necessitating a special diet; heart, renal,respiratory or liver failure; type 1 diabetes mellitus; chronicuse of corticosteroids; recent (previous 2 months) use ofantibiotics; recent (previous 3 months) change to habitualmedication (e.g., statins and thyroxine) use; malnutrition, asdiagnosed by body mass index <18.5 kg/m2; body weight lossof >10% within 6 months; presence of frailty (as assessed bythe presence of at least three out of five criteria: unintentionalweight loss, self-reported exhaustion [weakness (grip strength),slow walking speed, and low physical activity] (Fried et al.,2001).
At baseline (April 2012–January 2014), volunteers wererandomly assigned into two groups, intervention (NU-AGE diet)or control. Participants randomized into the NU-AGE diet groupreceived monthly counseling from a trained dietician/researchnutritionist and individually tailored dietary advice based onMediterranean dietary pattern (Berendsen et al., 2014), as wellas a selection of products that could contribute to a healthierdiet, e.g., whole-grain pasta, low fat and low sodium cheese, oliveoil, margarine rich in mono- and polyunsaturated fatty acids,and a vitamin D supplement. Participants in the control groupreceived current national dietary recommendations available ineach country. After 1-year follow-up, all participants were askedto fill in a Nutrition Knowledge Questionnaire and the GeneralQuestionnaire including the questions on NRAs. A total of 1,144older participants completed the follow-up examination andwere used as a study population for the present study.
The NU-AGE study is registered at ClinicalTrials.gov,identifier NCT01754012. All subjects gave written informedconsent in accordance with the Declaration of Helsinki. Thestudy protocol was approved by ethics committees in eachcountry. More details on the NU-AGE study are given elsewhere(Santoro et al., 2014).
Data CollectionInformation on socio-demographics (i.e., age, sex, education,marital status, living area, and financial situation), lifestyle (i.e.,smoking, alcohol consumption, physical activity, number ofusual meals), and health conditions were collected by meansof standardized questionnaires. Age was categorized into twogroups: ≤ 75 and > 75 years of age. Education was categorizedinto elementary, secondary, and college/university based on yearsof education. Physical activity was assessed by the PhysicalActivity Scale for the Elderly (PASE), (Washburn et al., 1993)and grouped into quartiles. Participants’ self-reported levels ofphysical activity and knowledge about healthy food and healthyeating as well as number of meals eaten daily were used.
Body Mass Index (BMI) was calculated on the basis ofmeasured values of weight and height, as weight in kilogramdivided by height in meter square. BMI results were categorizedinto underweight (<18.5 kg/m2), normal body weight (18.5–24.9kg/m2), overweight (25.0–29.9 kg/m2), or obese (≥30.0 kg/m2),according to the WHO classification (WHO, 1998).
Mini-Nutritional Assessment (MNA) (Guigoz et al., 1996),Mini-Mental State Examination (MMSE) (Folstein et al., 1975),Activities of Daily Living (ADL) (Katz, 1983), and InstrumentalActivities of Daily Living (IADL) (Katz, 1983) were used asmeasures of physical and cognitive health status. For MNA,cut-off ≤11 points for possible undernutrition was applied(Cuervo et al., 2008). MMSE score in the range of 24–30 pointswas used as a normal cognitive mental status (Folstein et al.,1975). Exhaustion was measured by two questions (“I felt thateverything I did was an effort” and “I could not get going”) fromthe Center for Epidemiologic Studies Depression Scale (CES-DScale) (Radloff, 1977) and was stated if at least one conditionwas present for at least 3 days in the previous week. Numberof chronic diseases was calculated on the current existenceof diseases reported by participants and was divided into fivecategories: 0 (no chronic diseases were reported), 1, 2, 3, and 4or more diseases. Participants’ self-evaluated health status andappetite were also used as health-related determinants.
Assessment of Nutrition-RelatedKnowledge and AttitudesNRK data were collected using the Nutrition KnowledgeQuestionnaire (adapted from the Food Labelling to AdvanceBetter Education for Life project), which included 15 items ongeneral nutrition knowledge (e.g., recommendations on calories,fluids, and selected nutrients intake, as well as sources of selectednutrients). All items were closed-ended, four were dichotomousand 11 were multiple choice with four, five or six options tochoose from. A score of 1 was assigned to a good response and0 otherwise. The score of NRK was computed as the sum of thecorrectly answered items ranging from 0 to 15 points. Higherscore indicated better nutritional knowledge.
NRAs were assessed by five statements, related to everydaydiet and food choices, on a seven-point Likert scale (range = 1–7; response options ranged from “strongly disagree” to “stronglyagree”). The five statements were: (1) “The healthiness of foodhas little impact on my food choices”, (2) “It is important for
Frontiers in Physiology | www.frontiersin.org 3 July 2018 | Volume 9 | Article 994

Jeruszka-Bielak et al. Nutrition-Related Knowledge and Attitudes
me that my daily diet contains a lot of vitamins and minerals”,(3) “I always follow a healthy and balanced diet”, (4) “I do notavoid foods, even if they may raise cholesterol”, and (5) “I eatwhat I like and I do not worry much about the healthiness offood”. Three of five statements (No. 1, 4, 5) had inverse responsescale, and thus were recoded accordingly. The scores from thefive items were summed up and a total score (range = 5−35points) was obtained. Higher score meant more positive attitudefor healthy foods and diet. Six respondents were removed fromfurther analysis for NRAs because they skipped at least one ofthese five statements.
Based on the distribution, the continuous scores of NRKand NRAs were divided into tertiles. NRK was categorized into“Insufficient” (I tertile), “Quite good” (II tertile) and “Good” (IIItertile). NRAs were grouped into “Negative” (I tertile), “Neutral”(II tertile), and “Positive” (III tertile).
Data on sources of nutrition information were also obtainedby the Nutrition Knowledge Questionnaire. Participants wereasked to indicate in a closed-ended question with 13 optionsall sources of nutrition information that they used. In anotherquestion they could also indicate a maximum of three sourcesout of those selected earlier, that were most reliable for them.
Statistical AnalysisChi-square test was used to examine differences in socio-demographic, lifestyle and health determinants by the tertiles ofNRK and NRAs.
Multivariable stepwise linear regression models, withbackward elimination, were conducted to assess the associationsof NRK or NRAs (entered as continuous variables) with allsocio-demographic, lifestyle, and health covariates. Age andBMI were entered into the models as continuous variables whileall others as categorical ones. R-squared were used to comparethe goodness-of-fit for each model. Results are presented asunstandardized beta with 95% confidence interval (CI) andstandardized beta coefficients.
For all 13 sources of nutrition information, the total numberof indications was calculated and compared among categories forgender, group, and country with the Chi-square test. Results areshown as percentage of indications, i.e., the number of responsesof each source in relation to the number of people in a givencategory.
For all analysis, the significance level was set at 0.05. Thestatistical analyses were performed using the Statistical Packagefor the Social Sciences, version 23.0 (SPSS, Chicago, IL, USA).
RESULTS
Characteristics of Study PopulationThe characteristics of study population are presented in Table 1.Of the 1,144 participants, 635 (56%) were women, well-educated(56% completed the secondary school and 46% graduated fromcollege or university), living with spouse or partner (67%), mostlyin cities (55%). Most of the participants reported no financialdifficulties; their physical activity was of moderate or light
intensity (40% and 38%, respectively). According to a declaration,about 69% of participants consumed three meals a day.
After 1 year of follow-up, 45.5% of participants wereoverweight and 17%were obese. Five participants had BMI below18.5 kg/m2 (Table 2). According to the MNA score, the majorityof the population was not at risk of undernutrition and didnot report exhaustion (89 and 88%, respectively). The highestproportion of participants perceived their appetite and theirhealth status as good (55 and 52%, respectively), although 46%of them had at least four chronic diseases.
Almost all participants (99%) had the MMSE score in therange of 24–30 points which indicated the lack of cognitiveimpairment (data not shown).
Nutrition-Related Knowledge, Lifestyle,and Health-Related FactorsIn the univariate analysis, NRK was significantly associatedwith the following factors: age, education, country of living,living area, financial situation, alcohol use, physical activity level,declared number of meals, BMI, and self-evaluated health status(Tables 1, 2). A significantly higher proportion of participantswas classified to the third tertile (good NRK) when they were: ofyounger age (≤75 years); had higher level of education (college oruniversity); were from the UK or Italy; lived in a suburban area;self-evaluated their financial situation as very good; had higherphysical activity level (self-evaluated and PASE score); those whodeclared drinking alcohol as well as those with lower BMI, andexcellent or very good perceived health status. Although therewas no significant difference between intervention and controlgroup for NRK tertiles (p = 0.061), intervention group scoreda significantly higher mean of correct responses in nutrition testthan the control group (51.7± 15.3% vs. 49.1± 15.0%; p= 0.003;data not shown).
The results of nutrition test were in line with the participants’self-evaluation of their knowledge about healthy food and healthyeating.
Results from multiple regression analysis show that mostof determinants that were significant in relation to NRKin the univariate analysis remained significant also in theregression model (Table 3). Socio-demographic, lifestyle andhealth determinants, such as financial situation, age, education,living area, self-evaluated level of physical activity and BMIshowed a significant independent association with NRK.Participants in the intervention group showed a better NRK(β = 0.367 [95% CI: 0.117; 0.617], p = 0.004) than those inthe control group. Younger NU-AGE participants, with lowerBMI, better financial situation, higher level of physical activityand education, living in suburban areas, and belonging to theintervention group showed higher NRK. These seven variablesaccounted for 12% of the variance in the NRK scores.
Nutrition-Related Attitudes, Lifestyle, andHealth-Related FactorsIn the univariate analysis, NRAs was significantly associatedwith the following socio-demographic and lifestyle determinants:gender, group, country, financial situation, alcohol use, and
Frontiers in Physiology | www.frontiersin.org 4 July 2018 | Volume 9 | Article 994

Jeruszka-Bielak et al. Nutrition-Related Knowledge and Attitudes
TABLE 1 | Characteristics of NU-AGE study population and nutrition-related knowledge (NRK) and nutrition-related attitudes (NRAs) according to socio-demographic and
lifestyle determinants among NU-AGE participants (n = 1,144).
Characteristics Total
n (%)
NRK
n (%)
p-value NRAs
n (%)
p-value
Insufficient
(≤6 points)
Quite good
(7–8 points)
Good
(≥9 points)
Negative
(≤24 points)
Neutral
(25–28 points)
Positive
(≥29 points)
Age (years) 0.001 0.829
≤75 974 (85.1) 296 (30.4) 347 (35.6) 331 (34.0) 355 (36.7) 290 (30.0) 323 (33.4)
>75 170 (14.9) 75 (44.4) 51 (30.2) 43 (25.4) 64 (37.6) 47 (27.6) 59 (34.7)
Gender 0.119 0.044
Female 635 (55.6) 199 (31.4) 211 (33.3) 224 (35.3) 215 (34.0) 188 (29.7) 230 (36.3)
Male 507 (44.4) 171 (33.7) 186 (36.7) 150 (29.6) 203 (40.3) 149 (29.6) 152 (30.2)
Education 0.014 0.144
Elementary 40 (3.5) 20 (50.0) 12 (30.0) 8 (20.0)a 10 (25.0) 13 (32.5) 17 (42.5)
Secondary 571 (50.3) 186 (32.6) 213 (37.4) 171 (30.0)a 209 (36.7) 183 (32.1) 178 (31.2)
College/University 524 (46.2) 162 (30.9) 169 (32.3) 193 (36.8)b 199 (38.0) 140 (26.7) 185 (35.3)
Group 0.061 0.019
Intervention 573 (50.1) 174 (30.4) 193 (33.7) 206 (36.0) 187 (32.8) 178 (31.2) 205 (36.0)
Control 570 (49.9) 197 (34.6) 204 (35.9) 168 (29.5) 232 (40.8) 159 (28.0) 177 (31.2)
Country <0.001 0.021
Italy 243 (21.2) 96 (39.5) 98 (40.3) 49 (20.2)ac 72 (29.9) 67 (27.8) 102 (42.3)a
UK 252 (22.0) 47 (18.7) 73 (29.0) 132 (52.4)b 88 (34.9) 76 (30.2) 88 (34.9)ab
Netherlands 245 (21.4) 98 (40.2) 85 (34.8) 61 (25.0)a 86 (35.5) 79 (32.6) 77 (31.8)ab
Poland 218 (19.1) 107 (49.1) 75 (34.4) 36 (16.5)c 91 (41.9) 64 (29.5) 62 (28.6)b
France 186 (16.3) 23 (12.4) 67 (36.0) 96 (51.6)b 82 (44.1) 51 (27.4) 53 (28.5)b
Living area 0.002 0.556
Urban 622 (54.7) 223 (35.9) 215 (34.6) 183 (29.5)a 229 (36.8) 178 (28.6) 215 (34.6)
Rural 269 (23.6) 90 (33.5) 85 (31.6) 94 (34.9)a 107 (39.9) 79 (29.5) 82 (30.6)
Suburban 247 (21.7) 56 (22.7) 94 (38.1) 97 (39.3)b 83 (33.6) 79 (32.0) 85 (34.4)
Marital status 0.970 0.260
Never married or lived
with partner
35 (3.1) 13 (37.1) 12 (34.3) 10 (28.6) 16 (45.7) 12 934.3) 7 (20.0)
Married or living with
partner
767 (67.3) 244 (31.8) 270 (35.2) 253 (33.0) 275 (35.9) 235 (30.7) 256 (33.4)
Divorced, separated 143 (12.6) 45 (31.5) 48 (33.6) 50 (35.0) 49 (34.3) 45 (31.5) 49 (34.3)
Widow/widower 194 (17.0) 67 (34.7) 65 (33.7) 61 (31.6) 79 (40.7) 45 (23.2) 70 (36.1)
Financial situation** I/we: <0.001 0.012
Have financial difficulties 66 (5.8) 24 (36.4) 29 (43.9) 13 (19.7)ab 32 (48.5) 13 (19.7) 21 (31.8)a
Get by alright 379 (33.3) 149 (39.3) 138 (36.4) 92 (24.3)a 148 (39.1) 121 (31.9) 110 (29.0)a
Manage quite well 355 (31.2) 105 (29.7) 133 (37.6) 116 (32.8)b 133 (37.5) 101 (28.5) 121 (34.1)ab
Manage very well 310 (27.3) 83 (26.8) 84 (27.1) 143 (46.1)c 93 (30.0) 98 (31.6) 119 (38.4)b
Do not know* 27 (2.4) 7 (25.9) 10 (37.0) 10 (37.0) 13 (48.1) 4 (14.8) 10 (37.0)
Current smoking 0.693 0.085
Yes 39 (3.4) 15 (38.5) 13 (33.3) 11 (28.2) 16 (41.0) 16 (41.0) 7 (17.9)
No 1099 (96.6) 354 (32.2) 382 (34.8) 362 (33.0) 403 (36.7) 320 (29.1) 375 (34.2)
Alcohol use <0.001 0.016
Yes 906 (79.7) 273 (30.2) 305 (33.7) 327 (36.1) 328 (36.2) 288 (31.8) 290 (32.0)
No 230 (20.3) 95 (41.3) 88 (38.3) 47 (20.4) 91 (39.6) 48 (20.9) 91 (39.6)
PASE 0.005 0.077
I quartile (<92.43) 284 (25.0) 115 (40.5) 92 (32.4) 77 (27.1)a 113 (39.8) 80 (28.2) 91 (32.0)
II quartile (92.43–123.60) 285 (25.0) 91 (31.9) 87 (30.5) 107 (37.5)b 116 (40.7) 85 (29.8) 84 (29.5)
III quartile
(123.61–162.72)
284 (25.0) 83 (29.3) 100 (35.3) 100 (35.3)bc 83 (29.2) 89 (31.3) 112 (39.4)
IV quartile (>162.73) 284 (25.0) 79 (27.8) 115 (40.5) 90 (31.7)c 106 (37.5) 82 (29.0) 95 (33.6)
(Continued)
Frontiers in Physiology | www.frontiersin.org 5 July 2018 | Volume 9 | Article 994
Jeruszka-Bielak et al. Nutrition-Related Knowledge and Attitudes
TABLE 1 | Continued
Characteristics Total
n (%)
NRK
n (%)
p-value NRAs
n (%)
p-value
Insufficient
(≤6 points)
Quite good
(7–8 points)
Good
(≥9 points)
Negative
(≤24 points)
Neutral
(25–28 points)
Positive
(≥29 points)
Level of physical activity
(self-evaluation)
0.002 0.046
Sitting for most of the
time
62 (5.4) 29 (47.5) 17 (27.9) 15 (24.6)a 25 (40.3) 22 (35.5) 15 (24.2)ab
Light intensity exercise 434 (38.1) 156 (35.9) 149 (34.3) 129 (29.7)ab 173 (40.0) 133 (30.7) 127 (29.3)a
Moderate intensity
exercise (1–2 h/week)
456 (40.1) 137 (30.0) 171 (37.5) 148 (32.5)bc 158 (34.6) 121 (26.5) 177 (38.8)b
Moderate intensity
exercise (>3 h/week)
150 (13.2) 40 (26.7) 48 (32.0) 62 (41.3)cd 48 (32.0) 53 (35.3) 49 (32.7)ab
Intense exercise regularly 37 (3.2) 7 (18.9) 10 (27.0) 20 (54.1)d 15 (40.5) 8 (21.6) 14 (37.8)ab
Number of meals
(according to a
declaration)
0.002 0.164
< 1 meal a day* 2 (0.2) 0 0 2 (100.0) 1 (50.0) 1 (50.0) 0
One meal a day 24 (2.1) 7 (29.2) 13 (54.2) 4 (16.7)ab 13 (54.2) 5 (20.8) 6 (25.0)
Two meals a day 131 (11.5) 36 (27.5) 48 (36.6) 47 (35.9)a 60 (45.8) 35 (26.7) 36 (27.5)
Three meals a day 789 (69.3) 249 (31.6) 259 (32.9) 280 (35.5)a 278 (35.2) 240 (30.4) 271 (34.3)
More than three meals a
day
192 (16.9) 76 (39.6) 75 (39.1) 41 (21.4)b 67 (34.9) 56 (29.2) 69 (35.9)
Knowledge about healthy
food and healthy eating
(self-evaluation)***
0.001 <0.001
Not knowledgeable 17 (1.5) 10 (58.8) 5 (29.4) 2 (11.8)a 8 (47.1) 8 (47.1) 1 (5.8)ab
Rather not
knowledgeable
53 (4.7) 23 (43.4) 12 (22.6) 18 (34.0)a 31 (58.5) 11 (20.8) 11 (20.8)a
Neither knowledgeable
nor not knowledgeable
174 (15.3) 67 (38.3) 65 (37.4) 42 (24.1)a 91 (52.3) 45 (25.9) 38 (21.8)a
Rather knowledgeable 590 (51.8) 193 (32.8) 202 (34.3) 194 (32.9)a 208 (35.3) 195 (33.1) 187 (31.7)b
Knowledgeable 304 (26.7) 75 (24.7) 111 (36.5) 118 (38.8)b 81 (26.6) 78 (25.7) 145 (47.7)c
NRK was divided into tertiles: insufficient (≤6 points), quite good (7–8 points), good (≥9 points). NRAs was divided into tertiles: negative (≤24 points), neutral (25–28 points), positive
(≥29 points).a,b For each determinant values with different superscript are significantly different (p ≤ 0.05). *Excluded from statistical analysis. **Two categories “Have some financial difficulties” and
“Have severe financial difficulties” were combined due to a low number of subjects (n = 4) in the second category. ***Categories “not knowledgeable at all” and “not knowledgeable”
were combined into one category: “not knowledgeable,” similarly to last two categories “knowledgeable,” and “very knowledgeable” which created the category “knowledgeable,” due
to low number of subjects in most extreme categories.
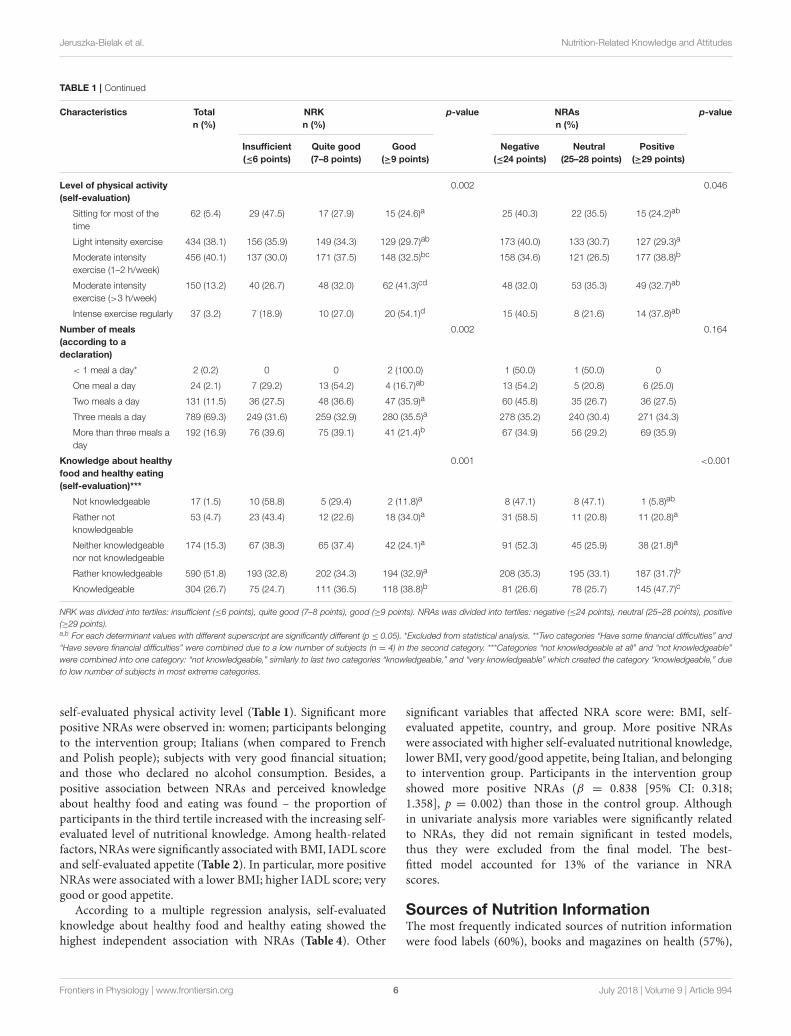
self-evaluated physical activity level (Table 1). Significant morepositive NRAs were observed in: women; participants belongingto the intervention group; Italians (when compared to Frenchand Polish people); subjects with very good financial situation;and those who declared no alcohol consumption. Besides, apositive association between NRAs and perceived knowledgeabout healthy food and eating was found – the proportion ofparticipants in the third tertile increased with the increasing self-evaluated level of nutritional knowledge. Among health-relatedfactors, NRAs were significantly associated with BMI, IADL scoreand self-evaluated appetite (Table 2). In particular, more positiveNRAs were associated with a lower BMI; higher IADL score; verygood or good appetite.
According to a multiple regression analysis, self-evaluatedknowledge about healthy food and healthy eating showed thehighest independent association with NRAs (Table 4). Other
significant variables that affected NRA score were: BMI, self-evaluated appetite, country, and group. More positive NRAswere associated with higher self-evaluated nutritional knowledge,lower BMI, very good/good appetite, being Italian, and belongingto intervention group. Participants in the intervention groupshowed more positive NRAs (β = 0.838 [95% CI: 0.318;1.358], p = 0.002) than those in the control group. Althoughin univariate analysis more variables were significantly relatedto NRAs, they did not remain significant in tested models,thus they were excluded from the final model. The best-fitted model accounted for 13% of the variance in NRAscores.
Sources of Nutrition InformationThe most frequently indicated sources of nutrition informationwere food labels (60%), books and magazines on health (57%),
Frontiers in Physiology | www.frontiersin.org 6 July 2018 | Volume 9 | Article 994

Jeruszka-Bielak et al. Nutrition-Related Knowledge and Attitudes
TABLE 2 | Characteristics of NU-AGE study population and nutrition-related knowledge (NRK) and nutrition-related attitudes (NRAs) according to health determinants in
NU-AGE participants (n = 1,144).
Characteristics Total
n (%)
NRK
n (%)
p-value NRAs
n (%)
p-value
Insufficient
(≤6 points)
Quite good
(7–8 points)
Good
(≥9 points)
Negative
(≤24 points)
Neutral
(25–28 points)
Positive
(≥29 points)
BMI (kg·m−2)
Underweight (<18.5)
Normal weight (18.5–24.9)
Overweight (25–29.9)
Obese (>30.0)
5 (0.4)
425 (37.2)
520 (45.5)
194 (16.9)
0
117 (27.5)
183 (35.2)
71 (36.8)
3 (60.0)
137 (32.2)
180 (34.6)
78 (40.4)
2 (40.0)ab
171 (40.2)a
157 (30.2)b
44 (22.8)b
<0.0012 (40.0)
124 (29.2)
202 (38.9)
91 (48.1)
2 (40.0)
123 (28.9)
157 (30.3)
55 (29.1)
1 (20.0)abc
178 (41.9)a
160 (30.8)b
43 (22.8)c
<0.001
MNA
Possible undernutrition (≤11
points)
Not at risk for
undernutrition (≥12 points)
124 (10.9)
1014 (89.1)
46 (37.1)
322 (31.8)
44 (35.5)
351 (34.6)
34 (27.4)
340 (33.6)
0.32444 (35.5)
375 (37.0)
39 (31.5)
298 (29.4)
41 (33.1)
340 (33.6)
0.890
IADL score (max. 8 points)*
≤ 5 points
> 5 points
506 (44.4)
633 (55.6)
171 (33.8)
198 (31.3)
185 (36.6)
210 (33.2)
150 (29.6)
224 (35.4)
0.116204 (40.4)
215 (34.0)
149 (29.5)
188 (29.7)
152 (30.1)
230 (36.3)
0.041
ADL score (max. 6 points)**
≤ 5 points
6 points
105 (9.6)
1029 (90.4)
36 (34.3)
330 (32.1)
44 (41.9)
351 (34.1)
25 (23.8)
348 (33.8)
0.09533 (31.4)
384 (37.3)
30 (28.6)
305 (29.6)
42 (40.0)
340 (33.0)
0.316
Exhaustion (self-reported)
Yes
No
131 (11.6)
1001 (88.4)
47 (35.9)
320 (32.0)
52 (39.7)
341 (34.1)
32 (24.4)
340 (34.0)
0.09059 (45.0)
359 (35.9)
37 (28.2)
297 (29.7)
35 (26.7)
345 (34.5)
0.091
Number of chronic diseases:
0
1
2
3
4 or more
82 (7.2)
126 (11.0)
203 (17.7)
208 (18.2)
525 (45.9)
27 (32.9)
41 (32.5)
63 (31.0)
66 (31.9)
174 (33.1)
28 (34.1)
37 (29.4)
77 (37.9)
63 (30.4)
193 (36.8)
27 (32.9)
48 (38.1)
63 (31.0)
78 (37.7)
158 (30.1)
0.47932 (41.6)
35 (27.8)
80 (39.4)
83 (39.9)
189 (36.1)
26 (33.8)
47 (37.3)
51 (25.1)
53 (25.5)
160 (30.5)
19 (24.7)
44 (34.9)
72 (35.5)
72 (34.6)
175 (33.4)
0.146
Health status (self-evaluation)
Excellent
Very good
Good
Fair/poor
88 (7.7)
266 (23.4)
588 (51.7)
196 (17.2)
21 (23.9)
85 (32.0)
184 (31.3)
78 (39.8)
28 (31.8)
67 (25.2)
226 (38.5)
74 (37.8)
39 (44.3)a
114 (42.9)a
177 (30.2)b
44 (22.4)c
<0.00125 (28.4)
84 (31.6)
228 (38.8)
82 (41.8)
25 (28.4)
83 (31.2)
171 (29.1)
58 (29.6)
38 (43.2)
99 (37.2)
189 (32.1)
56 (28.6)
0.081
Appetite (self-evaluation)
Poor/very poor
Average
Good
Very good
16 (1.4)
240 (21.1)
628 (55.2)
254 (22.3)
5 (31.3)
88 (36.7)
197 (31.4)
78 (30.7)
9 (56.3)
83 (34.6)
208 (33.2)
95 (37.4)
2 (12.5)
69 (28.8)
222 (35.4)
81 (31.9)
0.1518 (50.0)
112 (46.7)
230 (36.6)
69 (27.2)
5 (31.3)
65 (27.1)
184 (29.3)
83 (32.7)
3 (18.8)abc
63 (26.3)a
214 (34.1)b
102 (40.2)c
0.001
NRK was divided into tertiles: insufficient (≤ 6 points), quite good (7–8 points), good (≥ 9 points). NRAs was divided into tertiles: negative (≤ 24 points), neutral (25–28 points), positive
(≥ 29 points). a,bFor each determinant values with different superscript are significantly different (p ≤ 0.05). *Categories for IADL were based on variable distribution, where two picks
were observed – first for the 5 points and the second – for 8 points. **Categories for ADL were based on variable distribution; the majority (90.4%) got maximal score equaled 6 points,
9.1% got 5 points, and only one person got 2 points.
dietitians (and other health professionals; 43%), the doctor’spractice (42%), and Internet (39%) (Table 5). Significantlyhigher proportion of women than men pointed out books andmagazines (61 vs. 49%), while the opposite situation was foundfor Internet (35 vs. 43%), and for family and friends (33 vs.39%). After 1 year of follow-up, significant differences were notedbetween groups for food labels and dietitians, both being moreoften indicated by participants in the intervention group thanin the control group (62 vs. 55% and 46 vs. 38%, respectively).Numerous significant differences were also observed amongcountries.
Finally, themost trusted sources of nutrition information weredietitians (50%), books and magazines on health (49%), and thedoctor’s practice (42%).
DISCUSSION
This survey examines whether NRK and NRAs are associatedwith lifestyle, health, and socio-demographic determinantsamong NU-AGE elderly participants from five Europeancountries (France, Italy, Poland, the Netherlands andUnited Kingdom).
Higher NRK was associated with lower BMI, younger age,better financial situation, higher level of physical activity andeducation, living area (suburban areas respect to urban and ruralareas), and group (intervention respect to control). More positiveNRAs were associated with lower BMI, higher self-evaluatednutritional knowledge, very good/good appetite, being Italian,and belonging to intervention group.
Frontiers in Physiology | www.frontiersin.org 7 July 2018 | Volume 9 | Article 994

Jeruszka-Bielak et al. Nutrition-Related Knowledge and Attitudes
TABLE 3 | Multiple regression analysis between socio-demographic, lifestyle and
health and nutrition-related knowledge (NRK).
Nutrition-related knowledge
Unstandardized β
(95% CI)
Standardized
β
p-value
Financial situation
Have financial
difficulties
Get by alright
Manage quite well
Manage very well
0.395 (0.262; 0.527)
Ref.
0.208 (−0.352; 0.771)
0.672 (0.105; 1.240)
1.170 (0.592; 1.748)
0.168
Ref.
0.044
0.137
0.230
<0.001
Ref.
0.464
0.020
<0.001
Age −0.086 (−0.118; −0.053) −0.150 <0.001
BMI −0.060 (−0.094; −0.027) −0.104 <0.001
Education
Primary
Secondary
College/University
0.400 (0.174; 0.626)
Ref.
1.093 (0.405; 1.780)
1.312 (0.617; 2.006)
0.099
Ref.
0.241
0.289
0.001
Ref.
0.002
<0.001
Level of physical
activity
Sitting for most of the
time
Light intensity exercise
Moderate intensity
exercise (1–2 h/week)
Moderate intensity
exercise (>3 h/week)
Intense exercise
regularly
0.221 (0.072; 0.369)
Ref.
0.455 (−0.129; 1.039)
0.562 (−0.027; 1.151)
0.808 (0.147; 1.466)
1.314 (0.423; 2.205)
0.086
Ref.
0.098
0.122
0.120
0.103
0.004
Ref.
0.126
0.061
0.016
0.004
Group
Intervention
Control
0.367 (0.117; 0.617)
Ref.
0.081
Ref.
0.004
Ref.
Living area
Urban
Rural
Suburban
0.223 (0.066; 0.380)
Ref.
−0.109 (−0.429; 0.211)
0.500 (0.178; 0.822)
0.080
Ref.
−0.020
0.091
0.005
Ref.
0.503
0.002
Multiple R = 0.350; Adjusted R2 = 0.123; F(7, 1124) = 21.842; p < 0.001.
The values given in bold signify the main variables included into the model (7 variables).
Nutrition-Related KnowledgeThis study shows that BMI and self-evaluated level of physicalactivity, financial situation, age, education level, and livingarea had an independent and significant association with NRK.Interestingly, higher NRK was related to lower BMI and higherphysical activity level. Similar results, namely negative associationbetween NRK and BMI, and positive between NRK and physicalactivity level were found in adult Belgian women, althoughdifferent methods for evaluation of physical activity were used(self-evaluation in the present study vs. short form of theInternational Physical Activity Questionnaire) (De Vriendt et al.,2009). On the contrary, according to Girois et al. (2001) BMI wasnot associated with the knowledge about fat and fiber either inAmericans or Genevans aged 35–75 years.
There is a gap in literature to make the direct explanation ofobserved relationship between higher NRK (and more positiveNRAs) and lower BMI but can be explained indirectly. Nutritionknowledge was significantly associated with higher adherenceto a Mediterranean dietary pattern (Bonaccio et al., 2013), andin turn, healthy dietary patterns, including Mediterranean diet,
TABLE 4 | Multiple regression analysis between socio-demographic, lifestyle and
health and nutrition-related attitudes (NRAs).
Nutrition-related attitudes
Unstandardized β (95%
CI)
Standardized
β
p-value
Nutrition knowledge
about healthy food
and healthy eating
(self-evaluation)
Not knowledgeable
Rather not
knowledgeable
Neither knowledgeable
nor not knowledgeable
Rather knowledgeable
Knowledgeable
1.285 (0.982; 1.589)
Ref.
0.352 (−2.093; 2.797)
0.685 (−1.544; 2.915)
2.626 (0.470; 4.783)
3.969 (1.782; 6.156)
0.232
Ref.
0.016
0.052
0.275
0.368
<0.001
Ref.
0.778
0.546
0.017
<0.001
BMI −0.229 (−0.296; −0.163) −0.188 <0.001
Appetite
(self-evaluation)
Poor/very poor
Average
Good
Very good
0.884 (0.509; 1.258)
Ref.
1.334 (−0.927; 3.594)
2.238 (0.018; 4.458)
3.130 (0.862; 5.398)
0.130
Ref.
0.114
0.233
0.273
<0.001
Ref.
0.247
0.048
0.007
Country
Italy
UK
Netherlands
Poland
France
−0.419 (−0.608; −0.230)
Ref.
−1.405 (−2.202; −0.609)
−1.027 (−1.835; −0.218)
−1.682 (−2.511; −0.854)
−1.934 (−2.799; −1.068)
−0.121
Ref.
−0.122
−0.088
−0.139
−0.150
<0.001
Ref.
0.001
0.013
<0.001
<0.001
Group
Intervention
Control
0.838 (0.318; 1.358)
Ref.
0.088
Ref.
0.002
Ref.
Multiple R = 0.368; Adjusted R2 = 0.135; F(5, 1127) = 35.246; p < 0.001.
The values given in bold signify the main variables included into the model (5 variables).
were inversely related to BMI and/or prevalence of obesity(Schroder et al., 2004; Panagiotakos et al., 2006; Bucklandet al., 2008; Veronese et al., 2017). The protective effect ofdiet, especially Mediterranean diet, against overweight/obesitycan be attributed to (1) a large quantity of dietary fiber whichincreases satiety and satiation through mechanisms, such asprolonged mastication, increased gastric detention and enhancedrelease of cholecystokinin; (2) a low energy density and a lowglycaemic load; (3) a high intake of monounsaturated fattyacids that have been found to improve glucose metabolism,and increase postprandial fat oxidation, as well as diet-induced thermogenesis (Buckland et al., 2008). However, otherinvestigators did not observe the relationship between dietaryquality or Mediterranean diet and body weight, or observedopposite tendencies, namely higher dietary quality like higherdietary diversity was associated with higher BMI (Bernstein et al.,2002; Azadbakht et al., 2006).
In the present study, older adults with better financialsituation and higher education level showed better NRK. Thesefindings are in line with other research, conducted in younger(Parmenter et al., 2000; Hendrie et al., 2008; De Vriendt et al.,2009) and elderly population (Lin and Lee, 2005). Australian
Frontiers in Physiology | www.frontiersin.org 8 July 2018 | Volume 9 | Article 994

Jeruszka-Bielak et al. Nutrition-Related Knowledge and Attitudes
TABLE 5 | Sources of nutrition information used/trusted by participants of the NU-AGE dietary intervention study (n = 1,144).
Total % Gender Group Country Most trusted sources
F % M % Inter-vention % Control% IT % UK % NL % PL % FR % Total% Order
1. Food labels 59.8 61.0 56.1 62.5a 55.1b 53.9ac 71.1b 58.8bc 62.4c 44.6bc 26.0 V
2. Books, magazines on health 56.6 61.2a 48.9b 55.8 55.6 56.0a 40.2b 50.8a 75.2c 59.7a 48.9 II
3. Dietitian (and other health professionals) 42.9 44.7 39.1 45.8a 38.5b 43.2ab 43.8ab 35.4a 39.9a 50.5b 49.6 I
4. At doctor’s practice 42.5 41.8 41.7 39.5 44.0 60.6a 34.9b 15.0c 54.6a 46.2d 41.7 III
5. Internet 39.3 35.5a 42.9b 36.8 40.7 29.5ad 45.0bc 44.6bc 39.9cd 33.3d 20.5 VI
6. Family and friends 36.6 33.3a 39.5b 34.2 37.8 30.7a 41.4b 29.2a 50.5c 28.0a 26.5 IV
7. Newspaper 34.0 33.1 33.5 31.9 34.8 35.3a 39.0ab 44.6b 19.3c 25.8c 12.4 VIII
8. Television 29.7 30.0 28.5 27.2 31.4 34.0 24.9 31.3 26.6 29.6 11.6 IX
9. At the pharmacy 25.4 26.3 23.2 25.3 24.5 29.9a 22.5a 15.4b 28.4a 30.1a 18.9 VII
10. General magazines 20.7 19.3 21.6 19.5 21.3 20.7 21.3 24.6 20.2 13.4 6.4 X
11. Radio 15.0 15.7 13.4 13.7 15.6 12.9a 24.5b 8.3a 13.8a 13.4a 4.8 XI
12. Supermarket magazines 14.6 15.5 13.0 14.2 14.6 14.1a 12.9a 27.9b 6.0c 9.1ac 3.2 XIII
13. Food manufactures (e.g., websites) 8.0 8.1 7.6 8.1 7.6 1.7a 6.4b 10.8bc 12.4c 8.6bc 3.5 XII
a,bFor each category values with different superscript are significantly different (p ≤ 0.05).
adults who lived in area with “middle socio-economic status(SES)” scored significantly higher for overall knowledge andfor three out of four sections of knowledge in comparisonto subjects from “low SES” area (SES was derived from threeattributes: income, educational attainment and unemployment inthe areas). Education level was also an independent determinantof nutritional knowledge (Hendrie et al., 2008). In adult Englishpopulation, both level of education and SES had significant andindependent effects on NRK (Parmenter et al., 2000). It is quiteunlikely that highly educated elderly became aware of conceptsrelated to healthy nutrition during their scholastic/educationalpath since the majority of nutrition information are new andnot taught at schools when these individuals were students. Itcan be argued that older adults who graduated from collegesor universities were more interested in health and nutritioninformation than they counterparts with lower education, and/orwere also more capable in searching and remembering newknowledge. This hypothesis can be confirmed by significantdifferences among three categories of education level in sourcesof nutrition information. Internet was more frequently indicatedby participants with highest education (44%) than those withsecondary (35%) or primary education (15%). Opposite tendencywas detected for supermarket magazines (10, 18, and 20%,respectively). Availability of Internet and computers, tablets, orsmartphones may be also influenced by financial situation, whatshowed a strong impact on nutritional knowledge.
Age was another socio-demographic determinant thatsignificantly influenced NRK. In particular, NRK decreasedwith increasing age and the finding is consistent with resultsobtained by Lin and Lee (2005) for elderly Taiwanese people.Other studies gave somewhat ambiguous results. For example,already mentioned Girois et al. (2001) did not observe suchrelation, although the population varied substantially in terms ofage (from 35 to 75 years), while Parmenter et al. (2000) found thelowest NRK among the youngest (18–34 years) and the oldest(65 and over) subpopulations.
Subjects belonging to the NU-AGE intervention groupshowed a better NRK compared to the control group confirmingthe effectiveness of the NU-AGE dietary intervention. However,this conclusion should be made with some caution as the NRKwas not evaluated at the baseline.
It is noteworthy that older adults who evaluated their healthstatus as excellent or very good had significantly better NRK,while those with fair or poor health—the lowest. The associationbetween health status andNRK (andNRAs)may be bidirectional,namely better health may be a final consequence of goodNRK, NRAs (and healthy eating behavior) or just opposite—worse health status may result in increasing of NRK andNRAs to improve the health status. The present study seemsto corroborate the first direction, suggesting that better NRK(and a tendency for more positive NRAs) results in better self-reported health status. It should be noted that our population wasgenerally in quite good health condition, due to, among others,inclusion/exclusion criteria used in the NU-AGE project.
Surprisingly, in this study NRK did not differ betweengenders. The majority of research in this field indicated thatwomen have higher dietary knowledge than men, regardlessthe age (Parmenter et al., 2000; Hendrie et al., 2008; Linet al., 2011; Grunert et al., 2012; Shatenstein et al., 2013).On the contrary, in Taiwanese elderly, men had higher NRKthan women, and according to authors it probably resultedfrom the fact that in Taiwan, elderly women have a lowereducation level than men (Lin and Lee, 2005). Similarly to ouroutcome, no differences between women and men in knowledgeabout fat or fiber were detected in American and Genevanpopulations (Girois et al., 2001). The differences between womenand men in NRK may diminish in some societies because thetraditional division of duties in families is reducing (men are alsoresponsible for food shopping and cooking) (Parmenter et al.,2000). Furthermore, the number of people (includingmen) livingalone is increasing forcing them to becomemore conscious aboutfood and nutrition. Broadly discussed issues of healthy eating
Frontiers in Physiology | www.frontiersin.org 9 July 2018 | Volume 9 | Article 994

Jeruszka-Bielak et al. Nutrition-Related Knowledge and Attitudes
in the public space, including media cannot be neglected. Suchquestions started to appear in magazines for men, not only forwomen. Taking into account above mentioned considerationsmore research should be conducted on NRK in women andmen, among varied age groups, including older adults as the lifeexpectance constantly increases.
Consequently, more nutrition programs and campaignsdedicated to older adults should be implemented in order toimprove their NRK (and NRAs), what in turn may improvetheir eating habits. Associations between NRK and diet qualitywere reported in some surveys, like among elderly Canadians(Shatenstein et al., 2013), English adults (Wardle et al., 2000),Belgian adult women (De Vriendt et al., 2009) or Indo-Mauritianadult women (Dunneram and Jeewon, 2013). For example,better NRK was connected with higher consumption of fruitand vegetables and lower intake of fat among English adults(Wardle et al., 2000) and higher intake of fruit and vegetablesin Belgian women (De Vriendt et al., 2009). According todata from systematic review, significant positive associationswere found between higher nutrition knowledge and a greaterintake of cereals or fish, a lower intake of sweetened drinks,a higher intake of fibre or calcium (Spronk et al., 2014). InIndo-Mauritian aged 18–55 years, nutritional knowledge had thehighest significant independent effect on diet quality (Dunneramand Jeewon, 2013). It can be speculated that people withhigher nutrition knowledge may be more aware of nutritionalquality of foods and also be more willing to choose high-quality food products, independently from other socioeconomicfactors (Bonaccio et al., 2013). However, in elderly people, someproblems with transferring the knowledge into practice maypersist (Thomas et al., 2010).
Nutrition-Related AttitudesThe results of this study indicate that more positive attitudetoward healthy eating was associated with lower BMI and verygood or good self-evaluated appetite, as well as higher self-evaluated knowledge about healthy eating. NU-AGE participantsbelonging to the intervention group showed significantly morepositive NRAs than the control group. Among the countries,Italian NU-AGE volunteers had the best NRAs.
Our findings for BMI are in line with a research by Wanget al. (2008) who found out that positive health attitudes wereassociated with lower BMI in 56–70 years old Australians, eventhough they calculated BMI on self-reported data of weight andheight.
Interestingly, better self-reported appetite was related to morepositive NRAs. Shatenstein et al. (2013) found out that elderlyCanadian women who reported greater sensations of hungerhad better diet quality. Although it is not a direct comparison,it can give some ideas. As authors concluded, feeling hungry(or having a very good appetite) motivates food consumption,what may contribute to better and more conscious food choices.Nevertheless, further research is required to understand andexplain the link between appetite and NRAs, and finally with dietquality in older adults.
Similarly to NRK, also NRA score was significantly influencedby the group. The more positive attitudes toward healthyeating patterns detected in NU-AGE intervention group at the
follow-up seem logic and may provide some evidence that theNU-AGE project brought positive effects on NRAs (and probablyknowledge). Participants during 1 year of NU-AGE dietaryintervention received individual dietary advice and selected foodsaiming to meet the NU-AGE requirements and had regular(approximately once a month) contacts with dietitians/researchnutritionists face-to-face or by telephone, and supported bymail or e-mail (Santoro et al., 2014). Participants that wererandomized to control group only received a leaflet withgeneral national dietary guidelines available in each country. Asparticipants were volunteers they all could have quite positiveNRAs at baseline, higher than general populations.
Although it was detected only in univariate analysis,significantly higher proportion of women had positive NRAsrespect to men. Similarly to NRK, it is commonly assumedthat women tend to be more interested in and concerned withhealthy eating. Such relationship was found in Taiwanese adults(Lin et al., 2011) but not in Taiwanese elderly people (Lin andLee, 2005), where men expressed more positive attitudes aboutgeneral nutrition than women. As discussed above for NRK, thisgeneral “truth” for NRAs may also change in the future.
Our study revealed, but only in univariate analysis, thathigher proportion of participants who perceived their financialsituation as very good had significantly more positive NRAswhen compared to subgroups with worse self-evaluated financialsituation. In general public it is assumed that healthy eating isalso expensive thus people with lower financial resources maythink that they are not able to follow dietary recommendations(one out of five statements among NRAs was “I always follow ahealthy and balanced diet”). According to some research, high-income or high socio-economic groups found healthy aspects ofmeal choices or dietary quality more relevant than low-income orlow socioeconomic groups (Beydoun andWang, 2008; Kamphuiset al., 2015).
NRAs are found to be positively correlated with nutritionbehavior, more than NRK (Lin et al., 2011). It is in accordancewith Knowledge-Attitudes-Behavior Model, which assumes thatwhen health knowledge accumulates, it initiates the changes inattitudes, and when the changes in attitudes accumulate, theyresult in behavior change (Baranowski et al., 2003).
Sources of InformationFor older adults who participated in the present study the mainsources of nutrition information were food labels, books andmagazines on health, dietitians, doctor’s practice, and Internet.These findings are in line with other researches highlightingthe importance of health professionals for the disseminationof correct information about nutritional issues. For example,older Americans aged 60–80 years favored health professionals(doctors, dietitians) as nutrition information sources (Schultzet al., 2012). In a population consisting of different age groups,family doctor was the first source of nutrition information,particularly in the elderly (van Dillen et al., 2003). Althoughdietitian was on the fifth position in the order of most popularsources among the whole population, especially the elderlyconsidered dietitians as a nutrition information source (vanDillen et al., 2003). Interestingly, in the present study, dietitianwas significantly more often indicated by older adults in the
Frontiers in Physiology | www.frontiersin.org 10 July 2018 | Volume 9 | Article 994

Jeruszka-Bielak et al. Nutrition-Related Knowledge and Attitudes
intervention than in the control group, what may be an effect ofregular consultations with dietitian/research nutritionist duringthe NU-AGE project.
The highest position of food labels among older adults underthe present study is a bit surprising, but does not surprisethat it was a more popular source among the elderly inintervention than in control group. This can also be a positiveeffect of the NU-AGE project as participants randomized tointervention group were also advised how to use the food labelsfor healthy food choices. Food labels were the most commonsources of information about functional foods among Canadianolder population (Vella et al., 2014). According to van Dillenet al. (2003) food labels were on 8th position, after television,and before other media. Although some discrepancies exist inperceiving food labels as the source of nutrition information, itseems that their role would increase in the future.
For our population, books and magazines on health were avery important source of nutrition information, and this findingwas also reported by others (van Dillen et al., 2003; Vella et al.,2014).
The Internet was also quite often indicated in this study.On the contrary, among elderly Americans only 27% reportedthat they would like to get more nutrition information throughthe Internet (Schultz et al., 2012). Higher importance of theInternet among older adults in our study may be due to the timedifference between both surveys, and thus higher access to andhigher popularity of this media (both populations are comparablein demographic characteristics). The Internet was most popularamong the youngsters (van Dillen et al., 2003).
Family and friends as a source of nutrition information wasnot as popular as in other studies, where it was on the first orsecond place in order (van Dillen et al., 2003; Lin and Lee, 2005).
In turn, three most trusted sources of information (dietitian,books and magazines on health and doctor’s practice) show thatprofessionals and professional materials are particularly valuablefor surveyed elderly population.
LIMITATIONS OF THE STUDY
Despite many strengths, this study has some limitations. Firstly,its cross-sectional design may be regarded as a limitation.Some bias may also come from the fact that participants werevolunteers in the NU-AGE dietary intervention study and thuscould be more interested in nutrition and health than the generalpopulation. They could also be of better health condition due tosharp exclusion criteria of the project. Besides, NRK and NRAswere measured after 1 year of follow-up which may also shadethe picture and interfere with the final results.
CONCLUSIONS
High NRK and NRAs toward healthy dietary patterns wereassociated with low BMI and high physical activity level.Therefore, having a good nutrition-related knowledge andattitudes might strongly and positively impact on the healthstatus and quality of life of elderly population. This will offer agreat opportunity for policy makers to implement educationalprograms to counteract the epidemic of obesity. Such programsshould be particularly dedicated to elderly people with lowerNRK and less positive NRAs, as well as those with a lowersocioeconomic status.
ETHICS STATEMENT
NU-AGE was approved by the Ethics Committee of thecoordinator center: the Independent Ethics Committee of the S.Orsola-Malpighi Hospital Bologna (Italy), and by all the EthicsCommittees of all the other four study centers: the South-East6 Person Protection Committee (France), the WageningenUniversity Medical Ethics Committee (Netherlands), theNational Research Ethics Committee–East of England (UK),and the Bioethics Committee of the Polish National Food andNutrition Institute (Poland). Written informed consents werecollected from all participants prior to their inclusion in thestudy. The NU-AGE study is registered with clinicialtrials.govsince December 21st 2012 (NCT01754012).
AUTHOR CONTRIBUTIONS
MJ-B, AK-D, and BP contributed to the conception and designof the current work, data analyses, data interpretation, anddrafted the manuscript. CF conceived, designed, initiatedand directed NU-AGE. AS coordinated NU-AGE datacollection across centers. SH designed the questionnairefor the NRK interviews. AB and LdG designed the dietaryintervention study. AK-D, BP, MJ-B, RO, AJ, NM, EC, and RGsubstantially contributed to the data collection by acquiring orprocessing data. All authors contributed to interpretation ofdata, critically revised and approved the final version of thismanuscript.
FUNDING
The study was supported by the European Union’s SeventhFramework Program under grant agreement no. 266486 (NU-AGE: New dietary strategies addressing the specific needs of theelderly population for healthy ageing in Europe).
REFERENCES
Axelson, M. A., Federline, T. L., and Brinberg, D. (1985). A meta-analysis
of food- and nutrition-related research. J. Nutr. Educ. 17, 51–54.
doi: 10.1016/S0022-3182(85)80175-8
Azadbakht, L., Mirmiran, P., Esmaillzadeh, A., and Azizi, F. (2006). Dietary
diversity score and cardiovascular risk factors in Tehranian adults. Publ. Health
Nutr. 9, 728–736. doi: 10.1079/PHN2005887
Backman, D. R., Haddad, E. H., Lee, J. W., Johnstone, P. K., and Hodgkin, G. E.
(2002). Psychosocial predictors of healthful dietary behavior in Adolescents.
J. Nutr. Educ. Behav. 34, 184–193. doi: 10.1016/S1499-4046(06)60092-4
Baranowski, T., Baranowski, J. C., Cullen, K. W., Thompson, D. I., Niclas, T.,
Zakeri, I. F., et al. (2003). The fun, food, and fitness project: the baylor gems
pilot study. Ethn. Dis. 13, 30–39.
Berendsen, A., Santoro, A., Pini, E., Cevenini, E., Ostan, R., Pietruszka, B., et al.
(2014). Reprint of: a parallel randomized trial on the effect of a healthful diet
Frontiers in Physiology | www.frontiersin.org 11 July 2018 | Volume 9 | Article 994

Jeruszka-Bielak et al. Nutrition-Related Knowledge and Attitudes
on inflammageing and its consequences in European elderly people: design of
the NU-AGE dietary intervention study. Mech. Ageing Dev. 136–137, 14–21.
doi: 10.1016/j.mad.2014.03.001
Bernstein, M. A., Tucker, K. L., Ryan, N. D., O’Neill, E. F., Clements, K. M.,
Nelson, M. E., et al. (2002). Higher dietary variety is associated with better
nutritional status in frail elderly people. J. Am. Diet. Assoc. 102, 1096–1104.
doi: 10.1016/S0002-8223(02)90246-4
Beydoun, M. A., and Wang, Y. (2008). Do nutrition knowledge and beliefs modify
the association of socio-economic factors and diet quality among US adults?
Prev. Med. 46, 145–153. doi: 10.1016/j.ypmed.2007.06.016
Bonaccio, M., Di Castelnuovo, A., Costanzo, S., De Lucia, F., Olivieri, M., Donati,
M. B., et al. (2013). Nutrition knowledge is associated with higher adherence to
Mediterranean diet and lower prevalence of obesity. results from the Moli-sani
study. Appetite 68, 139–146. doi: 10.1016/j.appet.2013.04.026
Buckland, G., Bach, A., and Serra-Majem, L. (2008). Obesity and the
Mediterranean diet: a systematic review of observational and intervention
studies. Obes. Rev. 9, 582–593. doi: 10.1111/j.1467-789X.2008.00503.x
Cevenini, E., Monti, D., and Franceschi, C. (2013). Inflamm-ageing. Curr. Opin.
Clin. Nutr. Metab. Care 16, 14–20. doi: 10.1097/MCO.0b013e32835ada13
Chatzianagnostou, K., Del Turco, S., Pingitore, A., Sabatino, L., and
Vassalle, C. (2015). The Mediterranean lifestyle as a non-pharmacological
and natural antioxidant for healthy aging. Antioxidants 4, 719–736.
doi: 10.3390/antiox4040719
Cooke, L. (2004). The development and modification of children’s eating habits.
Nutr. Bull. 29, 31–35. doi: 10.1111/j.1467-3010.2003.00388.x
Cuervo, M., Garcia, A., Ansorena, D., Sanchez-Villegas, A., Martinez-Gonzalez, M.
A., Astiasaran, I., et al. (2008). Nutritional assessment interpretation on 22007
Spanish community-dwelling elders through the Mini Nutritional Assessment
test. Publ. Health Nutr. 12, 82–90. doi: 10.1017/S136898000800195X
Dean, M., Raats, M. M., Grunert, K. G., and Lumbers, M. (2009). Factors
influencing eating a varied diet in old age. Publ. Health Nutr. 12, 2421–2427.
doi: 10.1017/S1368980009005448
De Vriendt, T., Matthys, C., Verbeke, W., Pynaert, I., and De Henauw, S. (2009).
Determinants of nutrition knowledge in young and middle-aged Belgian
women and the association with their dietary behaviour. Appetite 52, 788–792.
doi: 10.1016/j.appet.2009.02.014
Dunneram, Y., and Jeewon, R. (2013). A scientific assessment of sociodemographic
factors, physical activity level, and nutritional knowledge as determinants of
dietary quality among Indo-Mauritian women. J. Nutr. Metab. 2013:572132.
doi: 10.1155/2013/572132
Folstein, M. F., Folstein, S. E., and Mchugh, P. L. (1975). “Mini-Mental State” a
practical method for grading the cognitive state of patients for the clinician.
J. Psychiatr. Res. 12, 189–198.
Franceschi, C., Bonafè, M., Valensin, S., Olivieri, F., De Luca, M., Ottaviani, E., et al.
(2000). Inflamm-aging. An evolutionary perspective on immunosenescence.
Ann. N.Y. Acad. Sci. 908, 244–254. doi: 10.1111/j.1749-6632.2000.tb06651.x
Fried, L. P., Tangen, C. M., Walston, J., Newman, A. B., Hirsch, C., Gottdiener, J.,
et al. (2001). Frailty in older adults: evidence for a phenotype. J. Gerontol. A
Biol. Sci. Med. Sci. 56, 146–156. doi: 10.1093/gerona/56.3.M146
Girois, S. B., Kumanyika, S. K., Morabia, A., and Mauger, E. (2001). A comparison
of knowledge and attitudes about diet and health among 35 to 75 years-old
adults in the United States and Geneva, Switzerland. Am. J. Publ. Health 91,
418–424. doi: 10.2105/AJPH.91.3.418
Grunert, K. G., Wills, J., Celemin, L. F., Lähteenmäki, L., Scholderer, J., and
Storcksdieck genannt Bonsmann, S. (2012). Socio-demographic and attitudinal
determinants of nutrition knowledge of food shoppers in six European
countries. Food Qual. Prefer. 26, 166–177. doi: 10.1016/j.foodqual.2012.04.007
Guigoz, Y., Vellas, B., and Garry, P. (1996). Assessing the nutritional status of
the elderly: the mini nutritional assessment as part of the geriatric evaluation.
J. Nutr. Rev. 54, S59–S65. doi: 10.1111/j.1753-4887.1996.tb03793.x
Hendrie, G. A., Coveney, J., and Cox, D. (2008). Exploring nutrition knowledge
and the demographic variation in knowledge levels in anAustralian community
sample. Publ. Health Nutr. 11, 1365–1371. doi: 10.1017/S1368980008003042
Hickman, B. W., Gates, G. E., and Dowdy, R. P. (1993). Nutrition claims in
advertising: a study of four women’s magazines. J. Nutr. Educ. 25, 227–235.
Kamphuis, C. B., de Bekker-Grob, E. W., and van Lenthe, F. J. (2015). Factors
affecting food choices of older adults from high and low socioeconomic
groups: a discrete choice experiment. Am. J. Clin. Nutr. 101, 768–774.
doi: 10.3945/ajcn.114.096776
Katz, S. (1983). Assessing self-maintenance: activities of daily living, mobility,
and instrumental activities of daily living. J. Am. Geriatr. Soc. 31, 721–727.
doi: 10.1111/j.1532-5415.1983.tb03391.x
Lin, W., Hang, C. M., Yang, H. C., and Hung, M. H. (2011). 2005-2008 Nutrition
and Health Survey in Taiwan: the nutrition knowledge, attitude and behavior
of 19-64 year old adults. Asia Pac. J. Clin. Nutr. 20, 309–318.
Lin, W., and Lee, Y. W. (2005). Nutrition knowledge, attitudes and dietary
restriction behaviour of Taiwanese elderly. Asia Pac. J. Clin. Nutr. 14, 221–229.
Macías, Y. F., and Glasauer, P. (2014). FAO Nutrition Division Guidelines for
Assessing Nutrition-Related Knowledge, Attitudes and Practices. Rome: Food
and Agriculture Organization of the United Nations.
Martucci, M., Ostan, R., Biondi, F., Bellavista, E., Fabbri, C., Bertarelli, C., et al.
(2017). Mediterranean diet and inflammaging within the hormesis paradigm.
Nutr. Rev. 75, 442–455 doi: 10.1093/nutrit/nux013
Medeiros, L. C., Shipp, R., and Taylor, D. T. (1993). Dietary Practices and
Nutrition Beliefs through the adult life cycle. J. Nutr. Educ. 25, 201–204.
doi: 10.1016/S0022-3182(12)81115-0
Moore, J., Earless, A., and Parsons, T. (1992). Women’s Magazines. Their influence
on nutritional knowledge and food habites. Nutr. Food Sci. 92, 18–21.
Mukamal, K. J. (2006). The effects of smoking and drinking on cardiovascular
disease and risk factors. Alcohol Res. Health 3, 199–202.
Mukamal, K. J., Conigrove, K. M., Mittelman, M. A., Camagaro, C. A., Stampfer,
M. J., Willet, W. C., et al. (2003). Role of drinking pattern and type of alcohol
consumed in coronary heart disease in men. New Engl. J. Med. 348, 109–118.
doi: 10.1056/NEJMoa022095
Nichols, S., Waters, W. E., Woolway, M., and Hamilton-Smith, M. B. (1988).
Evaluation of the effectiveness of nutritional health education leaflet in
changing public knowledge and attitudes about eating and health. J. Hum. Nutr.
Diet 1, 233–238. doi: 10.1111/j.1365-277X.1988.tb00195.x
Olson, C. M., Biscogni, C. A., and Thonney, P. F. (1982). Evaluation of
a supermarket nutrition education program. J. Nutr. Educ. 14, 141–145.
doi: 10.1016/S0022-3182(82)80158-1
Panagiotakos, D. B., Chrysohoou, C., Pitsavos, C., and Stefanadis, C.
(2006). Association between the prevalence of obesity and adherence
to the Mediterranean diet: the ATTICA study. Nutrition 22, 449–456.
doi: 10.1016/j.nut.2005.11.004
Parmenter, K., Waller, J., and Wardle, J. (2000). Demographic variation
in nutrition knowledge in England. Health Educ. Res. 15, 163–174.
doi: 10.1093/her/15.2.163
Radloff, L. S. (1977). The CES-D Scale: a self-report depression scale for
research in the general population. Appl. Psychol. Meas. 1, 385–401.
doi: 10.1177/014662167700100306
Santoro, A., Pini, E., Scurti, M., Palmas, G., Berendsen, A., Brzozowska, A.,
et al. (2014). Combating inflammaging through a Mediterranean whole diet
approach: the NU-AGE project’s conceptual framework and design. Mech.
Ageing Dev. 136–137, 3–13. doi: 10.1016/j.mad.2013.12.001
Schultz, U., Nothwehr, F., Hanson, J., Chrisman, M., and Haines, H. (2012).
A nutrition information needs survey among older adults: application
of adult learning principles. Qual. Ageing Old. Adults 13, 145–153.
doi: 10.1108/14717791211231229
Schroder, H., Marrugat, J., Vila, J., Covas, M. I., and Elosua, R. (2004). Adherence
to the traditional Mediterranean diet is inversely associated with Body
Mass Index and obesity in a Spanish population. J. Nutr. 134, 3355–3361.
doi: 10.1093/jn/134.12.3355
Shahar, D., Shai, I., Vardi, H., and Fraser, D. (2003). Dietary intake and eating
patternsof elderly people in Israel: who is at nutritional risk? Euro. J. Clin. Nutr.
57, 18–25. doi: 10.1038/sj.ejcn.1601523
Shatenstein, B., Gauvin, L., Keller, H., Richard, L., Gaudreau, P., Giroux, F.,
et al. (2013). Baseline determinants of global diet quality in older men
and women from the NuAge cohort. J. Nutr. Health Aging 17, 419–425.
doi: 10.1007/s12603-012-0436-y
Shatenstein, B., Kergoat, M.-J., Reid, L., and Chicoine, M. E. (2008). Dietary
intervention in older adults with early-stage Alzheimer Dementia. Early
lessons learned. J. Nutr. Health Aging 12, 461–469. doi: 10.1007/BF029
82707
Frontiers in Physiology | www.frontiersin.org 12 July 2018 | Volume 9 | Article 994

Jeruszka-Bielak et al. Nutrition-Related Knowledge and Attitudes
Spronk, I., Kullen, C., Burdon, C., and O’Connor, H. (2014). Relationship
between nutrition knowledge and dietary intake. Br. J. Nutr. 28, 1713–1726.
doi: 10.1017/S0007114514000087
The European Health Report (2012). Charting the Way to Well-Being. Denmark:
World Health Organization 2013.
Thomas, L. J., Almanza, B., and Ghiselli, R. (2010). Nutrition knowledge of rural
older populations: can congregate meal site participants manage their own
diets? J. Nutr. Elder. 29, 325–344. doi: 10.1080/01639366.2010.500951
Trent, L. K. (1992). Nutrition knowledge of active-duty Navy personnel. J. Am.
Diet. Assoc. 92, 724–728.
van Dillen, S. M. E., Hiddink, G. J., Koelen, M. A., de Graaf, C., and vanWoerkum,
C. M. J. (2003). Understanding nutrition communication between health
professionals and consumers: development of a model for nutrition awareness
based on qualitative consumer research. Am. J. Clin. Nutr. 77(Suppl.),
1065S−1072S. doi: 10.1093/ajcn/77.4.1065S
Vella, M. N., Stratton, L. M., Sheeshka, J., and Duncan, A. M. (2014). Functional
food awareness and perceptions in relation to information sources in older
adults. Nutr. J. 13:44. doi: 10.1186/1475-2891-13-44
Veronese, N., Stubbs, B., Noale, M., Solmi, M., Rizzoli, R., Vaona, A., et al. (2017).
Adherence to a Mediterranean diet is associated with lower incidence of frailty:
a longitudinal cohort study. Clin. Nutr. doi: 10.1016/j.clnu.2017.08.028. [Epub
ahead of print].
von Ruesten, A., Steffen, A., Floegel, A., van der, A. D. L., Masala, G., Tjønneland,
A., et al. (2011). Trend in obesity prevalence in European adult cohort
populations during follow-up since 1996 and their predictions to 2015. PLoS
ONE 6:e27455. doi: 10.1371/journal.pone.0027455
Wang, W. C., Worsley, A., and Cunningham, E. G. (2008). Social ideological
influences on reported food consumption and BMI. Int. J. Behav. Nutr. Phys.
Act. 5:20. doi: 10.1186/1479-5868-5-20
Wardle, J., Parmenter, K., and Waller, J. (2000). Nutrition knowledge and food
intake. Appetite 34, 269–275. doi: 10.1006/appe.1999.0311
Washburn, R. A., Smith, K. W., Jette, A. M., and Janney, C. A. (1993).
The Physical Activity Scale for the Elderly (PASE): development and
evaluation. J. Clin. Epidemiol. 46, 153–162. doi: 10.1016/0895-4356(93)
90053-4
WHO (1998). Obesity: Preventing and Managing the Global Epidemic. Report, of a
WHO Consultation on obesity, World Health Organization, Geneva.
WHO (2017).Obesity and Overweight. Fact sheet. Available Online at: http://www.
who.int/mediacentre/factsheets/fs311/en/
Conflict of Interest Statement: The authors declare that the research was
conducted in the absence of any commercial or financial relationships that could
be construed as a potential conflict of interest.
Copyright © 2018 Jeruszka-Bielak, Kollajtis-Dolowy, Santoro, Ostan, Berendsen,
Jennings, Meunier, Marseglia, Caumon, Gillings, de Groot, Franceschi, Hieke and
Pietruszka. This is an open-access article distributed under the terms of the Creative
Commons Attribution License (CC BY). The use, distribution or reproduction in
other forums is permitted, provided the original author(s) and the copyright owner(s)
are credited and that the original publication in this journal is cited, in accordance
with accepted academic practice. No use, distribution or reproduction is permitted
which does not comply with these terms.
Frontiers in Physiology | www.frontiersin.org 13 July 2018 | Volume 9 | Article 994