Embed Size (px)
Citation preview

Journal of Public Economics 90 (2006) 751–773
www.elsevier.com/locate/econbase
Are policy platforms capitalized into equity prices?
Evidence from the Bush/Gore 2000
Presidential Election
Brian Knight *
Brown University, United States
NBER, United States
Received 15 January 2005; received in revised form 15 June 2005; accepted 20 June 2005
Available online 15 August 2005
Abstract
This paper tests for the capitalization of policy platforms into equity prices using a sample of 70
firms favored under Bush or Gore platforms during the 2000U.S. Presidential Election. Two sources of
daily data during the six months leading up to the election are incorporated: firm-specific equity returns
and the probability of a Bush victory as implied by prices from the Iowa Electronic Market. For this
group of politically sensitive firms, the daily baseline estimates demonstrate that platforms are
capitalized into equity prices: under a Bush administration, relative to a counterfactual Gore
administration, Bush-favored firms are worth 3% more and Gore-favored firms are worth 6% less,
implying a statistically significant differential return of 9%. Estimates based onweekly returns are even
stronger, suggesting a differential return of 16%. The most sensitive sectors include tobacco, worth
13% more under a favorable Bush administration, Microsoft competitors, worth 15% less under an
unfavorable Bush administration, and alternative energy companies, worth 16% less under an
unfavorable Bush administration.
A corresponding analysis of campaign contributions, which allows for heterogeneity in the
importance of policy platforms to the firms, supports the baseline estimates.
D 2005 Elsevier B.V. All rights reserved.
Keywords: Elections; Political economy; Financial markets
0047-2727/$ -
doi:10.1016/j.
* Brown Un
E-mail add
see front matter D 2005 Elsevier B.V. All rights reserved.
jpubeco.2005.06.003
iversity, United States.
ress: [email protected].

B. Knight / Journal of Public Economics 90 (2006) 751–773752
1. Introduction
On the day following the U.S. Supreme Court ruling that guaranteed a victory for
George Bush in the 2000 Presidential Election, several media reports noted the increase in
prices of equities favored under Bush’s campaign platforms.1 Among these so-called Bush
stocks, Pfizer rose 4.1%, Exxon rose 1.3%, and Philip Morris rose 6.5%. While this
anecdotal evidence is suggestive of the capitalization of campaign platforms into equity
prices, other Bush stocks, such as Microsoft, fell in value on that day. Moreover, it is
difficult to separate the reaction of equity prices to this political event from other economic
and financial developments. A final complication of interpretation involves investor
expectations; in particular, these returns can only be interpreted as a lower bound on the
total value of favorable policies to these firms given that markets may have largely
factored in a Bush victory prior to the Supreme Court’s ruling.
Using evidence from the period preceding the 2000 U.S. Presidential Election, this paper
attempts to overcome these complications in a test for the capitalization of public policies
into equity prices using evidence from a sample of 70 firms favored under either Bush (41
firms) or Gore (29 firms) policy platforms. Two sources of daily data are incorporated:
private equity returns and candidate electoral prospects as implied by prices of political
future contracts from the Iowa Electronic Market. The daily baseline estimates provide
strong evidence that platforms are capitalized into equity prices: under the Bush
administration, relative to a counterfactual Gore administration, Bush-favored firms are
worth 3% more and Gore-favored firms are worth 6% less. Estimates based upon weekly
results are even stronger, suggesting a differential return of 16%. The most sensitive sectors
include tobacco, worth 13% more under a favorable Bush administration, Microsoft
competitors, worth 15% less under an unfavorable Bush administration, and alternative
energy companies, worth 16% less under an unfavorable Bush administration. A
corresponding analysis of campaign contributions, which allows for heterogeneity in the
importance of policy platforms to these firms, supports the baseline estimates.
These results provide evidence for the existence of election-contingent security markets, as
hypothesized by Musto and Yilmaz (2003); the authors demonstrate that, if such markets exist,
consumers will purchase these securities as a hedge against wealth risk induced by differing
candidate platforms over redistribution. In equilibrium, wealth considerations have no effect on
voting but redistribution is the same regardless of the outcome of the election. In the context of
the 2000 election, wealthy individuals could have purchased Gore-favored equities as a hedge
against a loss by Bush, who proposed to significantly reduce federal income tax rates at the top
end of the wealth and income distribution. Of course, this evidence does not prove that voters
adopted such strategies but rather merely provides evidence on their feasibility.
2. Related empirical literature
Several studies have tested for the capitalization of federal tax policies into equity
prices by studying the response of equity prices to political developments during
1 See, for example, The New York Times, December 14, 2000.
B. Knight / Journal of Public Economics 90 (2006) 751–773 753
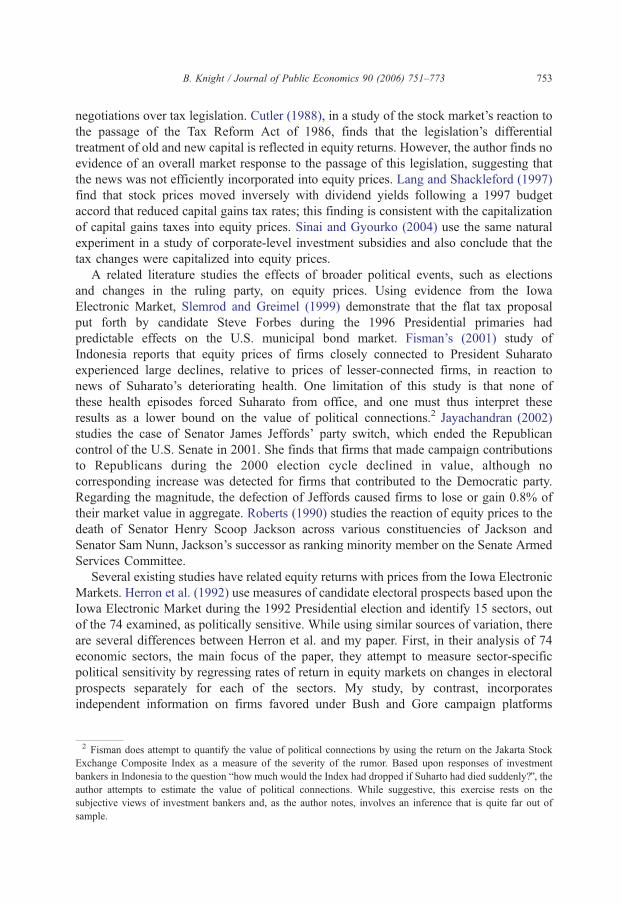
negotiations over tax legislation. Cutler (1988), in a study of the stock market’s reaction to
the passage of the Tax Reform Act of 1986, finds that the legislation’s differential
treatment of old and new capital is reflected in equity returns. However, the author finds no
evidence of an overall market response to the passage of this legislation, suggesting that
the news was not efficiently incorporated into equity prices. Lang and Shackleford (1997)
find that stock prices moved inversely with dividend yields following a 1997 budget
accord that reduced capital gains tax rates; this finding is consistent with the capitalization
of capital gains taxes into equity prices. Sinai and Gyourko (2004) use the same natural
experiment in a study of corporate-level investment subsidies and also conclude that the
tax changes were capitalized into equity prices.
A related literature studies the effects of broader political events, such as elections
and changes in the ruling party, on equity prices. Using evidence from the Iowa
Electronic Market, Slemrod and Greimel (1999) demonstrate that the flat tax proposal
put forth by candidate Steve Forbes during the 1996 Presidential primaries had
predictable effects on the U.S. municipal bond market. Fisman’s (2001) study of
Indonesia reports that equity prices of firms closely connected to President Suharato
experienced large declines, relative to prices of lesser-connected firms, in reaction to
news of Suharato’s deteriorating health. One limitation of this study is that none of
these health episodes forced Suharato from office, and one must thus interpret these
results as a lower bound on the value of political connections.2 Jayachandran (2002)
studies the case of Senator James Jeffords’ party switch, which ended the Republican
control of the U.S. Senate in 2001. She finds that firms that made campaign contributions
to Republicans during the 2000 election cycle declined in value, although no
corresponding increase was detected for firms that contributed to the Democratic party.
Regarding the magnitude, the defection of Jeffords caused firms to lose or gain 0.8% of
their market value in aggregate. Roberts (1990) studies the reaction of equity prices to the
death of Senator Henry Scoop Jackson across various constituencies of Jackson and
Senator Sam Nunn, Jackson’s successor as ranking minority member on the Senate Armed
Services Committee.
Several existing studies have related equity returns with prices from the Iowa Electronic
Markets. Herron et al. (1992) use measures of candidate electoral prospects based upon the
Iowa Electronic Market during the 1992 Presidential election and identify 15 sectors, out
of the 74 examined, as politically sensitive. While using similar sources of variation, there
are several differences between Herron et al. and my paper. First, in their analysis of 74
economic sectors, the main focus of the paper, they attempt to measure sector-specific
political sensitivity by regressing rates of return in equity markets on changes in electoral
prospects separately for each of the sectors. My study, by contrast, incorporates
independent information on firms favored under Bush and Gore campaign platforms
2 Fisman does attempt to quantify the value of political connections by using the return on the Jakarta Stock
Exchange Composite Index as a measure of the severity of the rumor. Based upon responses of investment
bankers in Indonesia to the question bhow much would the Index had dropped if Suharto had died suddenly?Q, theauthor attempts to estimate the value of political connections. While suggestive, this exercise rests on the
subjective views of investment bankers and, as the author notes, involves an inference that is quite far out of
sample.

B. Knight / Journal of Public Economics 90 (2006) 751–773754
and uses this information to uncover the significance of these platforms.3 Note that this
type of independent information is required in order to provide evidence for the existence
of election-contingent securities as hypothesized in Musto and Yilmaz (2003). Second, as
an attempt to address potential reverse causation, my paper develops several instruments
for the prices from the Iowa Electronic Market. In a paper of which I became aware after
writing the first draft of my paper, Mattozzi (2005) independently constructs an index of
equity prices for firms making significant campaign contributions to Bush and Gore; he
finds that Bush stocks rose in value as the probability of a Bush victory increases, as
implied by the Iowa Electronic Market, while firms contributing to Gore experienced
corresponding declines.
This paper is also related to a broader literature on whether or not the release of new
information moves stock market prices. Cutler et al. (1988) find that neither news
associated with macroeconomic developments nor major world events fully explain
movements in the S and P 500. Elmendorf et al. (1900) examine movements in bond prices
in Britain resulting from events leading up to and including World War I; they find that the
variance of returns is higher in weeks with important news than in other weeks. Wolfers
and Zitzewitz (2004) examine the economic consequences of war in Iraq by correlating
data from financial markets with the price from a futures contract that pays only if Saddam
Hussein is ousted by a certain date. They conclude that the war raised oil prices $10 per
barrel and lowers the value of U.S. equities 15%.
While this paper focuses on the electoral-induced redistribution of resources across
industries, a much larger literature examines the aggregate macroeconomic implications of
elections. With forward-looking voters, uncertain election outcomes, and Democrats,
relative to Republicans, preferring higher inflation rates in return for lower unemployment
rates, the resolution of electoral outcomes has macroeconomic implications. In particular,
Democratic administrations should be associated with decreases in unemployment rates
and increases in inflation rates, while the reverse should hold for Republican
administrations.4 Historical evidence from the U.S. generally supports these predictions;
see Mueller (2003) for further information.
3. Sources of daily data
3.1. Probability of Bush victory
The first data source provides information on the relative electoral prospects of the two
candidates. Beginning May 1, 2000, the Iowa Electronic Market, a prediction market, was
open for trading in the 2000 U.S. Presidential Market. Market participants traded futures
contracts on the candidates; those purchasing the Republican contract, for example, were
paid $1 in the event of a Bush victory in the popular vote. Given the structure of this
3 In a separate analysis, which is not the main focus of their paper, they do incorporate information from a First-
Boston list of pro-Clinton sectors. This analysis, however, does not incorporate pro-Bush sectors and is limited to
16 sectors, only two of which are found to be statistically significant.4 See Alesina (1987, 1988), and Alesina and Rosenthal (1995).

B. Knight / Journal of Public Economics 90 (2006) 751–773 755
contract, the market price can be interpreted as the probability of a Bush victory.5 I have
obtained closing prices from the Iowa Electronic Market as of 4 p.m. Eastern time,
allowing for synchronization with the closing price data on equities from financial
markets.
As shown in Fig. 1, the Iowa Electronic Market data demonstrate that the 2000 race was
extremely close throughout the six months preceding the election, with Gore taking the
lead following the Republican National Convention (labeled RNC) and the Democratic
National Convention (labeled DNC), both held in August, before Bush pulled ahead
during the three Presidential debates (labeled D1, D2, and D3), which were held during
October. Bush extended this lead in early November, and, by November 6, the eve of the
election and final day of the sample, the implied probability of a Bush victory had risen to
just over 75%.
While contracts based upon the electoral college, rather than the popular vote,
would be preferable, I believe that the ex-post divergence between the electoral college
and popular vote outcomes in the 2000 election was largely unexpected and thus
electoral college contract prices would have been similar to those of the popular vote
contracts. Such divergences are historically rare; the previous divergence occurred in
1888. In the 2000 election, neither candidate had a significant ex-ante electoral college
advantage. Analysts expected, if anything, Gore to have a slight electoral college
advantage.6
For several reasons, the Iowa Electronic Market data are preferred to tracking poll
data. First, the latter data provide expected vote shares while the former data provide
probabilities of victory. Such probabilities, as will be shown below, are required in
order to quantify the value of favorable policies.7 The second advantage of the Iowa
Electronic Market data involves efficiency. According to an analysis of 15 elections, the
market worked extremely well, dominating opinion polls on average in forecasting the
outcome of the election (Berg et al., 2001).8 Even given these limitations associated with
polling data, Fig. 2 demonstrates that Gallup tracking poll data, which are available on a
daily basis beginning September 7, 2000, move in tandem with prices from the Iowa
Electronic Market. As shown in Table 1, a regression of Bush’s share of the two-party
support in the Gallup poll on the IEM Bush contract price demonstrates that this
relationship is statistically significant, and this result is robust to a specification in first
differences.
5 While researchers typically treat prices in prediction markets as probabilities that a contracted event will occur,
Manski (2004) challenges this treatment. In a model with risk-neutral traders who have heterogeneous beliefs, he
argues that prices in prediction markets only partially identify the central tendency of beliefs. In a reply, Wolfers
and Zitzewitz (2005) provide sufficient conditions for the treatment of prices in prediction markets as event
probabilities.6 New York Times, October 27, 2000.7 Of course, one could attempt to map vote shares into probabilities, but this relationship is likely to be non-
linear and time dependent; movements in vote shares imply small swings in probabilities early in the campaign
but the magnitude of such swings increases as election day approaches.8 See also Forsythe et al. (1992) and Rhode and Strumpf (2003) for a historical analysis of Presidential election
betting markets.

Dai
ly D
ata
date
Pr(Gore) Pr(Bush)
01may2000 01jul2000 01sep2000 01nov2000
.2
.35
.5
.65
.8
........................................................................................................................................................................................................................................................................................ .............................................................................................................................................................................................................................................................................................................................................................. ..................................................................................................................................................................................................................
......................................................................
......................................................................
.............................................................................................................................................................................................................................................................................................................................................................. ........................................................................................................................................................................................................................................................................................
.............................................................................................................................................................................................................................................................................................................................................................. ......................................................................................................................................................................................................................................................................................................................................................................................................................................................................................................................................................................................................................................................
.................................................................................................................................................................................................................................................................................................................................................................................................................................... ...................................................................... .................................................................................................................................................................................................................. ..................................................................................................................................................................................................................
............................................................................................................................................ .............................................................................................................................................................................................................................................................................................................................................................. ..................................................................................................................................................................................................................
.............................................................................................................................................................................................................................................................................................................................................................. ...................................................................... ..............................................................................................................................................................................................................................................................................................................................................................
........................................................................................................................................................................................................................................................................................
.............................................................................................................................................................................................................................................................................................................................................................. ......................................................................
........................................................................................................................................................................................................................................................................................ ......................................................................
.................................................................................................................................................................................................................. ......................................................................
........................................................................................................................................................................................................................................................................................
............................................................................................................................................................................................................................................................................................................................................................................................................................................................................................................................................................................................................................................................................................................................
......................................................................
......................................................................
............................................................................................................................................
........................................................................................................................................................................................................................................................................................
......................................................................
......................................................................
............................................................................................................................................
......................................................................
......................................................................
..................................................................................................................................................................................................................
......................................................................
......................................................................
..................................................................................................................................................................................................................
............................................................................................................................................
Wee
kly
Dat
a
date
Pr(Gore) Pr(Bush)
01may2000 01jul2000 01sep2000 01nov2000
.2
.35
.5
.65
.8
D1D2
DNC
RNC D3
Fig. 1. Electoral probabilities from the Iowa Electronic Market.
B. Knight / Journal of Public Economics 90 (2006) 751–773756
3.2. Equity returns
Equity prices are taken from the Dow Jones Interactive Service and are adjusted for
dividends and stock splits. To account for broader trends in equity markets during the
sample period, I follow event study methodology outlined by MacKinlay (1997) and use

date
iembush pollsbush
07sep2000 01oct2000 01nov2000
.25
.5
.75
Fig. 2. Gallup tracking poll versus Iowa Electronic Market.
B. Knight / Journal of Public Economics 90 (2006) 751–773 757
abnormal returns in the analysis. In order to calculate these abnormal returns, I first
estimate the following market model:
rit ¼ ai þ birmt þ eit ð1Þ
where rit is the daily rate of return of firm i on day t. As a measure of broad market returns
(rmt), I use the Wilshire 5000. The market model is estimated between May 1, 1999 and
April 30, 2000, the one-year period preceding the opening of the Iowa Electronic Market
on May 1, 2000. Based on the estimated parameters (ai, bi) from firm-specific regressions,
Table 1
Iowa Electronic Market and Gallup tracking poll
Specification (1) (2)
Levelsa First differencesb
Constant �0.8696** 0.0045
(0.1909) (0.0035)
Bush share of two-party vote 2.6832** 0.7522**
(0.3775) (0.1873)
Obs 61 60
R-squared 0.4612 0.2175
OLS regression with standard errors in parentheses. **denotes 95% significance, *denotes 90% significance.a Dependent variable is the Bush contract on the Iowa Electronic Market. The independent variable is Bush’s
share of the two-party vote in Gallup tracking poll data. Daily data cover the period September 7, 2000–
November 6, 2000.b Dependent variable is the change in the price of a Bush contract on the Iowa Electronic Market. The
independent variable is the change in Bush’s share of the two-party vote in Gallup tracking poll data. Daily data
cover the period September 8, 2000–November 6, 2000.

Table 2
Firm Ticker Lehman Prudential ISI Group Sector
Firms favored under Bush platform
Aetna AET Yes
Alliance Capital Management AC Yes
Ambac Financial Group ABK Yes
Baker Hughes BHI Yes Energy
Boeing BA Yes Defense
BP Amoco BP Yes Yes Energy
Bristol Meyers Squibb BMY Yes Yes Pharmaceuticals
Charles Schwab SCH Yes
Chevron CVX Yes Energy
El Paso Energy EPG Yes Energy
Eli Lilly LLY Yes Yes Pharmaceuticals
Enron ENRN Yes Energy
Genentech DNA Yes
General Dynamics GD Yes Yes Defense
Georgia–Pacific Group GP Yes Energy
Goldman Sachs Group GS Yes
Household International HI Yes
Lockheed Martin LMT Yes Yes Yes Defense
Loews LTR Yes Tobacco
MBIA MBI Yes
Merck MRK Yes Pharmaceuticals
Microsoft MSFT Yes Yes Yes Microsoft case
Nabors Industry NBR Yes Energy
Nationwide Financial NFS Yes
Northrop Grumman NOC Yes Defense
Pfizer PFE Yes Yes Pharmaceuticals
Pharmacia PHA Yes Pharmaceuticals
Philip Morris MO Yes Yes Tobacco
Providian Financial PVN Yes
Raytheon RTN Yes Defense
RJR Tobacco Holdings RJR Yes Tobacco
SBC Communications SBC Yes
Schering Plough SGP Yes Pharmaceuticals
SLM Holding SLM Yes Yes
State Street STT Yes
T. Rowe Price Associates TROW Yes Yes
United Health Group UNH Yes Yes
Verizon VZ Yes
WebMD HLTH Yes
Wellpoint Health Networks WLP Yes
Weyerhaeuser WY Yes Yes Energy
Firms favored under gore platform
America Online AOL Yes Yes Microsoft case
American General Corporation AGC Yes
American International Group AIG Yes
Archer Daniels Midland ADM Yes
AT and T T Yes
AXA Financial RAXF Yes
B. Knight / Journal of Public Economics 90 (2006) 751–773758

Table 2 (continued)
Firm Ticker Lehman Prudential ISI Group Sector
Bank One ONE Yes
Caremark RX CMX Yes Pharmaceuticals
Deere DE Yes
Exodus Communications EXDSQ Yes
Express Scripts ESRX Yes Pharmaceuticals
Fannie Mae FNM Yes Yes Yes
Fleet Boston Financial FBF Yes
Freddie Mac FRE Yes Yes Yes
H and R Block HRB Yes
Lincoln National LNC Yes
Linux LNUX Yes Microsoft case
Marsh and Mclennan MMC Yes
Oracle ORCL Yes Microsoft case
Plug Power PLUG Yes Energy
Roy F. Weston WSTNA Yes Energy
Sevenson Environmental SEVN Yes Yes Energy
Sun Microsystems SUNW Yes Yes Yes Microsoft case
Syntroleum SYNM Yes Energy
TEVA Pharmaceutical TEVA Yes Pharmaceuticals
The Chubb Corporation CB Yes
The Hartford Financial Services Group HIG Yes
Watson Phamaceutical WPI Yes Pharmaceuticals
B. Knight / Journal of Public Economics 90 (2006) 751–773 759
I then calculate daily abnormal returns (rit), which are net of market returns, for the period
May 1, 2000 through November 6, 2000 as follows:
rrit ¼ rit ��aai þ bbirmt
�ð2Þ
These abnormal returns are then used in the empirical analysis below.
4. Analysis of campaign platforms
As measures of Bush and Gore platforms, I use reports from financial analysts associated
with Lehman Brothers, Prudential Securities, and International Strategy and Investment.
These reports were produced during the campaign and identified firms likely to fare well
under Bush and Gore administrations. As shown in Table 2, these three reports list 41 firms
in total favored under Bush campaign platforms and 29 firms favored under Gore platforms.9
Key differences in these campaign platforms are listed below:
(1) Pharmaceuticals: Gore favored price controls and promoted generic pharmaceuticals, while
Bush defended large pharmaceuticals and opposed price controls.
9 One reader was surprised that H and R Block was listed as a Gore firm. With both candidates proposing
significant changes in the tax code, one would expect H and R Block to do well in either case. It is important to
note, however, that this firm is engaged in many lines of business unrelated to tax policy.
B. Knight / Journal of Public Economics 90 (2006) 751–773760
(2) Defense: Bush favored large spending increases, while Gore focused on improving technology.
(3) Energy: Bush favored an expansion of domestic exploration of conventional energy sources,
such as oil in the Arctic National Wildlife Refuge (ANWR), while Gore promoted the
development of alternative energy sources.
(4) Microsoft case: While neither candidate committed to a specific policy regarding Microsoft,
Bush was seen by most analysts as more pro-Microsoft than was Gore. In September 2001,
following Bush’s inauguration, the Justice Department dropped efforts initiated by the Clinton
Administration to break up Microsoft.
(5) Tobacco: Gore favored allowing the FDA to regulate nicotine as an addictive substance, while
Bush did not commit to a specific platform on this issue.
While these 70 firms represent a small fraction of the roughly 6000 publicly traded
firms in the United States, these are some of the largest firms. As of May 1, 2000, the first
day of the sample period, the aggregate market capitalization of these 70 firms totaled
almost $3 trillion, representing almost one-fifth of the $16 trillion market capitalization of
the Wilshire 5000, which includes nearly all publicly traded equities.
As shown in Fig. 3, the probability of Bush victory is positively correlated with the log
difference between Bush and Gore equity prices, especially in the three months preceding
the election, suggesting that policy platforms matter for firm profitability. Equity market
returns, however, appear to be a leading indicator of the price of a Bush contract in the
Iowa Electronic Market, suggesting that political news may be incorporated more quickly
into financial markets than it is incorporated into the Iowa Electronic Market. The
empirical analysis below will address this issue of potential market inefficiency in a
variety of ways.
4.1. Empirical model
Consider the following empirical model of firm i’s rate of return at time t:
rit ¼ ai þ b1BushQfavored iDPrðBushÞt þ b2GoreQfavorediDPr Bushð Þt þ uit ð3Þ
where Bush-favoredi =1-Gore-favoredi indicates whether the firm is favored under the
Bush platform, DPr(Bush)t indicates the daily change in the probability of a Bush victory,
uit captures unobserved factors affecting returns, and ai, b1, and b2 represent parameters
to be estimated. The fixed effects (ai) allow for firm-specific trends in equity prices
during the sample period, while b1, and b2 are the key parameters in the test for
capitalization; these parameters can be interpreted as follows:
E ritjPr Bushð Þt ¼ 1; Pr Bushð Þt�1 ¼ 0� �
� E ritjDPr Bushð Þt ¼ 0� �
¼ b1 if BushQfavoredi ¼ 1
b2 if BushQfavoredi ¼ 0
�ð4Þ
Thus, the parameter b1 can be interpreted as the percentage difference in a Bush-
favored firm’s market value under a Bush administration, relative to a counterfactual Gore
administration, while b2 captures a similar percentage difference for Gore-favored firms.
The capitalization hypothesis predicts b1N0 and b2b0.

Dai
ly D
ata
Log difference in price Pr(Bush)
.062432
.19422
.301
.759
Wee
kly
Dat
a
date
Log difference in price Pr(Bush)
01may2000 01jul2000 01sep2000 01nov2000
.078167
.185219
.322
.681
01sep2000 01nov200001jul200001may2000date
Fig. 3. Bush and Gore average stock prices.
B. Knight / Journal of Public Economics 90 (2006) 751–773 761

B. Knight / Journal of Public Economics 90 (2006) 751–773762
4.2. Baseline results
As shown in column 1 of Table 3, the preliminary results demonstrate that, for this
group of politically sensitive firms, campaign platforms matter for firm profitability, and
this relationship is both economically and statistically significant. Gore-favored firms are
worth 6% less under a Bush administration, relative to a friendlier Gore administration.
Bush-favored firms, by contrast, are worth 3% more under a friendlier Bush
Administration. In monetary terms, Bush’s victory over Gore transferred over $100
billion in market capitalization from the 29 Gore-favored firms to the 41 Bush-favored
Table 3
Capitalization of policy platforms: baseline estimates
Specification (1) (2) (3) (4) (5)
OLSa OLSb Polls IVc Polls IVd Weekend IVe
Frequency Daily Weekly Daily Weekly Daily
DPr(Bush)*Gore-favored �0.0554** �0.1197** �0.0954** �0.0471 �0.0125(0.0210) (0.0468) (0.0483) (0.0962) (0.0377)
Dr(Bush)*Bush-favored 0.0308* 0.0410 0.0446 0.1474* 0.1278**
(0.0177) (0.0394) (0.0406) (0.0809) (0.0317)
Obs 9310 1820 2940 560 1890
R-squared 0.0196 0.1320 0.0319 0.1964 0.0415
Equity fixed effects yes yes yes yes yes
Differential return 0.0862** 0.1607** 0.1400** 0.1945 0.1403**
(0.0275) (0.0612) (0.0631) (0.1257) (0.0493)
Regressions with standard errors in parentheses. **denotes 95% significance, *denotes 90% significance.a OLS regression of the firm-specific abnormal rate of return on the change in the price of a Bush contract on
the Iowa Electronic Market. 41 Bush-favored and 29 Gore-favored firms are those identified in reports of
financial analysts associated with Lehman, Prudential, and ISI. Daily data cover the period May 1, 2000–
November 6, 2000.b OLS regression of the firm-specific abnormal rate of return on the change in the price of a Bush contract on
the Iowa Electronic Market. 41 Bush-favored and 29 Gore-favored firms are those identified in reports of
financial analysts associated with Lehman, Prudential, and ISI. Weekly data (Friday close to Friday close) cover
the period May 1, 2000–November 6, 2000.c IV regression of the firm-specific abnormal rate of return on the change in the price of a Bush contract on the
Iowa Electronic Market. 41 Bush-favored and 29 Gore-favored firms are those identified in reports of financial
analysts associated with Lehman, Prudential, and ISI. Instrument is Bush’s share of the 2-party vote in Gallup
tracking poll data. Daily data cover the period September 1, 2000–November 6, 2000.d IV regression of the firm-specific abnormal rate of return on the change in the price of a Bush contract on the
Iowa Electronic Market. 41 Bush-favored and 29 Gore-favored firms are those identified in reports of financial
analysts associated with Lehman, Prudential, and ISI. Instrument is the Bush’s share of the 2-party vote in Gallup
tracking poll data. Weekly data (Friday close to Friday close) cover the period September 1, 2000–November 6,
2000.e IV regression of the firm-specific abnormal rate of return on the change in the price of a Bush contract on the
Iowa Electronic Market. 41 Bush-favored and 29 Gore-favored firms are those identified in reports of financial
analysts associated with Lehman, Prudential, and ISI. The Friday to Sunday change in the price of a Bush contract
serves as an instrument for the Friday to Monday change in the price of a Bush contract. In two cases, Memorial
Day and Labor Day, financial markets were closed on Mondays. In this case, the Friday to Monday change in the
price of a Bush contract serves as an instrument for the Friday to Tuesday change in the price of a Bush contract.
Daily data cover the period May 1, 2000–November 6, 2000.
B. Knight / Journal of Public Economics 90 (2006) 751–773 763
firms.10 The differential return (b1�b2), as shown at the bottom of Table 3, is 9% and is
statistically significant at conventional levels; this statistic provides a somewhat weaker
test of the capitalization hypothesis and is more consistent with the evidence in Fig. 3,
which depicts returns for Bush-favored equities relative to Gore-favored equities.
As shown, the political measures have limited explanatory power as the R-squared is
only 0.0196. While each of the 133 events has only limited explanatory power, this
limitation must be balanced against two benefits. First, as noted above, event studies in the
existing literature often measure only a lower bound on the value of favorable policies,
while, by utilizing probability-based measures, my study provides a point estimate.
Second, the large number of events in my study provides additional statistical power.11
4.3. Robustness checks
One concern over the use of prices from the Iowa ElectronicMarket is the relatively small
market size; the median day during the sample period witnessed just 229 trades in the Bush
contract. This small market volume could lead to several econometric problems. One
possibility is classical measurement error: these prediction market prices may imprecisely
measure the true probability of a Bush victory. While we cannot directly test for such
measurement error, we do find evidence of negative serial correlation in the changes in the
price of Bush contract.12 This negative serial correlation in changes in the price of a Bush
contract is consistent with measurement error in the price level of a Bush contract.13
Given the problems associated with such measurement error, namely a bias towards
zero in the coefficients, we next estimate a model using weekly data (Friday close to
Friday close), for which the high frequency movements will be less important, relative
to analyses using daily data.14 As shown in Column 2 of Table 3, the R-squared rises
11 For comparison purposes, I also conducted a event study analysis based upon the Florida recount. The results
of this analysis, which are available upon request from the author, demonstrate that Bush-favored firms
outperformed Gore-favored firms between November 8, the day after the election, and December 14, the day after
Gore’s concession, by roughly 2 percentage points.12 To test for this serial correlation, we estimated an AR(1) model for the daily series of changes in the price of a
Bush contract; the estimated correlation is �0.18.13 To formalize this argument, suppose that the price of a Bush contract in the Iowa Electronic Market can be
represented as the sum of the true probability and a random component: Pr(Bush)tIEM=Pr(Bush)t
true+ e t, where e thas mean zero and variance r2 and is distributed independently across time. For simplicity, assume further that the
true probability follows a random walk. In this case, there will be negative serial correlation in changes in the
price of a Bush contract: cov(DPr(Bush)tIEM, DPr(Bush)t � 1
IEM)=�r2. To understand this result, consider a day with
a positive measurement error (e t N0); this measurement error in the price level will tend to increase the
contemporaneous change in the price of a Bush contract (DPr(Bush)tIEM) but will tend to decrease the following
day’s change (DPr(Bush)t +1IEM).
14 Following the setup in Footnote 13, we have that the true probability of a Bush victory follows a random
walk: DPr(Bush)ttrue=Pr(Bush)t � 1
true+ut, where ut is random. Then, it is straightforward to demonstrate that
measurement error is relatively less important in lower frequency data: var(Pr(Bush)tIEM�Pr(Bush)t� k
IEM)=
kvar(ut)+2r2. Thus, as k increases, relatively more true information is provided in price changes of a Bush
contract. Intuitively, measurement error is independent of the frequency while the number of informative
shocks is higher in lower frequency data.
10 As of May 1, 2000, the first day of the sample period, the 29 Gore-favored firms had a total market
capitalization of $1.1 trillion, while the 41 Bush-favored firms had a $1.9 trillion capitalization.

B. Knight / Journal of Public Economics 90 (2006) 751–773764
significantly from 0.02 to 0.13, and the estimated value of favorable policies for Gore-
favored firms rises substantially from 6% to 12%, and this result is statistically significant
at conventional levels. The estimated value of favorable policies for Bush-favored firms
also rises from 3% to 4%, although this result is statistically insignificant, perhaps
reflecting the loss in power from the reduced sample size. The differential return also rises
from 9% to 16%, a statistically significant result.
Another potential econometric problem with low volume in the IEM is that political
news may be incorporated more quickly into financial markets. This lag in political news
reaching prediction markets is consistent with the evidence in Fig. 3, in which financial
market prices appear to lead prediction market prices. To the extent that political news is
incorporated more quickly into financial markets, participants in prediction markets may
use financial market data in order to forecast the probability of a Bush victory, providing a
further complication. In particular, this forecasting by prediction market traders will tend
to bias the coefficient on the price of a Bush contract away from zero (Wolfers and
Zitzewitz, 2004). Given our focus on firm-specific abnormal returns, which are net of
broader financial market developments, we do not feel that this problem is a first-order
concern in our empirical study. That is, our coefficients will only be biased if prediction
market participants condition on sector-specific or firm-specific equity returns. For
completeness, however, we empirically address these concerns of reverse causation in
three ways.
The first approach to addressing reverse causation uses tracking polling data as an
instrument for the price of a Bush contract. If prediction market participants condition on
both polling data and financial data in forecasting the probability of a Bush victory, then
the instrumental variables analysis will use only the variation in prediction market prices
associated with this arguably exogenous polling data, and the IV estimator will
consistently estimate the parameters of interest (b1, b2). As shown in the columns 3
and 4 of Table 3, the results of this instrumental variables analysis are qualitatively similar
to those in the baseline analysis.15
As a second attempt at addressing possible reverse causation, we exploit the fact that the
Iowa Electronic Market, but not financial markets, are open for trading on weekends. Thus,
during the weekends, trading on the Iowa Electronic Market cannot be influenced by
financial market developments. In particular, we use the weekend change (Friday close to
Sunday close) in the price of a Bush contract as an instrument for the Friday close toMonday
close change in the price of Bush contract.16 The dependent variable in this case is the
Friday close to Monday close rate of return in equity prices and we thus ignore financial
market activity on the other four weekdays. As shown in column 5 of Table 3, these results
suggest that Gore-favored firms are insensitive to changes in the probability of a Bush
victory, while Bush-favored firms are worth 13% more under a Bush Administration.
15 First-stage results are similar to those in column 2 of Table 1. The only difference is that the Table 1 results
include both weekday and weekend days, while the IVanalysis includes only weekdays given the lack of financial
market data on weekends.16 In two cases, Memorial Day and Labor Day, financial markets were closed on Mondays. In this case, we use
the Friday to Monday change in the price of a Bush contract as an instrument for the Friday to Tuesday change in
the price of Bush contract.

B. Knight / Journal of Public Economics 90 (2006) 751–773 765
The third approach directly addresses the potential problem of delays in political news
reaching prediction markets. In particular, Table 4 presents the coefficients on the
contemporaneous change in the price of a Bush contract after controlling for leads and lags
Table 4
Capitalization of policy platforms: robustness checks controlling for IEM leads and lags
(1) (2) (3) (4)
Frequency Dailya Weeklyb Dailyc Weeklyd
Lag/lead structure 4 lags 1 lag 4 leads 1 lead
DPr(Bush)t *Gore-favored �0.0586** �0.1255** �0.0550** �0.0889*(0.0210) (0.0472) (0.0222) (0.0502)
DPr(Bush)t *Bush-favored 0.0351** 0.0401 0.0297 0.0490
(0.0177) (0.0397) (0.0186) (0.0422)
DPr(Bush)t + /�1*Gore-favored 0.0127 �0.0599 �0.0076 �0.0119(0.0212) (0.0504) (0.0220) (0.0469)
DPr(Bush)t+/�1*Bush-favored 0.0144 0.0757* �0.0399** �0.0308(0.0178) (0.0424) (0.0185) (0.0395)
DPr(Bush)t+/�2*Gore-favored �0.0036 �0.0087(0.0220) (0.0220)
DPr(Bush)t+/�2*Bush-favored 0.1050** 0.0052
(0.0185) (0.0185)
DPr(Bush)t+/�3*Gore-favored �0.0532** �0.0197(0.0220) (0.0212)
DPr(Bush)t+/�3*Bush-favored �0.0512** 0.0516**
(0.0185) (0.0178)
Dr(Bush)t+/�4*Gore-favored 0.0049 �0.0485(0.0221) 0.0211
Dr(Bush)t+/�4*Bush-favored �0.0223 �0.0296*(0.0186) 0.0177
Obs 9030 1750 9030 1750
R-squared 0.0242 0.1330 0.0229 0.1295
Equity fixed effects yes yes yes yes
Differential return 0.0938** 0.1656** 0.0848** 0.1379**
(0.0275) (0.0616) (0.0290) (0.0655)
Regressions with standard errors in parentheses. **denotes 95% significance, *denotes 90% significance.a OLS regression of the firm-specific abnormal rate of return on the change in the price of a Bush contract on
the Iowa Electronic Market. 41 Bush-favored and 29 Gore-favored firms are those identified in reports of
financial analysts associated with Lehman, Prudential, and ISI. Daily data cover the period May 5, 2000–
November 6, 2000.b OLS regression of the firm-specific abnormal rate of return on the change in the price of a Bush contract on
the Iowa Electronic Market. 41 Bush-favored and 29 Gore-favored firms are those identified in reports of
financial analysts associated with Lehman, Prudential, and ISI. Weekly data (Friday close to Friday close) cover
the period May 8, 2000–November 6, 2000.c OLS regression of the firm-specific abnormal rate of return on the change in the price of a Bush contract on
the Iowa Electronic Market. 41 Bush-favored and 29 Gore-favored firms are those identified in reports of
financial analysts associated with Lehman, Prudential, and ISI. Daily data cover the period May 1, 2000–
November 2, 2000.d OLS regression of the firm-specific abnormal rate of return on the change in the price of a Bush contract on
the Iowa Electronic Market. 41 Bush-favored and 29 Gore-favored firms are those identified in reports of
financial analysts associated with Lehman, Prudential, and ISI. Weekly data (Friday close to Friday close) cover
the period May 1, 2000–October 31, 2000.

B. Knight / Journal of Public Economics 90 (2006) 751–773766
in the change in the price of a Bush contract. Column 1 presents results controlling for 4
lags in the change in the price of a Bush contract. While several of these lag terms are
statistically significant, the contemporaneous results are similar to those in the baseline
results of Table 3 even after controlling for these lagged effects. Incorporating a one-week
lag into the weekly specification (column 2) again produces results similar to those in the
baseline analysis. Columns 3 and 4 present results incorporating leads of changes in the
price of a Bush contract. If political news is incorporated into prediction markets with a
lag, then the coefficients on these leads will measure the relationship of interest and the
coefficient on the contemporaneous change in the price of a Bush contract will be zero.
Again, although several of these coefficients on the lead terms are statistically significant,
the coefficients on the contemporaneous change in the price of a Bush contract are similar
to those in the baseline analysis.
As a further robustness check, Table 5 splits the daily sample in a variety of ways
according to Iowa Electronic Market institutional details. The first institutional detail
involves the size of price changes. Large changes in prices of futures contracts may
represent real political news, while smaller changes may simply reflect noisy trading
Table 5
Capitalization of policy platforms: robustness checks with daily data
Subsample (1) (2) (3) (4)
DPr(Bush) largea DPr(Bush) smallb High volumec Low volumed
DPr(Bush)*Gore-favored �0.0569** �0.2515* �0.0532** �0.0805(0.0220) (0.1481) (0.0214) (0.0648)
DPr(Bush)*Bush-favored 0.0328* �0.1249 0.0184 0.1134**
(0.0185) (0.1246) (0.0180) (0.0545)
Obs 4690 4620 4690 4620
R-squared 0.0190 0.0315 0.0272 0.0190
Equity fixed effects yes yes yes yes
Differential return 0.0897** 0.1266 0.0715** 0.1939**
(0.0287) (0.1936) (0.0280) (0.0847)
Regressions with standard errors in parentheses. **denotes 95% significance, *denotes 90% significance.a OLS regression of the firm-specific abnormal rate of return on the change in the price of a Bush contract on
the Iowa Electronic Market. 41 Bush-favored and 29 Gore-favored firms are those identified in reports of
financial analysts associated with Lehman, Prudential, and ISI. Daily data cover the period May 1, 2000–
November 6, 2000. Large changes are those days with changes in the price of a Bush contract greater than 1
percentage point.b OLS regression of the firm-specific abnormal rate of return on the change in the price of a Bush contract on
the Iowa Electronic Market. 41 Bush-favored and 29 Gore-favored firms are those identified in reports of
financial analysts associated with Lehman, Prudential, and ISI. Daily data cover the period May 1, 2000–
November 6, 2000. Small changes are those days with changes in the price of a Bush contract of less than or equal
to 1 percentage point.c OLS regression of the firm-specific abnormal rate of return on the change in the price of a Bush contract on
the Iowa Electronic Market. 41 Bush-favored and 29 Gore-favored firms are those identified in reports of
financial analysts associated with Lehman, Prudential, and ISI. Daily data cover the period May 1, 2000–
November 6, 2000. High volume days are those with at least 229 trades in the Bush contract.d OLS regression of the firm-specific abnormal rate of return on the change in the price of a Bush contract on
the Iowa Electronic Market. 41 Bush-favored and 29 Gore-favored firms are those identified in reports of
financial analysts associated with Lehman, Prudential, and ISI. Daily data cover the period May 1, 2000–
November 6, 2000. Low volume days are those with less than 229 trades in the Bush contract.

B. Knight / Journal of Public Economics 90 (2006) 751–773 767
patterns. The first two columns support this hypothesis: the sample of days with large
changes (greater than one percentage point in absolute value) in the price of a Bush
contract supports a statistically significant result, while the sample of days with small
changes (less than or equal to one percentage point), by contrast, provides statistically
insignificant results for the Bush-favored firms. The second split of the data involves
trading volume. As mentioned above, on thinly traded days, market prices may not
Table 6
Capitalization of policy platforms: sector analysis
Specification (1) (2)
Dailya Weeklyb
Panel A: pharmaceutical
DPr(Bush)*Gore-favored 0.0145 �0.2818**(0.0536) (0.1160)
DPr(Bush)*Bush-favored 0.0303 0.0861
(0.0438) (0.0947)
Differential return 0.0159 0.3679**
(0.0692) (0.1497)
Panel B: defense
DPr(Bush)*Bush-favored 0.0526 0.0184
(0.0357) (0.0873)
Panel C: energy
DPr(Bush)*Gore-favored �0.1641** �0.0756(0.0594) (0.1196)
DPr(Bush)*Bush-favored 0.0094 0.0734
(0.0470) (0.0945)
Differential return 0.1736** 0.1490
(0.0757) (0.1524)
Panel D: microsoft versus competitors
DPr(Bush)*Gore-favored �0.1480* 0.0427
(0.0782) (0.1761)
DPr(Bush)*Bush-favored �0.0114 0.2192
(0.1564) (0.3523)
Differential return 0.1366 0.1765
(0.1749) (0.3939)
Panel E: tobacco
DPr(Bush)*Bush-favored 0.1310** 0.0731
(0.0576) (0.1465)
Regressions with standard errors in parentheses. **denotes 95% significance, *denotes 90% significance.a OLS regression of the firm-specific abnormal rate of return on the change in the price of a Bush contract on
the Iowa Electronic Market. 41 Bush-favored and 29 Gore-favored firms are those identified in reports of
financial analysts associated with Lehman, Prudential, and ISI. Daily data cover the period May 1, 2000–
November 6, 2000.b OLS regression of the firm-specific abnormal rate of return on the change in the price of a Bush contract on
the Iowa Electronic Market. 41 Bush-favored and 29 Gore-favored firms are those identified in reports of
financial analysts associated with Lehman, Prudential, and ISI. Weekly data (Friday close to Friday close) cover
the period May 1, 2000–November 6, 2000.

B. Knight / Journal of Public Economics 90 (2006) 751–773768
incorporate all relevant information from the campaign, and columns 3 and 4 partially
support this hypothesis. The high volume (at least 229 trades in Bush contracts) sample,
unlike the low volume (less than 229 trades in Bush contracts) sample, supports a
statistically significant estimated value of favorable policies for Gore-favored firms. For
Bush-favored firms, by contrast, the result is statistically insignificant in the high-volume
sample but significant in the low-volume sample.
4.4. Sector analysis
The baseline analysis incorporated the implicit assumption that policy platforms
were equally important to all firms in the sample. This section relaxes that assumption
in a sector-by-sector analysis. As shown in column 1 of Table 6, three out of the five
sectors demonstrate statistically significant results using daily data. Alternative energy
companies, which were favored under Gore’s energy platforms, are worth 16% less
under Bush, while conventional energy companies appear to be politically insensitive.
Microsoft competitors are worth 15% more under a Bush administration; no
relationship is detected for Microsoft itself, perhaps reflecting the sample size of a
single firm. Finally, tobacco firms are worth 13% more under Bush, relative to Gore,
who favored FDA regulation of nicotine as an addictive drug. Column 2 presents
results using weekly data. As shown, only one sector, Gore-favored pharmaceuticals, is
statistically significant, perhaps reflecting the loss in statistical power from the reduced
sample size.
5. Campaign contribution analysis
As a robustness check on the reliance on the opinions of financial analysts in the
baseline analysis, I next provide an alternative analysis using data on campaign
contributions for this group of 70 politically sensitive firms. An additional benefit of
this analysis is that it allows for heterogeneity in the importance of favorable policy
platforms for firm value, which were implicitly assumed to be homogenous in the baseline
analysis. To motivate the empirical specification, this section briefly analyzes a simple
model of campaign contributions as corporate investments along the lines of Snyder
(1990). In this model, firms contribute only in an effort to influence campaign platforms.
Alternative models of campaign contributions, including one in which firms contribute in
order to alter the probability that a given candidate is elected, will be described towards the
end of this section.
Consider then a market for favorable policy platforms, which are offered by
candidates to firms in exchange for campaign contributions. Favorable platforms under
candidate j, which increase the value of firm i by the difference Vij�Vi
0, where Vi0 is
firm value in the absence of favorable policy platforms, are realized only if candidate j
is elected, which occurs with probability q j. Thus, firm i will accept an offer from
candidate j in exchange for a campaign contribution of Cij only if q j[Vi
j�Vi0]zRCi
j,
where Rz1 is the gross return to an alternative investment and, for simplicity, is
assumed homogenous across firms. In order to maximize campaign contributions,

B. Knight / Journal of Public Economics 90 (2006) 751–773 769
candidates set this inequality to binding and we thus have the following firms values
under Bush and Gore administrations:
VBushi ¼ V 0
i þ RCBushi =qBush ð5Þ
VGorei ¼ V 0
i þ RCGorei = 1� qBush
� �ð6Þ
Next, note the following accounting identify for the value of firm i and time t:
Vit ¼ Pr Bushð ÞtVBushi þ 1� Pr Bushð Þ½ Þt�VGore
i ð7Þ
It is important to distinguish here between qBush, which is the probability of a Bush
victory at the time of the agreement between the firm and the candidate and is unobserved
by the econometrician, and Pr(Bush)t, which is the observed price of a Bush contract on
the Iowa Electronic Market. Taking first differences of Eq. (7), substituting in Eqs. (5) and
(6), and dividing both sides by Vit � 1, we have the following regression equation:
rit ¼R
qBushDPr Bushð Þt
CBushi
Vit�1� R
1� qBushDPr Bushð Þt
CGorei
Vit�1ð8Þ
Thus, in the context of this simple model, a regression of firm rates of return on the
change in the probability of a Bush victory, interacted with campaign contributions to
Bush and Gore, which are scaled by the size of the firm, should yield a positive coefficient
on the contributions to Bush interaction term with a magnitude of roughly R /qBush. The
coefficient on the contributions to Gore interaction term, by contrast, should be negative
and of magnitude R / (1�qBush). Intuitively, firms should receive a larger return on their
contributions to the underdog given that more favors have to be provided in exchange for
these contributions. We next describe the construction of the new variable introduced here,
campaign contributions from firms to candidates.
5.1. Data on campaign contributions
During the 2000 campaign, corporations made both hard money contributions to
candidates, through their political action committees (PACs), and soft money contributions
directly from their treasuries to political parties. In the results presented below, I simply
sum together hard and soft money contributions in measuring campaign contributions
from firms to candidates.17 The remainder of this section describes in more detail data on
hard and soft money campaign contributions.
During the 2000 election cycle, corporate PACs were permitted to contribute up to
$10,000 to a given candidate. According to data from the Center For Responsive Politics
(CRP), 17 out of these 70 firms had political action committees that donated to the Bush
campaign during the 2000 election cycle. As shown in Table 7, the average contribution
across all firms was around $1000 with Bush-favored firms contributing slightly more.
17 I have also estimated specifications that allow the coefficient to vary across hard and soft money
contributions. The results were strongest for soft money contributions, an unsurprising result given their large
magnitude, relative to hard money contributions, as shown in Table 7.

Table 7
Average campaign contributions by favored candidatea
Variable Description Bush-favored Gore-favored
Contributions to Bush Firm contributions to RNC plus PAC
contributions to candidate
$163,667 $69,480
Contributions to Gore Firm contributions to DNC $56,659 $56,345
Soft contributions to Bush Firm contributions to RNC $162,549 $68,628
Soft contributions to Gore Firm contributions to DNC $56,659 $56,344
Hard contributions to Bush Firm PAC contributions to candidate $1118 $852
Hard contributions to Gore Firm PAC contributions to candidate $0 $0
a Campaign contribution data taken from the Center for Responsive Politics. Hard money contributions are
those from political action committees (PACs) associated with firms, and soft money contributions are those from
corporate treasuries to the Democratic National Committee (DNC) and Republican National Committee (RNC)
during the 2000 election.
B. Knight / Journal of Public Economics 90 (2006) 751–773770
The Gore campaign, by contrast, did not accept contributions from corporate political
action committees.
While hard money contributions were capped at $10,000 per candidate during the 2000
election cycle, corporations could make unlimited soft money contributions directly to
political parties, and these contributions have played an increasingly important role in
recent Presidential elections. While political parties are restricted by law from sponsoring
bexpress advocacyQ advertisements, those designed to promote specific candidates, they
may sponsor bissue advocacyQ advertisements. In principle, issue advocacy is designed to
promote specific policies but, in practice, such advertisements can promote specific
candidates.18 As shown in Table 7, contributions, as measured by the CRP, from these
firms to the RNC exceeded contributions to the DNC, and this effect is particularly
noticeable among Bush-favored firms. Gore-favored firms, by contrast, gave similar
amounts on average to the RNC and DNC. The primary drawback of using soft money
contributions to political parties is that not all contributions to political parties were used to
promote the two Presidential candidates. To address, at least in part, this data limitation, I
exclude those contributions to parties designed to explicitly fund Congressional
candidates.19
5.2. Results and interpretation
As shown in column 1 of Table 8, contributions to Gore, conditional on contributions to
Bush, are associated with a reduction in market value under a Bush administration in a
statistically and economically significant manner. Conversely, contributions to Bush are
18 Advertisements are considered issue advocacy so long as they do not contain what have become known as
magic words, which include bvote forQ, bvote againstQ, bsupportQ or bdefeatQ.19 More specifically, I include only contributions from corporations to the Democratic National Committee
(DNC) and the Republican National Committee (RNC). I thus exclude soft money contributions to party
committees established to fund campaigns of Congressional candidates, including the National Republican
Congressional Committee (NRCC), National Republican Senatorial Committee (NRSC), Democratic Senatorial
Campaign Committee (DSCC), and the Democratic Congressional Campaign Committee (DCCC).

Table 8
Campaign contribution analysis
(1) (2)
Frequency Dailya Weeklyb
DPr(Bush)*CGore /V t� 1 �2099.03** 975.82
(815.58) (1801.65)
DPr(Bush)*CBush /V t� 1 1934.97* 1778.58
(1110.26) (2447.30)
Obs 9310 1820
R-squared 0.0192 0.1294
Equity fixed effects yes yes
Differential return 4034.00** 802.76
(1759.43) (3880.86)
Regressions with standard errors in parentheses. **denotes 95% significance, *denotes 90% significance.a OLS regression of the firm-specific abnormal rate of return on the change in the price of a Bush contract on
the Iowa Electronic Market. Campaign contribution data reported by the Center for Responsive Politics and are
scaled by the prior day’s market capitalization. Campaign contribution data include hard-money contributions
from PACs affiliated with firms to candidates, and soft money contributions from firms to the Democratic
National Committee (DNC) and the Republican National Committee (RNC). Daily data cover the period May 1,
2000– November 6, 2000.b OLS regression of the firm-specific abnormal rate of return on the change in the price of a Bush contract on
the Iowa Electronic Market. Campaign contribution data reported by the Center for Responsive Politics and are
scaled by the prior day’s market capitalization. Campaign contribution data include hard-money contributions
from PACs affiliated with firms to candidates, and soft money contributions from firms to the Democratic
National Committee (DNC) and the Republican National Committee (RNC). Weekly data (Friday close to Friday
close) cover the period May 1, 2000–November 6, 2000.
B. Knight / Journal of Public Economics 90 (2006) 751–773 771
associated with a significant increase in market value under a Bush administration. The
weekly results, as shown in column 2, are statistically insignificant, perhaps reflecting the
loss in power associated with the reduced sample size.
While these coefficients have signs that are consistent with the theoretical model
outlined above, their magnitude is much larger. Recall that the model predicts a
coefficient on the Bush contributions interaction term, for example, of R /qBush. Given
the close race and low interest rates during this period, which implies Rc1, the two
coefficients should be about two, orders of magnitude lower than the reported
coefficients. There are at least three explanations for this disparity.20 The first
explanation involves firm bargaining power. In the model described above, candidates
make take-it-or-leave-it offers to firms and thus extract all gains from trade. In models with
firm bargaining power, by contrast, firms may secure these favorable platforms with much
smaller campaign contributions and hence the returns to these contributions may be much
higher. The second explanation also involves the theoretical model, which incorporates
only influence motives for campaign contributions. Grossman and Helpman (1996)
consider models in which firms have both influence motives and electoral motives, under
which firms contribute in order alter the probability that a given candidate is elected. If
20 This disparity is related to the puzzle of why firms and others give so little given the large size of government
and the associated potential rewards to firm giving (Ansolabehere et al., 2003).

B. Knight / Journal of Public Economics 90 (2006) 751–773772
firms only have electoral motives, they will contribute to only one candidate, and the
coefficient on campaign contributions interacted with the change in the probability of a
Bush victory will depend upon the mapping between campaign spending and electoral
outcomes and is no longer expected to have a magnitude of two.21 The third explanation is
an empirical one, recognizing that campaign contributions are just one channel through
which firms attempt to influence campaign platforms. If other forms of influence, such as
lobbying, are positively correlated with campaign contributions, the estimated returns to
contributions may be biased upwards.
6. Conclusion
Using evidence from the Bush/Gore 2000 Presidential Election, this paper has
demonstrated that policy platforms are capitalized into equity prices for a sample of 70
politically sensitive firms in the United States. According to the daily platform-based
estimates, favorable public policies account for 3–6% of a firm’s total value. Estimates
using weekly returns are even stronger, suggesting a differential return of 16%. The
most sensitive sectors include tobacco, worth 13% more under Bush, Microsoft
competitors, worth 15% less under Bush, and alternative energy companies, worth
16% less under Bush. An analysis of campaign contributions supports the baseline
results.
These results have several implications for the empirical literatures discussed above.
While several studies have found that political developments during negotiations over
tax legislation have expected effects on equity prices, my findings suggest that policies
may be reflected in equity prices during the electoral process, which occurs long before
the legislative enactment of policies. The second literature discussed above examines the
response of equity prices to broader political events; my study demonstrates that such
event analyses may only measure a lower bound on the value of favorable policies to
firms and thus tend to understate the relationship between economic and political factors.
Regarding the literature on the reflection of news in equity prices, while the electoral
measures do not fully explain the variation in equity returns, my results demonstrate that
news is incorporated into equity prices, and this relationship is economically and
statistically significant.
Acknowledgements
Thanks to Forrest Nelson at the Iowa Electronic Market for providing data used in this
study. Thanks also to Gregory Besharov, Sean Campbell, James Poterba, and Howard
Rosenthal for helpful comments and to participants at the Public Choice Society,
21 In models with electoral motives, firms give to only one candidate. For firms giving to Bush, the con-
tributions are described by the following first-order condition: (BqBush /BC Bushi )(V Bush
i �V Gorei )=R, and we can
write the corresponding regression equation as follows: rit ¼ R
BqBush=BCBushið Þ DPr Bushð Þt
CBushi
Vit�1. Thus, in this alternative
model, the coefficient depends upon the mapping between campaign spending and electoral outcomes.

B. Knight / Journal of Public Economics 90 (2006) 751–773 773
Econometric Society, the Harvard University public economics seminar, the Stanford GSB
political economy seminar, and the NBER Public Economics Meetings.
References
Alesina, Alberto, 1987. Macroeconomic policy in a two-party system as a repeated game. Quarterly Journal of
Economics 102, 651–678.
Alesina, Alberto, 1988. Credibility and political convergence in a two-party system with rational voters.
American Economic Review 78, 796–805.
Alesina, Alberto, Rosenthal, Howard, 1995. Partisan Politics, Divided Government, and the Economy. Cambridge
University Press, Cambridge.
Ansolabehere, Stephen, de Figueiredo, John M., Snyder, James M., 2003. Why is there so little money in U.S.
politics. Journal of Economic Perspectives 17 (1), 105–130.
Berg, Joyce, Forsythe, Robert, Nelson, Forrest, Rietz, Thomas, 2001. Results from a dozen years of election futures
markets research. In: Plott, Charlie, Smith, Vernon (Eds.), Handbook of Experimental Economics Results.
Cutler, David, 1988. Tax reform and the stock market: an asset price approach. American Economic Review 78.
Cutler, David, Poterba, James, Summers, Lawrence, 1988. What moves stock prices. Journal of Portfolio
Management 15.
Elmendorf, Douglas, Hirschfeld, Mary, Weil, David, 1996. The effect of news on bond prices: evidence from the
United Kingdom, 1900–1920. Review of Economics and Statistics 78.
Fisman, Raymond, 2001. Estimating the value of political connections. American Economic Review 91.
Forsythe, Robert, Nelson, Forrest, Neumann, George, Wright, Janck, 1992. Anatomy of an experimental stock
market. American Economic Review 82.
Grossman, Gene, Helpman, Elhana, 1996. Electoral competition and special interest politics. Review of
Economic Studies 63, 265–286.
Herron, Michael, Lavin, James, Cram, Donald, Silver, Jay, 1999. Measurement of political effects in the united
states economy: a study of the 1992 Presidential Election. Economics and Politics 31.
Jayachandran, Seema, 2002. The Jeffords effect. Working Paper, UCLA.
Lang, Mark, Shackleford, Douglas, 2000. Capitalization of capital gains taxes: evidence from stock price
reactions to the 1997 rate reduction. Journal of Public Economics 69.
MacKinlay, A. Craig, 1997. Event studies in economics and finance. Journal of Economic Literature 35.
Manski, Charles, 2004. Interpreting the predictions of prediction markets. NBER Working Paper 10359.
Mattozzi, Andrea, 2003. Policy Uncertainty, Electoral Securities, and Redistribution.
Mattozzi, Andrea, 2005. Can we insure against political uncertainty? Evidence from the U.S. stock market.
Working paper, California Institute of Technology.
Mueller, Dennis, 2003. Public Choice III. Cambridge University Press, Cambridge.
Musto, David, Yilmaz, Bilge, 2003. Trading and voting. Journal of Political Economy 111.
Rhode, Paul, Strumpf, Koleman, 2003. Historical presidential betting markets. Journal of Economic Perspectives
18 (2), 127–142.
Roberts, Brian, 1990. A dead senator tells no lies: seniority and the distribution of federal benefits. American
Journal of Political Science 34.
Sinai, Todd, Gyourko, Joseph, 2004. The asset price incidence of capital gains taxes: Evidence from the taxpayer
relief act of 1997 and publicly-traded real estate firms. Journal of Public Economics 88 (7–8), 1543–1565.
Slemrod, Joel, Greimel, Timothy, 1999. Did Steve Forbes scare the US municipal bond market. Journal of Public
Economics 74, 81–96.
Snyder, James, 1990. Campaign contributions as investments. Journal of Political Economy 98 (6), 1195–1227.
Wolfers, Justin, Zitzewitz, Eric, 2004. Using Markets to Inform Policy: The Case of the Iraq War.
Wolfers, Justin, Zitzewitz, Eric, 2005. Interpreting Prediction Market Prices as Probabilities.