Embed Size (px)
Citation preview

The Economics Of Road The Economics Of Road InvestmentInvestment
John Hine
ETWTR
SE197

Questions and Decisions 1.Questions and Decisions 1.
• Is the project justified ?- Are benefits greater than costs?
• Which is the best investment if we have a set of mutually exclusive alternatives?
• If funds are limited, how should different schemes be ranked?
• When should the road be built?

Questions and Decisions 2.Questions and Decisions 2.
• Are complementary investments required?• Should stage construction be used?• What standards should be applied ?

Appraisal FrameworkAppraisal Framework
• All appraisals need a framework or model for:
a) Forecasting changes b) Evaluating those changes

The Costs of Road InvestmentThe Costs of Road Investment
SE697
These include:• Supervision • Management • Manpower• Machinery• Materials• Land• Environmental Mitigation (e.g. Resettlement)

Primary Effects 1.Primary Effects 1.
• Reduced vehicle operating costsfuel and lubricantsvehicle maintenancedepreciation and interestoverheads
• Reduced journey timedrivers, passengers and goods

Primary Effects 2.Primary Effects 2.
• Changes in road maintenance costs• Changes in accident rates• Increased travel• Environmental effects• Change in value of goods moved

Secondary EffectsSecondary Effects
• Changes in agricultural output• Changes in services• Changes in industrial output• Changes in consumers behaviour• Changes in land values

Coverage and Double CountingCoverage and Double Counting • Any economic analysis should be designed to
give maximum coverage of benefits.
• But we must avoid double counting. Do not add primary and secondary benefits (e.g changes in land values added to changes in transport costs)
• In a competitive economy the consumers’ surplus approach (used in HDM) should be adequate.

The Economic ComparisonThe Economic Comparison• An economic analysis involves a comparison of “With”
and “Without” cases.• Traffic forecasts are made for BOTH scenarios - The
analysis should not be based on “before and after”.• An unrealistic “Without” case can give a false result. • A range of “with investment” cases should be analysed to
find the best solution. A minimum investment approach often gives the best economic results and should be tested.

Economic and Financial PricesEconomic and Financial Prices
SE897
The cost to the economy of road rehabilitation and maintenance may differ from the financial cost because of :
• taxes and duties • shortage of foreign exchange• under-employmentThe Government will usually be concerned with ECONOMIC costs.Contractors will usually be concerned with FINANCIAL costs.

Use of Economic PricesUse of Economic Prices
SE797
In an Economic Appraisal we use ECONOMIC (or SHADOW) prices NOT FINANCIAL prices
Adjust financial prices as follows:• Exclude all taxes and duties and subsidies• Use the planning discount rate not the financial market rate• If overvalued exchange rate then value imports and exports more highly• Use the opportunity cost of labour • Standard Conversion Factors are now widely used for road construction costs

Benefits From Road Investment Benefits From Road Investment Changes in transport costs occur
because of :• Lower road roughness• Shorter trip distance• Faster speeds• Reduced chance of impassability• Reduced traffickability problems• Change in mode

Traffic CategoriesTraffic Categories• Normal traffic: Existing traffic and
growth that would occur on the same road, with and without the investment
• Diverted traffic: Traffic diverted from another road to the project road as a result of the investment
• Generated traffic: New traffic induced by the investment

Benefits from Road InvestmentBenefits from Road InvestmentTransport cost savings for existing (or normal ) traffic= Traffic x Change in Transport Costs per km x distanceMain changes in cost from:
a) change in transport MODEb) reduced journey TIMEc) reduced VOCs
SE297

Generated Traffic BenefitsGenerated Traffic BenefitsTraffic induced by the road investment are traditionally
valued at: Half the difference in transport costs
Hence total generated transport cost benefits = Generated traffic volume x change in costs per km
x distance x 1/2

Estimating BenefitsEstimating BenefitsNormal traffic benefits: tripsN * d1 * (VOC1- VOC2)
Diverted traffic benefits: tripsD * ((d1 * VOC1)-(d2*VOC2))
Generated traffic benefits: tripsG * d2 * (VOC1- VOC2)/2
d1 = existing road length d2 new road length VOC1 = vehicle operating costs per km “without”investmentVOC2 = vehicle operating costs per km “with” investment
VOC data relates to each road section and its condition at the time

The Consumers’ Surplus The Consumers’ Surplus ApproachApproach
TotalBenefits =
Cost
C1
C2
SE497
Additional benefits from newtraffic and production inducedby new investment
T1 T2 Traffic
+
Transport Cost Savings to existing traffic and normal growth

Development BenefitsDevelopment Benefits
SE397
Development benefits arise from a combination of increased traffic and reduced transport costs.
Benefits may also include :• Increased agricultural production• Increased service provision• Increased industrial activity

Ethiopian Statistical AnalysisEthiopian Statistical Analysis
Transport Tariffs (Derived from Regression Analysis)
0102030405060
0 50 100
Distance, km
Tarif
f, B
irr p
er q
t.
main road rough road animal transport

Illustration of BenefitsIllustration of Benefits
C1
C2C3
T1 T2 T3Traffic
Costs
Headloading
Track
Improvedroad

Different Types of BenefitDifferent Types of Benefit
• Normal traffic benefits = traffic x change in transport costs
• Development benefits - A function of (change in transport costs)2
• Social benefits- A function of population x change in
transport costs

Consumer’s Surplus Approach:Consumer’s Surplus Approach:
• Advantages: Simple, cost based, traffic approach dependent on predicting changes in traffic
• Disadvantages: May not address critical factors promoting either rural development or social access

Producers Surplus ApproachProducers Surplus Approach
• Advantages: Draws attention to changes in agricultural output (key economic activity in rural areas)
• Disadvantages: No reliable way of predicting response - impact studies give widely different answers
–it could be based on agricultural supply price elasticities but this is almost never done; it requires very careful examination to use.
– For most projects benefits are just invented !

Producers’ SurplusProducers’ Surplus
Price & Costs per unit Of output
p2 Increased farmgate price
p1
lower input costs
O1 O2
Output

Indicies and RankingIndicies and Ranking• Widely used for feeder road planning; there are many
different approaches e.g. i) cost of improvement / population ii) estimated trips / cost
Adavantages: Speed , simplicity, transparency, many factors can be incorporated
Disadvantages: How do we value widely different factors ? (adding up apples and pears); weightings are not stable ; cannot easily address questions of road standards, timing etc, ; possible double counting

Community PrioritiesCommunity Priorities
• Community priorities now often form an important part of feeder road appraisal. It is possible just to ask communities to rank the investments they prefer- both within the road sector or between roads and other investments.
• Advantages: Community acceptability, use of community knowledge
• Disadvantages: Sectional interest groups may dominate voting, community knowledge of area or road impact may be poor

Economic Decision Criteria 1.1. 1. Net Present Value:Net Present Value:NPV = (BNPV = (B11- C- C11) + (B) + (B22- C- C22) + ….. (B) + ….. (Bnn- C- Cnn)) (1 + r) (1 + r) (1 + r) (1 + r)22 (1 + r ) (1 + r )nn
2. 2. Internal Rate of ReturnInternal Rate of Return : solve for i, (IRR) : solve for i, (IRR) 0 = (B 0 = (B11- C- C11) + (B) + (B22- C- C22) + ….. (B) + ….. (Bnn- C- Cnn)) (1 + i) (1 + i) (1 + i) (1 + i)22 (1 + i ) (1 + i )nn
B B1, 1, BB2 … 2 … BBn : n : Benefits in years 1, 2 … nBenefits in years 1, 2 … n C C1 1 C C2 2 C Cn n : Costs in years 1, 2 …. n: Costs in years 1, 2 …. n r : Planning discount rate , n : planning time horizon r : Planning discount rate , n : planning time horizon
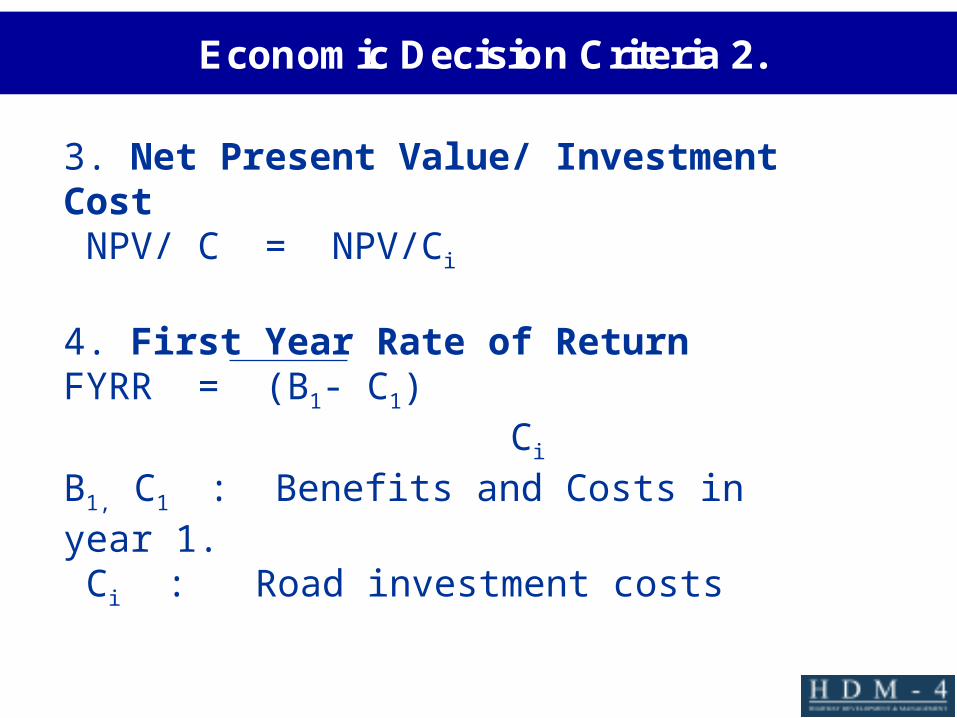
Economic Decision Criteria 2.
3. Net Present Value/ Investment Cost NPV/ C = NPV/Ci
4. First Year Rate of ReturnFYRR = (B1- C1) Ci B1, C1 : Benefits and Costs in year 1. Ci : Road investment costs
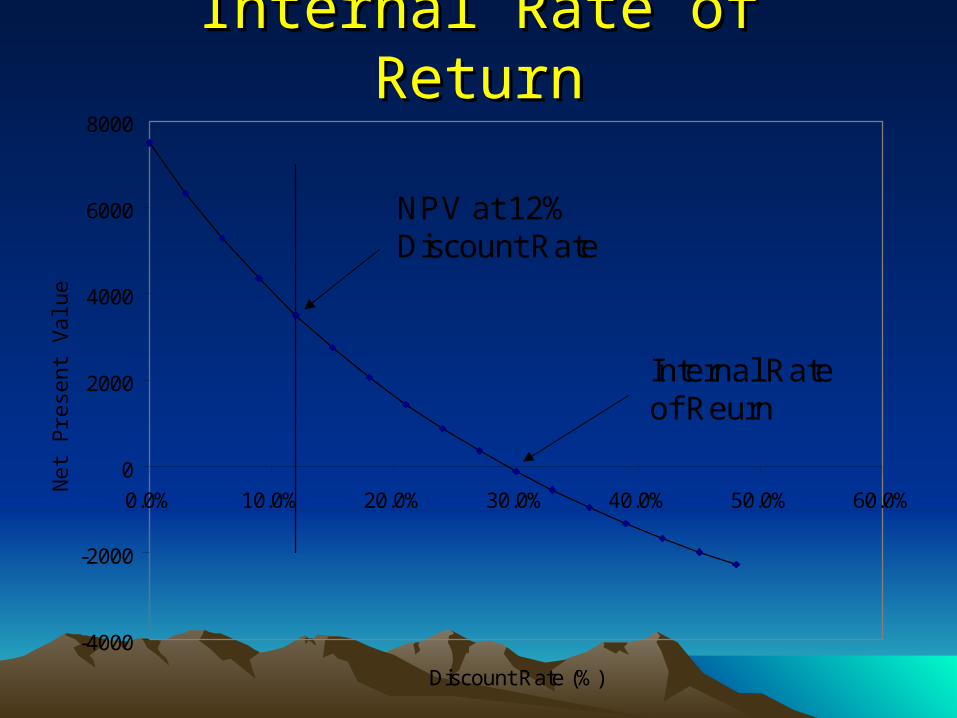
Internal Rate of ReturnInternal Rate of Return
-4000
-2000
0
2000
4000
6000
8000
0.0% 10.0% 20.0% 30.0% 40.0% 50.0% 60.0%
Discount Rate (%)
Net
Pre
sent
Val
ue (M
$)
NPV at 12% Discount Rate
Internal Rate of Reurn

Economic Comparison of AlternativesEconomic Comparison of Alternatives
• When comparing project-alternatives, the Net Present Value (NPV) is used to select the optimal project-alternative (alternative with highest NPV)
• The Internal Rate of Return (IRR) or the B/C ratio are not recommended to compare alternatives of a given project
Alternatives NPV0.03.76.75.5
Optimal Alternative:Highest NPV
Project

Ranking Projects by Economic PriorityRanking Projects by Economic Priority• When comparing the economic priority
of different projects, a recommended economic indicator is the NPV per Investment ratio
Projects
Selected Alternative
Overlay
Reseal
Overlay
NPV/Investment
8.4
5.2
2.1
PRIORITY

Economic Decision CriteriaEconomic Decision CriteriaNPV IRR NPV/C FYRR
Economic validity v. good v. good v. good poor
Mutually exclusive v. good poor good# poorprojects
Project timing fair## poor poor good
Project screening poor v. good good poor /robustness
Use with budget fair ## poor v. good poor constraint# Need incremental analysis## Needs continuous recalculations

Appraisals & Post Evaluations 1.Appraisals & Post Evaluations 1.
• An Appraisal is carried out before an investment is made. Everything is uncertain.
• A Post evaluation may be made say 5 years after the investment. The investment is known and 5yrs of with case are known.
The without case is unknown as is the remainder of the with case.

Appraisals & Post Evaluations 2Appraisals & Post Evaluations 2
• In Both Cases forecasting and evaluation models are required to come to an answer.
• Hence we can never be certain about the viability of an investment !