Embed Size (px)
Citation preview

101
Are Sukuk Securities the Same as Conventional Bonds?
Mohamed Ariff* and Meysam Safari**
Abstract
Sukuk securities have some similar features with conventional bonds, which is probably the reason why the financial press describe them as if they are the same. Mass media names sukuk as Islamic bonds. This paper investigates this matter empirically by first exam-ining if the yield to maturities of sukuk securities and conventional bonds of same quality rating gives same returns to investors. We also conduct a test to see if there is a causal relationship between the two. Results show a significant difference in yield of sukuk against yield of conventional bonds. Moreover, results of Granger causality test do not show causal relation between yields of these two types of securities. Some differences between yield curves of Islamic Securi-ties and conventional bonds of different types of issuers are identi-fied. Finally, the effect of issuance of ijarah sukuk on issuing firm’s beta is studied. The results shows that the absolute change in beta of the firm is significant, which needs careful interpretation so possibly providing a clue to the difference in yield of two securities.
Keywords: Sukuk, Bond, Islamic Finance, Granger Causality.
Introduction
Sukuk and conventional bond securities have some similarities that probably prompted practitioners, mass media journalists,even some aca-demics to consider sukukas being similar to conventional bonds. The only difference pointed out is that regulations consistent with Islamic prin-ciples of financial trading apply to sukuk bonds. However, there exist some
* (Corresponding Author) Bond University, Faculty of Business, Qld 4227, Australia. E-mail: [email protected]** University Putra, Graduate School of Management, Malaysia, 43400 Serdang, Malaysia
E-mail: [email protected]
Afro Eurasian Studies, Vol. 1, Issue 1, Spring 2012, 101-125

102
fundamental differences between these two financial instruments so such a characterization is misleading. These differences lie mainly in the very underlying nature or purpose of funding as well as the way sukuk bonds are structured. However, both sukuk and conventional bond securities are traded in secondary markets with the same trading mechanism, so the dif-ferences could not be coming from the trading differences. Sukuk securi-ties are priced in the market, presumably by experts in the market, as is also the case of conventional bills and bonds.
This study aims to investigate this matter empirically. We do it by analyzing the yields of look-alike securities from both types. Whether se-curities issued by same issuer (i.e. same risk class) for the same period of time (i.e. same duration or maturity) as Islamic and conventional bonds traded in the same market provide similar yields to maturity. If the result is contrary to this expectation, then the conclusion should be that the two are different securities.
Furthermore, since issuance of some types of sukuk securities, espe-cially in large amounts, may affect balance-sheet of the issuer (e.g. case of ijarah sukuk), the risk structure of the issuer might be affected. In other words, by issuing sukuk (particularly asset-backed sukuk such as ijarah), ownership of some certain parts of the assets of the issuing entity is trans-ferred to the intermediating entity (i.e. Special Purpose Vehicle, or SPV) which is owned by the sukuk-holders. Moreover, the profit stream of a sukuk-issuing firm is not dedicated to the equity-holders anymore. Some portion of this profit is distributed among the sukuk-holders. Thus, to cap-ture the impact of issuance of sukuk on risk structure of the firm, a second objective of this chapter is to report our findings on the impact of the is-suance of sukuk on the risk structure of the firm.
The rest of the study is organized as follows. Section 2 is a descrip-tion of the data set to be used and the methodology applied. Since the literature on sukuk securities does not cover this issue at all, we chose not to describe the relevant literature. The findings are presented in Section 3 followed by concluding remarks in Section 4.
Method and Data
Conventional theory suggests that bonds are priced as per the bond valuation theory (Williams, 1938), which suggests the theoretical value of cash flows to bondholders to be the present value of the stream of pay-ments discounted at current cost of borrowing (yield to maturity) as in:

103
Where, P is the market price of a bond, C is the amount of pre-fixed periodic coupon payments; M is the amount of maturity payment (i.e. the face value of a bond certificate); r is the discount rate (i.e. market required yield at the time of pricing), and N is the issue tenure (i.e. number of pay-ments).
Yield-To-Maturity (YTM) is the internal rate of return earned by a bondholder who buys a bond certificate today, at market price, and hold it until the maturity, entitling the bondholder to all coupon payments as well as maturity payment (Ariff, Cheng, and Neoh, 2009; Bodie, Ariff, and Rosa, 2007; Cox, Ingersoll, and Ross, 1985).
In order to investigate the possible existence of a difference between yields to maturity (YTM) of sukuk securities and that of conventional bonds for the same duration and same issuer, a paired-sampled t-test is conducted. This test was performed on various types of issuers Including sovereign (Government of Malaysia, andCentral Bank of Malaysia), qua-si-sovereign (Cagamas Bhd , Khazanah Nasional Bhd ), Financial institu-tions (AAA Rated), and Corporate (Corporate Guaranteed AAA, and Corporate AAA) for various maturities ranging from 3 month to 20 years.
Second objective is to examine the impact of sukuk issuance on the market’s perceived risk of the firm (i.e. beta). In order to capture this effect, beta is calculated as:
Where ri is the return on the equity and rm is the return of the mar-ket. Beta is calculated for pre and post-issuance periods.
In order to test this objective, only ijarahsukuk issues have been in-cluded in the sample. The rational for this filtering is based on the Sha-riah principle that ijarah sukuk contract requires the issuer to transfer the ownership of an asset to the SPV. In other words, by issuing ijarah sukuk, the balance-sheet of the issuer will be affected, so asper standard finance theories, the beta of the firm must change due to capital structure change.
YTM data for first working day of each month for the period of August 2005 to January 2011 were collected from Bond Stream Database.

104
Data on daily prices and market index (Kuala Lumpur Composite Index, KLCI) are obtained from Data Stream. The statistical tests were done us-ing Excel, SPSS and Eviews software: this may introduce some errors aris-ing from lack of corrections for BLUES estimates. This is a preliminary study, so its aim is to provide preliminary results.
Results and DiscussionGraphs
Yield curve is the relation between cost of borrowing and time to maturity of a security for a given issuer or a given class of issuers. Yield curves for Islamic securities and conventional bonds issued by various is-suers are plotted and presented in figures 1-4. These plots are divided into four sub-graphs for four types of issuers, namely: sovereign, quasi-sover-eign, financial corporations, and corporate issuers.
As Figure 1 suggests, yield of Government Islamic Issues (GII) is higher than that of conventional bonds issued by the same issuer (Malay-sian Government Securities, or MGS). The difference between sukuk yield and conventional bond yield tends to be larger for maturities between 2 years and 15 years. The maximum difference between yields of sukuksecu-rities and conventional bonds issued by government occurs for securities with 3 years maturities and the difference is 6.86 basis points. Figure 1 also depicts the yield curve of the BNM issued sukuk securities as well as conventional bills. These securities are only issued with maturities up to
Figure 1. Yield Curve of Government Issued Securities (Islamic vs. Conventional)

105
two years. As the graph shows the yield of former is higher than that of conventional yields, for all maturities. Moreover, difference between these yields increases as the maturity of the pair of securities increases. The max-imum difference between yield of sukuk securities and conventional bills issued by Bank Negara Malaysia is 5.30 basis points for securities with 2 years maturity.
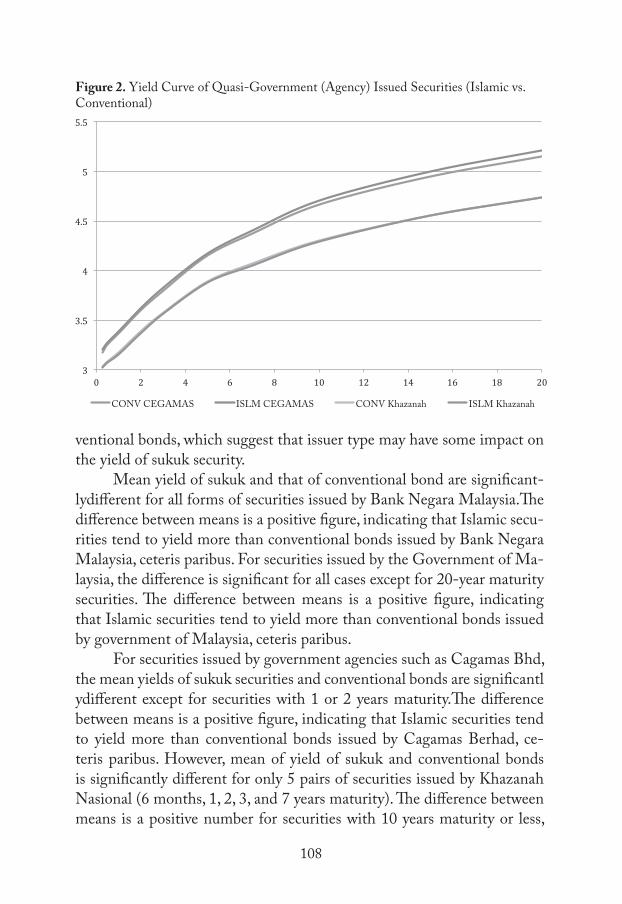
Figure 2 shows the yield curves of securities issued by quasi-gov-ernment (i.e. government agencies) firms namely, Cagamas Berhad and Khazanah Nasional Berhad. Yield of sukuk securities issued by Cagamas Berhad is higher than the yield of Cagamas conventional bonds. This dif-ference increases as the tenure period of the securities grows beyond 5 years. The maximum difference between yields issued by Cagamas occurs for securities with 20 years maturities at 6.44 basis points. In contrast to Cagamas securities, yield of Khazanah Nasional issued securities shows a very small difference. The maximum difference between yields of securities issued by Khazanah Nasional is for securities with 1- or 2-year maturities with -1.52 basis points. The yield is lower for sukuk.
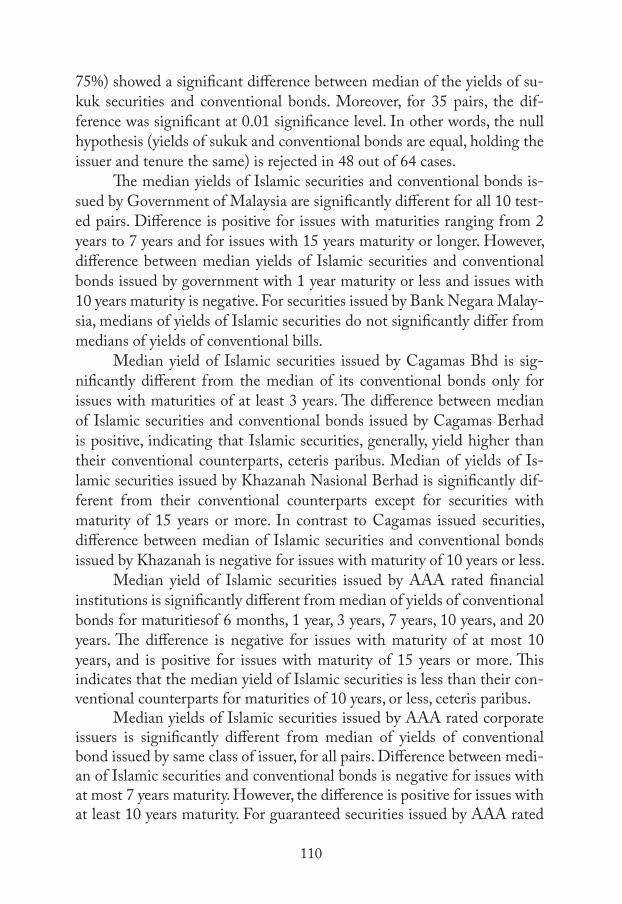
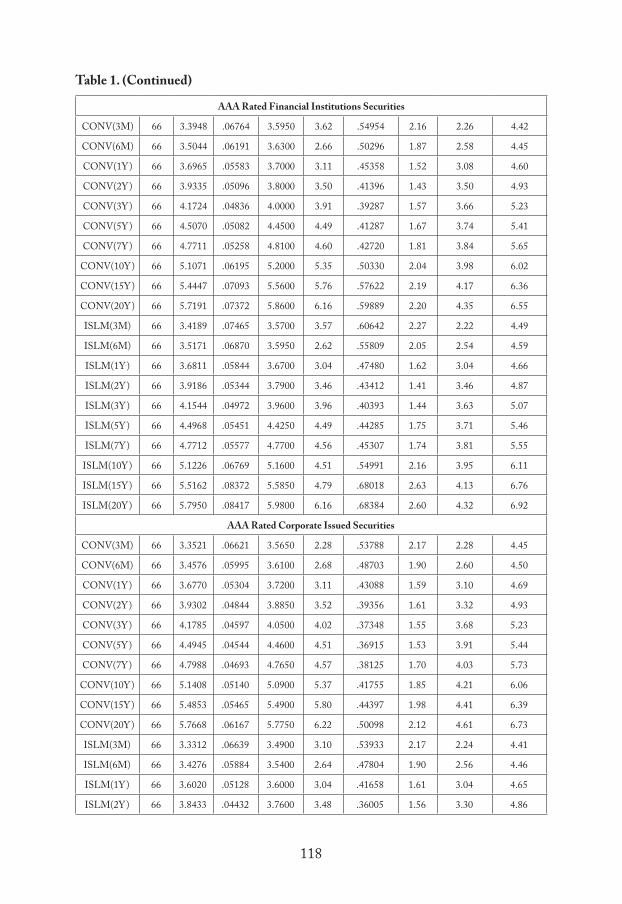
Figure 3 shows the yield curves for securities issued by AAA rat-ed financial institutions. Yield of Islamic securities tend to be very close to yield of conventional bonds for securities with maturities less than 10 years. However, for securities with longer maturity periods, yield of suku-kis higher than that for conventional bonds. The maximum difference be-tween yields of securities issued by financial institutions with AAA rating for 20 years maturities is 7.59 basis points.
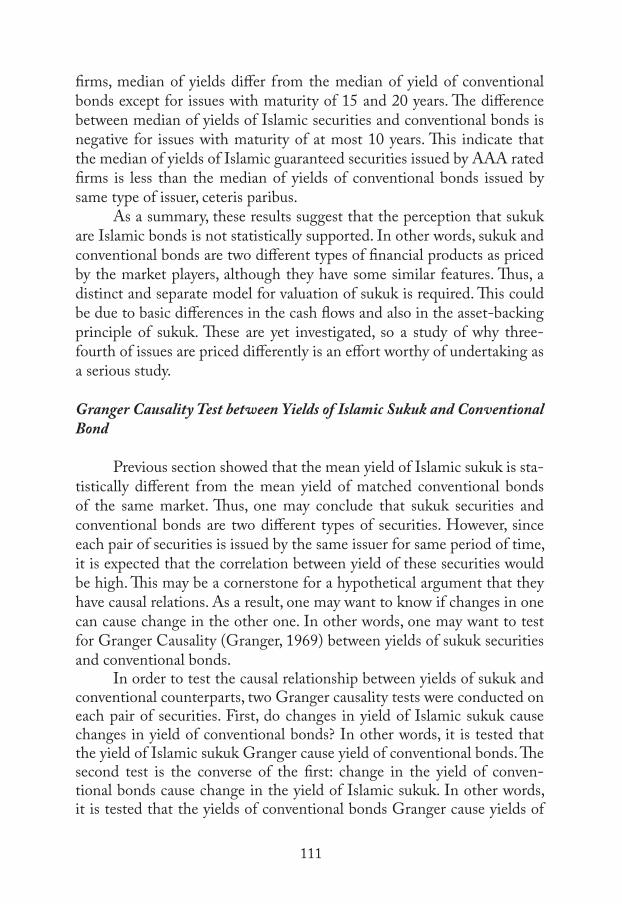
Figure 4 shows the yield curves for securities issued by AAA rated corporate issuers. Yield curve is generated for both guaranteed securities as well as general forms of securities. For corporate issues, yield of sukuk securities shows to be less than the yield of conventional bonds with ma-turities less than 10 years. However, yield of sukuk securities is more than the yield of conventional bonds for maturities more than 10 years. The maximum difference between yields of Islamic securities and conventional bonds issued by corporate issuers with maturities of 2 years -8.69 basis points. However, the maximum amount of this figure for securities with maturities longer than 10 years is +10.56 basis points for securities with 20 years maturity.
For corporate guaranteed issues, yield appears to be less than yield of conventional bonds for maturities less than 15 years. However, yield of sukuk securities is more than yield of conventional bonds for maturities

106
equal to or more than 15 years. The maximum difference between yields of guaranteed sukuk securities and conventional guaranteed bonds of cor-porate issuers with maturities less than 15 years is observed for securities with 2 years maturities with -7.07 basis points. However, the maximum amount of this figure for securities with maturities longer than 10 years is +3.76 basis points for securities with 20 years maturity.
Descriptive Statistics
Summary of descriptive statistics for various sukuk securities and conventional bonds are presented in Table 1. In market level, as the statis-tics suggest, the mean yield of sukuk securities for all types of issuers and for all forms of maturities is 4.0283 percent. However, it varies between a minimum of 2.8326 (sukuk securities issued by BNM with 3 months ma-turity) and a maximum of 5.8724 (sukuk securities issued by AAA rated corporate with 20 years maturity). On the other hand, the mean yield of-conventional bonds for all types of issuers and for all forms of maturities is 4.0235 percent. However, it varies between the minimum of 2.8212 (con-ventional bills issued by BNM with 3 months maturity) and the maximum of 5.7668 (conventional bonds issued by AAA rated corporate with 20 years maturity).
At issuer level, highest mean yields of sukuk securities (for all issue tenures) is for AAA rated financial institutions’ issued Islamic securities with 4.439 per cent, while the lowest mean yield is for sukuk issued by Bank Negara Malaysia (agency) with 2.937 per cent. On the other hand, the highest conventional mean yield is for an AAA rated corporate issuers with 4.428 per cent, while the lowest mean yield is for conventional bills and notes issued by Bank Negara Malaysia with 2.911 per cent yield.
At particular issue level, minimum mean of sukuk yield is 1.82 per cent which is for 3-month maturity issued by either BNM or government of Malaysia. However, the maximum average sukuk yield is 6.92 per cent, which is for 20 years maturity issued by AAA rated financial institutions. On the other hand, minimum average conventional yield is 1.82 per cent which is for the 3-month maturity securities issued by either BNM or government of Malaysia (similar to sukuk issues). However, the maximum average conventional yield is 6.73 per cent, which is for 20 years maturity securities issued by AAA rated corporate issuers.

107
The median yields of Islamic securities of all types of issuers and for all forms of maturities is 4.0692 percent. However, it too varies be-tween minimum of 2.94 (sukuk securities issued by BNM with 3 months maturity) and maximum of 6.05 (sukuk securities issued by AAA rated corporate with 20 years maturity). On the other hand, the median yields of conventional bonds for all types of issuers and for all forms of maturities is 4.0704 percent. However, it varies between the minimum of 2.94 (con-ventional bills issued by BNM with 3 months maturity) and maximum of 5.86 (conventional bonds issued by AAA rated financial institutions with 20 years maturity).
The mean of standard deviation of yields of Islamic securities for all types of issuers and for all forms of maturities is 0.4699. However, it varies between the minimum of 0.3047 (Islamic securities issued by AAA rated corporate guaranteed with 3 years maturity) and the maximum of 0.6838 (Islamic securities issued by AAA rated financial institutions with 20 years maturity). On the other hand, the mean of standard deviation of yields of conventional bonds for all types of issuers and for all forms of maturi-ties is 0.4644. However, it varies between the minimum of 0.3207 (MGS conventional bonds with 5 years maturity) and the maximum of 0.6599 (conventional bills issued by BNM with 3 months maturity).
Comparison of Yield of Islamic Securities and Conventional Bonds
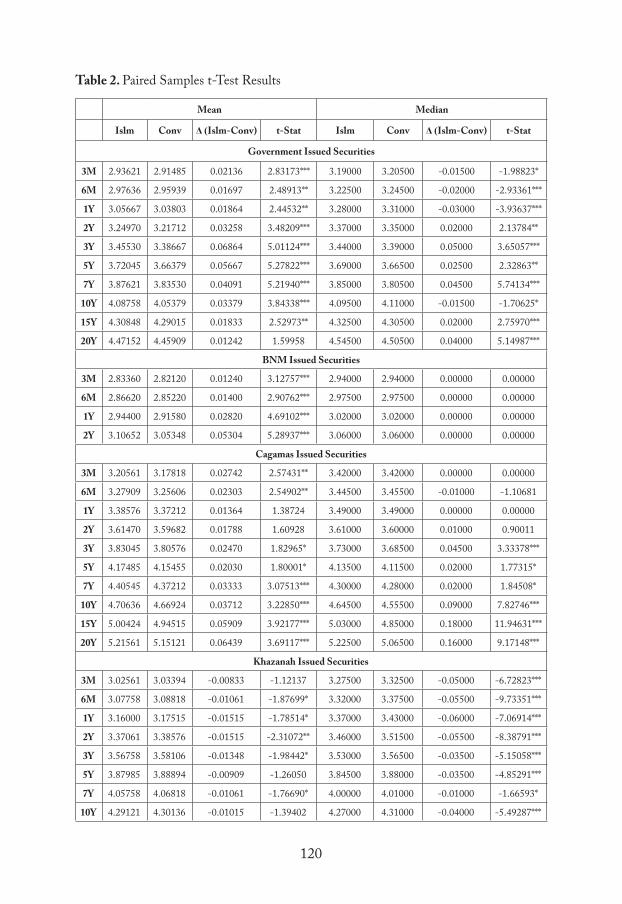
This section is to offer proof, if any, on the two types being the same or different. Results of the paired sample t-test are summarized in Table 2, which is divided into two panels: One for test of means and the other for test of medians as further calculations are conducted based on both. We perform test on medians to overcome the criticism that the test on means is likely to have errors due to the distribution of yields being lepto kurtic.
Mean Yields: Out of the 64 tested pairs of mean yields of sukuk and conventional bonds, 46 cases (i.e. 72 per cent of all pairs) showed significant differences in their yields to maturities. In 32 cases, the null hy-potheses were rejected at 0.01 significance levels. Thus, one can conclude that the yield to maturity of sukuk securities does differ from conventional bond, where the issuer and the issue tenure are the same. Although, from a general perspective, the yields of sukuk differ from the yields of conven-tional bonds, this is not exactly the same for all issuers. This variation in the significance of difference between means of yields of sukuk and con-
108
ventional bonds, which suggest that issuer type may have some impact on the yield of sukuk security.
Mean yield of sukuk and that of conventional bond are significant-lydifferent for all forms of securities issued by Bank Negara Malaysia.The difference between means is a positive figure, indicating that Islamic secu-rities tend to yield more than conventional bonds issued by Bank Negara Malaysia, ceteris paribus. For securities issued by the Government of Ma-laysia, the difference is significant for all cases except for 20-year maturity securities. The difference between means is a positive figure, indicating that Islamic securities tend to yield more than conventional bonds issued by government of Malaysia, ceteris paribus.
For securities issued by government agencies such as Cagamas Bhd, the mean yields of sukuk securities and conventional bonds are significantl ydifferent except for securities with 1 or 2 years maturity.The difference between means is a positive figure, indicating that Islamic securities tend to yield more than conventional bonds issued by Cagamas Berhad, ce-teris paribus. However, mean of yield of sukuk and conventional bonds is significantly different for only 5 pairs of securities issued by Khazanah Nasional (6 months, 1, 2, 3, and 7 years maturity). The difference between means is a positive number for securities with 10 years maturity or less,
Figure 2. Yield Curve of Quasi-Government (Agency) Issued Securities (Islamic vs. Conventional)

109
while, for securities with 15 years maturity or more, the difference is nega-tive. In other words, yield of Islamic Securities issued by Khazanah Nasi-onal is higher than its conventional bonds only for issues with less than 10 years maturity. For the securities with long term maturities (15 or 20 years) the mean yield is less than the conventional bonds, ceteris paribus. This is an exception to the general observation.
The mean yield of Islamic Securities and conventional bonds issued by AAA rated financial institutions are significantly different for 2 pairs (15- or 20-year maturity). The difference in means is a positive number for securities with 6 months maturity or less, or with 7 years or more. However, for securities with maturity between 6 months and 7 years, the difference is negative. In other words the mean yield of Islamic Securities issued by AAA rated financial institutions is higher than that of conven-tional bonds for issues with 6 month or less maturity or with 7 years or more maturity. And for the securities with maturities between 6 months to 5 years, the mean yield of Islamic securities is less than the conventional bonds, ceteris paribus, another exception.
For AAA rated corporation issued securities, the mean of yield of Islamic securities and conventional bonds are significantly different for all cases except for 10-year maturity. The difference between means is a nega-tive number for securities with 7 years maturity or less, while, for securities with 10 years maturity or more, the difference is positive. In other words, the mean yield of Islamic securities issued by AAA rated corporate issuers is lower than its conventional bonds for issues with 7 years or less maturity. And for the securities with long term maturities (10 years and more) the mean of yield of Islamic securities is more than the conventional bonds, ceteris paribus. For AAA rated corporate guaranteed securities, the yield of Islamic securities and conventional bonds are significantly different for all cases except for 15-years maturity securities. The difference between the means is a negative number for securities with 10 years maturity or less, while, for securities with 15 years maturity or more, the difference is positive. In other words yield of Islamic Securities issued by AAA rated guaranteed corporate issuers is lower than its conventional bonds for is-sues with 10 years or less maturity. And for the securities with long term maturities (15 years and more), the mean yield of Islamic Securities is more than the conventional bonds, ceteris paribus.
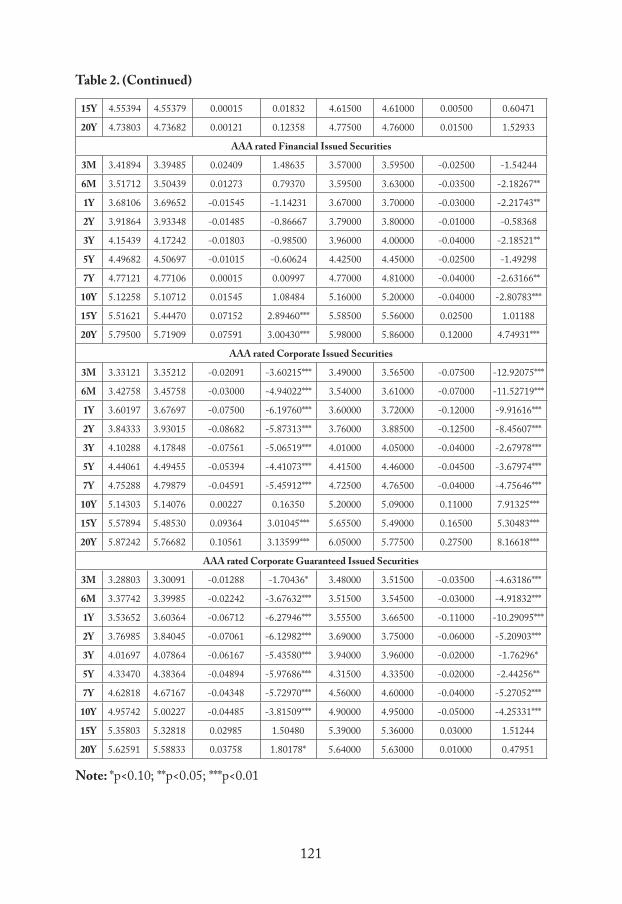
Median Yields: Similar tests were applied on the median yields of sukuk and conventional bonds. Out of 64 pairs of securities, 48 pairs (i.e.
110
75%) showed a significant difference between median of the yields of su-kuk securities and conventional bonds. Moreover, for 35 pairs, the dif-ference was significant at 0.01 significance level. In other words, the null hypothesis (yields of sukuk and conventional bonds are equal, holding the issuer and tenure the same) is rejected in 48 out of 64 cases.
The median yields of Islamic securities and conventional bonds is-sued by Government of Malaysia are significantly different for all 10 test-ed pairs. Difference is positive for issues with maturities ranging from 2 years to 7 years and for issues with 15 years maturity or longer. However, difference between median yields of Islamic securities and conventional bonds issued by government with 1 year maturity or less and issues with 10 years maturity is negative. For securities issued by Bank Negara Malay-sia, medians of yields of Islamic securities do not significantly differ from medians of yields of conventional bills.
Median yield of Islamic securities issued by Cagamas Bhd is sig-nificantly different from the median of its conventional bonds only for issues with maturities of at least 3 years. The difference between median of Islamic securities and conventional bonds issued by Cagamas Berhad is positive, indicating that Islamic securities, generally, yield higher than their conventional counterparts, ceteris paribus. Median of yields of Is-lamic securities issued by Khazanah Nasional Berhad is significantly dif-ferent from their conventional counterparts except for securities with maturity of 15 years or more. In contrast to Cagamas issued securities, difference between median of Islamic securities and conventional bonds issued by Khazanah is negative for issues with maturity of 10 years or less.
Median yield of Islamic securities issued by AAA rated financial institutions is significantly different from median of yields of conventional bonds for maturitiesof 6 months, 1 year, 3 years, 7 years, 10 years, and 20 years. The difference is negative for issues with maturity of at most 10 years, and is positive for issues with maturity of 15 years or more. This indicates that the median yield of Islamic securities is less than their con-ventional counterparts for maturities of 10 years, or less, ceteris paribus.
Median yields of Islamic securities issued by AAA rated corporate issuers is significantly different from median of yields of conventional bond issued by same class of issuer, for all pairs. Difference between medi-an of Islamic securities and conventional bonds is negative for issues with at most 7 years maturity. However, the difference is positive for issues with at least 10 years maturity. For guaranteed securities issued by AAA rated
111
firms, median of yields differ from the median of yield of conventional bonds except for issues with maturity of 15 and 20 years. The difference between median of yields of Islamic securities and conventional bonds is negative for issues with maturity of at most 10 years. This indicate that the median of yields of Islamic guaranteed securities issued by AAA rated firms is less than the median of yields of conventional bonds issued by same type of issuer, ceteris paribus.
As a summary, these results suggest that the perception that sukuk are Islamic bonds is not statistically supported. In other words, sukuk and conventional bonds are two different types of financial products as priced by the market players, although they have some similar features. Thus, a distinct and separate model for valuation of sukuk is required. This could be due to basic differences in the cash flows and also in the asset-backing principle of sukuk. These are yet investigated, so a study of why three-fourth of issues are priced differently is an effort worthy of undertaking as a serious study.
Granger Causality Test between Yields of Islamic Sukuk and Conventional Bond
Previous section showed that the mean yield of Islamic sukuk is sta-tistically different from the mean yield of matched conventional bonds of the same market. Thus, one may conclude that sukuk securities and conventional bonds are two different types of securities. However, since each pair of securities is issued by the same issuer for same period of time, it is expected that the correlation between yield of these securities would be high. This may be a cornerstone for a hypothetical argument that they have causal relations. As a result, one may want to know if changes in one can cause change in the other one. In other words, one may want to test for Granger Causality (Granger, 1969) between yields of sukuk securities and conventional bonds.
In order to test the causal relationship between yields of sukuk and conventional counterparts, two Granger causality tests were conducted on each pair of securities. First, do changes in yield of Islamic sukuk cause changes in yield of conventional bonds? In other words, it is tested that the yield of Islamic sukuk Granger cause yield of conventional bonds. The second test is the converse of the first: change in the yield of conven-tional bonds cause change in the yield of Islamic sukuk. In other words, it is tested that the yields of conventional bonds Granger cause yields of

112
Islamic sukuk. Results of pair-wise Granger causality test on each pair is presented in Table 3.
As the Table 3 suggests, out of 64 pairs of securities tested, in only 10 pairs the null hypothesis was rejected at 0.05 significance level. In oth-er words, yields of Islamic securities Granger cause yield of conventional bonds in only 10 out of 64 pairs (or 15 percent). This indicate that one may not generally conclude that yield of Islamic sukuk securities Granger cause the yield of all conventional bonds counterparts. Results show that yield of Islamic sukuk issued by BNM (6 months, 1 year, and 2 years), Khazanah (2 years), AAA rated financial institutions (3 months, 6 months, 10 years, and 15 years), AAA rated guaranteed corporate (2 years), and AAA rated corporate (2 years) Granger cause their conventional bonds counterpart. Results do not show a concrete pattern in terms of issuer or maturity of the security for having a Granger causal effect. However, 8 out of 10 tests ob-served a Granger causal relations pertaining to securities with maximum 3 years maturities. Moreover, Granger causal relation between Islamic su-kuk and conventional bonds is more common among the securities issued by BNM (3 out of 4 pairs) and financial institutions (4 out of 10 pairs). However, it should be highlighted that these mentioned semi-patterns are not conclusive.
The second test conducted is a check for availability of Granger causal relation between conventional bonds and Islamic sukuk. Out of 64 pairs of securities tested, in only 13 pairs the null hypothesis was rejected
Figure 3. Yield Curve of Financial Corporate (AAA Rated) Issued Securities (Islamic vs. Conventional)

113
at 0.05 significance level (i.e. 20 percent). This indicates that one may not generally conclude that yield of conventional bonds Granger cause the yield of Islamic sukuk security counterparts. Results show that yield of conventional bonds issued by Khazanah (1 and 2 years), AAA rated finan-cial institutions (3 months, 6 months, and 1 year), AAA rated guaranteed corporate (6 months, 1 year, 2 years, and 20 years), and AAA rated corpo-rate (3 months, 6 months, 1 year, and 2 years) Granger cause their Islamic sukuk counterpart. Results do not show a definite pattern in terms of issu-er or maturity of the security for having a Granger causal effect. However, 12 out of 13 observed Granger causal relations pertain to securities with maximum 2 years maturities. Moreover, Granger causal relation between conventional bonds and Islamic sukuk is more common among the securi-ties issued by AAA rated guarantied corporate (4 out of 10 pairs), AAA rated corporate (4 out of 10), and financial institutions (3 out of 10 pairs). However, it should be highlighted that these mentioned semi-patterns are not conclusive.
Finally, as the Table 3 suggests, bi-directional Granger causality (as expressed in Enders, 1995; Hossain, 2005) between yield of Islamic sukuk and conventional bonds is observable in 5 out of 64 pairs (or 7 percent). In other words, in 5 pairs of securities, both null hypotheses are significantly rejected, or, yield of Islamic sukuk Granger cause yield of conventional bonds and the other way around. This may signal that both of these vari-ables are Granger caused by a third variable yet to be explored. Results show that yield of Islamic sukuk and conventional bonds have bi-direc-tional Granger causal relation in securities issued by Khazanah (2 years), AAA rated financial institutions (3 months, and 6 months), AAA rated guaranteed corporate (2 years), and AAA rated corporate (2 years).
Does the Beta Change as Impact of Issuance of Ijarah Sukuk?
In order to investigate the impact of issuance of sukuk security on firm’s risk, 16 companies that issued ijarah sukuk were selected. This se-lection criterion was purposely imposed because issuance of ijarah sukuk requires transferring of (i.e. backing security with) an asset from issuer company’s balance sheet to the Special Purpose Vehicle company. Then, two betas for each of these firms were calculated, one for a period of one year before the issuance, and the other for the period of one year after issu-ance. Then, the null hypothesis was tested on whether the beta before and

114
after issuance of ijarah sukuk are equal. Result of this test is summarized in Table 4.
As Table 5 suggests, the impact of issuance of ijarah sukuk on firm’s risk (the change in beta) might be either positive or negative. This varia-tion in the direction of changes in beta results in a situation that no unidi-rectional conclusion can be made on the effect of issuance of ijarah sukuk on issuing firm’s risk. Therefore, a further study is suggested for identifi-cation and determination of the causes of this variation in direction of changes in beta due to the issuance of ijarah sukuk. Some possible points to investigate are the industry and the size of issuing firm.
In a further attempt, absolute changes in beta were computed. On-lythen, one could conclude that the issuing firm’s beta (after issuance) is significantly different from issuing firm’s beta (before issuance). We find a t-statistic of 4.16, which is significant at 0.1 significance level with 15 degrees of freedom. In other words, if one does not concern about the di-rection of change in beta, one may conclude that issuance of ijarah sukuk will changes the firm’s beta, either in a positive or negative way.
Figure 4. Yield Curve of Corporate (AAA Rated) Issued Securities (Islamic vs. Conven-tional)

115
Conclusion
Some practitioners as well as some scholars assume that theories and models that have been developed for conventional bonds could be used to value sukuk securities with no modification to accommodate the significant design differences. If so, this paper observes and documents an anomalous behavior to this belief in the market place because we observe significant differences between yields to maturities of sukuk securities and conventional bonds, controlling for the issuer, risk, market practices and issue tenure.The magnitude and the sign of this difference are fairly apart for various issuers or maturities.
Results of pair-wise Granger causality tests do not show a general and definite relation between yield of Islamic sukuk securities and conven-tional bonds. In other words, changes in yield of Islamic sukuk or conven-tional bonds do not generally cause a change in the other. It implies that not only yields of Islamic sukuk differ from yields of conventional bonds, but also these yields do not have causal (in terms of Granger causality) ef-fect on with each other. Yield changes in conventional bonds of different classes affect each other, not so with sukuk.
Another finding of this research is the significant effect of the is-suance of ijarah sukuk on the risk behavior of the issuing company. It is documented that the risk,in terms of absolute changes in CAPM beta, before and after issuance of the security is significantly different from zero. However, the direction of changes in beta is not the same for all cases, and, the influential factors on the direction of change are yet to be studied. Our main conclusions are: sukuk securities should not be priced the same way as conventional bonds; the market for equity of issuing companies appear to suggest that the risk of the firm changes significantly because of the issue of ijara sukuk certificates. Testing and documenting the reasons for differences in the behavior of what is assumed to be similar securities is a challenge to be addressed in future research.

116
N Valid Mean
Std. Error of
MeanMedian Mode Std.
Deviation Range Minimum Maximum
Government Issued securities (MGS vs. GII)
CONV(3M) 66 2.9148 0.07591 3.205 1.88 0.61669 1.84 1.82 3.66
CONV(6M) 66 2.9594 0.07704 3.245 1.92 0.62585 1.98 1.85 3.83
CONV(1Y) 66 3.038 0.07653 3.31 2.86 0.62175 2.06 1.92 3.98
CONV(2Y) 66 3.2171 0.06423 3.35 3.04a 0.52178 2.1 2.2 4.3
CONV(3Y) 66 3.3867 0.05233 3.39 3.2 0.42513 2.13 2.37 4.5
CONV(5Y) 66 3.6638 0.03948 3.665 3.45a 0.32077 1.8 2.78 4.58
CONV(7Y) 66 3.8353 0.04061 3.805 3.91 0.32991 1.84 2.91 4.75
CONV(10Y) 66 4.0538 0.0482 4.11 4.19 0.39156 1.93 3.09 5.02
CONV(15Y) 66 4.2902 0.0511 4.305 3.91a 0.41517 1.77 3.35 5.12
CONV(20Y) 66 4.4591 0.04963 4.505 4.15 0.40323 1.58 3.6 5.18
ISLM(3M) 66 2.9362 0.07863 3.19 1.88 0.63876 1.96 1.82 3.78
ISLM(6M) 66 2.9764 0.07938 3.225 1.92 0.64492 2.04 1.85 3.89
ISLM(1Y) 66 3.0567 0.07723 3.28 2.86 0.62738 2.11 1.97 4.08
ISLM(2Y) 66 3.2497 0.06286 3.37 3.04 0.51068 2 2.3 4.3
ISLM(3Y) 66 3.4553 0.0475 3.44 3.24 0.38591 1.84 2.63 4.47
ISLM(5Y) 66 3.7205 0.03967 3.69 3.69 0.32231 1.8 2.85 4.65
ISLM(7Y) 66 3.8762 0.04069 3.85 3.64a 0.33055 1.79 3 4.79
ISLM(10Y) 66 4.0876 0.04535 4.095 3.77a 0.36846 1.81 3.17 4.98
ISLM(15Y) 66 4.3085 0.04925 4.325 4.51 0.4001 1.67 3.45 5.12
ISLM(20Y) 66 4.4715 0.04884 4.545 4.30a 0.39678 1.5 3.68 5.18
BNM Issued Securities
CONV(3M) 50 2.8212 .09333 2.9400 1.88 .65998 1.90 1.82 3.72
CONV(6M) 50 2.8522 .09285 2.9750 1.92 .65656 1.91 1.85 3.76
CONV(1Y) 50 2.9158 .08947 3.0200 2.86 .63268 1.90 1.92 3.82
CONV(2Y) 46 3.0535 .07334 3.0600 3.04 .49740 1.77 2.20 3.97
ISLM(3M) 50 2.8336 .09516 2.9400 1.88 .67289 1.92 1.82 3.74
ISLM(6M) 50 2.8662 .09493 2.9750 1.92 .67123 1.95 1.85 3.80
ISLM(1Y) 50 2.9440 .09027 3.0200 2.86 .63831 1.93 1.97 3.90
ISLM(2Y) 46 3.1065 .07364 3.0600 3.04 .49947 1.77 2.30 4.07
Cagamas Berhad Securities
CONV(3M) 66 3.1782 .06516 3.4200 3.53 .52934 1.93 2.21 4.14
CONV(6M) 66 3.2561 .06299 3.4550 3.56 .51177 1.87 2.34 4.21
CONV(1Y) 66 3.3721 .06090 3.4900 3.64 .49477 1.83 2.50 4.33
Table 1. Descriptive Statistics of Sukuk vs. Conventional Bonds

117
Table 1. (Continued)
CONV(2Y) 66 3.5968 .05154 3.6000 3.36 .41872 1.65 2.95 4.60
CONV(3Y) 66 3.8058 .04461 3.6850 3.53 .36245 1.59 3.23 4.82
CONV(5Y) 66 4.1545 .04424 4.1150 3.92 .35938 1.40 3.51 4.91
CONV(7Y) 66 4.3721 .04724 4.2800 4.11 .38377 1.46 3.72 5.18
CONV(10Y) 66 4.6692 .05659 4.5550 4.32 .45977 1.87 3.80 5.67
CONV(15Y) 66 4.9452 .06021 4.8500 4.80 .48914 2.16 3.89 6.05
CONV(20Y) 66 5.1512 .06688 5.0650 5.08 .54334 2.39 4.02 6.41
ISLM(3M) 66 3.2056 .06795 3.4200 3.53 .55207 1.93 2.21 4.14
ISLM(6M) 66 3.2791 .06523 3.4450 3.56 .52994 1.87 2.34 4.21
ISLM(1Y) 66 3.3858 .06289 3.4900 3.73 .51092 1.83 2.50 4.33
ISLM(2Y) 66 3.6147 .05099 3.6100 3.33 .41424 1.57 2.95 4.52
ISLM(3Y) 66 3.8305 .04288 3.7300 3.53 .34834 1.45 3.23 4.68
ISLM(5Y) 66 4.1748 .04314 4.1350 4.32 .35048 1.38 3.53 4.91
ISLM(7Y) 66 4.4055 .04683 4.3000 3.95 .38048 1.45 3.73 5.18
ISLM(10Y) 66 4.7064 .05591 4.6450 4.28 .45422 1.85 3.82 5.67
ISLM(15Y) 66 5.0042 .05959 5.0300 5.33 .48413 2.11 3.94 6.05
ISLM(20Y) 66 5.2156 .06552 5.2250 5.08 .53226 2.37 4.04 6.41
Khazanah Nasional Berhad Securities
CONV(3M) 66 3.0339 .07272 3.3250 2.09 .59081 1.86 1.94 3.80
CONV(6M) 66 3.0882 .07396 3.3750 3.46 .60085 1.96 1.97 3.93
CONV(1Y) 66 3.1752 .07454 3.4300 2.20 .60553 2.02 2.06 4.08
CONV(2Y) 66 3.3858 .06322 3.5150 3.09 .51362 2.14 2.42 4.56
CONV(3Y) 66 3.5811 .05107 3.5650 3.69 .41487 2.07 2.72 4.79
CONV(5Y) 66 3.8889 .04038 3.8800 3.80 .32802 1.81 3.05 4.86
CONV(7Y) 66 4.0682 .04040 4.0100 3.91 .32818 1.81 3.19 5.00
CONV(10Y) 66 4.3014 .04605 4.3100 4.02 .37408 1.81 3.40 5.21
CONV(15Y) 66 4.5538 .04944 4.6100 4.69 .40167 1.61 3.70 5.31
CONV(20Y) 66 4.7368 .04915 4.7600 4.77 .39929 1.70 3.81 5.51
ISLM(3M) 66 3.0256 .07341 3.2750 2.09 .59636 1.86 1.94 3.80
ISLM(6M) 66 3.0776 .07379 3.3200 3.37 .59950 1.92 1.97 3.89
ISLM(1Y) 66 3.1600 .07480 3.3700 2.20 .60772 2.11 2.06 4.17
ISLM(2Y) 66 3.3706 .06196 3.4600 3.09 .50336 2.03 2.42 4.45
ISLM(3Y) 66 3.5676 .05012 3.5300 3.69 .40717 1.94 2.72 4.66
ISLM(5Y) 66 3.8798 .03966 3.8450 3.80 .32220 1.80 3.05 4.85
ISLM(7Y) 66 4.0576 .03978 4.0000 3.85 .32318 1.78 3.19 4.97
ISLM(10Y) 66 4.2912 .04489 4.2700 4.02 .36470 1.74 3.40 5.14
ISLM(15Y) 66 4.5539 .04881 4.6150 4.82 .39657 1.61 3.70 5.31
ISLM(20Y) 66 4.7380 .04976 4.7750 5.00 .40422 1.68 3.83 5.51
118
AAA Rated Financial Institutions Securities
CONV(3M) 66 3.3948 .06764 3.5950 3.62 .54954 2.16 2.26 4.42
CONV(6M) 66 3.5044 .06191 3.6300 2.66 .50296 1.87 2.58 4.45
CONV(1Y) 66 3.6965 .05583 3.7000 3.11 .45358 1.52 3.08 4.60
CONV(2Y) 66 3.9335 .05096 3.8000 3.50 .41396 1.43 3.50 4.93
CONV(3Y) 66 4.1724 .04836 4.0000 3.91 .39287 1.57 3.66 5.23
CONV(5Y) 66 4.5070 .05082 4.4500 4.49 .41287 1.67 3.74 5.41
CONV(7Y) 66 4.7711 .05258 4.8100 4.60 .42720 1.81 3.84 5.65
CONV(10Y) 66 5.1071 .06195 5.2000 5.35 .50330 2.04 3.98 6.02
CONV(15Y) 66 5.4447 .07093 5.5600 5.76 .57622 2.19 4.17 6.36
CONV(20Y) 66 5.7191 .07372 5.8600 6.16 .59889 2.20 4.35 6.55
ISLM(3M) 66 3.4189 .07465 3.5700 3.57 .60642 2.27 2.22 4.49
ISLM(6M) 66 3.5171 .06870 3.5950 2.62 .55809 2.05 2.54 4.59
ISLM(1Y) 66 3.6811 .05844 3.6700 3.04 .47480 1.62 3.04 4.66
ISLM(2Y) 66 3.9186 .05344 3.7900 3.46 .43412 1.41 3.46 4.87
ISLM(3Y) 66 4.1544 .04972 3.9600 3.96 .40393 1.44 3.63 5.07
ISLM(5Y) 66 4.4968 .05451 4.4250 4.49 .44285 1.75 3.71 5.46
ISLM(7Y) 66 4.7712 .05577 4.7700 4.56 .45307 1.74 3.81 5.55
ISLM(10Y) 66 5.1226 .06769 5.1600 4.51 .54991 2.16 3.95 6.11
ISLM(15Y) 66 5.5162 .08372 5.5850 4.79 .68018 2.63 4.13 6.76
ISLM(20Y) 66 5.7950 .08417 5.9800 6.16 .68384 2.60 4.32 6.92
AAA Rated Corporate Issued Securities
CONV(3M) 66 3.3521 .06621 3.5650 2.28 .53788 2.17 2.28 4.45
CONV(6M) 66 3.4576 .05995 3.6100 2.68 .48703 1.90 2.60 4.50
CONV(1Y) 66 3.6770 .05304 3.7200 3.11 .43088 1.59 3.10 4.69
CONV(2Y) 66 3.9302 .04844 3.8850 3.52 .39356 1.61 3.32 4.93
CONV(3Y) 66 4.1785 .04597 4.0500 4.02 .37348 1.55 3.68 5.23
CONV(5Y) 66 4.4945 .04544 4.4600 4.51 .36915 1.53 3.91 5.44
CONV(7Y) 66 4.7988 .04693 4.7650 4.57 .38125 1.70 4.03 5.73
CONV(10Y) 66 5.1408 .05140 5.0900 5.37 .41755 1.85 4.21 6.06
CONV(15Y) 66 5.4853 .05465 5.4900 5.80 .44397 1.98 4.41 6.39
CONV(20Y) 66 5.7668 .06167 5.7750 6.22 .50098 2.12 4.61 6.73
ISLM(3M) 66 3.3312 .06639 3.4900 3.10 .53933 2.17 2.24 4.41
ISLM(6M) 66 3.4276 .05884 3.5400 2.64 .47804 1.90 2.56 4.46
ISLM(1Y) 66 3.6020 .05128 3.6000 3.04 .41658 1.61 3.04 4.65
ISLM(2Y) 66 3.8433 .04432 3.7600 3.48 .36005 1.56 3.30 4.86
Table 1. (Continued)

119
ISLM(3Y) 66 4.1029 .03988 4.0100 3.98 .32403 1.48 3.64 5.12
ISLM(5Y) 66 4.4406 .04026 4.4150 4.38 .32706 1.52 3.88 5.40
ISLM(7Y) 66 4.7529 .04447 4.7250 4.38 .36124 1.69 4.00 5.69
ISLM(10Y) 66 5.1430 .05039 5.2000 4.58 .40939 1.84 4.18 6.02
ISLM(15Y) 66 5.5789 .06429 5.6550 5.80 .52231 2.15 4.38 6.53
ISLM(20Y) 66 5.8724 .06490 6.0500 6.15 .52724 2.11 4.58 6.69
AAA Rated Corporate Guaranteed Issued Securities
CONV(3M) 66 3.3009 .06349 3.5150 3.60 .51577 2.16 2.26 4.42
CONV(6M) 66 3.3998 .05677 3.5450 3.63 .46120 1.87 2.58 4.45
CONV(1Y) 66 3.6036 .04904 3.6650 3.09 .39840 1.52 3.08 4.60
CONV(2Y) 66 3.8405 .04423 3.7500 3.50 .35936 1.54 3.27 4.81
CONV(3Y) 66 4.0786 .04245 3.9600 3.91 .34490 1.48 3.62 5.10
CONV(5Y) 66 4.3836 .04366 4.3350 4.49 .35467 1.57 3.74 5.31
CONV(7Y) 66 4.6717 .04833 4.6000 4.53 .39262 1.75 3.84 5.59
CONV(10Y) 66 5.0023 .05539 4.9500 4.94 .44998 1.91 3.98 5.89
CONV(15Y) 66 5.3282 .06051 5.3600 5.76 .49161 2.05 4.17 6.22
CONV(20Y) 66 5.5883 .06843 5.6300 6.16 .55596 2.20 4.35 6.55
ISLM(3M) 66 3.2880 .06455 3.4800 3.08 .52440 2.16 2.22 4.38
ISLM(6M) 66 3.3774 .05662 3.5150 2.62 .45994 1.87 2.54 4.41
ISLM(1Y) 66 3.5365 .04779 3.5550 3.02 .38824 1.54 3.02 4.56
ISLM(2Y) 66 3.7698 .04084 3.6900 3.46 .33176 1.47 3.28 4.75
ISLM(3Y) 66 4.0170 .03751 3.9400 3.96 .30477 1.41 3.58 4.99
ISLM(5Y) 66 4.3347 .04162 4.3150 4.14 .33815 1.56 3.71 5.27
ISLM(7Y) 66 4.6282 .04884 4.5600 4.40 .39679 1.74 3.81 5.55
ISLM(10Y) 66 4.9574 .05783 4.9000 4.51 .46983 1.98 3.95 5.93
ISLM(15Y) 66 5.3580 .06599 5.3900 4.79 .53607 2.39 4.13 6.52
ISLM(20Y) 66 5.6259 .07147 5.6400 6.16 .58063 2.34 4.32 6.66
a. Multiple modes exist. The smallest value is shown.
Table 1. (Continued)
120
Mean Median
Islm Conv Δ (Islm-Conv) t-Stat Islm Conv Δ (Islm-Conv) t-Stat
Government Issued Securities
3M 2.93621 2.91485 0.02136 2.83173*** 3.19000 3.20500 -0.01500 -1.98823*
6M 2.97636 2.95939 0.01697 2.48913** 3.22500 3.24500 -0.02000 -2.93361***
1Y 3.05667 3.03803 0.01864 2.44532** 3.28000 3.31000 -0.03000 -3.93637***
2Y 3.24970 3.21712 0.03258 3.48209*** 3.37000 3.35000 0.02000 2.13784**
3Y 3.45530 3.38667 0.06864 5.01124*** 3.44000 3.39000 0.05000 3.65057***
5Y 3.72045 3.66379 0.05667 5.27822*** 3.69000 3.66500 0.02500 2.32863**
7Y 3.87621 3.83530 0.04091 5.21940*** 3.85000 3.80500 0.04500 5.74134***
10Y 4.08758 4.05379 0.03379 3.84338*** 4.09500 4.11000 -0.01500 -1.70625*
15Y 4.30848 4.29015 0.01833 2.52973** 4.32500 4.30500 0.02000 2.75970***
20Y 4.47152 4.45909 0.01242 1.59958 4.54500 4.50500 0.04000 5.14987***
BNM Issued Securities
3M 2.83360 2.82120 0.01240 3.12757*** 2.94000 2.94000 0.00000 0.00000
6M 2.86620 2.85220 0.01400 2.90762*** 2.97500 2.97500 0.00000 0.00000
1Y 2.94400 2.91580 0.02820 4.69102*** 3.02000 3.02000 0.00000 0.00000
2Y 3.10652 3.05348 0.05304 5.28937*** 3.06000 3.06000 0.00000 0.00000
Cagamas Issued Securities
3M 3.20561 3.17818 0.02742 2.57431** 3.42000 3.42000 0.00000 0.00000
6M 3.27909 3.25606 0.02303 2.54902** 3.44500 3.45500 -0.01000 -1.10681
1Y 3.38576 3.37212 0.01364 1.38724 3.49000 3.49000 0.00000 0.00000
2Y 3.61470 3.59682 0.01788 1.60928 3.61000 3.60000 0.01000 0.90011
3Y 3.83045 3.80576 0.02470 1.82965* 3.73000 3.68500 0.04500 3.33378***
5Y 4.17485 4.15455 0.02030 1.80001* 4.13500 4.11500 0.02000 1.77315*
7Y 4.40545 4.37212 0.03333 3.07513*** 4.30000 4.28000 0.02000 1.84508*
10Y 4.70636 4.66924 0.03712 3.22850*** 4.64500 4.55500 0.09000 7.82746***
15Y 5.00424 4.94515 0.05909 3.92177*** 5.03000 4.85000 0.18000 11.94631***
20Y 5.21561 5.15121 0.06439 3.69117*** 5.22500 5.06500 0.16000 9.17148***
Khazanah Issued Securities
3M 3.02561 3.03394 -0.00833 -1.12137 3.27500 3.32500 -0.05000 -6.72823***
6M 3.07758 3.08818 -0.01061 -1.87699* 3.32000 3.37500 -0.05500 -9.73351***
1Y 3.16000 3.17515 -0.01515 -1.78514* 3.37000 3.43000 -0.06000 -7.06914***
2Y 3.37061 3.38576 -0.01515 -2.31072** 3.46000 3.51500 -0.05500 -8.38791***
3Y 3.56758 3.58106 -0.01348 -1.98442* 3.53000 3.56500 -0.03500 -5.15058***
5Y 3.87985 3.88894 -0.00909 -1.26050 3.84500 3.88000 -0.03500 -4.85291***
7Y 4.05758 4.06818 -0.01061 -1.76690* 4.00000 4.01000 -0.01000 -1.66593*
10Y 4.29121 4.30136 -0.01015 -1.39402 4.27000 4.31000 -0.04000 -5.49287***
Table 2. Paired Samples t-Test Results
121
15Y 4.55394 4.55379 0.00015 0.01832 4.61500 4.61000 0.00500 0.60471
20Y 4.73803 4.73682 0.00121 0.12358 4.77500 4.76000 0.01500 1.52933
AAA rated Financial Issued Securities
3M 3.41894 3.39485 0.02409 1.48635 3.57000 3.59500 -0.02500 -1.54244
6M 3.51712 3.50439 0.01273 0.79370 3.59500 3.63000 -0.03500 -2.18267**
1Y 3.68106 3.69652 -0.01545 -1.14231 3.67000 3.70000 -0.03000 -2.21743**
2Y 3.91864 3.93348 -0.01485 -0.86667 3.79000 3.80000 -0.01000 -0.58368
3Y 4.15439 4.17242 -0.01803 -0.98500 3.96000 4.00000 -0.04000 -2.18521**
5Y 4.49682 4.50697 -0.01015 -0.60624 4.42500 4.45000 -0.02500 -1.49298
7Y 4.77121 4.77106 0.00015 0.00997 4.77000 4.81000 -0.04000 -2.63166**
10Y 5.12258 5.10712 0.01545 1.08484 5.16000 5.20000 -0.04000 -2.80783***
15Y 5.51621 5.44470 0.07152 2.89460*** 5.58500 5.56000 0.02500 1.01188
20Y 5.79500 5.71909 0.07591 3.00430*** 5.98000 5.86000 0.12000 4.74931***
AAA rated Corporate Issued Securities
3M 3.33121 3.35212 -0.02091 -3.60215*** 3.49000 3.56500 -0.07500 -12.92075***
6M 3.42758 3.45758 -0.03000 -4.94022*** 3.54000 3.61000 -0.07000 -11.52719***
1Y 3.60197 3.67697 -0.07500 -6.19760*** 3.60000 3.72000 -0.12000 -9.91616***
2Y 3.84333 3.93015 -0.08682 -5.87313*** 3.76000 3.88500 -0.12500 -8.45607***
3Y 4.10288 4.17848 -0.07561 -5.06519*** 4.01000 4.05000 -0.04000 -2.67978***
5Y 4.44061 4.49455 -0.05394 -4.41073*** 4.41500 4.46000 -0.04500 -3.67974***
7Y 4.75288 4.79879 -0.04591 -5.45912*** 4.72500 4.76500 -0.04000 -4.75646***
10Y 5.14303 5.14076 0.00227 0.16350 5.20000 5.09000 0.11000 7.91325***
15Y 5.57894 5.48530 0.09364 3.01045*** 5.65500 5.49000 0.16500 5.30483***
20Y 5.87242 5.76682 0.10561 3.13599*** 6.05000 5.77500 0.27500 8.16618***
AAA rated Corporate Guaranteed Issued Securities
3M 3.28803 3.30091 -0.01288 -1.70436* 3.48000 3.51500 -0.03500 -4.63186***
6M 3.37742 3.39985 -0.02242 -3.67632*** 3.51500 3.54500 -0.03000 -4.91832***
1Y 3.53652 3.60364 -0.06712 -6.27946*** 3.55500 3.66500 -0.11000 -10.29095***
2Y 3.76985 3.84045 -0.07061 -6.12982*** 3.69000 3.75000 -0.06000 -5.20903***
3Y 4.01697 4.07864 -0.06167 -5.43580*** 3.94000 3.96000 -0.02000 -1.76296*
5Y 4.33470 4.38364 -0.04894 -5.97686*** 4.31500 4.33500 -0.02000 -2.44256**
7Y 4.62818 4.67167 -0.04348 -5.72970*** 4.56000 4.60000 -0.04000 -5.27052***
10Y 4.95742 5.00227 -0.04485 -3.81509*** 4.90000 4.95000 -0.05000 -4.25331***
15Y 5.35803 5.32818 0.02985 1.50480 5.39000 5.36000 0.03000 1.51244
20Y 5.62591 5.58833 0.03758 1.80178* 5.64000 5.63000 0.01000 0.47951
Note: *p<0.10; **p<0.05; ***p<0.01
Table 2. (Continued)

122
Null Hypothesis:Islamic security does not
Granger Cause conventional bond
Conventional bond does not Granger Cause Islamic security
Issuer Maturity F-Statistic Prob F-Statistic Prob
Government of Malaysia 3M 0.34519 0.7095 0.79763 0.4552
Government of Malaysia 6M 1.14021 0.3267 0.92106 0.4037
Government of Malaysia 1Y 2.01711 0.1421 1.62934 0.2048
Government of Malaysia 2Y 2.4677 0.0935* 1.74653 0.1833
Government of Malaysia 3Y 2.03257 0.1401 3.0036 0.0572*
Government of Malaysia 5Y 2.33696 0.1055 0.18222 0.8339
Government of Malaysia 7Y 1.4874 0.2343 0.42059 0.6586
Government of Malaysia 10Y 0.49017 0.615 0.00342 0.9966
Government of Malaysia 15Y 0.59211 0.5564 0.63444 0.5338
Government of Malaysia 20Y 0.72132 0.4903 0.84739 0.4337
Bank Negara Malaysia 3M 3.19713 0.0508* 1.1049 0.3405
Bank Negara Malaysia 6M 3.87792 0.0283** 1.27774 0.289
Bank Negara Malaysia 1Y 3.87543 0.0283** 1.28265 0.2877
Bank Negara Malaysia 2Y 6.69401 0.0032*** 0.04729 0.9539
Cagamas Berhad 3M 0.60556 0.5491 1.04359 0.3586
Cagamas Berhad 6M 0.75851 0.4729 1.34253 0.269
Cagamas Berhad 1Y 0.33637 0.7157 1.40114 0.2544
Cagamas Berhad 2Y 0.18505 0.8315 1.45948 0.2406
Cagamas Berhad 3Y 0.02044 0.9798 1.71886 0.1881
Cagamas Berhad 5Y 0.2527 0.7775 0.9499 0.3926
Cagamas Berhad 7Y 0.48095 0.6206 0.64343 0.5291
Cagamas Berhad 10Y 1.26431 0.29 0.31832 0.7286
Cagamas Berhad 15Y 0.72152 0.4903 0.5529 0.5782
Cagamas Berhad 20Y 0.77824 0.4639 0.99743 0.375
Khazanah Nasional Bhd 3M 1.03189 0.3627 0.42567 0.6553
Khazanah Nasional Bhd 6M 0.53596 0.5879 1.41411 0.2513
Khazanah Nasional Bhd 1Y 1.20193 0.3079 4.19971 0.0197**
Khazanah Nasional Bhd 2Y 3.53823 0.0354** 6.86593 0.0021***
Khazanah Nasional Bhd 3Y 1.86807 0.1634 2.74366 0.0726*
Khazanah Nasional Bhd 5Y 1.37281 0.2614 0.84235 0.4358
Khazanah Nasional Bhd 7Y 1.17423 0.3162 1.71483 0.1888
Khazanah Nasional Bhd 10Y 0.83247 0.44 0.52187 0.5961
Khazanah Nasional Bhd 15Y 0.90517 0.41 0.66422 0.5185
Table 3. Pair-wise Granger Causality Tests with Lags = 2

123
Khazanah Nasional Bhd 20Y 1.75895 0.1811 0.9794 0.3816
Financial Institutions 3M 3.54323 0.0352** 7.48127 0.0013***
Financial Institutions 6M 4.08397 0.0218** 10.292 0.0001***
Financial Institutions 1Y 1.15298 0.3227 6.36711 0.0031***
Financial Institutions 2Y 0.31232 0.7329 0.08468 0.9189
Financial Institutions 3Y 0.59571 0.5545 0.46707 0.6291
Financial Institutions 5Y 1.55843 0.219 1.29125 0.2826
Financial Institutions 7Y 1.37617 0.2605 0.42458 0.656
Financial Institutions 10Y 3.9264 0.0251** 2.42546 0.0972*
Financial Institutions 15Y 5.22312 0.0082*** 1.92561 0.1548
Financial Institutions 20Y 2.59499 0.0831* 1.78947 0.176
Corporate Guaranteed 3M 0.37358 0.6899 2.13929 0.1268
Corporate Guaranteed 6M 0.95116 0.3921 5.01841 0.0097***
Corporate Guaranteed 1Y 2.81344 0.0681* 4.57898 0.0142**
Corporate Guaranteed 2Y 3.1759 0.049** 3.34018 0.0422**
Corporate Guaranteed 3Y 0.71377 0.494 0.55671 0.5761
Corporate Guaranteed 5Y 1.33584 0.2708 0.07716 0.9258
Corporate Guaranteed 7Y 2.10385 0.131 2.72633 0.0737*
Corporate Guaranteed 10Y 0.44789 0.6411 1.76991 0.1793
Corporate Guaranteed 15Y 0.76395 0.4704 3.26967 0.045**
Corporate Guaranteed 20Y 0.57224 0.5674 4.89831 0.0108**
Corporate 3M 1.28917 0.2831 5.09382 0.0091***
Corporate 6M 1.90303 0.1582 6.9031 0.002***
Corporate 1Y 2.72408 0.0739* 5.36952 0.0072***
Corporate 2Y 4.78233 0.0119** 3.33042 0.0426**
Corporate 3Y 0.91903 0.4045 1.07251 0.3487
Corporate 5Y 0.19322 0.8248 0.24604 0.7827
Corporate 7Y 1.35816 0.2651 1.3245 0.2737
Corporate 10Y 0.52103 0.5966 1.05824 0.3536
Corporate 15Y 0.64973 0.5259 1.60216 0.2101
Corporate 20Y 0.55904 0.5748 1.2833 0.2847
Note: *p<0.10; **p<0.05; ***p<0.01
Table 3. (Continued)

124
BETA (before) BETA (after) Change in the Beta (Δ) Absolute Change in the Beta (IΔI)
1 0.317228394 0.032458241 -0.284770153 0.284770153
2 0.41508531 -0.838206113 -1.253291423 1.253291423
3 0.862130125 1.24015704 0.378026915 0.378026915
4 0.934349131 1.301284633 0.366935502 0.366935502
5 1.298498972 0.83061133 -0.467887642 0.467887642
6 0.928654479 1.116754332 0.188099854 0.188099854
7 0.864626149 1.009726652 0.145100503 0.145100503
8 1.275320621 0.86142791 -0.413892711 0.413892711
9 1.328631895 0.906465478 -0.422166417 0.422166417
10 0.644744635 0.579820055 -0.06492458 0.06492458
11 0.538683079 0.360819283 -0.177863796 0.177863796
12 0.644744635 0.579820055 -0.06492458 0.06492458
13 0.791269107 0.856378036 0.065108929 0.065108929
14 0.093782564 0.337989072 0.244206508 0.244206508
15 0.170695456 0.047211479 -0.123483977 0.123483977
16 1.200444706 1.058985453 -0.141459253 0.141459253
Table 4. Impact of Issuing Ijarah Sukuk on beta of the Issuing Company
References
Ariff M., Cheng, F. F., & Neoh, V. H. (2009). Bond markets in Malaysia and Singapore. Malaysia: Pernebit Universiti Putra.
Bodie Z., Ariff, M., & Rosa, R. d. S. (2007). Investments (1 ed.): McGraw Hill.Cox J. C., Ingersoll J. E., Jr. & Ross S. A. (1985). “A Theory of the Term Structure of
Interest Rates”. Econometrica, 53(2), 385-407.Enders W. (1995). Applied Econometrics Time Series. New York: John. Wiley & Sons.Granger C. W. J. (1969). Investigating Causal Relations by Econometric Models and
Cross-spectral Methods. Econometrica, 37(3), 424-438.Hossain A. (2005). “Granger-Causality Between Inflation, Money Growth, Currency
Devaluation and Economic Growth in Indonesia”, 1951-2002. International Jour-nal of Applied Econometrics and Quantitative Studies, 2(3), 23.
Jobst A. A., Kunzel, P., Mills, P., & Sy, A. (2008). “Islamic bond issuance: what sovereign debt managers need to know”. International Journal of Islamic and Middle Eastern Finance and Management, 1(4), 330 - 344.
Rohmatunnisa, D. (2008). Design of Ijarah Sukuk. Unpublished MA in Finance and In-vestment, University of Nottingham, Nottingham, UK.
Sole J. (2008). “Prospects and challenges for developing corporate sukuk and bond mar-kets: Lessons from a Kuwait case study”. International Journal of Islamic and Mid-dle Eastern Finance and Management, 1(1), 20 - 30.

125
Tariq A. A. (2004). Managing Financial Risks of Sukuk Structures. Unpublished Disserta-tion, Loughborough University, Leicestershire, UK.
Tariq A. A., & Dar, H. (2007). “Risks of Sukuk structures: Implications for resource mo-bilization”. Thunderbird International Business Review, 49(2), 203-223.
Williams J. B. (1938). The Theory of Investment Value. Cambridge, MA: Harvard Univer-sity Press.
Wilson R. (2008). “Innovation in the structuring of Islamic sukuk securities”. Humanom-ics, 24(3), 170 - 181.