Embed Size (px)
Citation preview

1
Finance Theory and Practice 38 (3) 1-35 (2014)
Are there any top FDI performers among EU-15 and CEE
countries? A comparative panel data analysis
MIROSLAV MATEEV, PhD*
ILIYA TSEKOV, CFA
Article**
JEL: C31, C33, F21, F23
doi:
* This research is supported by a research grant from the American University in Bulgaria (AUBG) under the
Faculty Research Fund. All opinions expressed are those of the authors and have not been endorsed by AUBG.
The authors would like to thank two anonymous referees for their useful comment and suggestions. **
Received: December 7, 2013
Accepted: June 13, 2014
Miroslav MATEEV
University of Maine Business School, 5723 DP Corbett Hall, Orono, ME, United States
e-mail: [email protected]
Iliya TSEKOV
American University in Bulgaria, 1 G. Izmirliev square, Blagoevgrad 2700, Bulgaria
e-mail: [email protected]

2
Abstract
This paper examines the major determinants of Foreign Direct Investment (FDI) inflows in 26
European Union (EU) countries using panel data. Our empirical study takes a different
approach by separating European countries into two groups: Western (EU-15) countries and
Central and Eastern European (CEE) countries. The results from the panel data analysis of
FDI inflows to 26 EU countries for the period 1994-2012 show that: (i) traditional location
variables such as market size, trade openness, unemployment, infrastructure, tax rate and unit
labour costs are able, to a large extent, to explain FDI flows to both groups of countries; (ii)
there are country-specific factors such as economic growth, unit labour costs and credit risk
that contribute to the differences in FDI patterns across EU-15 and CEECs; and (iii) policy
and institutional quality factors are found to play an important role for both groups of
countries. When analyzing host countries based on their relative level of performance, we find
that the top ten FDI performers are able to attract a significant amount of FDI because of
their macroeconomic stability and high level of institutional development, while for EU
countries with low FDI dominance, policy and institutional risk factors play a more important
role.
Keywords: foreign direct investment, transition economy, gravity model, institutional quality
1 Introduction
This paper investigates the relative importance of different macroeconomic, policy and
institutional factors as determinants of FDI inflows into the transition economies in
Central and Eastern Europe (CEE) and compares them with the more developed Western
European countries. All of the CEE countries have undergone significant changes in their
political regimes in the last twenty years. They transformed themselves within a short period
of time from planned and government-controlled economies to ones where private business is
encouraged and competition accepted. The need for extensive enterprise restructuring and
modernization in view of limited domestic resources created environments where the potential
benefits of Foreign Direct Investment (FDI) are especially valuable. Also, transition
economies are well placed to benefit from the technology and knowledge transfer associated
with FDI (Demekas et al., 2005; Torlak, 2004). It is widely believed that these benefits
outweigh any possible drawbacks -- such as a loss of economic independence or increasing
industrial concentration when a single multinational firm achieves a dominant position in an
industry (Johnson, 2006).1
Almost non-existent at the beginning of the 1990s, the FDI inflow to the Central and
Eastern European countries (CEECs) has exploded in the last ten years (Henriot, 2005). More
recent data show that the Central and Eastern Europe (CEE) region experienced a five-fold
increase in foreign direct investment (FDI) inflows between 2003 and 2008, rising from
US$30 billion to US$155 billion (PricewaterhouseCoopers, 2010). Russia was the destination
which attracted much of this additional investment as its inflows rose from less than US$8
billion in 2003 to more than US$70 billion in 2008. The credit crunch and recession that
followed coincided with a collapse of FDI inflows to the CEE countries. According to the
same report, FDI inflows in the region as a whole were 50% lower in 2009 than in 2008. The
year 2012 saw the re-emergence of CEE FDI flows on the back of large job-intensive
1 Some researchers (Blomstrom and Kokko, 1998; Schoors and Van der Tol, 2002) argue that at least in the
initial stages of development or transition, FDI could have a negative impact on the recipient economy. If
domestic firms are so unproductive in comparison with foreign-owned firms, the former may be driven out of
business leading to a so-called “market stealing” effect.

3
projects, notably in Poland, Russia, Serbia and Turkey (Ernst & Young, 2013). As a
consequence, CEE overtook Western Europe to become the leading destination for FDI jobs
in Europe.2
Simultaneously, the more developed Western European countries have received much larger
FDI flows than transition economies (World Bank, 2014). Most of these countries offer
incentives to foreign investors in the form of preferential tax rates, tax holidays, special
depreciation schemes, social security relief, special tax deductible items and exemptions from
tariff payments. These are all intended to encourage FDI, although the empirical evidence for
such an impact is limited. The existence of incentives can be justified by the externalities that
accompany FDI.3 Geographical differences within Europe became more pronounced in the
last two years (2012-2013). Ernst & Young’s attractiveness survey (2013) shows that Western
Europe drew three-quarters of all FDI projects in 2012, yet more than half of the FDI jobs
were created in Central and Eastern Europe (CEE). CEE is reaping the benefits of an
affordable and capable labour force and its cost base remains competitive compared with
Western Europe.
The forces driving the FDI flows into the CEE countries have been intensely analysed in the
economics literature. There are numerous empirical studies which describe the specific role of
different groups of factors like transition-specific factors (Carstensen and Toubal, 2004;
Mateev, 2012), economic development (Henriot, 2005), economic reforms (Stoian and
Vickerman, 2005), exchange rate regime (Aubin et al., 2006), wage differentials (Dupuch and
Milan, 2003), and announcements related to EU accession (Bevan and Estrin, 2004). At the
same time the theoretical foundations and evidence from other regions can offer little insight
into the impact of certain factors specific to the transition process on FDI flows. Taken from
the behavioural and institutional points of view, CEE countries are very different from both
developing countries and industrially advanced countries. The speed with which market-
oriented policies and legal reforms conducive to foreign firms were introduced proved to have
an important role in explaining FDI. The significance of the privatization process in the early
FDI flows should also be taken into account. The financial system stability represents an
attractive factor for foreign investors and can also be considered an important FDI
determinant.
Our research has two goals. First, we analyze the relative importance of FDI determinants
that may explain the different sizes of foreign investment flows into more and less developed
European countries (EU-15 and CEE countries). Second, we compare the 26 EU countries
based on their relative FDI performance in order to find important macroeconomic, policy and
institutional quality factors that may explain the differences in the level of FDI performance
among European countries. Thus, our main findings reinforce the argument that the traditional
location factors are able to explain the differences in FDI patterns across European countries
but when the level of FDI performance is compared, a number of specific determining factors
are expected to play a more important role. To the best of our knowledge this is the only paper
to address this issue in the empirical literature on FDI.
2 Europe is still the world’s top destination, with 22.4% of global FDI value, although its share has
diminished by 6 points since 2011. This is partly due to a prolonged Eurozone crisis impacting investors’
confidence and risk appetite, but is also in line with a broader shift of focus toward developing and transition
economies, which, according to the United Nations Conference on Trade and Development (UNCTAD), secured
in 2012 more FDI (52.1%) than the developed world. 3 There is a widespread belief that foreign direct investment (FDI) enhances the productivity of host
countries and promotes economic development. This notion stems from the fact that FDI may not only provide
direct capital financing but also create positive externalities via the adoption of foreign technology and know-
how. Positive productivity spillover effects are found only for the developed countries (see Gorg and Strobl,
2002 for Ireland; Haskel, et al., 2002 for the UK, etc.).

4
In this paper we use a unique panel dataset covering 26 EU countries between 1994 and
2012. The results show that the main determinants of FDI inflows to these countries when
taken as a homogenous group are market size, trade openness, unemployment rate,
infrastructure endowment, unit labour costs and tax burden. Political and institutional risk
factors also play a significant role in explaining FDI in Europe. When investigating FDI
patterns across different groups of European countries (EU-15 and CEE countries), we find
that country-specific factors such as growth in GDP, unit labour costs and credit risk seem to
contribute to the differences in FDI flows attracted by each group of countries. The results
also show that the top ten FDI performers are able to attract significant amounts of FDI
because of their macroeconomic stability and high level of institutional development. In
contrast, for the group of countries with low FDI dominance, we find that policy and
institutional quality factors do play a more important role in explaining FDI; credit risk and
quality of institutions are significant determinants of FDI.
The rest of the paper is organized as follows: the next section outlines our conceptual
framework and summarises the theory on the determinants of FDI. The econometric model
and data analysis are presented in section 3. Section 4 presents econometric results from FDI
panel regressions. Some concluding remarks are offered in the final section.
2 Literature review: determinants of FDI
It has long been recognized that the benefits of FDI for the host country can be significant,
including knowledge and technology transfer to domestic firms and the labour force,
productivity spillovers, enhanced competition and improved access for exports abroad,
notably in the source country. The impact of FDI on the host economy depends on the type of
FDI. Three different types of FDI were identified: market-seeking FDI (horizontal FDI),
resource-asset seeking FDI, and finally, efficiency-seeking FDI (vertical FDI). The purpose of
market-seeking FDI is to serve local and regional markets. It is also called horizontal FDI, as
it involves the replication of production facilities in the host country. Tariff-jumping or
export-substituting FDI is a variant of this type of FDI. Because the reason for horizontal FDI
is to serve a local market better by local production, market size and market growth of the
host economy are the main drivers. Impediments to accessing local markets, such as tariffs
and transport costs, also encourage this type of FDI.
The second type, resource or asset seeking FDI, is observed when firms invest abroad to
acquire resources not available in the home country, such as natural resources, raw materials,
or low-cost labour. Especially in the manufacturing sector, when multinational firms directly
invest in order to export, factor-cost considerations become important. In contrast to
horizontal FDI, vertical or export-oriented FDI involves relocating parts of the production
chain to the host country. Availability of low-cost labour is a prime driver for export-oriented
FDI. Moreover, FDI in the resource sector, such as oil and natural gas, is attracted to countries
with abundant natural endowments. The third type of FDI, called efficiency-seeking, occurs
when the firm can gain from the common governance of geographically dispersed activities in
the presence of economies of scale and scope. In this case, prior to making a decision, foreign
investors consider the price of the factors of production (adjusted for productivity differences)
and the membership in regional integration agreements. Prospective membership in the EU,
which is conductive to the establishment of regional corporate networks, seems to have

5
attracted more efficiency-seeking FDI to transition economies after the initial announcement
of the progress of EU accession.4
Foreign direct investment represents an important source of finance for both developed and
developing countries but most of FDI inflows and outflows are concentrated within the
developed countries. Empirical research on foreign investment finds that FDI inflows to less
developed countries are usually associated with vertical investments (Carr et al., 1998;
Marakusen et al., 1996). Vertical FDI takes place when a firm relocates only a part of its
production process, and not the whole production. In many cases, it is the relocation of the
labour-intensive activities in low wage countries. This process tends to reduce the labour
intensity of the home country domestic production. FDI inflows to developed (industrially
advanced) countries are usually horizontal investments driven by market-seeking strategies,
and they tend to increase the labour intensity of the home country domestic production
(Mariotti et al., 2003). Therefore, horizontal investments replicate the complete production
process of the home country in a foreign country. Horizontal FDI seeks to take advantage of a
new large market, which is considered a traditional motive for FDI. In recent years, the
determinants of and motivation for FDI in developing countries (including transition
economies) have changed in the process of globalization.5
FDI is a rather complex economic phenomenon which depends on many factors whose
relative importance may change as the economic environment evolves over time; so it is
possible that as the economy of the host country changes and the international environment
evolves, the factors motivating FDI also change. Even though the traditional determinants and
the types of FDI associated with them have not disappeared with globalization, their
importance is declining (Nunnenkamp, 2002). For example, one of the most important
traditional FDI determinants, market size, has decreased in importance, while at the same time
new determinants have emerged. Cost differences between locations, the quality of
infrastructure, the ease of doing business and the availability of skills have increased in
importance (Botrić and Škuflić, 2006). This reveals that investors’ motives are changing, and
consequently countries must seek new ways to attract FDI.
There is a growing body of research literature that provides empirical evidence about the
factors determining the patterns of FDI in different countries and regions, including Europe.6
When it comes to the analysis of FDI directed to CEE countries, the two main approaches that
have been used are survey-type studies and formal quantitative analyses (Benacek et al.,
2000). Quantitative studies on the determinants of FDI are based on a number of different
models, but the gravity approach is the most commonly used in practice. According to
Demekas et al. (2005) gravity factors consistently explain about 60 percent of aggregate FDI
4 It must be said that market-seeking and efficiency-seeking FDI do not exclude each other. If the market-
seeking FDI has a penetration logic (it looks for the market size and market parts), the efficiency-seeking FDI
and resource-asset seeking FDI may be considered as delocalisation investments (Aubin et al., 2006). 5 According to Dunning (2002), FDI in developing countries has shifted from market-seeking and resource-
seeking FDI to more (vertical) efficiency-seeking FDI. Due to globalization-induced pressure on prices,
multinational enterprises (MNEs) are expected to relocate some of their production facilities to low (real) cost
developing countries. Nevertheless, and in contrast to FDI in industrial countries, FDI in developing countries
still is directed predominantly to accessing natural resources and national or regional markets. 6 The majority of previous work in this area reports two groups of explanatory factors: gravity factors
(proximity, market size) and factor endowments (infrastructure, human capital). Though there has been
considerable theoretical work on foreign direct investment (for a literature review see Alfaro et al., 2006;
Blonigen, 2005; Nonnemberg and Mendonça, 2004; and Vavilov, 2005), there is no agreed model providing the
basis for empirical work. Rather, the eclectic paradigm, also known as OLI framework (Dunning, 1988, 1992),
has been largely employed in research literature as a general tool of reference for explaining the FDI patterns of
multinational enterprises.

6
flows, regardless of the region.7 Policy and institutional environment also matter for FDI. For
example, Janicki and Wunnava (2004) find that international trade is perhaps the most
important determinant of foreign direct investment in the CEE region, while Carstensen, and
Toubal (2004) argue that comparative advantages like low relative unit labour costs, corporate
tax rates and relative endowments also exert a significant influence. In our paper, we
undertake the second approach, based on a comparative panel data analysis.
The gravity model rests on the assumption that FDI flows are larger between large
economies and even more if the countries are close neighbours. The GDP-related core gravity
variables (GDP of home country and GDP of host country) capture size effects: the larger the
home country of FDI, the more FDI should emerge from this country; the larger the market
size of a host country, the more FDI it should receive. Thus, the two variables are positively
correlated with FDI. Following previous empirical research into host country determinants of
FDI (Altomononte and Guagliano, 2003; Demekas et al., 2005) we include two proxy
variables for market size – gross domestic product and population - in the panel data analysis.
Nominal (or real) GDP is traditionally used as a proxy for the market size of the host country,
while growth rate in GDP is used as a measure of the quality of the market demand in the
same country. The two variables will indicate the importance of market-seeking FDI in a host
country. We expect a positive correlation between a host country’s market size and FDI. As
our analysis is based on FDI net inflows to the host country, we do not include source
country’s GDP as an explanatory variable.
Distance has long been used successfully as a variable in gravity models explaining
international trade. In these models distance functions as a proxy for transportation costs but
also as a proxy for the affinity between the trading economies. Affinity is determined by
geographical proximity and similarities in culture and language. A high affinity implies that
economic interaction between the countries (such as trade or FDI) can occur with reduced
friction (Johansson and Westin, 1994). From a theoretical point of view, the sign on the
distance variable is ambiguous a priori (Markusen and Maskus, 2002), depending on the
motive for FDI.8 While large distance may encourage FDI due to an internalization advantage,
it also may discourage FDI due to the lack of market know-how, higher communication and
information costs, and differences in culture and institutions (Buch et al., 2004, 2005).
However, if the investor’s host-country affiliates are relatively new, as is often the case in the
Central and Eastern European countries, they typically depend on headquarter services and
intermediate inputs supplied by the parent firm. Therefore, even in the case of horizontal FDI
to the CEE countries, a negative impact of distance on FDI is plausible.
Several previous studies (Altomonte, 1998; Bevan and Estrin, 2000; Bos and Van de Laar,
2004; Carstensen and Toubal, 2004) have suggested that trade limitations have also had
significant impact on the size of FDI flows. Factors such as trade openness are of major
importance to investors who usually prefer countries with relatively liberal trade regimes. It is
widely argued that FDI and openness of the economy should be positively related as the latter
in part proxies the liberality of the trade regime in the host country, and in part - the higher
7 Following LeSage and Pace (2008), Leibrecht and Riedi (2010) extent the frequently used gravity model
via the inclusion of spatial interaction effects across home countries of FDI as well as across host countries.
Moreover, they consider the host country's surrounding market potential as a determinant of FDI flows. This
variable captures the possibility that the market size of proximate countries may impact on the volume of FDI a
particular host country receives. 8 Johnson (2006) argues that distance should have a negative effect on market-seeking FDI. Increasing
distance implies lower affinity, resulting in higher costs of investment and more costly adaptation of goods to
local preferences. Efficiency-seeking FDI is likely to be affected negatively by distance for the case where the
components produced in the host country are shipped back to the source country, since transportation costs
increase with distance. Distance can be argued to be relatively unimportant for resource-seeking investment.
Resource-seeking MNEs are attracted to a limited number of geographical locations where the needed resource
is available, diminishing the importance of distance for the investment decision.

7
propensity for multinational firms to export.9 Following Deichman (2001), Falk and Hake
(2008), and Holland and Pain (1998) we include a proxy variable (import plus export as a
percent of GDP) to assess the relative effect of trade openness on FDI flows. The expected
effects may differ by the type of investment regarding local market or export orientation, the
host country’s foreign exchange control laws and applied capital taxation. However, for our
sample of 26 EU countries, we should expect trade openness to indicate also the level of
integration of the local economy into the regional economic flows. Therefore, trade openness
will have a positive impact on FDI.
The prospects for political and macroeconomic stability together with the transparency of
the legal regulations governing factors, such as foreign ownership of land and profit
repatriation, all matter to potential investors and the risk must be compensated for by higher
expected gains (Jun and Singh, 1996). Usually foreign companies look for resources
availability, high productivity, reduced unit labour costs, but also for well-established
financial institutions providing full banking services as well as well-developed security
markets. Thus, financial system stability and the level of credit activities in a host country
represent attractive factors for foreign investors and can be considered important determinants
of FDI (Albulesku et al., 2010). In this study, we use the volume of domestic credits to the
private sector as a share of GDP to proxy the credit activities in a host country. We expect a
positive relationship between this variable and FDI.10
Furthermore, the existence of a developed and effective infrastructure is necessary for the
operations of MNEs since it reduces costs of distribution, transportation and production,
thereby affecting comparative and absolute advantage of the host country. Bellak et al. (2009)
find evidence that FDI in CEE countries is attracted by increases in infrastructure endowment;
information and telecommunication infrastructure as well as transport infrastructure impact
positively on FDI. Different studies of FDI use different proxies for infrastructure.11
For
example, Demekas et al. (2007) include an indicator of infrastructure reform from the
European Bank for Reconstruction and Development (EBRD). This index reflects the state of
regulation of infrastructure services (EBRD, 2004). The study finds that, for the less
developed economies in their sample, infrastructure is an important determinant of FDI, while
it becomes insignificant for the more developed countries. Campos and Kinoshita (2003) use
the number of mainline telephone connections as a proxy for infrastructure. A positive impact
on FDI is found only for the former Soviet Union countries. In this study we use total
telephone lines per 100 people to account for the quality and availability of infrastructure
services in a host country. As favourable infrastructure endowment attracts FDI to both
developed and less developed countries, we expect a positive influence on FDI.
Empirical research finds that the choice of an investment location is driven by total labour
costs as well as labour productivity. The indicators of labour costs used in empirical studies
can be classified into three major groups: total labour costs, gross wages and unit labour costs
(see Bellak et al., 2008 for a comprehensive survey of existing studies in the field).12
9 Trade policies and, more broadly, trade costs (tariffs, non-tariff barriers, and transportation costs) are
generally found to have a significant impact on FDI flows, but in aggregate regressions their sign is ambiguous.
This is probably due to the different effect the barriers to trade can be expected to have on horizontal and vertical
FDI; they tend to attract horizontal FDI, which aims at penetrating the domestic market, but repel vertical FDI. 10
Our preliminary tests find this variable to be a weak proxy for credit activities (and financial stability) in a
host country. The variable shows insignificant in all model specifications. 11
Goodspeed et al. (2006) explain FDI in a broad range of countries and include the consumption of electric
power, the number of mainline telephone connections and a composite infrastructure index in their regressions.
In a related paper Goodspeed et al. (2010) find that a favourable infrastructure endowment attracts FDI to
developed as well as less developed countries. Thereby the impact is larger in the latter country group. 12
The literature using unit labour costs is heterogenous concerning the operationalisation of labour costs.
For example, Bevan and Estrin (2004) use annual average wages in the manufacturing sector as a proxy for total
labour costs and nominal GDP per capita as a proxy for labour productivity. In contrast, Carstensen and Toubal

8
Although the various measures can be classified into these three groups, the exact definition
of the measures applied differs widely within each category. Consequently, the empirical
studies show a wide variety of results with respect to the size and significance of the
coefficient of the labour cost proxy used. Most of them report a negative impact of labour
costs on FDI, while Boudier-Bensebaa (2005) finds a significant positive sign for the unit
labour cost variable in a study on regional FDI in Hungary.
Since our sample includes both well-developed and developing (transition) economies we
expect the difference between gross wages and total labour costs to vary substantially in
different European countries. If foreign investors are seeking low labour costs, the availability
of cheap labour will be an important factor affecting FDI. However, firms only prefer low
wage locations if the reduced labour costs are not compensated by lower labour productivity,
or an overvalued currency. Following Carstensen and Toubal (2004) we use monthly average
gross wages as a share of GDP per employment to proxy the unit labour costs in a host
country. A rise in wages increases, ceteris paribus, unit production costs, and therefore,
decreases FDI. Therefore, we may expect a negative relationship between this variable and
FDI, although a positive-signed coefficient is plausible.13
Previous studies of FDI in developing countries have put particular stress on the
indicators of economic and political risk (Lucas, 1993; Singh and Jun, 1996). This comprises
three main elements: a) macroeconomic stability, e.g., growth, inflation, exchange rate risk; b)
institutional stability such as policies towards FDI, tax regimes, the transparency of legal
regulations and the scale of corruption; and c) political stability, ranging from indicators of
political freedom to measures of surveillance and revolutions. In general, it might be expected
that FDI is more likely to flow from developed countries into developing economies that are
politically stable and have access to large, regional markets. In this study the institutional
stability is proxied by corruption and a composite variable for the quality of institutions.
Previous studies of the relationship between corruption and FDI (Demekas et al., 2005;
Smarzynska and Wei, 2000; Stoian and Filippaios, 2007) indicate that a high level of
corruption can have a negative effect on the volume of FDI flows since it increases the costs
of operation in the host country for foreign investors and reduces the profitability of
investment. Following Pournarakis and Varsakelis (2004) we use the Transparency
International’s Corruption Perceptions Index (TI) as a proxy for the severity of corruption.
Pursuant to previous empirical findings, we expect a negative correlation of this variable with
FDI.
To account for the institutional quality effects we use the World Bank’s Worldwide
Governance Indicators (WGI), which include six measures: political stability, government
effectiveness, regulatory quality, rule of law, control of corruption, and voice and
accountability. The perception of political stability (and risk) is measured through Moody’s
Sovereign Credit Rating, which inter alia captures the likelihood of expropriation of assets
and other forms in which a weak institutional environment is manifested. Less political risk
should lead to more FDI. Due to the particular definition of the measure of risk (see Appendix
A) we expect a positive correlation with FDI, that is, the higher the country risk index, or the
less risky the investment environment, the more attractive a country is for FDI. Following
previous empirical studies we introduce a second proxy for credit risk - a country's credit
default swap (CDS) spread - which is found to be negatively correlated with FDI.
(2004) employ differences in unit labour costs between home and host countries calculated as monthly average
gross wages over nominal GDP per employment. 13
Since labour costs in the transition economies appear to be very low, it is likely that they would generate
efficiency-seeking FDI from MNEs in countries that have higher labour costs. At the same time one should
recognize the fact that low wages do not necessarily reflect low production costs because labour productivity
may be low. Taking this into account, the location decision of a multinational enterprise depends on the relative
productivity-adjusted labour cost in the host country.

9
We use two additional variables (unemployment rate and statutory corporate income tax
rate) to capture the effect of any economic changes that might influence overall economic
activity, and FDI in particular. Less unemployment should imply larger investment flows;
thus, we expect negative correlation with FDI.14
Previous empirical studies (see Bellak and
Leibrecht, 2009) show that low (effective average) corporate tax rates indeed attract FDI in
general, and FDI in CEE countries, in particular. Thus, a negative relationship between the tax
rate and FDI is expected.15
3 Empirical specification
This study aims to reveal whether the traditional (location) characteristics can explain the
differences in FDI across different groups of EU countries. Therefore, the central research
question to be answered can be formulated as follows: Can the traditional factors – identified
by the existing empirical literature – be applied to less developed transition economies, or are
there other determinants (e.g. policy and institutional risk factors) that may explain the
different attractiveness of the two groups of European countries? This question will be
investigated by analyzing FDI to a group of 26 EU countries covering the period of 1994 to
2012. In this study we take a different approach – the whole sample of European countries is
divided into two groups, Western European countries (EU-15) and Central and Eastern
European countries16
, and they are analyzed separately. Then, we rank the host countries in
our sample based on their relative FDI performance and investigate the marginal effect of
different macroeconomic, policy and institutional quality factors on FDI in each group of
countries. To explain the differences in FDI across Western and Eastern European countries
we test two research hypotheses:
Hypothesis 1: Since the two groups of European countries - the more developed Western
countries and the CEE countries - are geographically close and share similar market features,
there should be a group of common factors that explain FDI inflows to these two regions.
Hypothesis 2: Since the differences in FDI pattern across the two groups of countries may
be due to different macroeconomic, policy and institutional factors, the more developed the
institutional and policy environment in a host country is, the larger the FDI dominance of this
country over the countries with less-developed environments.
3.1 Dependent variable
The dependent variable is FDI net inflows per year (in current U.S. dollars.) A sample of 26
European host countries, including 15 Western countries (Austria, Belgium, Denmark,
Finland, France, Germany, Greece, Ireland, Italy, Luxemburg, Netherlands, Portugal, Spain,
Sweden and United Kingdom17
) and 11 Central and Eastern European countries (Bulgaria,
Croatia, the Czech Republic, Estonia, Hungary, Poland, Latvia, Lithuania, Romania, Slovakia,
14
It’s axiomatic that a higher unemployment rate should discourage FDI. One might consider that a high
unemployment rate might mean that a unit labour cost advantage of the host country might be long-lasting, since
the labour demand would have to expand tremendously before any pressure for wage inflation would be present. 15
From an empirical viewpoint, corporate income taxes do indeed matter for investment location decisions
of MNEs. For example, De Mooij and Ederveen (2008) carry out a meta-analysis of 35 empirical studies and
find a median tax-rate elasticity (semi-elasticity) of FDI of about -2.9. However, the typical tax-rate elasticity
crucially depends on the tax measure used and the operationalisation of FDI applied. Concerning tax rates,
various measures are proposed in the literature (see e.g., Devereux, 2004). 16
According to UNCTAD statistics, CEE countries include 19 ex-centrally planned economies and cover
also the group of Southeastern European countries included in our sample. 17
Malta and Cyprus are excluded from the group of Western countries as they do not belong to the original
EU-15 formation and there is scarce information for most of the country-specific variables.

10
and Slovenia) is examined to empirically test the determinants of FDI flows. The analysis uses
logarithm of FDI inflows to adjust for the skewed nature of the data; other studies of FDI
determinants in transition economies undertake similar treatments of the dependent variable
(see Demekas et al., 2005). The analysis also incorporates FDI inflow for the previous year as
an independent variable. Substantively, the lagged dependent variable accounts for the
path-dependent nature of FDI flows; that is, countries that have received FDI in the past
may be more likely to receive it in the present year. Methodologically, the lagged dependent
variable helps to control for serial correlation.
3.2 Explanatory variables
Two main assumptions for the choice of explanatory variables to be used in the empirical
analysis emerge from the preceding discussions (see section 2). First, in order to better
understand the determinants of FDI, it is crucial to specify an empirical model that allows for
a combination of traditional (market size, distance, trade costs, and relative factor
endowments), and more specific determining factors (risk, corruption and quality of
institutions). All of these variables are closely related to the theoretical models that explain
the attractiveness of a country as an FDI destination. Second, European countries are far from
being homogeneous. Both the level of economic development and the size of FDI differ
across different groups of countries (EU-15 and CEECs). Hence, the key question we address
in this paper is how important the traditional determinants are in explaining the FDI pattern
into more and less developed EU countries, and what specific factors contribute to the FDI
dominance of EU-15 over CEE countries.
As noted earlier, market-seeking FDI is to serve the host country market. Market size is a
measure of market demand in the country. We expect FDI flows to be greater in countries
with a larger domestic market. Following previous research on FDI we use real GDP rather
than nominal GDP as a proxy for market size, as the large fall in output that characterised the
first years of transition (1994 - 1997) could result in a strange relationship between GDP and
FDI inflows. We use population (POP) as a second proxy for the market size of a host
country. We expect both variables to have a strong positive influence on FDI. We also use
annual real growth rate in GDP (GDP_G) as a proxy for the market potential of a host
country.18
In line with previous empirical studies this variable should be positively correlated
with FDI. It is a stylized fact in the empirical literature that trade volumes between two
countries are a function of both income levels of the two countries (GDP) and the distance
between them. In a gravity model, the smaller the distance between two countries, the more
they are expected to trade. Distance is a proxy for transportation costs, or (economic) barriers
to trade. Following Demekas et al. (2005), we compute weighted distance (W_DISTANCE)
as the sum of bilateral distance to all source countries multiplied by the ratio of GDP of
source country to all source countries’ GDP. In line with their study, we expect a negative
correlation with FDI.
We also introduce a number of control variables, which capture the impact of global and
country-specific effects on FDI. Our choice of control variables is led by FDI theory and it is
based on well-established findings in the empirical literature (see section 2). These are real
world GDP growth rate (WORLD_GDP), credit default swap spread (CDS), trade openness
(import plus export as a percent of host country’s gross domestic product, TRADE),
unemployment rate (UNEMPL), telecommunication (total telephone lines per 100 people,
TELE), corporate tax burden (statutory corporate income tax rate, TAX), unit labour costs
(ratio of monthly average gross wages to GDP per employment, ULC), corruption index
18
We used general secondary education enrolment rate (EDUC) as an alternative proxy for the market
demand in a host country. We find this variable insignificant in all model specifications.

11
(Transparency International’s Corruption Perceptions Index, COR), and credit risk (Moody’s
Sovereign Credit Rating, CR_RISK).
In addition to the macroeconomic and political risk effects we introduce a group of factors
that measure the level of the institutional quality in a host country. To summarize the
information contained in these factors, we utilized principal component analysis (PCA). PCA
permits the reduction of the number of variables used in the estimation and yet retains a
substantial part of the information contained in the various variables. This strategy has been
widely used in previous empirical studies (Calderón and Servén, 2004; Kumar, 2006). A
detailed explanation and the expected sign of each proxy variable included in the composite
index (INSTIT) are presented in Appendix B. Following Sinha (2012), we created a second
composite (socio-economic) variable (NAT_RES); this variable is used as a proxy for the
availability of natural resources and the ability of the country to process these resources using
technology and skill. It includes the following variables: gross fixed capital formation, gross
domestic product, gross domestic product per capita, gross domestic savings, and total natural
resources rents (see Appendix B).
To summarize our discussions on model variables and data sources, Appendix A displays
both dependent and explanatory variables and their expected impact on FDI We use the
correlation matrix of dependent and explanatory variables (available upon request) to examine
the possible degree of collinearity among these variables. The explanatory variables used as
proxies for policy and institutional risk effects (COR, CR_RISK, and INSTIT) are highly
correlated with the rest of the variables used in our regression analysis. Thus, we may expect
that multicollinearity will be present in our model. To mitigate this problem these variables
are included in the model specifications one at a time.
Table 1 displays the differences in the level of macroeconomic and institutional
development between the group of top ten FDI performers and the rest of the countries in our
sample. The data show that countries with large FDI dominance are characterized with well-
developed macroeconomic, policy and institutional environment, while most of the countries
in the second group are transition economies. This may explain the larger FDI flows to the
first group of (more developed) EU countries and the relatively low FDI performance of the
second group. We also run a simple t-test on the mean differences between the characteristics
of the two groups of countries and find that for all but two variables the mean difference is
statistically significant.
[Insert Table 1 here]
4 Model and econometric results
The use of panel regressions with both a time-series and a cross-country dimension, as
opposed to a simple cross-section regression, allows a more sophisticated examination of
country-specific effects. This study uses the following specification:
jtjt2jt1jtjt εXβYβ)FDILn)Ln(FDI 1( , (1)
jttjtjt uγηε ,
where FDIjt denotes FDI inflows to host country j at time t, FDIjt-1 is the lagged value of
dependent variable, Yjt is a vector of traditional location variables, and Xjt is a vector of
control (macroeconomic, policy and institutional) variables. Here jt is an error term that
includes the country-specific as well as time-specific effects. Time effects, t, are usually
modelled as fixed parameters as they are correlated with the gravity model variables.
Including time fixed effects in the empirical model is one way to consider spatial

12
autocorrelation in disturbances (Hansson and Olofsdotter, 2010). In order to explore the cross-
sectional dimension of the panel we assume that the country-specific effects jt are random
and i.i.d with (0; 2
). As this assumption requires the country-specific effects to be
uncorrelated with the considered regressors, we will verify the latter condition by means of a
Hausman test.19
Finally, ujt denotes the stochastic remainder disturbance term which we allow
to suffer from heteroskedasticity and serial correlation of unknown forms. All regressions
include year dummy (TIME) to control for time variation from changes in external economic
environment common across sample countries.
The results for panel data regressions are presented in Tables 2 through 6. The benchmark
model is run for six different specifications. Table 2 shows the results for the total dataset of
26 EU countries (EU-15 and 11 CEE countries). The first column in Table 2 displays the
estimation results for our core model. In line with some recent studies on FDI in transition
economies (Bellak et al., 2009; Hansson and Olofsdotter, 2010) we find that the coefficient of
GDP variable is statistically significant and positive.20
With respect to other gravity variables
in Model 1, the estimated coefficients of POP and DIST carry the expected signs but only the
POP variable is marginally statistically significant at the 10 percent level. One possible
explanation of why the distance variable enters the model insignificantly is that the main
source countries of FDI to our sample countries are from Europe.21
Growth in GDP used as a
proxy for market demand also shows no significance in our analysis (see Model 1). Although
the results of our pre-estimation tests indicate there is no causality in the FDI-GDP
relationship we decided to omit the GDP_G variable from the rest of our model specifications.
The control variables enter the empirical model statistically significantly except real world
GDP growth rate. This variable proves to be insignificant in all model specifications and
drops from models 2 through 6. The estimated coefficients of the rest of the control variables
carry the expected signs. A positive estimate of the TRADE variable implies that countries
with relatively liberal trade regimes capture disproportionately more FDI. It also indicates that
a higher level of integration of the local economy into the regional economic flows impacts
the FDI attracted by this country positively. The positive and significant coefficient of the
TELE variable signifies that, in general, countries with more favourable infrastructure
endowment attract more FDI. As expected, the unemployment rate and corporate income tax
rate have negative impacts on FDI but only UNEMPL is strongly statistically significant at
the 1 percent level. The coefficient on corporate tax rate displays a tax-rate elasticity of about
-1.5. This result is in line with the meta-analysis of De Mooij and Everdeen (2008) who find a
median tax-rate elasticity of about -2.9 but this should be treated with caution because they
use the effective average tax rate rather than the statutory tax rate. Finally, in line with
Demekas et al. (2005), our analysis shows a marginally significant (and negative) impact of
unit labour cost on FDI.
We also introduce a number of control variables that proxy for different political and
institutional risk effects (see Model specifications 2 through 5). The estimated coefficients of
COR, CR_RISK and INSTIT are statistically significant and with the expected signs. The
NAT_RES variable used as a proxy for the availability of natural resources in a host country
19
Hausman’s (1978) specification test enables us to test the hypothesis regarding the absence of correlation
between the unobservable specific effects and the explanatory variables, and thereby, to consider the individual
effects as random or fixed. The null hypothesis for the Hausman test is that the difference in coefficients between
fixed effects and random effects specifications is not systematic. Thus a small p-value (<0.05) suggests the
rejection of the random effects specification. 20
If the GDP coefficient is positive and significant this implies that foreign investors are indeed attracted to
a large domestic market (market-seeking FDI). We also use GDP per capita as a proxy for the quality of the
market demand in a host country and do find this variable significant in all model specifications. 21
When the GMM estimator is used (not reported here), the DIST variable proves to be marginally
statistically significant and negative.

13
enters the model as insignificant. These findings are not unexpected. The data in Table 1 show
that the largest amount of FDI is attracted by EU-15 countries (see also Appendix C for the
top 10 FDI performers), which are well developed economies with low levels of
macroeconomic and political risk, and limited natural resources. At the same time CEE
countries are characterized with a low degree of transparency and high bureaucratic risk that
defer FDI. For these countries we expect variables such as corruption, credit risk and quality
of institutions to play a significant role in explaining FDI. When country risk level is
measured by the credit default swap spread (CDS), the results show a strong negative impact
on FDI (see Model 1).
We also introduce the lagged value of the dependent variable (FDI) in all model
specifications. The positive sign of this variable shows that countries with a larger stock of
FDI will also, ceteris paribus, have an advantage in attracting new investment compared to
countries with a smaller stock. All model specifications include a time dummy to control for
different time periods (before the financial crisis of 2008 and after that); the estimated
coefficient is positive and statistically significant only in Model 1.
[Insert Table 2 here]
The results achieved so far show that there is a set of gravity and traditional (location)
factors common across different groups of European countries (EU-15 and CEE countries)
that explain FDI flows to these countries. Thus, we find strong evidence in support of our first
hypothesis. Although the two groups of countries are geographically closer and share similar
market features, one may expect them to have different kinds of attractiveness to foreign
investors. Looking at them as a homogeneous group of economies makes it difficult to
disentangle institutional and other effects on FDI that are cross-correlated to these same
factors. Thus, using separate samples makes it possible to analyze whether the motives for
FDI differ across EU-15 and CEE countries. Another advantage of using separate samples is
that it reduces the correlation between the explanatory variables. Basically, the same
specifications as for the total sample are used. The results for the groups of EU-15 and CEE
countries are presented in Tables 3 and 4.
Model 1 in Table 3 shows that the gravity variables (except distance) enter the model
statistically significantly. While GDP and POP variables show strong positive impact on FDI
in all model specifications, DISTANCE variable remains insignificant. Similarly to the total
sample GDP_G variable and real world GDP growth rate are not statistically significant.
Including macroeconomic factors as control variables yields results similar to those for the
total sample. All but two variables (unemployment and tax rates) show a significant impact
on FDI flows into the group of EU-15. In the next few models we control for different
political and institutional risk effects. COR, CR_RISK and NAT_RES variables are all found
to have a statistically significant impact on FDI. The results in Table 3 show that more
developed European countries with a larger stock of FDI will have no advantage in attracting
new investments compared to countries with a smaller stock; the estimated coefficient is
positive but statistically insignificant. All model specifications in Table 3 include time
dummies for the years 1999 and 2002 to control for Eurozone membership effect.22
The
estimated coefficients for year 2002 are statistically significant, which confirms our
expectation that, in general, Eurozone membership plays an important role in attracting more
22
The euro currency was launched alongside EU national currencies in 1999 but physical notes and coins
that replaced all national currencies came into existence in 2002. For more details see
http://en.wikipedia.org/wiki/Eurozone#Member_states.

14
FDI into the group of EU-15 countries but its immediate effect may be negative for some EU
countries (year 2002 dummy is negative).23
[Insert Table 3 here]
Next, the benchmark model (1) is run for the sub-sample of CEE countries (see Table 4).
The results support our first hypothesis that there is a set of traditional factors (market size,
trade openness, unemployment, and tax rate) that are common FDI determinants across
different groups of European countries. At the same time we find a number of country-
specific factors significant only for the group of CEE countries. For example, unlike the total
and EU-15 samples, growth in real GDP enters the model strongly statistically significantly
(see Model 1). This result supports Suder and Sohn (2010) finding that the fast economic
growth of CEE countries during the last two decades plays an important role in increasing the
attractiveness of this group of economies for foreign investors. Surprisingly, the unit labour
cost (ULC) variable is not found to have a significant impact on FDI flows into the group of
CEE countries; the estimated coefficient is negative but statistically insignificant. This result
is inconsistent with previous empirical studies (see Bellak et al., 2008; Demekas et al., 2005)
that consistently reveal negative significant effects of labour costs on FDI; yet this effect
should be interpreted with caution, as a positive sign for unit labour costs is also possible, if
they actually capture a higher skill level and higher per capita income.
One may expect that unlike the EU-15 sample, variables such as corruption and quality of
institutions will have a significant impact on FDI in transition economies. We do find that two
of the control variables that proxy political and institutional risk effects (CR_RISK and
INSTIT) enter the model statistically significantly. Thus, we provide evidence in support of
the hypothesis that policy and institutional quality factors are indeed able to explain the
differences in attractiveness among CEE countries for foreign investors. We may expect that
transition effects will be more pronounced at the level of business entities (through
privatization or other phenomena) than on a country-specific level. To confirm or reject this
hypothesis we also run the model with a dummy variable (PRIV) indicating the perceived
quality of the method of privatization followed by the recipient (host) country.24
In line with
previous research (see Carstensen and Toubal, 2004; Holland and Pain, 1998), we do find
evidence that the method of privatization has a strong impact on the level of foreign
investment in the transition economies in Central and Eastern Europe.25
The estimated
coefficient for lagged value of FDI also proves to be positive and statistically significant. All
model specifications include time dummies for the years 2004 and 2007 to control for EU
membership effects. Of the two variables only the 2007 dummy shows a strong positive
impact on FDI. We may conclude that the announcement effect of EU membership of
Bulgaria and Romania in 2007 did play a positive role in attracting more foreign investments
in this region.
[Insert Table 4 here]
23
There is no way of saying whether the 2002 dummy is negative due to Eurozone membership or maybe
there are other factors that affect FDI flows in that particular year (2002). 24
The variable is constructed on the same basis as Holland and Pain (1998), where sales to outside owners
receive the highest quality rating, while voucher distribution and management-employee buyouts receive the
lowest rating. 25
The PRIV variable is automatically omitted from the FE model specifications. By construction, the FE
estimator drops variables which are time invariant. With the RE estimator, the PRIV variable is positive and
statistically significant in model specifications 1, 3 and 6. These results are available upon request.

15
In the previous section, we asked the question if there are top FDI performers among the
European countries, and if this is the case, what factors may explain the FDI dominance of
this group of countries over the rest of the countries in our sample. To answer this question,
we rank all the countries in our sample based on the index of relative dominance of FDI flows
(Sinha, 2012) and split them into two groups – top ten FDI performers and the rest of the
countries (see Appendix C). Then, we run the benchmark model (1) for each of these two sub-
samples to investigate if FDI determinants are similar across the two groups. The results are
reported in Tables 5 and 6. As expected, we find that traditional (location) factors such as
gross domestic product, credit default risk, telecommunications, and tax rate have similar
effects on FDI across the two groups of performers. In contrast, the unit labour costs (ULC)
variable shows significant impact on FDI only in the group of countries with low FDI
dominance (most of these countries are transition economies), while variables such as
UNEMPL and TELE are found to have larger effect in the group of top ten FDI performers.
For this group of more developed EU economies the world GDP growth rate also plays a
significant role in attracting more FDI, especially in periods of strong economic development.
When analyzing the impact of political and institutional risk factors on FDI we do find some
differences between the two groups of countries. The top ten FDI performers are able to
attract significant amount of FDI due to their political and macroeconomic stability, as well as
the high transparency of their legal regulations. Thus, we do not find the variables that proxy
these policy and institutional effects to have a significant influence on FDI. For the group of
countries with low FDI dominance, both credit risk and quality of institutions are found to be
significant determinants of FDI. These findings are not unexpected. The countries that belong
to the second group are economies with less developed policy and institutional environments;
as said before labour costs in these countries appear to be relatively low, so it is likely that
they are able to attract predominantly efficiency-seeking FDI from MNEs in countries that
have higher labour costs. Thus, our second hypothesis is confirmed. The time dummy variable
used to control for the 2008 crisis effect proves to be statistically insignificant for both
groups of FDI performers (except in Model 1).
[Insert Table 5 here]
[Insert Table 6 here]
5 Conclusion
The analysis presented in this paper has enabled identification of several key determinants of
FDI flows into Western and Eastern European countries, and highlighted the significance of
different policy and institutional factors for the attractiveness of these countries for foreign
investors. By using both traditional and more specific variables and a longer period (1994 –
2012), we extend the previous research work on FDI, which focuses mainly on European
Union (EU) countries as a homogeneous group of economies. Our research provides
additional support to the common view that the traditional location factors (GDP, population,
trade openness, unemployment, infrastructure endowment, tax rate and unit labour costs) are
important determinants of FDI into different European countries. At the same time we find
that country-specific characteristics such as economic growth, unit labour costs, and credit
risk contribute to the differences in the FDI pattern across EU-15 and CEE countries. Policy
and institutional quality factors also play an important role in explaining the increasing
attractiveness of both groups of countries for foreign investors.
The results of an analysis of indicate that market-seeking motives (proxied by GDP,
population and trade openness) are important drivers of FDI to all European countries.
Investigating the importance of FDI motives for EU-15 and CEE countries as separate groups

16
shows that efficiency-seeking motives (proxied by infrastructure endowment) have significant
effect on FDI in both regions, while growth in GDP, unemployment and tax rates seem to
influence FDI only in the group of CEE countries. In line with previous empirical research
(Bevan and Estrin, 2000; Carstensen and Toubal, 2004; Holland and Pain, 1998; Stoian, and
Filippaios, 2007), the explanatory variables that purport to measure the significance of policy
and institutional environment such as corruption, credit risk, and quality of institutions are
found to have a significant influence on FDI in Europe. When total sample is divided into two
sub-samples (EU-15 and 11 CEE countries) this effect remains strong; while quality of
institutions seems to be important FDI determinant only in the group of CEE countries,
natural resource availability is a significant factor for more developed EU-15 countries.
To the best of our knowledge this is the only paper that investigates the marginal effect of
macroeconomic, policy and institutional quality factors on FDI in different European
countries based on their relative performance. We ranked all the countries in our sample based
on the index of relative dominance of FDI flows and investigated the factors that determine
FDI in each group. Our results show that the top ten FDI performers are able to attract
significant amount of FDI because of their macroeconomic stability and high level of
institutional development. For the group of countries with low FDI dominance we find that
policy and institutional quality factors have strong explanatory power; credit risk and quality
of institutions are significant determinants of FDI. Our findings have strong policy
implication for the group of less developed European countries where the governments’
efforts should be directed to creating stable political and institutional environments, as well as
appropriate incentives for foreign investors.
Unfortunately, the research does have some limitations. In the first place, we were not able
to differentiate the origin of FDI in our sample (in case of the EU-15). Thus, we have been
limited in our analysis on the expected (negative) impact of distance (as a location factor) on
FDI attractiveness for different groups of European countries. In addition, the empirical
results are derived from a sample of transition economies, which include only new EU
member states. Thus, the study will improve if candidate Member States (e.g., Macedonia,
Bosnia and Herzegovina, Albania, and Serbia and Montenegro) are included in the analysis.
This will help us investigate the role of different macroeconomic, policy and institutional
factors in explaining FDI flows attracted by countries at different stages of transition process
– the so-called “laggards” and “leaders”. This analysis is left for future research.

17
TABLE 1
T-tests on mean-differences
Mean Top 10
Others
Difference
(t-test)
FDI 4.19E+10 5.16E+09 9.79***
GDP_REAL 1.12E+12 1.13E+11 15.24***
POP 3.80E+07 7.10E+06 15.96***
W_DISTAN 5.28E+03 4.62E+03 6.02***
GDP_G 0.0232 0.0296 -2.17**
W_GDP 0.028 0.028 0.00
CDS 69.363 283.34 -2.75***
TRADE 0.989 1.035 -0.86
UNEMPL 0.087 0.092 -1.24
TELE 0.497 0.368 11.68***
TAX 0.337 0.25 12.31***
ULC 0.868 0.227 10.12***
COR 3.808 5.208 -7.85***
CR_RISK 18.772 14.718 14.08***
INSTIT 1.078 -0.688 9.85***
NAT_RES 1.496 -0.938 15.66***
Note: *, **, and *** represent significance at 10, 5, and 1 percent, respectively
Notes: Data in Table 1 represent the mean values of the dependant and explanatory variables for the
sample of Top 10 countries in terms of FDI inflows and the rest of the sample, for the period of 1994 -
2012. Total number of observations is 272. For some variables there are missing observations. The
dependent variable is total FDI net inflows. The explanatory variables are Real GDP (GDP_R),
Population (POP), Weighted distance (W_DISTAN), Growth in real GDP (GDP_G), Real world GDP
growth rate (W_GDP), CDS spread (CDS), Trade openness (TRADE), Unemployment rate
(UNEMPL), Infrastructure endowment (TELE), Corporate income tax rate (TAX), Unit labour costs
(ULC), Corruption index (COR), Sovereign credit rating (CR_RISK), Institutional quality index
(INSTIT), and Natural resources (NAT_RES). Time dummies for different major events (Eurozone and
EU membership) are not included in the table. The table shows also the t-statistics of the mean-
differences between the characteristics of the two country groupings.
Source: Authors’ calculation.

18
TABLE 2
FDI net inflows panel regressions (1994 – 2012), Total sample
Explanatory variables Model 1 Model 2 Model 3 Model 4 Model 5 Model 6
FE FE FE FE FE FE
GDP_REAL 3.513** 2.064*** 2.464*** 2.341*** 1.929*** 2.079***
(0.010) (0.000) (0.000) (0.000) (0.004) (0.000)
POP 2.093 1.222 2.893* 2.843* 0.098 1.477
(0.537) (0.441) (0.068) (0.081) (0.960) (0.332)
WEIGHTED_DISTANCE -0.036 -0.089 -0.047 -0.108 -0.098 -0.094
(0.880) (0.558) (0.754) (0.473) (0.522) (0.536)
GDP_G 1.944
(0.445)
WORLD_GDP 0.045
(0.992)
CDS -0.165**
(0.015)
TRADE 0.357 0.553* 0.426* 0.340 0.886* 0.351
(0.211) (0.060) (0.105) (0.196) (0.087) (0.184)
UNEMPL -3.325 -2.091 -6.075*** -4.037** -5.327*** -2.932*
(0.288) (0.258) (0.003) (0.028) (0.010) (0.100)
TELE 2.757 3.322*** 3.723*** 3.391*** 2.924** 3.329***
(0.188) (0.001) (0.000) (0.001) (0.011) (0.002)
TAX -1.460 -1.206 -1.271 -1.153 -2.147 -1.514
(0.608) (0.348) (0.312) (0.364) (0.120) (0.234)
ULC -0.719 -1.102* -1.058* -0.464 -0.993* -0.918
(0.505) (0.087) (0.097) (0.487) (0.103) (0.153)
COR -0.201*
(0.083)
CR_RISK 0.089***
(0.004)
INSTIT 0.269**
(0.022)

19
NAT_RES 0.090
(0.345)
Lag(FDI) 0.006 0.117* 0.105* 0.123** 0.088 0.131**
(0.945) (0.052) (0.077) (0.038) (0.160) (0.028)
TIME(2008) 0.570*** 0.170 0.146 0.119 0.102 0.158
(0.007) (0.344) (0.412) (0.510) (0.579) (0.382)
R-squared (overall) 0.288 0.274 0.299 0.292 0.310 0.280
Number of observations 183 342 347 347 324 347
Notes: Model 1 includes gravity variables (GDP, POP and WEIGHTED DISTANCE), world and country-specific macroeconomic variables
(GDP_G, WORLD_GDP, CDS, TRADE, UNEMPL, TELE, TAX and ULC). Models 2 through 5 include policy and institutional risk
variables (COR, CR_RISK, INSTIT and NAT_RES). Models 1 through 6 include also lagged value of the dependent variable (FDI). Table 2
shows FE specification for each model based on Hausman’s test results. All variables (expect FDI, GDP and POP) are taken as ratios or in
percent. *, **, and *** represent significance at 10, 5, and 1 percent, respectively. P-values are shown in brackets. The null hypothesis for
the Hausman test is that the difference in coefficients between fixed effects and random effects specifications is not systematic. Thus a small
p-value (<0.05) suggests the rejection of the random effects specification.
Source: Authors’ calculation.

20
TABLE 3
FDI net inflows panel regressions (1994 – 2012), EU-15 sub-sample
Explanatory variables Model 1 Model 2 Model 3 Model 4 Model 5 Model 6
FE FE FE FE FE FE
GDP_REAL 8.341** 5.559*** 5.540*** 5.217*** 4.669*** 5.300***
(0.029) (0.000) (0.000) (0.000) (0.002) (0.000)
POP 2.564 8.543** 9.168** 8.611** 3.995 8.418**
(0.801) (0.019) (0.012) (0.020) (0.351) (0.023)
WEIGHTED_DISTANCE -0.723 -0.164 -0.143 -0.145 -0.148 -0.140
(0.276) (0.498) (0.552) (0.556) (0.543) (0.567)
GDP_G 10.151
(0.182)
WORLD_GDP 0.169
(0.985)
CDS -0.270**
(0.015)
TRADE 3.638** 0.300 0.513 0.277 0.033 0.375
(0.019) (0.661) (0.453) (0.694) (0.964) (0.587)
UNEMPL -4.202 -3.040 -5.162 -0.347 -5.601 -0.626
(0.407) (0.335) (0.168) (0.915) (0.129) (0.836)
TELE 8.292*** 3.710*** 3.912*** 4.030*** 3.248** 3.948***
(0.005) (0.004) (0.002) (0.002) (0.021) (0.003)
TAX -2.774 -1.786 -1.085 -1.123 -3.662** -1.712
(0.586) (0.256) (0.494) (0.522) (0.042) (0.283)
ULC -0.935 -1.786 -2.058* -1.634 -1.836* -2.066*
(0.667) (0.144) (0.090) (0.225) (0.105) (0.094)
COR -0.399**
(0.018)
CR_RISK 0.106**
(0.011)
INSTIT 0.155
(0.426)
NAT_RES 0.208*

21
(0.056)
Lag(FDI) 0.170* 0.068 0.043 0.065 0.003 0.068
(0.103) (0.350) (0.557) (0.383) (0.970) (0.360)
TIME(1999) omitted 0.399 0.415 0.428 0.430 0.425
(0.172) (0.155) (0.149) (0.143) (0.151)
TIME(2002) omitted -0.494** -0.573** -0.537** -0.643*** -0.544**
(0.029) (0.011) (0.019) (0.006) (0.018)
R-squared (overall) 0.291 0.295 0.298 0.275 0.307 0.272
Number of observations 91 210 210 210 197 210
Notes: Model 1 includes gravity variables (GDP, POP and WEIGHTED DISTANCE), world and country-specific macroeconomic variables
(GDP_G, WORLD_GDP, CDS, TRADE, UNEMPL, TELE, TAX and ULC). Models 2 through 5 include policy and institutional risk
variables (COR, CR_RISK, INSTIT and NAT_RES). Models 1 through 6 include also lagged value of the dependent variable (FDI). Table 3
shows FE specification for each model based on Hausman’s test results. All variables (expect FDI, GDP and POP) are taken as ratios or in
percent. *, **, and *** represent significance at 10, 5, and 1 percent, respectively. P-values are shown in brackets. The null hypothesis for
the Hausman test is that the difference in coefficients between fixed effects and random effects specifications is not systematic. Thus a small
p-value (<0.05) suggests the rejection of the random effects specification.
Source: Authors’ calculation.

22
TABLE 4
FDI net inflows panel regressions (1994 – 2012), CEECs sub-sample
Explanatory variables Model 1 Model 2 Model 3 Model 4 Model 5 Model 6
FE FE FE FE FE FE
GDP_REAL 0.206 0.097 0.325 0.641 1.435 0.537
(0.911) (0.933) (0.755) (0.536) (0.299) (0.607)
POP 1.252 5.825** 5.470* 5.398* 5.475 5.050*
(0.786) (0.043) (0.050) (0.053) (0.145) (0.071)
WEIGHTED_DISTANCE -0.261 -0.316* -0.155 -0.263 -0.277* -0.260
(0.305) (0.087) (0.419) (0.147) (0.105) (0.155)
GDP_G 5.587**
(0.047)
WORLD_GDP 0.632
(0.931)
CDS 0.018
(0.890)
TRADE 0.355 0.672** 0.582** 0.407* 2.054*** 0.480*
(0.208) (0.021) (0.027) (0.105) (0.003) (0.062)
UNEMPL -0.645 -3.929* -5.324* -4.737* -5.868** -3.667
(0.898) (0.104) (0.061) (0.082) (0.041) (0.170)
TELE 2.272 0.647 2.070 0.696 2.952 1.060
(0.531) (0.736) (0.286) (0.707) (0.152) (0.567)
TAX -5.815 -2.278 -5.270** -5.315** -4.267* -3.906*
(0.125) (0.384) (0.035) (0.033) (0.080) (0.099)
ULC -0.175 -0.188 -0.286 -0.612 -0.656 -0.207
(0.891) (0.799) (0.687) (0.411) (0.385) (0.772)
COR 0.116
(0.487)
CR_RISK 0.104*
(0.094)
INSTIT 0.283*
(0.084)
23
NAT_RES 0.034
(0.955)
Lag(FDI) 0.276** 0.227** 0.246*** 0.249*** 0.265*** 0.259***
(0.024) (0.017) (0.008) (0.007) (0.005) (0.005)
PRIV omitted omitted omitted omitted omitted omitted
TIME(2004) 0.062 0.117 0.165 0.131 0.097 0.124
(0.850) (0.618) (0.483) (0.575) (0.682) (0.599)
TIME(2007) 0.605** 0.726*** 0.702*** 0.689*** 0.664*** 0.731***
(0.049) (0.002) (0.003) (0.004) (0.005) (0.002)
R-squared (overall) 0.458 0.456 0.485 0.486 0.525 0.472
Number of observations 92 132 137 137 127 137
Notes: Model 1 includes gravity variables (GDP, POP and WEIGHTED DISTANCE), world and country-specific macroeconomic variables
(GDP_G, WORLD_GDP, CDS, TRADE, UNEMPL, TELE, TAX and ULC). Models 2 through 5 include policy and institutional risk
variables (COR, CR_RISK, INSTIT and NAT_RES). Models 1 through 6 include also lagged value of the dependent variable (FDI). Table 4
shows FE specification for each model based on Hausman’s test results. The PRIV variable is automatically omitted from the FE model
specifications. By construction, the FE estimator drops variables which are time invariant. With the RE estimator, the PRIV variable is
positive and statistically significant in model specifications 1, 3 and 6. All variables (expect FDI, GDP and POP) are taken as ratios or in
percent. *, **, and *** represent significance at 10, 5, and 1 percent, respectively. P-values are shown in brackets. The null hypothesis for
the Hausman test is that the difference in coefficients between fixed effects and random effects specifications is not systematic. Thus a small
p-value (<0.05) suggests the rejection of the random effects specification.
Source: Authors’ calculation.

24
TABLE 5
FDI net inflows panel regressions (1994 – 2012), Top 10 sub-sample
Explanatory variables Model 1 Model 2 Model 3 Model 4 Model 5 Model 6
FE FE FE FE FE FE
GDP_REAL 3.007 1.555 2.512** 1.865* 1.179 1.632*
(0.233) (0.146) (0.038) (0.083) (0.326) (0.105)
POP 13.938 1.843 3.821 3.593 1.160 1.943
(0.145) (0.466) (0.172) (0.196) (0.722) (0.441)
WEIGHTED_DISTANCE -0.097 -0.041 -0.054 -0.021 -0.012 -0.023
(0.920) (0.864) (0.821) (0.931) (0.961) (0.924)
GDP_G 13.256
(0.135)
WORLD_GDP 18.964*
(0.086)
CDS -0.279**
(0.045)
TRADE 0.588 0.499 0.597 0.351 0.053 0.542
(0.745) (0.492) (0.407) (0.631) (0.947) (0.453)
UNEMPL -6.617 -4.963* -7.259*** -7.236*** -8.189*** -6.275**
(0.143) (0.100) (0.007) (0.008) (0.005) (0.017)
TELE 8.338*** 3.918** 4.292*** 4.193** 3.174* 3.907**
(0.003) (0.016) (0.009) (0.011) (0.084) (0.017)
TAX -3.345* -1.069 -0.405 -0.015 -1.453 -0.902
(0.073) (0.534) (0.814) (0.993) (0.457) (0.596)
ULC -1.871 -0.648 -0.818 -0.054 -0.638 -0.582
(0.380) (0.525) (0.424) (0.961) (0.540) (0.567)
COR -0.131
(0.431)
CR_RISK 0.106
(0.124)
INSTIT 0.269
(0.162)

25
NAT_RES 0.011
(0.916)
Lag(FDI) 0.088 0.227** 0.203** 0.214** 0.192** 0.227**
(0.505) (0.013) (0.027) (0.018) (0.050) (0.012)
TIME(2008) 0.537* 0.124 0.100 0.051 0.007 0.097
(0.059) (0.631) (0.693) (0.843) (0.979) (0.705)
R-squared (overall) 0.425 0.312 0.321 0.319 0.312 0.308
Number of observations 72 149 149 149 140 149
Notes: Model 1 includes gravity variables (GDP, POP and WEIGHTED DISTANCE), world and country-specific macroeconomic variables
(GDP_G, WORLD_GDP, CDS, TRADE, UNEMPL, TELE, TAX and ULC). Models 2 through 5 include policy and institutional risk
variables (COR, CR_RISK, INSTIT and NAT_RES). Models 1 through 6 include also lagged value of the dependent variable (FDI). Table 5
shows FE specification for each model based on Hausman’s test results. All variables (expect FDI, GDP and POP) are taken as ratios or in
percent. *, **, and *** represent significance at 10, 5, and 1 percent, respectively. P-values are shown in brackets. The null hypothesis for
the Hausman test is that the difference in coefficients between fixed effects and random effects specifications is not systematic. Thus a small
p-value (<0.05) suggests the rejection of the random effects specification.
Source: Authors’ calculation.

26
TABLE 6
FDI net inflows panel regressions (1994 – 2012), Others sub-sample
Explanatory variables Model 1 Model 2 Model 3 Model 4 Model 5 Model 6
FE FE FE FE FE FE
GDP_REAL 4.005* 3.081*** 3.046*** 3.309*** 1.576 2.947***
(0.053) (0.000) (0.000) (0.000) (0.161) (0.000)
POP 0.892 1.136 0.329 0.429 0.516 0.787
(0.850) (0.616) (0.882) (0.842) (0.860) (0.712)
WEIGHTED_DISTANCE -0.003 -0.108 -0.053 -0.109 -0.073 -0.101
(0.991) (0.591) (0.790) (0.582) (0.723) (0.616)
GDP_G 3.402
(0.272)
WORLD_GDP 4.939
(0.446)
CDS -0.229**
(0.022)
TRADE 0.340 0.768** 0.546* 0.445 2.064*** 0.495*
(0.282) (0.025) (0.073) (0.139) (0.007) (0.104)
UNEMPL -6.542 -0.733 -4.417 -3.089 -5.232* -0.934
(0.213) (0.767) (0.167) (0.235) (0.087) (0.706)
TELE 2.189 3.274** 3.838** 3.778** 5.307*** 3.531**
(0.573) (0.033) (0.012) (0.012) (0.008) (0.021)
TAX -1.740 -1.883 -2.772 -2.885 -3.505* -2.662
(0.668) (0.355) (0.155) (0.136) (0.091) (0.174)
ULC -0.813 -1.885** -1.621* -1.088 -1.429* -1.499*
(0.596) (0.043) (0.075) (0.233) (0.100) (0.101)
COR -0.218
(0.216)
CR_RISK 0.067*
(0.086)
INSTIT 0.384**
(0.014)
NAT_RES 0.646

27
(0.297)
Lag(FDI) 0.083 0.009 0.000 0.006 0.017 0.014
(0.448) (0.912) (0.999) (0.937) (0.843) (0.859)
TIME(2008) 0.655** 0.223 0.222 0.187 0.107 0.244
(0.038) (0.368) (0.372) (0.448) (0.682) (0.327)
R-squared (overall) 0.319 0.321 0.337 0.348 0.364 0.325
Number of observations 111 193 198 198 184 198
Notes: Model 1 includes gravity variables (GDP, POP and WEIGHTED DISTANCE), world and country-specific macroeconomic variables
(GDP_G, WORLD_GDP, CDS, TRADE, UNEMPL, TELE, TAX and ULC). Models 2 through 5 include policy and institutional risk
variables (COR, CR_RISK, INSTIT and NAT_RES). Models 1 through 6 include also lagged value of the dependent variable (FDI). Table 5
shows FE specification for each model based on Hausman’s test results. All variables (expect FDI, GDP and POP) are taken as ratios or in
percent. *, **, and *** represent significance at 10, 5, and 1 percent, respectively. P-values are shown in brackets. The null hypothesis for the
Hausman test is that the difference in coefficients between fixed effects and random effects specifications is not systematic. Thus a small p-
value (<0.05) suggests the rejection of the random effects specification.
Source: Authors’ calculation.
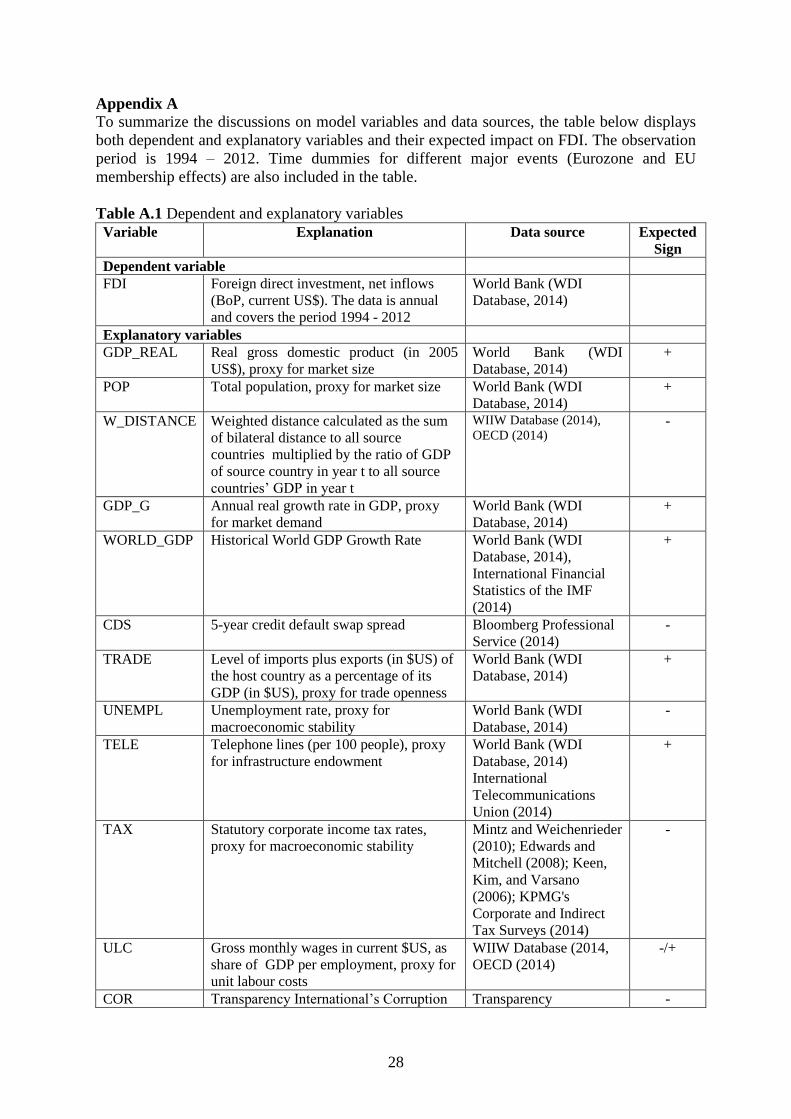
28
Appendix A
To summarize the discussions on model variables and data sources, the table below displays
both dependent and explanatory variables and their expected impact on FDI. The observation
period is 1994 – 2012. Time dummies for different major events (Eurozone and EU
membership effects) are also included in the table.
Table A.1 Dependent and explanatory variables
Variable Explanation Data source Expected
Sign
Dependent variable
FDI Foreign direct investment, net inflows
(BoP, current US$). The data is annual
and covers the period 1994 - 2012
World Bank (WDI
Database, 2014)
Explanatory variables
GDP_REAL Real gross domestic product (in 2005
US$), proxy for market size
World Bank (WDI
Database, 2014)
+
POP Total population, proxy for market size World Bank (WDI
Database, 2014)
+
W_DISTANCE Weighted distance calculated as the sum
of bilateral distance to all source
countries multiplied by the ratio of GDP
of source country in year t to all source
countries’ GDP in year t
WIIW Database (2014),
OECD (2014) -
GDP_G Annual real growth rate in GDP, proxy
for market demand
World Bank (WDI
Database, 2014)
+
WORLD_GDP Historical World GDP Growth Rate World Bank (WDI
Database, 2014),
International Financial
Statistics of the IMF
(2014)
+
CDS 5-year credit default swap spread Bloomberg Professional
Service (2014)
-
TRADE Level of imports plus exports (in $US) of
the host country as a percentage of its
GDP (in $US), proxy for trade openness
World Bank (WDI
Database, 2014)
+
UNEMPL Unemployment rate, proxy for
macroeconomic stability
World Bank (WDI
Database, 2014)
-
TELE Telephone lines (per 100 people), proxy
for infrastructure endowment
World Bank (WDI
Database, 2014)
International
Telecommunications
Union (2014)
+
TAX Statutory corporate income tax rates,
proxy for macroeconomic stability
Mintz and Weichenrieder
(2010); Edwards and
Mitchell (2008); Keen,
Kim, and Varsano
(2006); KPMG's
Corporate and Indirect
Tax Surveys (2014)
-
ULC Gross monthly wages in current $US, as
share of GDP per employment, proxy for
unit labour costs
WIIW Database (2014,
OECD (2014)
-/+
COR Transparency International’s Corruption Transparency -

29
Perceptions Index (TI), on a continuous
scale from 0 (squeaky clean) to 10
(highly corrupt), proxy for institutional
risk
International Annual
Reports, 1995-2012
CR_RISK Moody’s Sovereign Credit Rating, on a
continuous scale from 0 (the lowest
possible rating) to 20 (maximum
creditworthiness), proxy for political risk
Moody’s (2014) +
INSTIT First principal component of Control of
Corruption, Political Stability,
Government Effectiveness, Regulatory
Quality, Rule of Law, and Voice and
Accountability.
Worldwide Governance
Indicators (WGI)
+
NAT_RES First principal component of Gross Fixed
Capital Formation, Gross Domestic
Product, Gross Domestic Product per
Capita, Gross Domestic Savings and
Total Natural Resources Rents
World Bank (WDI
Database, 2014)
+
TIME Temporal (year) dummy A dummy used to control
for different time periods
or announcement effects
+
Source: Authors’ calculation.

30
Appendix B
In order to summarize the information contained in many socio-economic factors we use
principal component analysis (PCA). This permits the reduction of the number of variables
used in the estimation and yet still retains a substantial part of the information contained. We
perform PCA using the World Bank’s Worldwide Governance Indicators (WGI) and several
other variables used as proxies for natural resources availability following Sinha (2012). We
estimate the first principal component using the component variables listed below and create
two new independent variables - INSTIT and NAT_RES. The former is a proxy for the
overall institutional quality in a host country and the latter is a proxy for the availability of
natural resources and the ability of the country to process these resources using technology
and skill.
Table B.1 Component variables of INSTIT and NAT_RES
Component Definition Expected
effect
INSTIT
Control of Corruption Reflects perceptions of the extent to which
public power is exercised for private gain,
including both petty and grand forms of
corruption, as well as "capture" of the state
by elites and private interests.
+
Political Stability Reflects perceptions of the likelihood that the
government will be destabilized or
overthrown by unconstitutional or violent
means, including politically-motivated
violence and terrorism.
+
Government Effectiveness Reflects perceptions of the quality of public
services, the quality of the civil service and
the degree of its independence from political
pressures, the quality of policy formulation
and implementation, and the credibility of
the government's commitment to such
policies.
+
Regulatory Quality Reflects perceptions of the ability of the
government to formulate and implement
sound policies and regulations that permit
and promote private sector development.
+
Rule of Law Reflects perceptions of the extent to which
agents have confidence in and abide by the
rules of society, and in particular the quality
of contract enforcement, property rights, the
police, and the courts, as well as the
likelihood of crime and violence.
+
Voice and Accountability Reflects perceptions of the extent to which a
country's citizens are able to participate in
selecting their government, as well as
freedom of expression, freedom of
association, and a free media.
+
NAT_RES
Gross Fixed Capital
Formation
Gross fixed capital formation (formerly gross
domestic fixed investment) includes land
improvements (fences, ditches, drains, and so
+
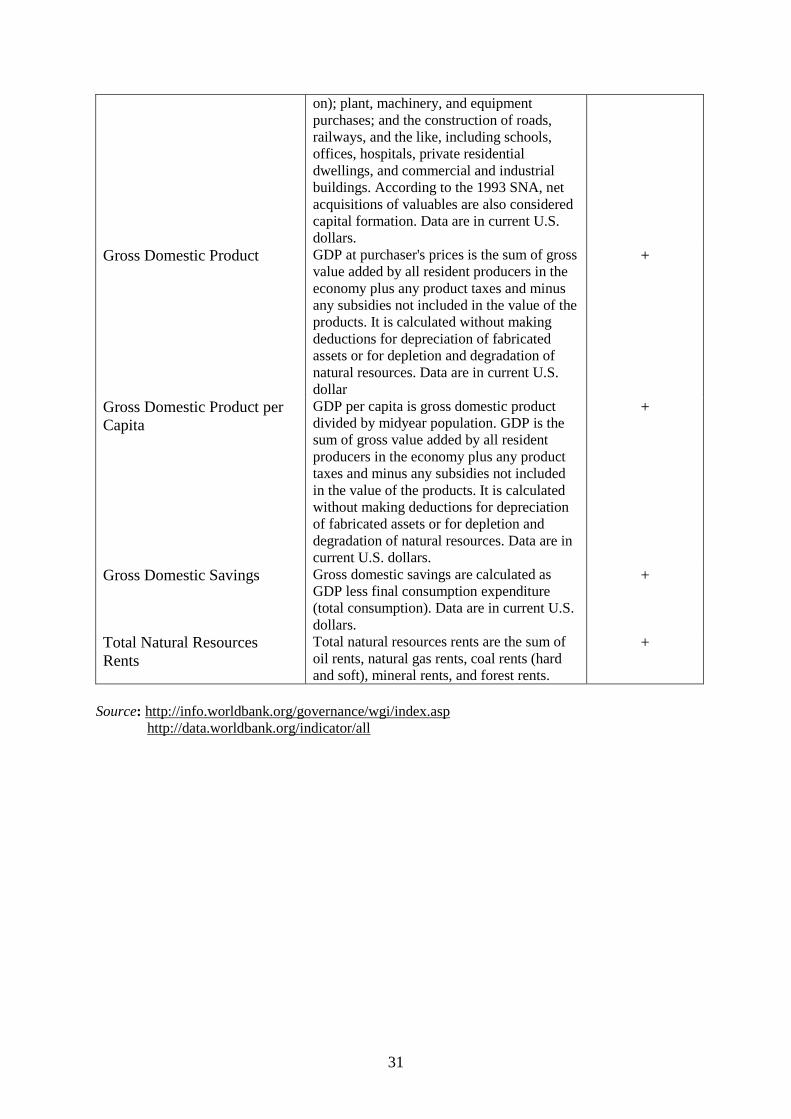
31
on); plant, machinery, and equipment
purchases; and the construction of roads,
railways, and the like, including schools,
offices, hospitals, private residential
dwellings, and commercial and industrial
buildings. According to the 1993 SNA, net
acquisitions of valuables are also considered
capital formation. Data are in current U.S.
dollars.
Gross Domestic Product GDP at purchaser's prices is the sum of gross
value added by all resident producers in the
economy plus any product taxes and minus
any subsidies not included in the value of the
products. It is calculated without making
deductions for depreciation of fabricated
assets or for depletion and degradation of
natural resources. Data are in current U.S.
dollar
+
Gross Domestic Product per
Capita
GDP per capita is gross domestic product
divided by midyear population. GDP is the
sum of gross value added by all resident
producers in the economy plus any product
taxes and minus any subsidies not included
in the value of the products. It is calculated
without making deductions for depreciation
of fabricated assets or for depletion and
degradation of natural resources. Data are in
current U.S. dollars.
+
Gross Domestic Savings Gross domestic savings are calculated as
GDP less final consumption expenditure
(total consumption). Data are in current U.S.
dollars.
+
Total Natural Resources
Rents
Total natural resources rents are the sum of
oil rents, natural gas rents, coal rents (hard
and soft), mineral rents, and forest rents.
+
Source: http://info.worldbank.org/governance/wgi/index.asp
http://data.worldbank.org/indicator/all

32
Appendix C To study FDI dominance among the countries in our sample we compute the Index of Rank
Dominance (IRD) as outlined in Bhanu Murthy (2011). Based on this index we separate the
total sample into two sub-samples: Top 10 performers and others. The IRD is a measure of
continuous dominance by ranks and is computed in the following way:
Eq. (A.1)
YearsOfNoScoreRankMaximum
ScoreRank
I i
i
RD.
)(2012
1994
,
where:
IRD is the Index of Rank Dominance;
Rank Score is 26, 25, 24, .., 2, 1 (in decreasing order of rank);
No. Of Years is 19.
We also present the Relative Index of Rank Dominance (RIRD) which provides a measure
for relative dominance and is computed as:
Eq. (A.2)
26
1i
RD
RD
I
IRIRD i
Table C.1 Index of Rank Dominance of FDI Inflows for the sample of 26 EU countries
during the period 1994-2012
Rank Country Score IRD RIRD 1 United Kingdom 468 0.9853 0.0530
2 Luxembourg 456 0.9589 0.0516
3 France 445 0.9358 0.0503
4 Spain 390 0.8924 0.0480
5 Belgium 415 0.8737 0.0470
6 Germany 395 0.8662 0.0466
7 Poland 305 0.8449 0.0454
8 Italy 317 0.8342 0.0449
9 Netherlands 366 0.8026 0.0432
10 Sweden 338 0.7735 0.0416
11 Czech Republic 244 0.7625 0.0410
12 Portugal 221 0.7270 0.0391
13 Latvia 80 0.7018 0.0377
14 Ireland 267 0.6679 0.0359
15 Denmark 226 0.6608 0.0355
16 Finland 213 0.6594 0.0355
17 Hungary 260 0.6516 0.0350
18 Greece 141 0.6184 0.0333
19 Austria 259 0.6184 0.0333
20 Croatia 139 0.6096 0.0328

33
21 Romania 196 0.6068 0.0326
22 Slovak Republic 137 0.6009 0.0323
23 Lithuania 79 0.5197 0.0279
24 Bulgaria 157 0.5164 0.0278
25 Estonia 94 0.4947 0.0266
26 Slovenia 63 0.4145 0.0223
Source: Authors’ calculation
34
REFERENCES
Albulesku, C.T., Briciu, L. and Coroiu, S.I., 2010. Determinants of foreign direct investment
in CEECs: the role of financial stability, Scientific Annals of the “Alexandru Ioan Cuza”
University of Iasi, Economic Sciences Section, Special Issue, pp. 85-96.
Alfaro L., Chanda A., Kalemli-Ozcan S. and Sayek S., 2006. How does foreign direct
investment promote economic growth? Exploring the effects of financial markets on
linkages. NBER Working Paper, No. 12522, National Bureau of Economic Research
(NBER), Cambridge, USA.
Altomonte, C., 1998. FDI in the CEEC’s and the theory of real options: an empirical
assessment. Discussion Paper, No.7698, LICOS Centre for Institutions and Economic
Performance, K.U.Leuven, Belgium.
Altomonte C. and Guagliano C., 2003. Comparative study of FDI in Central and Eastern
Europe and the Mediterranean. Journal of Economic Systems, 27(2), pp. 223-246.
Aubin, C., Berdot, J.P., Goyeau, D. and Leonard, J., 2006. Investissements directs américains
et européens dans les PECOs: Quel rôle des effets de change? Revue économique, 57(4),
pp. 771-792.
Bellak, C., Leibrecht, M. and Riedl, A., 2008. Labour costs and FDI flows into Central and
Eastern European Countries: a survey of the literature and empirical evidence. Structural
Change and Economic Dynamics, 19, pp. 17–37.
Bellak, C. and Leibrecht, M. 2009. Do low corporate income tax rates attract FDI? Evidence
from Eight Central- and East European Countries. Applied Economics, 41(21), pp. 2691-
2703.
Bellak, C., Leibrecht, M. and Damijan, J.P., 2009. Infrastructure endowment and corporate
income taxes as determinants of foreign direct investment in Central and Eastern European
Countries. World Economy, 32(2), pp. 267-290.
Benacek, V., Gronicki, M., Holland, D. and Sass, M., 2000. The determinants and impact of
foreign direct investment in Central and Eastern Europe: a comparison of survey and
econometric evidence, Transnational Corporations. Journal of United Nations, 9(3), pp.
163-212
Bevan, A.A. and Estrin, S., 2000. The determinants of foreign direct investment in transition
economies. WDI Working Paper, No.342, William Davidson Institute, University of
Michigan, Michigan, USA.
Bevan, A.A. and Estrin, S., 2004. The determinants of foreign direct investment into
European transition economies. Journal of Comparative Economics, 32, pp. 775–787.
Bhanu Murthy, K.V., 2011. State of environment in South Asia. In: R. Jha, eds. Handbook of
South Asian Economics. London: Routledge.
Blomstrom M. and Kokko, A., 1998. Multinational corporations and spillovers. Journal of
Economic Surveys, 12(3), pp. 247-277.
Blonigen, B.A. (2005). A review of the empirical literature on FDI determinants. Working
Paper No. 11299, National Bureau of Economic Research (NBER), Cambridge,
Massachusetts, United States.
Bos, J.W.B. and Van de Laar, M., 2004. Explaining foreign direct investment in Central and
Eastern Europe: an extended gravity approach. DNB Working Paper, No.008, Research
Department, Central Bank, Amsterdam, the Netherlands.
Botrić, V. and Škuflić, L., 2006. Main determinants of foreign direct investment in the
Ssoutheast European countries. Transition Studies Review, 13(2), pp. 359-377.
Boudier-Bensebaa, F., 2005. Agglomeration economies and location choice: foreign direct
investment in Hungary. Economics of Transition, 13, pp. 605–628.
Buch, C., Kleinert, J. and Toubal, F., 2004. The distance puzzle: on the interpretation of the
distance coefficient in gravity equations. Economics Letters, 83(3), pp. 293-98.

35
Buch, C., Kleinert, J., Lipponer, A. and Toubal, F., 2005. Determinants and effects of foreign
direct investment: evidence from German firm-level data. Economic Policy, 20(41), pp. 52-
110.
Calderón, C. and Servén, L., 2004. The effects of infrastructure development on growth and
income distribution. Working Paper, No 173, Econometric Society, Latin American
Meetings [Available at http://ideas.repec.org/p/ecm/latm04/173.html].
Campos, N.F. and Kinoshita, Y., 2003. Why does FDI go where it goes? New evidence from
transition economies. IMF Working Paper, No. 03/228, International Monetary Fund,
Washington, USA.
Carr, D.L., Marakusen, J. R. and Maskus, K. E., 1998. Estimating the knowledge capital
model of the multinational enterprise. NBER Working Paper, No 6773, National Bureau of
Economic Research, Cambridge, USA.
Carstensen, K. and Toubal, F., 2004. Foreign direct investment in Central and Eastern
European countries: a dynamic panel analysis. Journal of Comparative Economics, 32(1),
pp. 3–22.
Deichmann, J.I., 2001. Distribution of foreign direct investment among transition economies
in Central and Eastern Europe. Post-Soviet Geography and Economics, 42(2), pp. 142–152.
Demekas, D.G., Horváth, B., Ribakova, E. and Wu Yi, 2005. Foreign direct investment in
Southeastern Europe: how (and how much) can policies help? IMF Working Paper, No.
05/110, European Department, International Monetary Fund, Washington, USA.
Demekas, D.G., Horváth, B., Ribakova, E. and Wu Yi, 2007. Foreign direct investment in
European transition economies: the role of policies. Journal of Comparative Economics,
35(2), pp. 369-386.
De Mooij, R. and Ederveen, S., 2008. Corporate tax elasticities: a reader's guide to empirical
findings. Oxford Review of Economic Policy, 24(4), pp. 680-697.
Devereux, M. (2004). Measuring taxes on income from capital, In: B. Sorensen, eds.
Measuring the tax burden on capital and labour. Cambridge: MIT Press, pp.35-71.
Dunning, J.H., 1988. Explaining International Production. London: Unwin Hyman.
Dunning, J.H., 1992. Multinational Enterprises and the Global Economy. London: Addison
Welsey.
Dunning, J.H., 2002. Determinants of foreign direct investment: globalization-induced
changes and the role of FDI policies. Proceedings of the 5th
Annual World Bank
Conference on Development Economics - Europe, Paris, France, May 15–16.
Dupuch, S. and Milan, C., 2003. Les déterminants des investissements directs européens dans
les PECO. Working Paper, No 2003/07, Centre d'Economie de l'université Paris Nord,
Paris, France.
Edwards, C. and Mitchell, D.J., 2008. Global tax revolution: the rise of tax competition and
the battle to defend it. Kindle Edition: Kindle eBook [online] Available at
http://www.amazon.co.uk/Global-Tax-Revolution-Competition-Battle-
ebook/dp/B004YW6LZI#reader_B004YW6LZI.
Falk, M. and Hake, M., 2008. A panel data analysis on FDI and exports, FIW Research
Report, No 012, Austrian Institute of Economic Research, Vienna, Austria.
Goodspeed, T., Martinez-Vazquez, J. and Zhang, L., 2006. Are other government policies
more important than taxation in attracting FDI? Working Paper Series, No 06-28, Andrew
Young School of Policy Studies, Georgia State University, USA.
Goodspeed, T., Martinez-Vazquez, J. and Zhang, L., 2010. Public policies and FDI location:
differences between developing and developed countries. Working paper, No. 1001,
International Studies Program, Andrew Young School of Policy Studies, Georgia State
University, USA.

36
Gorg, H. and Strobl, E., 2002. Multinational companies and indigenous development: an
empirical analysis. European Economic Review, 46, pp. 1305-1322.
Hansson, A. and Olofsdotter, K., 2010. Tax differences and foreign direct investment in the
EU 27. Working Paper, No. 2010/3, Department of Economics, Lund University, Sweden.
Haskel, J. E., Pereira, S. C. and Slaughter, M. J., 2002. Does inward foreign direct investment
boost the productivity of domestic firms? NBER Working Paper, No. 8724, National
Bureau of Economic Research, Cambridge, USA.
Hausman, J. A., 1978. Specification tests in econometrics. Econometrica, 46, pp. 1251–1271.
Henriot, A., 2005. L’investissement direct dans une Europe élargie, Universidad
Complutense de Madrid. Papeles del Este, Vol. 10.
Holland, D. and Pain, N., 1998. The determinants and impact of foreign direct investment in
the transition economies: a panel data analysis, In: V. Edwards, eds. Convergence or
Divergence: Aspirations and Reality in Central and Eastern Europe and Russia,
Proceedings of 4th Annual conference, Centre for Research into East European Business,
University of Buckingham.
Janicki, H. and Wunnava, P., 2004. Determinants of foreign direct investment: empirical
evidence from EU accession candidates. Applied Economics, 36(5), pp. 505–509.
Johansson, B., and Westin, L., 1994. Affinities and frictions of trade networks. The Annals of
Regional Science, 28(3), pp. 243-261.
Johnson, A., 2006. FDI inflows to the transition economies in Eastern Europe: magnitude and
determinants. CESSI Working Paper, No. 59, Centre of Excellence for Studies in Science
and Innovation, The Royal Institute of Technology, Stockholm, Sweden.
Jun, K. W. and Singh, H., 1996. The determinants of foreign direct investment in developing
countries. Transnational Corporations, 5, pp. 67-105.
Keen, M., Kim, Y. K. and Varsano, R., 2006. The "flat tax(es)": principles and evidence. IMF
Working Paper, No 06/218, International Monetary Fund, Washington, USA.
Kumar, N., 2006. Infrastructure availability, FDI inflows and their export-orientation: a
cross-country exploration. India Economic Journal, 54(1), pp. 125-140.
Leibrecht, M. and Riedl, A., 2010. Taxes and infrastructure as determinants of foreign direct
investment in Central and Eastern European Countries revisited: New evidence from a
spatially augmented gravity model. WU Discussion Papers, No 42, WU Vienna University
of Economics and Business, Vienna, Austria.
LeSage, J. and Pace, K., 2008. Spatial econometric modeling of origin-destination flows.
Journal of Regional Science, 4 (5), pp. 941-967.
Lucas, R., 1993. On the Determinants of direct foreign investment: evidence from East and
Southeast Asia. World Development, 21(3), pp. 391-406. Marakusen, J. R., Konan, D. E., Venables, A. J. and Zhang, K. H., 1996. A unified treatment of
horizontal direct investment: vertical direct investment and the pattern of trade in goods and
services. NBER Working Paper, No 5696, National Bureau of Economic Research, Cambridge,
USA.
Mariotti, S., Mutinelli, M. and Piscitello, L., 2003. Home country employment and foreign
direct investment: evidence from the Italian case. Cambridge Journal of Economics, 27 (3),
pp. 419-431.
Markusen, J.R. and Maskus, K.E., 2002. Discriminating among alternative theories of the
multinational enterprise. Review of International Economics, 10, pp. 694–707.
Mateev, M., 2012. Country risk and foreign direct investment in transition economies: a
panel data analysis. International Journal of Management Accounting Research, 2(1), pp. 1-
30.
Mintz, J.M. and Weichenrieder, A.J., 2010. The indirect side of direct investment:
multinational company finance and taxation. CESifo Book Series, Cambridge: MIT Press.

37
Nonnemberg, M.B. and Cardoso de Mendonça, M.J., 2004. The determinants of foreign
direct investment in developing countries. Discussion Paper, No 061, Proceedings of the
32th
Brazilian Economics Meeting, Brazilian Association of Graduate Programs in
Economics, São Paulo, Brazil.
Nunnenkamp, P., 2002. Determinants of FDI in developing countries: Has globalization
changed the rules of the game? Working Paper, No 1122, Kiel Institute for the World
Economics, Kiel, Germany.
Pournarakis, M. and Varsakelis, N.C., 2004. Institutions, internationalization and FDI: the
case of economies in transition. Transnational Corporations, 13(2), pp. 77–94.
PricewaterhouseCoopers, 2010. Foreign direct investment in Central and Eastern Europe: a
case of boom or bust? Economic View, March, pp. 1-10.
Schoors, K. and Van der Tol, B., 2002. Foreign direct investment spillovers within and
between sectors: Evidence from Hungarian data. Working Paper, No. 02/157, Faculty of
Economics and Business Administration, Ghent University, Belgium
Sinha, M. K., 2012. Patterns of foreign direct investment flows and economic development; a
cross-country analysis. Ph.D. Thesis, Delhi School of Economics, University of Delhi,
India.
Singh, H. and Jun, K.W., 1996. The Determinants of foreign direct investment: new empirical
evidence. Transnational Corporations, 5(2), pp. 67-106.
Smarzynska, B.K. and Wei, S.-J., 2000. Corruption and composition of foreign direct
investment: firm-level evidence. Policy Research Working Paper Series, No 2360, World
Bank, Washington, USA.
Stoian, C. and Filippaios, F., 2007. Foreign direct investment in Central, Eastern and South
Eastern Europe: an ‘eclectic’ approach to Greek investments. International Journal of
Entrepreneurship and Innovation Management, 8(5), pp. 542-564.
Stoian, C.R. and Vickerman, R., 2005. The interplay between security factors, European
integration and security in Central and Eastern Europe, Academy of International Business,
Annual Meeting, Quebec, Canada, [online] Available at
http://www.econstor.eu/bitstream/10419/68109/1/507654560.pdf.
Suder, K.J. and Sohn, Chan-Hyun, 2010. FDI in Central and Eastern European countries:
impacts to neighbors and regional agglomeration effect, Draft Paper, Department of
International Trade and Business, Kangwon National University, Chuncheon, Korea,
[online] Available at http://www.apeaweb.org/confer/bus11/papers/Sohn-Suder.pdf.
Torlak, E., 2004. Foreign direct investment, technology transfer and productivity growth in
transition countries: empirical evidence from panel data1, Discussion Paper, No 26, Center
of Globalization and Europeanization of the Economy, Georg-August-Universität
Göttingen, Germany [online] Available at
http://www.econstor.eu/bitstream/10419/22153/1/Torlak_26.pdf.
Vavilov, S., 2005. Foreign direct investment in transition economies: evidence from energy
industry. PhD. Thesis, Department of Economics, University of Paris I Pantheon-Sorbonne,
Paris, France.
Bloomberg, 2014. Bloomberg Professional Service. Available at https://bba.bloomberg.net/
[accessed March 7, 2014]. Ernst & Young, 2013. Ernst & Young’s attractiveness survey, Europe 2013 [pdf] Available at
http://www.eyeim.com/pdf/E&Y%20European%20Attractiveness%20Survey%202013.pdf [accessed March 22, 2014].
EBRD, 2004. Transition report 2004: infrastructure, European Bank for Reconstruction and
Development, London, UK [pdf] Available at
http://www.ebrd.com/pages/research/publications/flagships/transition.shtml [accessed
February 16, 2014].

38
IMF, 2014. IMF International Financial Statistics. Available at
http://elibrary-data.imf.org/FindDataReports.aspx?d=33061&e=169393 [accessed April 15,
2014]. International Telecommunications Union, 2014. ICT Data and Statistics [pdf] Available at
http://www.itu.int/en/Pages/default.aspx [accessed February 12, 2014]. KPMG, 2014. KPMG's Corporate and Indirect Tax Surveys [pdf] Available at
http://www.kpmg.com/Global/en/services/Tax/tax-tools-and-resources/Pages/corporate-tax-
rates-table.aspx [accessed March 6, 2014]. Moody’s, 2014. Moody’s Sovereign Credit Ratings [pdf] Available at
http://www.moodys.com [accessed February 10, 2014].. OECD, 2014. OECD Database. Available at http://www.oecd.org/statistics/ [accessed March
8, 2014]. Transparency International, 2014. TI Annual reports (1995-2012) [pdf] Available at
http://www.transparency.org/whatwedo/publications/doc/ar/ [accessed March 16, 2014]. Vienna Institute for International Economic Studies, 2014. WIIW database on Foreign Direct
Investment in Central, East and Southeast Europe. Available at
http://www.wsr.ac.at/%28en%29/index.html [accessed March 18, 2014]. World Bank, 2014. Worldwide Governance Indicators. Available at
http://info.worldbank.org/governance/wgi/ [accessed March 8, 2014]. World Bank, 2014. World Development Indicators Database. Available at
http://databank.worldbank.org/ddp/home.do [accessed March 15, 2014].