Embed Size (px)
Citation preview

© 2002 Blackwell Science Ltd. http://www.blackwell-science.com/geb
RESEARCH LETTER
Global Ecology & Biogeography
(2002)
11
, 71–78
Blackwell Science Ltd
Are there fine-scale spatial patterns in community similarity among temporary freshwater pools?
MATTHEW SPENCER
1
, STEVEN S. SCHWARTZ
2
and LEON BLAUSTEIN
Community Ecology Laboratory, Institute of Evolution, University of Haifa, Haifa 31905, Israel
ABSTRACT
One expects greater similarity between communities that areclose together in space than between communities that arewidely separated. This may be due to similarity in environ-mental conditions, short-range dispersal, or both processestogether. We examined whether these mechanisms wereimportant in determining the invertebrate communities in aset of temporary freshwater rockpools within an area of800 m
2
. Adjacent pools tended to share similar environmentalcharacteristics (conductivity, pH, presence of predatory
Salamandra salamandra
L. larvae and amount of shade).Community dissimilarity was not strongly related to inter-pool distance. Environmental variables did not explain asignificant amount of variation in community dissimilarity,although differences in pH and depth were the best predictorsof community dissimilarity. We conclude that dispersal is notlimiting in our study system.
Key words
Community structure, dispersal, freshwaterinvertebrates, Israel, Mantel tests, spatial pattern, temporarypools.
INTRODUCTION
Spatial pattern is a theme of increasing interest in populationand community ecology. At the population level, the physicalarrangement of habitat affects the rates of colonization andextinction of individual species (Hanski, 1997) and thespatial synchrony of population densities (Koenig, 1999).These population-level effects influence the developmentof landscape patterns in multi-species communities (Drake
et al.
, 1993). Even such community-level properties as foodweb structure, traditionally thought of as static entities, canbe influenced strongly by landscape-level processes (Kitching& Beaver, 1990). The pervasive influence of natural spatialpatterns means that their causes and consequences must beunderstood by ecologists designing field experiments, evenif spatial pattern is not the focus of the study (Fortin &Gurevitch, 1993).
Much recent work has emphasized dispersal among habitatpatches as a cause of spatial pattern. Intra- and interspecificinteractions such as competition and predation may be
important in generating spatial pattern (de Roos
et al.
, 1991;Hassell
et al.
, 1991; Molofsky, 1994), but require localdispersal in order to operate. However, an important alterna-tive explanation for spatial patterns is spatial pattern inenvironmental conditions. For example, communities that arephysically close together may be similar either because theyare linked by dispersal, or because they share similar environ-mental conditions, or because both processes are important.Separating the contributions of dispersal and environmentalconditions to spatial patterns is necessary for a mechanisticunderstanding of the development of landscapes (Borcard
et al.
, 1992). If similarity in environmental conditions alone isimportant, we would expect any relationship between spatialseparation and community similarity to disappear once theeffects of spatial separation on environmental similarity aretaken into account. If local dispersal (alone or in conjunc-tion with intra- or interspecific interactions) is important butenvironmental similarity is unimportant, we would expect anyrelationship between spatial separation and community sim-ilarity to be independent of environmental similarity. On theother hand, if there is a relationship between spatial separa-tion and community similarity that cannot be accounted forby similarity in measured environmental variables, we mightattribute the residual spatial pattern either to local dispersalor to unmeasured environmental variables (assuming that thereis no mechanism other than dispersal by which communities
1
Present address and correspondence: Department of Biochemis-try, University of Cambridge, Tennis Court Road, Cambridge, CB21QW, UK. E-mail: [email protected]
2
Present address: Department of Zoology, 430 Life Sciences West,Oklahoma State University, Stillwater, OK 74078–3052, USA.
GEB_266.fm Page 71 Friday, January 18, 2002 8:54 AM

72
M. Spencer
et al.
© 2002 Blackwell Science Ltd,
Global Ecology & Biogeography
,
11
, 71–78
can influence each other at a distance). Failure to detect anyspatial pattern in community structure does not imply thatthere is no local dispersal or environmental pattern. Forexample, strong priority effects or other community assemblyrules could establish persistent spatial patterns apparentlyunrelated to subsequent dispersal or environmental conditions(Drake
et al.
, 1993). Surveys of natural systems cannot defin-itively distinguish between these possibilities, but they canprovide indirect evidence about the importance of dispersaland environmental patterns. Here, we will examine therelationships between spatial distance (which we assume is apredictor of dispersal rates: Wolfenbarger, 1946, 1975;Maguire, 1963; Turchin, 1998), differences in environmentalconditions and community dissimilarity in a set of temporaryfreshwater pools.
Temporary freshwater pools provide an opportunity toinvestigate spatial patterns in community similarity on a finegeographical scale. The ephemeral nature of the habitatmay increase the importance of dispersal as a determinant ofcommunity structure ( Jeffries, 1989). Many of the inver-tebrates (such as crustaceans and flatworms) inhabitingtemporary pools have relatively limited, passive dispersalabilities (Maguire, 1963; Holland & Jenkins, 1998; Jenkins& Underwood, 1998; Brendonck & Riddoch, 1999). Theprimary dispersal vectors for these species are thought to bewind, rain and animals, although dispersal rates are usuallylow and difficult to measure ( Jenkins & Underwood, 1998;Brendonck & Riddoch, 1999). Environmental conditions mayalso be very different among pools separated by only a fewmetres. Fine-scale spatial pattern in community structuretherefore seems plausible. A variety of methods have beensuggested for partitioning out the environmental componentof spatial pattern in species distributions (Borcard
et al.
, 1992).We use multiple matrix regressions based on Mantel tests(Smouse
et al.
, 1986) to examine the relationship of inverte-brate community dissimilarity to spatial distance and differ-ences in environmental conditions in a set of temporaryfreshwater rockpools in Northern Israel. Mantel tests are oftenused to quantify the relationships among a set of distancematrices (e.g. Sokal
et al.
, 1986; Legendre & Troussellier,1988; Livshits
et al.
, 1991; Fortin & Gurevitch, 1993; Svenning,1999). They allow one to separate the contributions of differ-ent predictor matrices (spatial distance and differences inenvironmental conditions) to the amount of variation in aresponse matrix (community dissimilarity) in a way that isexactly analogous to a standard multiple regression. In ourcase, the distance matrices are spatial distance, differencesin environmental conditions and community dissimilarity.Because two out of our three kinds of data (community dis-similarity and physical distance) are most naturally expressedas distance matrices, the Mantel approach is an appropriatemethod. However, it would also be possible to carry outcanonical ordination on the principal coordinates of the
physical distance matrix and the presence/absence of taxa(Legendre & Anderson, 1999), or use a new direct methodfor partitioning a distance matrix according to a linearmodel (McArdle & Anderson, 2001). We will address threequestions:
1
Do pools that are closer together in space tend to havehigher similarity in environmental conditions than pools thatare farther apart in space?
2
Is there a positive relationship between spatial distance andcommunity dissimilarity among pools on a microgeographicscale?
3
If there is a relationship between spatial distance and com-munity dissimilarity, how much of it can be attributed tohigher similarity in environmental conditions among poolsthat are close together in space?
METHODS
Study site and sampling methods
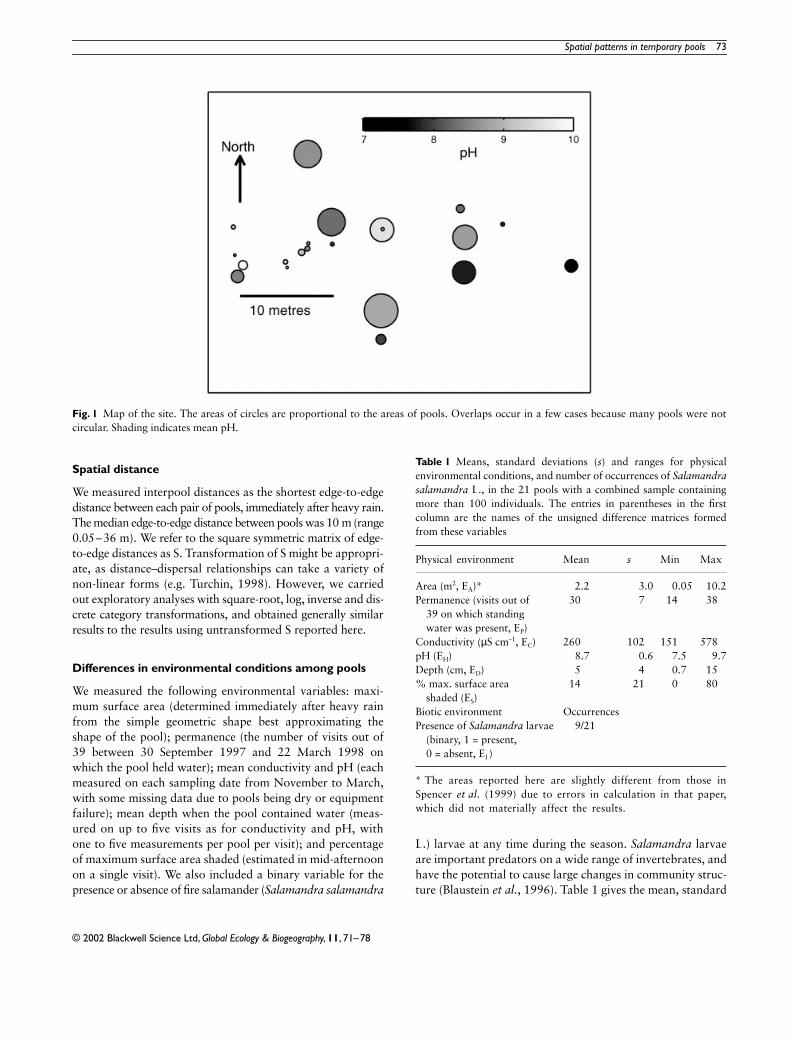
The study site (Fig. 1) consists of a small (approximately40
×
20 m) area of exposed limestone bedrock on the MountCarmel range of northern Israel (32
°
43
′
N, 35
°
2
′
E). The sitecontains many temporary pools, most of which hold waterintermittently during the rainy season from November toMarch, and are usually dry for the rest of the year. The site,sampling methods and community structure are described inmore detail elsewhere (Spencer
et al.
, 1999). We sampled 25pools, selected to cover a wide range of surface areas, includ-ing all pools that held water for at least a week after a singlerainfall event. We sampled the invertebrates in each poolusing net sweeps, with effort proportional to maximumsurface area. We excluded rare species that were sometimesobserved in pools but were not captured in net sweeps, as wedo not have relative abundance estimates for these species(relative abundances are needed to scale the presence–absencesimilarity index we used, as described below). We sampledonce a month from January to March 1998 (we also tooksamples in November and December 1997, but too few poolscontained water in these months to provide useful informa-tion on spatial pattern). We summed the data from these threemonthly samples in order to increase within-pool abundances.We then excluded all pools in which fewer than 100 individualswere sampled, as similarity indices calculated from smallsamples are unreliable (Wolda, 1981). This left a total of 21pools. A rule of thumb is that at least 20 sites are needed todetect spatial pattern using Mantel tests (Fortin & Gurevitch,1993). There were a total of 22 recognizable invertebratetaxa (species or morphologically distinct forms that were notidentified to species level), mainly Crustacea (12 taxa),Turbellaria (three taxa) and Insecta (three taxa). Combinedsamples contained a median of nine taxa (range 4–14) and685 individuals (range 144–9014).
GEB_266.fm Page 72 Friday, January 18, 2002 8:54 AM
Spatial patterns in temporary pools
73
© 2002 Blackwell Science Ltd,
Global Ecology & Biogeography
,
11
, 71–78
Spatial distance
We measured interpool distances as the shortest edge-to-edgedistance between each pair of pools, immediately after heavy rain.The median edge-to-edge distance between pools was 10 m (range0.05–36 m). We refer to the square symmetric matrix of edge-to-edge distances as S. Transformation of S might be appropri-ate, as distance–dispersal relationships can take a variety ofnon-linear forms (e.g. Turchin, 1998). However, we carriedout exploratory analyses with square-root, log, inverse and dis-crete category transformations, and obtained generally similarresults to the results using untransformed S reported here.
Differences in environmental conditions among pools
We measured the following environmental variables: maxi-mum surface area (determined immediately after heavy rainfrom the simple geometric shape best approximating theshape of the pool); permanence (the number of visits out of39 between 30 September 1997 and 22 March 1998 onwhich the pool held water); mean conductivity and pH (eachmeasured on each sampling date from November to March,with some missing data due to pools being dry or equipmentfailure); mean depth when the pool contained water (meas-ured on up to five visits as for conductivity and pH, withone to five measurements per pool per visit); and percentageof maximum surface area shaded (estimated in mid-afternoonon a single visit). We also included a binary variable for thepresence or absence of fire salamander (
Salamandra salamandra
L.) larvae at any time during the season.
Salamandra
larvaeare important predators on a wide range of invertebrates, andhave the potential to cause large changes in community struc-ture (Blaustein
et al.
, 1996). Table 1 gives the mean, standard
Fig. 1 Map of the site. The areas of circles are proportional to the areas of pools. Overlaps occur in a few cases because many pools were notcircular. Shading indicates mean pH.
Table 1 Means, standard deviations (s) and ranges for physicalenvironmental conditions, and number of occurrences of Salamandrasalamandra L., in the 21 pools with a combined sample containingmore than 100 individuals. The entries in parentheses in the firstcolumn are the names of the unsigned difference matrices formedfrom these variables
Physical environment Mean s Min Max
Area (m2, EA)* 2.2 3.0 0.05 10.2Permanence (visits out of
39 on which standing water was present, EP)
30 7 14 38
Conductivity (µS cm–1, EC) 260 102 151 578pH (EH) 8.7 0.6 7.5 9.7Depth (cm, ED) 5 4 0.7 15% max. surface area
shaded (ES)14 21 0 80
Biotic environment OccurrencesPresence of Salamandra larvae
(binary, 1 = present, 0 = absent, EL)
9/21
* The areas reported here are slightly different from those inSpencer et al. (1999) due to errors in calculation in that paper,which did not materially affect the results.
GEB_266.fm Page 73 Friday, January 18, 2002 8:54 AM

74
M. Spencer
et al.
© 2002 Blackwell Science Ltd,
Global Ecology & Biogeography
,
11
, 71–78
deviation and range of each environmental variable (or numberof occurrences for the binary
Salamandra
variable). For eachvariable, we calculated a matrix of unsigned differencesbetween each pair of pools (named as in Table 1). We sub-sequently suspected that the amount of sediment in a poolmight provide a common cause for variation in pH andconductivity. We therefore estimated mean sediment depth ineach pool (mean = 2.8 cm, SD 1.9, range 0.2–6.4) by drivinga 5-mm diameter metal rod down to the rock bed at each offive haphazardly chosen (in the sense of Southwood, 1978,p. 24) locations.
Community dissimilarity
We formed a community dissimilarity matrix D, in which theelement
d
jk
is the complement of the scaled Jaccard similaritybetween pools
j
and
k
. We chose a binary index becausedispersal is more likely to affect the presence or absence ofspecies than their local abundances. We scaled each Jaccardsimilarity to its expected maximum value to correct for differ-ences in sample size and diversity (Wolda, 1981). Weestimated the expected maximum similarity as the expectedsimilarity between a pair of samples of observed size, drawnfrom the combined abundance distribution of the twoobserved samples. In two cases, when the larger of a pair ofsamples was much less even than the smaller, we obtainednegative dissimilarities, which we set to zero (the results weresimilar if we included the negative estimates in the analysis).Other binary similarity indices gave similar results. We alsoinvestigated quantitative similarity using the Morisita index(which is insensitive to sample size: Wolda, 1981), but foundno evidence for spatial patterns (results not reported here).
Relationships between distance matrices
We used Mantel tests to examine the relationships among dis-tance matrices. Smouse
et al
. (1986) show that a Mantel testis equivalent to a standard regression or Pearson correlationamong the off-diagonal elements of a set of distance matrices.For a comparison between a spatial distance matrix and someother variable, the Mantel correlation measures the averagemagnitude of spatial autocorrelation of that variable over theentire study area (Fortin & Gurevitch, 1993, p. 346). Signific-ance tests are carried out by permuting rows and columns ofone of the matrices, to account for dependencies among thedistances (Upton & Fingleton, 1985). We do not need tomake any assumptions about the distribution of the data(thus we can analyse distance matrices derived from binary,proportion or ratio measurements). One possible shortcom-ing is that we are only examining the average magnitude ofspatial autocorrelation using this method. For example, asignificant spatial pattern at a local scale with a contrarypattern at a broader scale would not be detected by a Mantel
correlation. However, we examined scatter plots of all thepairs of distance matrices we analysed, and saw no obviouseffects of this kind. If such effects were present, one couldseparate the data into distance classes and produce Mantelcorrelograms, although these would only be useful with alarger number of pools.
To determine the relationship between spatial distance andsimilarity in environmental conditions (our first question), wecalculated Mantel correlations between the spatial distancematrix S and each of the environmental distance matrices E.The Mantel correlation between S and community dissimilarityD measures the spatial pattern in community similarity (oursecond question). We used the Dunn–Sidák procedure (Sokal& Rohlf, 1995, p. 239) to maintain an experimentwise
α
of0.05 (testwise
α′
= 0.0064) over all eight correlations betweenS and other distance matrices. To determine the extent to whichspatial pattern in community similarity could be explained byenvironmental conditions (our third question), we used themultiple regression extension of the Mantel test (Smouse
et al.
, 1986). We predicted the community dissimilarity matrixD using the set of all environmental matrices E and the spatialdistance matrix S. The resulting partial regression coefficients(partial
β
) measure the effect of each predictor matrix on theresponse matrix, holding all other predictors constant. Thepartial correlation coefficients (partial
r
) measure the strengthof association between a predictor and the response, holdingall other predictors constant. The coefficient of multipledetermination (
R
2
) measures the proportion of variation inthe response matrix explained by the complete model. Weassumed that the correlations among the predictor matrices Eand S were fixed, and assessed statistical significance by per-muting the rows and columns of the D matrix (randomizing therelationships between predictors and response). We examinedthe distributions of randomized partial correlation coeffi-cients to determine whether the observed partial correlationswere stronger than those expected under the hypothesis of notrue association. We also examined the distribution of
R
2
, todetermine whether the overall model explained a higher pro-portion of variation in the D matrix than would be expectedif there was no true relationship. We cannot use statisticsbased on change in
R
2
as tests of significance for individualpredictors, because the absolute
R
2
changes considerablywhen the community dissimilarity matrix D is permuted.However, we do report the
R
2
resulting from deletion of thespatial distance matrix S, as an indication of how much worsea model without S would be. Another measure of the useful-ness of S as a predictor of D is the simple Mantel correlationbetween D and the residuals from a multiple Mantel model,which enables prediction of S using the E matrices.
Throughout the Results section, we comment on the signsand magnitudes of correlation coefficients as well as their statis-tical significance, but we do not base any firm conclusions onnonsignificant correlations.
GEB_266.fm Page 74 Friday, January 18, 2002 8:54 AM

Spatial patterns in temporary pools
75
© 2002 Blackwell Science Ltd,
Global Ecology & Biogeography
,
11
, 71–78
RESULTS
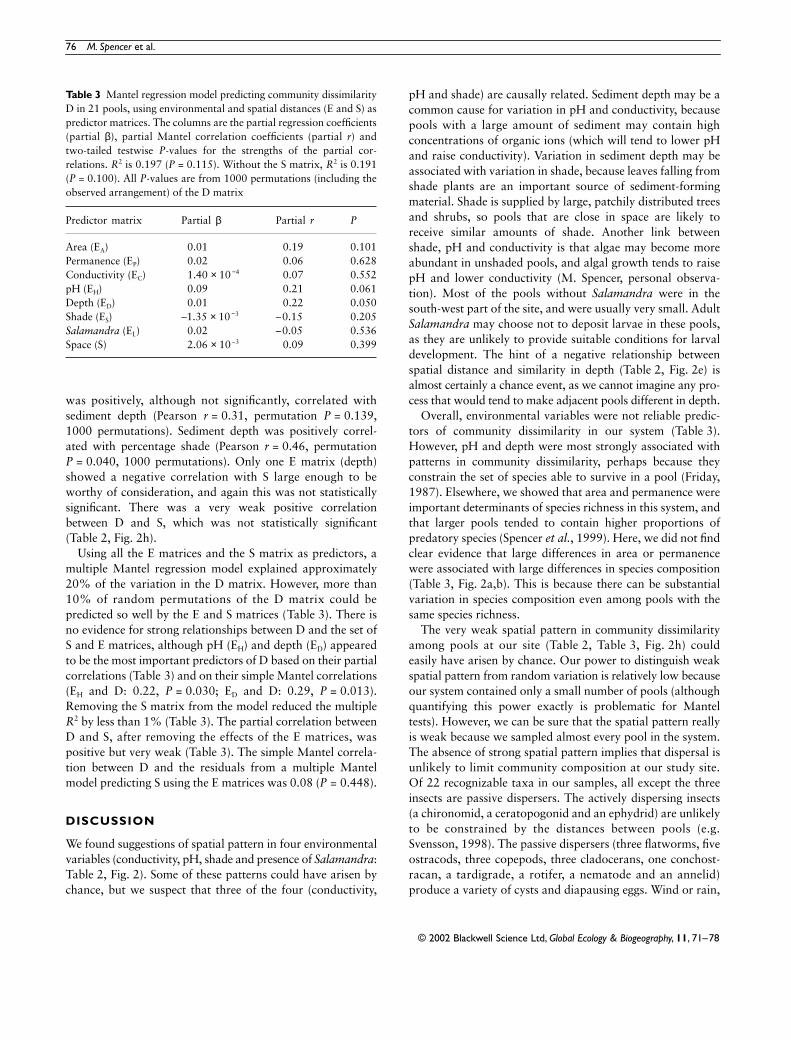
The off-diagonal elements of the community dissimilaritymatrix D had mean 0.48 (standard deviation 0.18, range 0–1, after setting two negative elements (–0.08 and –0.21) tozero). Thus, there was considerable heterogeneity in speciescomposition among the 21 pools, even though all were veryclose together in space. Table 2 lists simple Mantel correla-tions between spatial distance S and differences in environ-mental conditions E, and between S and D (Fig. 2). Four of theE matrices (conductivity, pH, shade, presence of
Salamandra
)had positive correlations with S, but only pH was significantat an experimentwise
α′
of 0.05 (Fig. 2d). We suspect func-tional relationships among pH, conductivity and shade, medi-ated via sediment depth. Examining the raw measurementsrather than their unsigned difference matrices, pH wasnegatively correlated with sediment depth (Pearson
r
= –0.55,permutation
P
= 0.009, 1000 permutations), and conductivity
0
5
10
15
EA
(a)
0
15
30E
P(b)
0
250
500
EC
(c)
0
1
2
3
EH
(d)
0
10
20
ED
(e)
0
50
100
ES
(f)
0 10 20 30 400
0.5
1
EL
S
(g)
0 10 20 30 400
0.5
1
D
S
(h)
Fig. 2 Relationships between the spatial distance matrix S (horizontal axis, shortest edge-to-edge distance in metres) and unsigned differences inenvironmental variables (E), and between S and community dissimilarity (D). Each pool influences the location of many points, because 21 poolsform matrices with 210 different off-diagonal elements. In (a) to (g), vertical axes are unsigned differences in the following variables: (a) maximumsurface area (m2, EA); (b) permanence (visits out of 39 on which a pool held water, EP); (c) mean conductivity (µS cm–1, EC); (d) mean pH (EH);(e) mean depth (cm, ED); (f)% maximum surface area shaded (ES); (g) binary presence (1) or absence (0) of Salamandra salamandra L. at any timeduring the season (EL). In (h), the vertical axis is scaled Jaccard community dissimilarity (D).
Table 2 Mantel correlation coefficients (r) between the spatialdistance matrix S and environmental and community distancematrices (E and D matrices) among 21 pools. P (testwise two-tailedprobability) is the proportion of 1000 randomizations (including theobserved value) in which a Mantel correlation as extreme as theobserved value was obtained. The Dunn–Sidák testwise α′ giving anexperimentwise α of 0.05 with eight comparisons is 0.0064 (Sokal &Rohlf, 1995; p. 239)
Spatial distance (S) with: r P
Area distance (EA) –0.03 0.724Permanence distance (EP) –0.04 0.715Conductivity distance (EC) 0.31 0.025pH distance (EH) 0.37 0.005Depth distance (ED) –0.16 0.086Shade distance (ES) 0.32 0.033Salamandra distance (EL) 0.22 0.017Community dissimilarity (D) 0.09 0.366
GEB_266.fm Page 75 Friday, January 18, 2002 8:54 AM
76
M. Spencer
et al.
© 2002 Blackwell Science Ltd,
Global Ecology & Biogeography
,
11
, 71–78
was positively, although not significantly, correlated withsediment depth (Pearson
r
= 0.31, permutation
P
= 0.139,1000 permutations). Sediment depth was positively correl-ated with percentage shade (Pearson
r
= 0.46, permutation
P
= 0.040, 1000 permutations). Only one E matrix (depth)showed a negative correlation with S large enough to beworthy of consideration, and again this was not statisticallysignificant. There was a very weak positive correlationbetween D and S, which was not statistically significant(Table 2, Fig. 2h).
Using all the E matrices and the S matrix as predictors, amultiple Mantel regression model explained approximately20% of the variation in the D matrix. However, more than10% of random permutations of the D matrix could bepredicted so well by the E and S matrices (Table 3). There isno evidence for strong relationships between D and the set ofS and E matrices, although pH (E
H
) and depth (E
D
) appearedto be the most important predictors of D based on their partialcorrelations (Table 3) and on their simple Mantel correlations(E
H
and D: 0.22,
P
= 0.030; E
D
and D: 0.29,
P
= 0.013).Removing the S matrix from the model reduced the multiple
R
2
by less than 1% (Table 3). The partial correlation betweenD and S, after removing the effects of the E matrices, waspositive but very weak (Table 3). The simple Mantel correla-tion between D and the residuals from a multiple Mantelmodel predicting S using the E matrices was 0.08 (
P
= 0.448).
DISCUSSION
We found suggestions of spatial pattern in four environmentalvariables (conductivity, pH, shade and presence of
Salamandra
:Table 2, Fig. 2). Some of these patterns could have arisen bychance, but we suspect that three of the four (conductivity,
pH and shade) are causally related. Sediment depth may be acommon cause for variation in pH and conductivity, becausepools with a large amount of sediment may contain highconcentrations of organic ions (which will tend to lower pHand raise conductivity). Variation in sediment depth may beassociated with variation in shade, because leaves falling fromshade plants are an important source of sediment-formingmaterial. Shade is supplied by large, patchily distributed treesand shrubs, so pools that are close in space are likely toreceive similar amounts of shade. Another link betweenshade, pH and conductivity is that algae may become moreabundant in unshaded pools, and algal growth tends to raisepH and lower conductivity (M. Spencer, personal observa-tion). Most of the pools without
Salamandra
were in thesouth-west part of the site, and were usually very small. Adult
Salamandra
may choose not to deposit larvae in these pools,as they are unlikely to provide suitable conditions for larvaldevelopment. The hint of a negative relationship betweenspatial distance and similarity in depth (Table 2, Fig. 2e) isalmost certainly a chance event, as we cannot imagine any pro-cess that would tend to make adjacent pools different in depth.
Overall, environmental variables were not reliable predic-tors of community dissimilarity in our system (Table 3).However, pH and depth were most strongly associated withpatterns in community dissimilarity, perhaps because theyconstrain the set of species able to survive in a pool (Friday,1987). Elsewhere, we showed that area and permanence wereimportant determinants of species richness in this system, andthat larger pools tended to contain higher proportions ofpredatory species (Spencer
et al.
, 1999). Here, we did not findclear evidence that large differences in area or permanencewere associated with large differences in species composition(Table 3, Fig. 2a,b). This is because there can be substantialvariation in species composition even among pools with thesame species richness.
The very weak spatial pattern in community dissimilarityamong pools at our site (Table 2, Table 3, Fig. 2h) couldeasily have arisen by chance. Our power to distinguish weakspatial pattern from random variation is relatively low becauseour system contained only a small number of pools (althoughquantifying this power exactly is problematic for Manteltests). However, we can be sure that the spatial pattern reallyis weak because we sampled almost every pool in the system.The absence of strong spatial pattern implies that dispersal isunlikely to limit community composition at our study site.Of 22 recognizable taxa in our samples, all except the threeinsects are passive dispersers. The actively dispersing insects(a chironomid, a ceratopogonid and an ephydrid) are unlikelyto be constrained by the distances between pools (e.g.Svensson, 1998). The passive dispersers (three flatworms, fiveostracods, three copepods, three cladocerans, one conchost-racan, a tardigrade, a rotifer, a nematode and an annelid)produce a variety of cysts and diapausing eggs. Wind or rain,
Table 3 Mantel regression model predicting community dissimilarityD in 21 pools, using environmental and spatial distances (E and S) aspredictor matrices. The columns are the partial regression coefficients(partial β), partial Mantel correlation coefficients (partial r) andtwo-tailed testwise P-values for the strengths of the partial cor-relations. R2 is 0.197 (P = 0.115). Without the S matrix, R2 is 0.191(P = 0.100). All P-values are from 1000 permutations (including theobserved arrangement) of the D matrix
Predictor matrix Partial β Partial r P
Area (EA) 0.01 0.19 0.101Permanence (EP) 0.02 0.06 0.628Conductivity (EC) 1.40 × 10⁻⁴ 0.07 0.552pH (EH) 0.09 0.21 0.061Depth (ED) 0.01 0.22 0.050Shade (ES) –1.35 × 10⁻³ –0.15 0.205Salamandra (EL) 0.02 –0.05 0.536Space (S) 2.06 × 10⁻³ 0.09 0.399
GEB_266.fm Page 76 Friday, January 18, 2002 8:54 AM

Spatial patterns in temporary pools 77
© 2002 Blackwell Science Ltd, Global Ecology & Biogeography, 11, 71–78
floods and animals are usually thought to be the most import-ant dispersal agents for these propagules. The few directattempts to measure dispersal of aquatic organisms by wind orrain suggest that dispersal rates are low (Jenkins & Underwood,1998; Brendonck & Riddoch, 1999; but see Shurin, 2000,p. 3083, for a contrary view), although propagules attachedto insects, mammals or birds may be dispersed at higherrates (Maguire, 1963; but see Jenkins & Underwood, 1998).However, passively dispersing taxa may have very low extinc-tion rates, as their propagules are often resistant to adverseconditions (Hairston, 1996). Furthermore, the rate at whicha species spreads through a system of habitat patches maybe determined mainly by very rare, long-distance dispersalevents that are very difficult to measure (Neubert & Caswell,2000). For example, although we have never observed floodsdeep enough to connect anything other than a few pairs ofvery close pools, only a very low rate of such flooding eventsmight be necessary to spread a species throughout the system.Thus, dispersal might not be limiting even if it occurred at alow average rate in most species. The absence of strong spatialpatterns in community dissimilarity does not necessarilyimply that no individual taxa show any spatial pattern.Furthermore, examining univariate species-environmentrelationships for the dominant taxa could shed light on thedistributions of these species. However, our analyses herewere intended to address the question of community-levelpatterns.
Spatial pattern in community structure appears widespreadfrom very fine to fairly broad spatial scales, in a wide range ofhabitats, and often seems to have causes other than environ-mental variation (Kitching, 1987; Legendre & Troussellier,1988; Borcard et al., 1992; Robertson & Freckman, 1995;Farnsworth & Ellison, 1996; Maynou et al., 1996; Svenning,1999). It is important to establish the extent and causes ofspatial pattern in natural communities for two reasons. First,theories about community structure that are unable toaccount for spatial pattern are clearly failing to capture amajor element of natural ecosystems. Secondly, the presenceof spatial pattern can cause difficulties in the analysis ofobservational and experimental data sets intended to addressother questions (Fortin & Gurevitch, 1993; Legendre, 1993;Thomson et al., 1996). In this light, establishing the condi-tions under which spatial pattern is weak is as importantas establishing that it is sometimes strong. Intra- and inter-specific interactions, in conjunction with local dispersal, areoften suggested as mechanisms by which spatial pattern canbe created (de Roos et al., 1991; Hassell et al., 1991; Molofsky,1994), but can also act to obscure spatial pattern. For example,if a single species of voracious predator is able to eliminatemany of its prey species, increasing local dispersal might havelittle effect on the composition of the community or its sim-ilarity with adjacent sites at which the predator was absent.There is some experimental evidence that pond zooplankton
communities are resistant to invasion because of interactionswith species already present (Shurin, 2000). In general,assembly rules may govern the set of species able to co-existin a community (Weatherby et al., 1998). If these rules involveinitial abundances and invasion sequences (Gilpin et al., 1986;Drake, 1991) as well as local environmental conditions, thencurrent patterns of dispersal and environmental variationmay be of little use in predicting community composition.Determining the assembly rules operating in natural systems,although difficult (Stone et al., 1996), may thus be importantfor understanding spatial pattern in communities (Holt,1997; Holt et al., 1999).
ACKNOWLEDGMENTS
We thank Ina Dukman for assistance with data collection andKoen Martens and Bonnie Azoulay for help with taxonomy.We are grateful to Cheryl Schultz and Louis-Félix Bersier forcritical comments on earlier versions of this manuscript. Thisstudy was supported by United States–Israel BinationalScience Foundation grant no. 95/0035 awarded to L.B. andJoel E. Cohen.
REFERENCES
Blaustein, L., Friedman, J. & Fahima, T. (1996) Larval Salamandradrive temporary pool community dynamics: evidence from anartificial pond experiment. Oikos, 76, 392–402.
Borcard, D., Legendre, P. & Drapeau, P. (1992) Partialling out thespatial component of ecological variation. Ecology, 73, 1045–1055.
Brendonck, L. & Riddoch, B.J. (1999) Wind-borne short-range eggdispersal in anostracans (Crustacea: Branchiopoda). BiologicalJournal of the Linnean Society, 67, 87–95.
Drake, J.A. (1991) Community-assembly mechanics and the struc-ture of an experimental species assembly. American Naturalist,137, 1–26.
Drake, J.A., Flum, T.E., Witteman, G.J., Voskuil, T., Hoylman, A.M.,Creson, C., Kenny, D.A., Huxel, G.R., Larue, C.S. & Duncan, J.R.(1993) The construction and assembly of an ecological landscape.Journal of Animal Ecology, 62, 117–130.
Farnsworth, E.J. & Ellison, A.M. (1996) Scale-dependent spatial andtemporal variability in biogeography of mangrove root epibiontcommunities. Ecological Monographs, 66, 45–66.
Fortin, M.-J. & Gurevitch, J. (1993) Mantel tests: spatial structurein field experiments. Design and analysis of ecological experiments(ed. by S.M. Scheiner and J. Gurevitch), pp. 342–359. Chapman &Hall, New York.
Friday, L.E. (1987) The diversity of macroinvertebrate and macro-phyte communities in ponds. Freshwater Biology, 18, 87–104.
Gilpin, M.E., Carpenter, M.P. & Pomerantz, M.J. (1986) The assemblyof a laboratory community: multispecies competition in Drosophila.Community Ecology (ed. by J. Diamond and T.J. Case), pp. 23–40.Harper & Row, New York.
Hairston, N.G. Jr (1996) Zooplankton egg banks as biotic reservoirsin changing environments. Limnology and Oceanography, 41,1087–1092.
GEB_266.fm Page 77 Friday, January 18, 2002 8:54 AM

78 M. Spencer et al.
© 2002 Blackwell Science Ltd, Global Ecology & Biogeography, 11, 71–78
Hanski, I. (1997) Predictive and practical metapopulation models:the incidence function approach. Spatial ecology (ed. by D. Tilmanand P. Kareiva), pp. 21–45. Princeton University Press, Princeton,New Jersey.
Hassell, M.P., Comins, H.N. & May, R.M. (1991) Spatial structureand chaos in insect population dynamics. Nature, 353, 255–258.
Holland, T.A. & Jenkins, D.G. (1998) Comparison of processesregulating zooplankton assemblages in new freshwater ponds.Hydrobiologia, 387/388, 207–214.
Holt, R.D. (1997) From metapopulation dynamics to communitystructure. Some consequences of spatial heterogeneity. Metapopu-lation biology: ecology, genetics, and evolution (ed. by I.A. Hanskiand M.E. Gilpin), pp. 149–164. Academic Press, San Diego.
Holt, R.D., Lawton, J.H., Polis, G.A. & Martinez, N. (1999) Trophicrank and the species–area relationship. Ecology, 80, 1495–1504.
Jeffries, M. (1989) Measuring Talling’s ‘element of chance in pondpopulations’. Freshwater Biology, 21, 383–393.
Jenkins, D.G. & Underwood, M.O. (1998) Zooplankton may notdisperse readily in wind, rain, or waterfowl. Hydrobiologia, 387/388, 15–21.
Kitching, R.L. (1987) Spatial and temporal variation in food webs inwater-filled treeholes. Oikos, 48, 280–288.
Kitching, R.L. & Beaver, R.A. (1990) Patchiness and communitystructure. Living in a patchy environment (ed. by B. Shorrocksand I.R. Swingland), pp. 147–176. Oxford University Press,Oxford.
Koenig, W.D. (1999) Spatial autocorrelation of ecological phenom-ena. Trends in Ecology and Evolution, 14, 22–26.
Legendre, P. (1993) Spatial autocorrelation: trouble or new para-digm? Ecology, 74, 1659–1673.
Legendre, P. & Anderson, M.J. (1999) Distance-based redundancyanalysis: testing multispecies responses in multifactorial ecologicalexperiments. Ecological Monographs, 69, 1–24.
Legendre, P. & Troussellier, M. (1988) Aquatic heterotrophic bac-teria: modeling in the presence of spatial autocorrelation. Limnologyand Oceanography, 33, 1055–1067.
Livshits, G., Sokal, R.R. & Kobyliansky, E. (1991) Genetic affinitiesof Jewish populations. American Journal of Human Genetics, 49,131–146.
Maguire, B. (1963) The passive dispersal of small aquatic organismsand their colonization of isolated bodies of water. Ecological Mono-graphs, 33, 161–185.
Maynou, F., Conan, G.Y., Cartes, J.E., Company, J.B. & Sardà, F.(1996) Spatial structure and seasonality of decapod crustaceanpopulations on the northwestern Mediterranean slope. Limnologyand Oceanography, 41, 113–125.
McArdle, B.H. & Anderson, M.J. (2001) Fitting multivariate modelsto community data: a comment on distance-based redundancyanalysis. Ecology, 82, 290–297.
Molofsky, J. (1994) Population dynamics and pattern formation intheoretical populations. Ecology, 75, 30–39.
Neubert, M.G. & Caswell, H. (2000) Demography and dispersal:calculation and sensitivity analysis of invasion speed for structuredpopulations. Ecology, 81, 1613–1628.
Robertson, G.P. & Freckman, D.W. (1995) The spatial distributionof nematode trophic groups across a cultivated ecosystem. Ecology,76, 1425–1432.
de Roos, A.M., McCauley, E. & Wilson, W.G. (1991) Mobilityversus density-limited predator-prey dynamics on different spatialscales. Proceedings of the Royal Society of London Series B, 247,117–122.
Shurin, J.B. (2000) Dispersal limitation, invasion resistance, and thestructure of pond zooplankton communities. Ecology, 81, 3074–3086.
Smouse, P.E., Long, J.C. & Sokal, R.R. (1986) Multiple regressionand correlation extensions of the Mantel test of matrix corre-spondence. Systematic Zoology, 35, 627–632.
Sokal, R.R. & Rohlf, F.J. (1995) Biometry. W.H. Freeman, New York.Sokal, R.R., Smouse, P.E. & Neel, J.V. (1986) The genetic structure
of a tribal population, the Yanomama Indians. XV. Patterns inferredby autocorrelation analysis. Genetics, 114, 259–287.
Southwood, T.R.E. (1978) Ecological methods. Chapman & Hall,London.
Spencer, M., Blaustein, L., Schwartz, S.S. & Cohen, J.E. (1999)Species richness and the proportion of predatory animal species intemporary pools: relationships with habitat size and permanence.Ecology Letters, 2, 157–166.
Stone, L., Dayan, T. & Simberloff, D. (1996) Community-wideassembly patterns unmasked: the importance of species’ differinggeographical ranges. American Naturalist, 148, 997–1015.
Svenning, J.-C. (1999) Microhabitat specialization in a species-richpalm community in Amazonian Ecuador. Journal of Ecology, 87,55–65.
Svensson, B.W. (1998) Local dispersal and its life-history con-sequences in a rock pool population of a gyrinid beetle. Oikos, 82,111–122.
Thomson, J.D., Weiblen, G., Thomson, B.A., Alfaro, S. & Legendre, P.(1996) Untangling multiple factors in spatial distributions: lilies,gophers and rocks. Ecology, 77, 1698–1715.
Turchin, P. (1998) Quantitative analysis of movement. Measuringand modeling population redistribution in animals and plants.Sinauer Associates, Sunderland, Massachusetts.
Upton, G. & Fingleton, B. (1985) Spatial data analysis by example.John Wiley & Sons, Chichester.
Weatherby, A.J., Warren, P.H. & Law, R. (1998) Coexistence andcollapse: an experimental investigation of the persistent communitiesof a protist species pool. Journal of Animal Ecology, 67, 554–566.
Wolda, H. (1981) Similarity indices, sample size and diversity.Oecologia, 50, 296–302.
Wolfenbarger, D.O. (1946) Dispersion of small organisms, distancedispersion rates of bacteria, spores, seeds, pollen and insects; incid-ence, rates of diseases and injuries. American Midland Naturalist,35, 1–152.
Wolfenbarger, D.O. (1975) Factors affecting dispersal distances ofsmall organisms. Exposition Press, Hicksville, NY.
BIOSKETCH
Matthew Spencer is interested in population and community ecology, evolution of life histories and phylogenetic analysis of medieval literature.
GEB_266.fm Page 78 Friday, January 18, 2002 8:54 AM