Embed Size (px)
Citation preview

“Are you better off today than you were four years ago?”
• Voters consider, among other factors, state of the economy when voting for president Misery Index = Unemployment Rate
+ Inflation Rate
1960-2008Incumbent party reelected when MI falls (*2000)
Incumbent party voted out when MI rises (except 1972, 2004)
Election Calculator (2012)[Ray Fair]
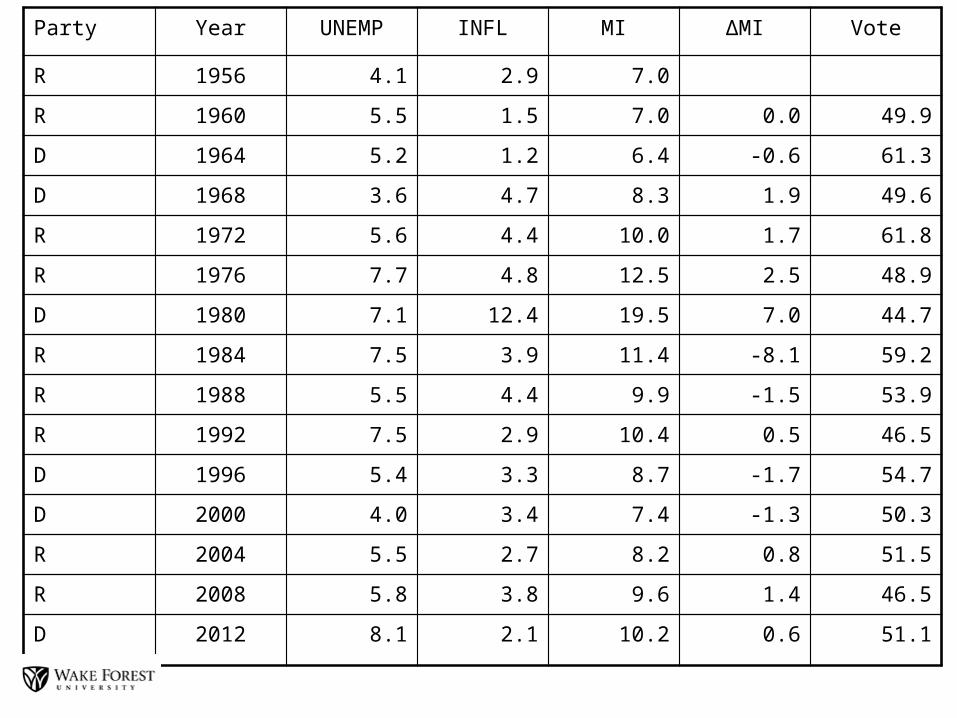
Party Year UNEMP INFL MI ∆MI Vote
R 1956 4.1 2.9 7.0
R 1960 5.5 1.5 7.0 0.0 49.9
D 1964 5.2 1.2 6.4 -0.6 61.3
D 1968 3.6 4.7 8.3 1.9 49.6
R 1972 5.6 4.4 10.0 1.7 61.8
R 1976 7.7 4.8 12.5 2.5 48.9
D 1980 7.1 12.4 19.5 7.0 44.7
R 1984 7.5 3.9 11.4 -8.1 59.2
R 1988 5.5 4.4 9.9 -1.5 53.9
R 1992 7.5 2.9 10.4 0.5 46.5
D 1996 5.4 3.3 8.7 -1.7 54.7
D 2000 4.0 3.4 7.4 -1.3 50.3
R 2004 5.5 2.7 8.2 0.8 51.5
R 2008 5.8 3.8 9.6 1.4 46.5
D 2012 8.1 2.1 10.2 0.6 51.1

Macroeconomic Formulations
• Lucas supply function
Y = YN + a*(Inflation – Expected Inflation), a>0
• Phillips Curve representation
U = UN + b*(Inflation – Expected Inflation), b<0

Unemployment
Inflation
UN
I1
Phillips Curve
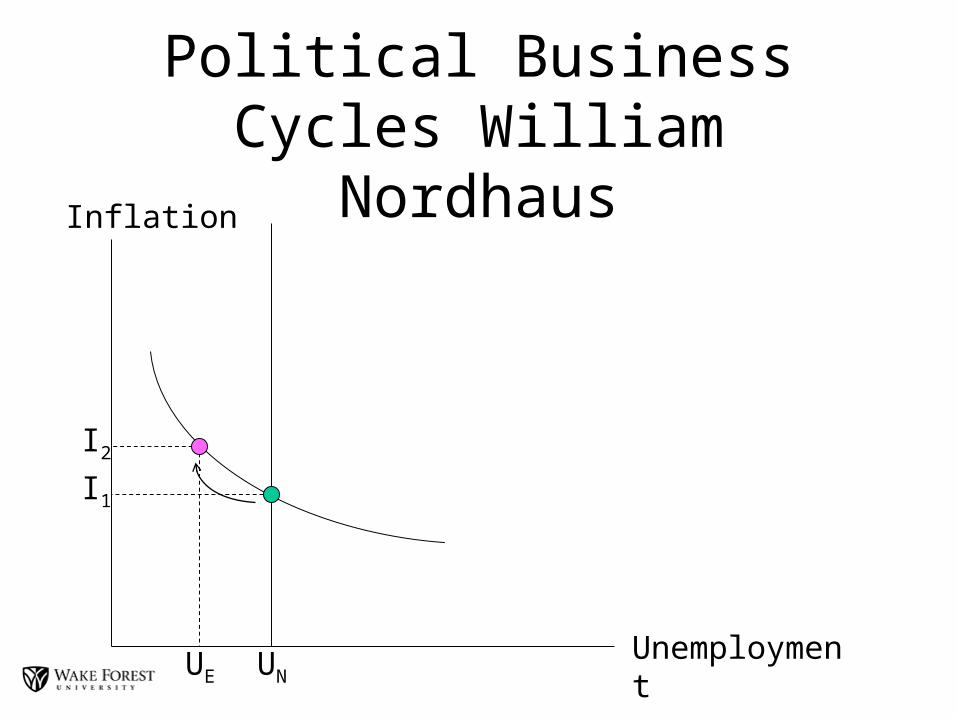
Political Business Cycles William Nordhaus
Unemployment
Inflation
UN
I2
UE
I1

Political Business Cycles William Nordhaus
Unemployment
Inflation
UN
I2
UE
I1

Political Business Cycles William Nordhaus
Unemployment
Inflation
UN
I3
I2
UE
I1

Political Business Cycles William Nordhaus
Unemployment
Inflation
UN
I3
I2
UE
I1

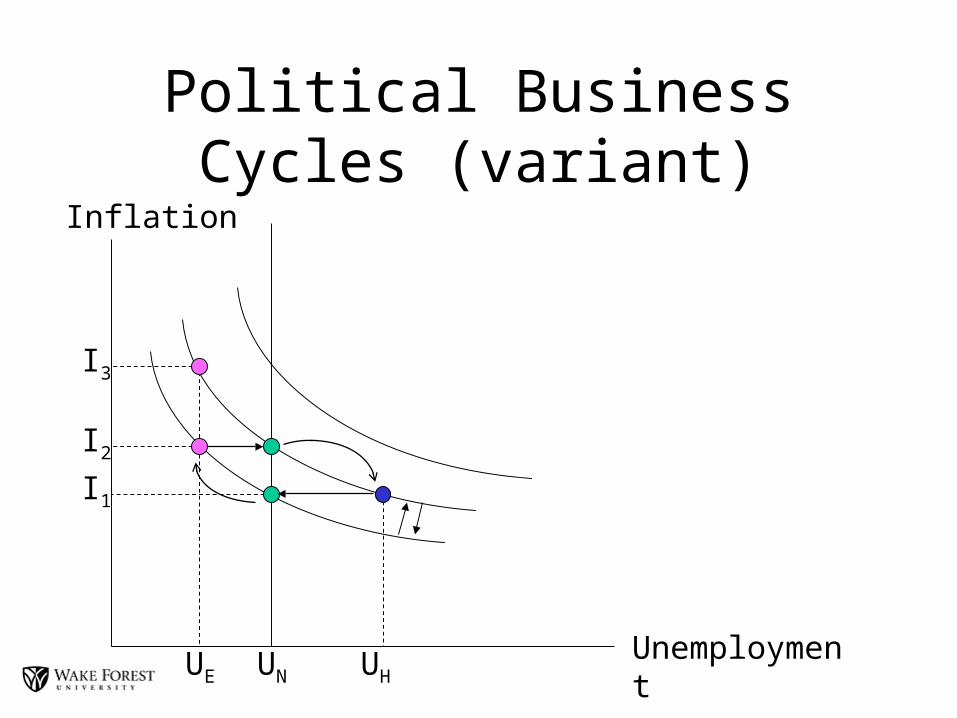
Political Business Cycles (variant)
Unemployment
Inflation
UN
I3
I2
UE
I1
UH
Political Business Cycles (variant)
Unemployment
Inflation
UN
I3
I2
UE
I1
UH

Partisan Business CyclesDouglas Hibbs
Unemployment
Inflation
Democrats
Republicans
UR
IR
UD
ID

Partisan Economic PerformanceDemocrat Republican
D Unemployment D Inflation D Unemployment D Inflation
level % level % level % level %
60-64 -0.3 -5.5 -0.3 -20.0 68-72 2.0 55.6 -0.3 -6.4
64-68 -1.6 -30.8 3.5 291.7 72-76 2.1 37.5 0.4 9.1
76-80 -0.6 -7.8 7.6 158.3 80-84 0.4 5.6 -8.5 -68.5
92-96 -2.1 -28.0 0.4 13.8 84-88 -2.0 -26.7 0.5 12.8
96-00 -1.4 -26.4 0.1 4.1 88-92 2.0 36.4 -1.5 -34.1
08-12 2.3 48.4 -1.7 -55.7 00-04 1.5 38.4 -0.7 -21.4
04-08 0.3 5.3 1.1 33.8
Avg -0.6 -10.7 1.6 24.2 Avg 1.1 21.5 -1.2 -14.1

Rational Partisan Business CyclesAlberto Alesina
Unemployment
Inflation
UR
IR
UD
ID
UN
IE
IE = average ( ID , IR )

Rational Partisan Business CyclesAlberto Alesina
Unemployment
Inflation
UR
IR
UD
ID
UN
IE
election: IE = average ( ID , IR )
Dems win: IE = ID
Reps win: IE = IR

Evidence for Partisan Business Cycles Truman (1948) through Bush (2008)• Partisan Growth Cycles
– Democrats 4.3 > Republicans 2.8• Democrats 1st half 4.7 > Republicans 1st half 2.0• Democrats 2nd half 4.0 ≈ Republicans 2nd half 3.5
– But annual record does not fit
• Partisan Unemployment Cycles– Democrats 5.2 < Republicans 5.9
• Democrats 1st half 5.6 = Republicans 1st half 5.6• Democrats 2nd half 4.7 < Republicans 2nd half 6.2
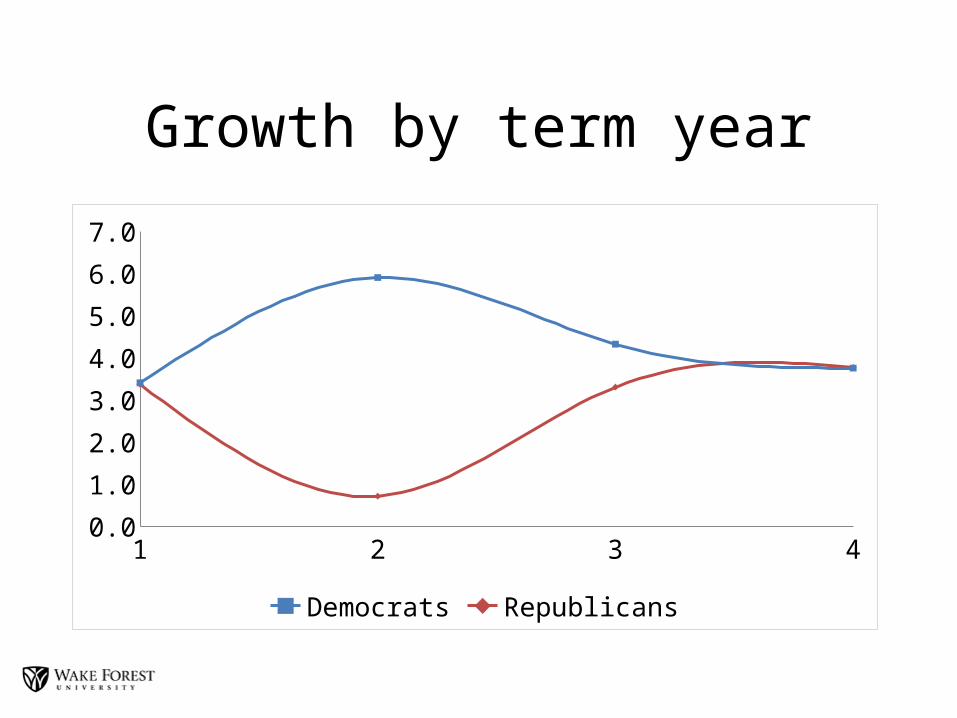
Growth by term year
1 2 3 40.0
1.0
2.0
3.0
4.0
5.0
6.0
7.0
Democrats Republicans
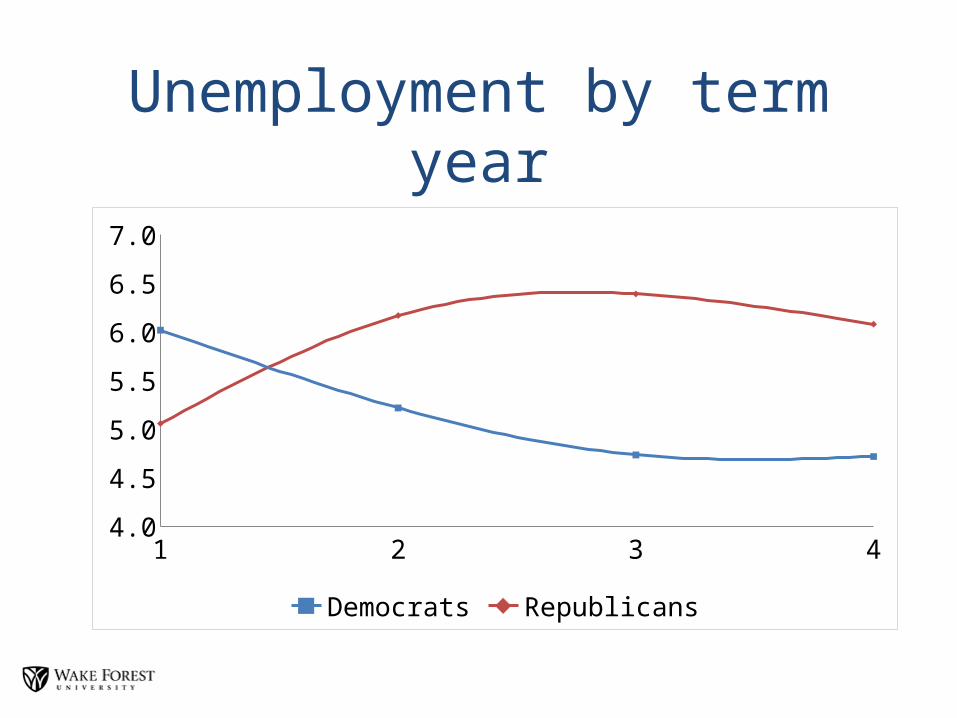
Unemployment by term year
1 2 3 44.0
4.5
5.0
5.5
6.0
6.5
7.0
Democrats Republicans

Evidence for Electoral Cyclesin OECD Economies
• Political Business Cycles– Not for output or unemployment– Policy cycles in money, deficits, some fiscal
• Partisan Business Cycles– Mixed for output and unemployment– Policy cycles in money and fiscal

India – Cole (2009)
• Comparison of districts w/ and w/o election, and over time
• Agricultural credit higher where elections• Agricultural credit contractions in years prior• Ag Credit targeted toward “swing” districts
– Greater difference for public vs private banks– Wasteful (no correlation b/w ag credit and productivity)
• Write-offs greatest where majority party had most success

e ee
A Political Business Cycle?U
T


Strategic Election Timing• PBC tests valid for US• PPC tests valid for fiscal---money ?• RPT valid for US• RPT varies for others (VRPT – Heckelman 2001)
– Uncertainty over election timing• Greater divergence in output, unemployment over the course
of an administration• Election effects depend on when election called (uncertainty)• Evidence supports for Germany, not UK or Canada• Evidence supports for pooled sample of Australia, France,
Germany, Sweden, UK, US (Berlemann and Markwardt, EJPE 2006)