Embed Size (px)
Citation preview

ARE YOU EXPERIENCED?
AN ASSESSMENT OF
EXPERIENTIAL LEARNING
IN NEW JERSEY
A Report to the New Jersey Office of
the Secretary of Higher Education
PREPARED BY: XIN HUANG, CHRISTOPHER MYLES, KELLIE PALOMBA, DANIYAL RAHIM, VANESSA RAYMOND
Under the Advisement Of:
Dr. Carl Van Horn, PhD.
Public Policy Practicum Edward J. Bloustein School of Planning and Public Policy Rutgers, the State University of New Jersey May 3, 2018
Page | 1
ACKNOWLEDGEMENTS
Our group would like to thank the New Jersey Office of the Secretary of Higher Education for allowing us the
opportunity to conduct this research. Specifically, we thank Secretary Zakiya Smith Ellis, Deputy Secretary
Diana Gonzalez, Assistant Secretary/CFO Angela Bethea, and Director of Finance Marie Virella for providing
us with invaluable feedback and insight. We also give special recognition to Secretary Emeritus Rochelle
Hendricks for providing and directing this research opportunity. We are further grateful for the guidance
provided by our faculty advisor Dr. Carl Van Horn, Distinguished Professor of Public Policy at Rutgers
University’s Edward J. Bloustein School of Planning and Public Policy. We also would like to thank Stephanie
Holcomb, Research Associate at the John J. Heldrich Center for Workforce Development, for her expertise.
Lastly, we would like to thank all institutions of higher education that participated in our research.

Page | 2
TABLE OF CONTENTS
Executive Summary……………………………………………………………………………………………...3
Introduction………………………………………………………………………………………………………5
Background: Experiential Learning in a National Context…………………………………………………...6
Literature Review………………………………………………………………………………………………...6
Defining Experiential Learning…………………………………………………………………………...6
Criteria for Assessment of Experiential Learning………………………………………………………...7
Equity Concerns in Experiential Learning………………………………………………………………..7
Methods…………………………………………………………………………………………………………...9
Experiential Learning Survey……………………………………………………………………………..9
Focus Groups……………………………………………………………………………………………...9
Career Services Website Assessment……………………………………………………………………..9
Limitations……………………………………………………………………………………………….10
Notable Findings………………………………………………………………………………………………...10
Career Services Offerings………………………………………………………………………………..10
Barriers to Experiential Learning………………………………………………………………………..12
Types of Experiential Learning………………………………………………………………………….13
Years of Student Engagement in Experiential Learning………………………………………………...14
Participation by Major…………………………………………………………………………………...15
Internship Requirements…………………………………………………………………………………17
Recommendations……………………………………………………………………………………………….17
Conclusion……………………………………………………………………………………………………….21
Appendix A: Survey Topline…………………………………………………………………………………...22
Appendix B: Email Outreach for Survey Participation……………………………………………………...40
Appendix C: OSHE Initial Outreach to New Jersey IHEs…………………………………………………...43
Appendix D: Focus Group Items………………………………………………………………………………44
Appendix E: Summarized Criteria for Assessment of Experiential Learning……………………………..49
Sources…………………………………………………………………………………………………………..50
Page | 3
EXECUTIVE SUMMARY
Experiential learning (EL) is pedagogical technique that provides students with the opportunity to apply
concepts from the classroom in real world scenarios. There is broad agreement that EL is critical for student
development and leads to increased employment outcomes after graduation. It is mainly those EL opportunities
that are measured as high-quality that lead to beneficial outcomes. High-quality experiences contain the
following elements: reflection, critical analysis, synthesis, opportunities for student initiative, decision-making
power, and accountability. Employers today are expecting new hires coming out of college to have considerable
experience using critical workplace skills. As the benefits for students and employers are becoming better
quantified and publicized, institutions of higher education (IHEs) are developing forward-thinking ways of
fostering and encouraging meaningful student involvement in such activities. IHEs in New Jersey offer a wide
range of services and programs to support students in their pursuit of EL opportunities; however, students still
face significant barriers in obtaining and completing quality experiences.i
In assessing EL in the state of New Jersey, this study reveals several key themes that lead to the development of
the following recommendations:
Implement mandatory EL requirements (ELRs). Engagement in EL, especially in workplace settings,
has been shown to lead to strong learning and employment outcomes for college graduates. While IHEs
generally offer credit for completion of an EL opportunity, there are many barriers students face in finding
and obtaining quality experiences. Developing ELRs would ensure that all students have access to
developing necessary workplace skills. Such a policy should be well-structured such that students complete
high-quality experiences that relate to their future career goals, have funding support, allow for reflection,
and are properly evaluated. Colleges, universities and statewide systems of higher education representing all
sectors and sizes have already implemented ELRs.
Build effective workplace learning programs and integrate EL into course curricula. Although an ELR
could be a standard by which IHEs strive to reach, effective programs can be developed that both promote
and integrate EL into course curricula. These programs may not mandate participation in EL, but can offer
structured experiences or simulate work settings for those who choose to participate.
Leverage current channels and create new ways of funding EL opportunities for students. Finding
ways to monetarily support students engaging in unpaid or low-paid EL opportunities is also crucial,
especially for low-income and at-risk populations. Students may not participate in opportunities they are
interested in because those positions are unpaid (and in some instances students have to pay IHEs to receive
credit for their unpaid experiences). Providing some level of funding support can lead to higher participation
in workplace EL.
Elevate career services offices’ roles to meet emerging demands and trends. As IHEs continue to foster
EL on their campuses, career services offices will be invaluable. These offices should implement new
models to address student needs and meet emerging demands and trends in the labor market. These models
should be centered around the idea of building communities that cultivate relationships across all areas of
campus and student life.
Foster further collaboration between IHEs and employers. Institutions will likely lead the way in
ensuring good access to quality EL experiences, but state government can also play a role in fostering
partnerships amongst employers and IHEs. With state government providing necessary funding, such
partnerships can not only offer training outside of the classroom but can also open up opportunities for
students to be hired after graduation. These partnerships can also be structured such that employers benefit
from more reliable streams of available talent.
The report’s recommendations come from several important findings. The report’s results are further noteworthy
in that they find significant differences amongst the sectors of private, public, and community colleges. Broadly
speaking, career services offices offer a variety of services that help students find and obtain EL opportunities.
However, ease of access to this information is disparate and it is still incumbent upon a student to actively seek
out these services. On top of having the responsibility to access information, students face several other

Page | 4
significant barriers in even participating in EL. They often have to work paid jobs unrelated to their majors, are
unaware of what opportunities they want to engage in, or do not know what resources are available.
Furthermore, IHEs in New Jersey seem to provide only limited opportunities to fund EL, deterring student
participation in unpaid or low-paid experiences that might further their academic and career development. If
students are fortunate enough to engage in EL, it is often later in their undergraduate careers. Participation also
appears to be concentrated in particular sectors. Even if New Jersey IHEs encourage participation, most do not
require completion of EL opportunities as part of their curriculums.
The findings and conclusions in this report were reached by employing a mix of qualitative and quantitative
research methods. A literature review was completed to evaluate EL in a national context. Next, a statewide
survey of career services staff was conducted to understand respondents’ perceptions of student participation in
EL and barriers faced in accessing these opportunities. Focus groups were held to further understand student
perspectives on issues related to EL. Lastly, an assessment of New Jersey IHEs’ career services websites was
done to rate ease of access for student navigation.
This research was done by a graduate student group on behalf of New Jersey’s Office of the Secretary of Higher
Education (OSHE), who proposed the research project to Rutgers University’s Edward J. Bloustein School of
Planning and Public Policy for the Masters of Public Policy Practicum Experience. This report is aimed to build
upon research conducted by the Center for Higher Education Strategic Information and Governance project
(HESIG) at Stockton University’s William J. Hughes Center for Public Policy on behalf of New Jersey’s Office
of the Secretary of Higher Education (OSHE) in 2014, which mainly cited student experiences with career
counseling and workplace learning opportunities.ii This report ultimately recommends some best practices and
policy solutions to strengthen EL opportunities in New Jersey.

Page | 5
INTRODUCTION
Experiential learning (EL) has become a highly discussed topic in higher education as the recognition of the
value of work-based learning has increased. Employers continue to report that many college graduates lack the
necessary skills critical for work preparedness and professional success. Evidence shows that, on average,
students largely feel unprepared for full-time work after college. Many students face significant barriers in
participating in EL, which would help them gain necessary workplace skills.
IHEs are faced with the challenge of taking on increased responsibility for developing students’ workplace skills
while also addressing barriers that students might face. Many have begun addressing these issues by
implementing models where they are encouraging or even requiring students to participate in EL opportunities.
Others have developed models that seek to increase access and funding for these opportunities. Participation in
EL is shown to improve learning outcomes and employment possibilities after graduation, and therefore should
be encouraged. These disparities between students, IHEs, and employers require deeper examination and
research to create tangible solutions for the state of New Jersey.
In 2014, New Jersey’s Office of the Secretary of Higher Education commissioned the Center for Higher
Education Strategic Information and Governance (HESIG) at Stockton University to conduct a survey on
students’ attitudes regarding academic advisement and career counseling. They found students recognize the
importance of internships as tools that foster employability skills but that they are often restricted from
participating in such opportunities. Also in 2014, OSHE conducted a roundtable discussion of career guidance
counselors from 20 IHEs in New Jersey, which revealed a variety of hands-on learning experiences are key in
developing students’ hard and soft skills.
In 2018, OSHE proposed a research project for the Rutgers Edward J. Bloustein School of Planning and Public
Policy for the Masters of Public Policy Practicum Experience to assess EL opportunities in New Jersey. The
research in this report strives to gain the perspective of the other major sources of information regarding student
interaction with EL, namely career services counselors and staff. These individuals work with and hear from
students on a daily basis. This paper will particularly explore the following questions:
How are EL opportunities (especially internships, cooperative education, and project-based learning)
important in developing transferable employability skills after graduation?
When students participate in these various hands-on experiences, how are they being assessed in terms
of applicability to career aspirations and connections to classroom learning?
What barriers do students face that might prevent them from participating in EL opportunities? How are
IHEs addressing these barriers?
How accessible are institutions’ EL opportunities to students? How do IHEs promote EL on their
campuses?
The graduate student team set out to answer these questions, among others, through the following research
methods:
A literature review of several different aspects of EL, including: defining EL, finding how EL
opportunities are assessed, and examining equity concerns and barriers to participation in EL;
A statewide survey of New Jersey IHE career services staff;
Student focus groups at New Jersey IHEs; and
An assessment of finding EL information on IHE’s websites.
Using the information gathered through these methods, several institutional and policy recommendations are
proposed to further foster and improve EL in the Garden State.
Page | 6
BACKGROUND: EXPERIENTIAL LEARNING IN A NATIONAL CONTEXT
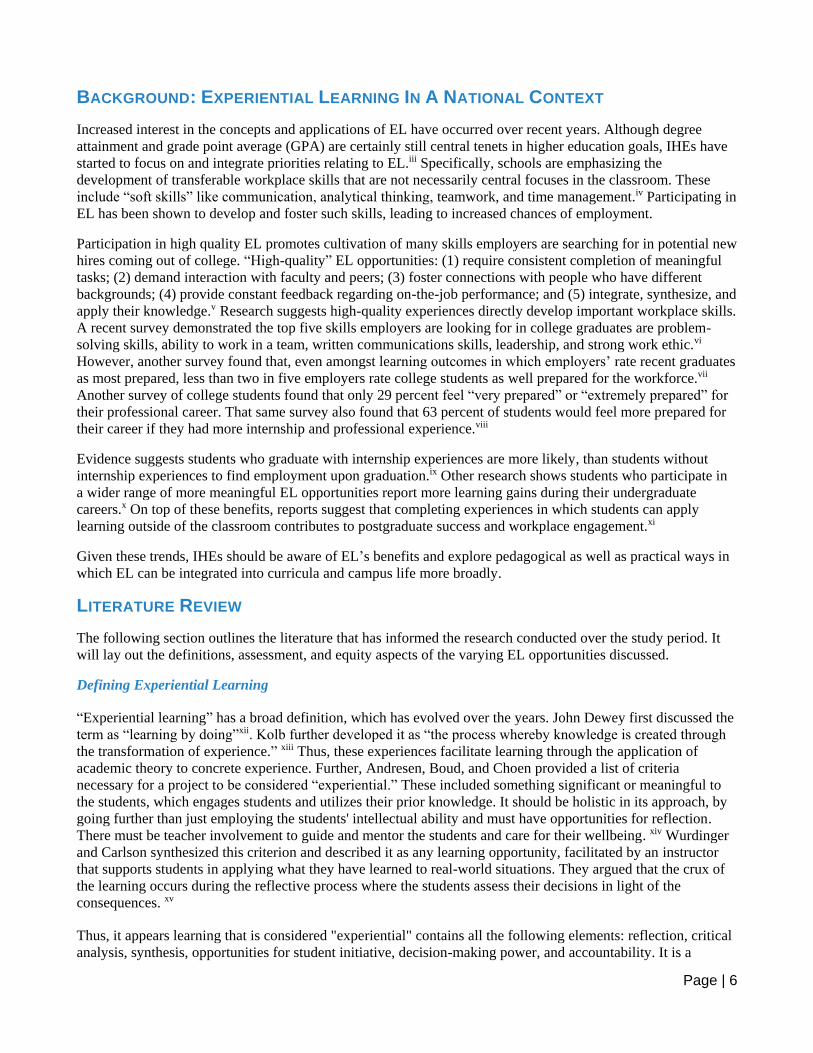
Increased interest in the concepts and applications of EL have occurred over recent years. Although degree
attainment and grade point average (GPA) are certainly still central tenets in higher education goals, IHEs have
started to focus on and integrate priorities relating to EL.iii Specifically, schools are emphasizing the
development of transferable workplace skills that are not necessarily central focuses in the classroom. These
include “soft skills” like communication, analytical thinking, teamwork, and time management.iv Participating in
EL has been shown to develop and foster such skills, leading to increased chances of employment.
Participation in high quality EL promotes cultivation of many skills employers are searching for in potential new
hires coming out of college. “High-quality” EL opportunities: (1) require consistent completion of meaningful
tasks; (2) demand interaction with faculty and peers; (3) foster connections with people who have different
backgrounds; (4) provide constant feedback regarding on-the-job performance; and (5) integrate, synthesize, and
apply their knowledge.v Research suggests high-quality experiences directly develop important workplace skills. A recent survey demonstrated the top five skills employers are looking for in college graduates are problem-
solving skills, ability to work in a team, written communications skills, leadership, and strong work ethic.vi
However, another survey found that, even amongst learning outcomes in which employers’ rate recent graduates
as most prepared, less than two in five employers rate college students as well prepared for the workforce.vii
Another survey of college students found that only 29 percent feel “very prepared” or “extremely prepared” for
their professional career. That same survey also found that 63 percent of students would feel more prepared for
their career if they had more internship and professional experience.viii
Evidence suggests students who graduate with internship experiences are more likely, than students without
internship experiences to find employment upon graduation.ix Other research shows students who participate in
a wider range of more meaningful EL opportunities report more learning gains during their undergraduate
careers.x On top of these benefits, reports suggest that completing experiences in which students can apply
learning outside of the classroom contributes to postgraduate success and workplace engagement.xi
Given these trends, IHEs should be aware of EL’s benefits and explore pedagogical as well as practical ways in
which EL can be integrated into curricula and campus life more broadly.
LITERATURE REVIEW
The following section outlines the literature that has informed the research conducted over the study period. It
will lay out the definitions, assessment, and equity aspects of the varying EL opportunities discussed.
Defining Experiential Learning
“Experiential learning” has a broad definition, which has evolved over the years. John Dewey first discussed the
term as “learning by doing”xii. Kolb further developed it as “the process whereby knowledge is created through
the transformation of experience.” xiii Thus, these experiences facilitate learning through the application of
academic theory to concrete experience. Further, Andresen, Boud, and Choen provided a list of criteria
necessary for a project to be considered “experiential.” These included something significant or meaningful to
the students, which engages students and utilizes their prior knowledge. It should be holistic in its approach, by
going further than just employing the students' intellectual ability and must have opportunities for reflection.
There must be teacher involvement to guide and mentor the students and care for their wellbeing. xiv Wurdinger
and Carlson synthesized this criterion and described it as any learning opportunity, facilitated by an instructor
that supports students in applying what they have learned to real-world situations. They argued that the crux of
the learning occurs during the reflective process where the students assess their decisions in light of the
consequences. xv
Thus, it appears learning that is considered "experiential" contains all the following elements: reflection, critical
analysis, synthesis, opportunities for student initiative, decision-making power, and accountability. It is a

Page | 7
pedagogical technique that provides students with the opportunity to apply their learnings from the classroom in
real world scenarios. It challenges them to engage with diverse audiences, and reflect on the personal and
professional significance of these experiences. Moreover, students realize that their actions have consequences
and their responsibility moves beyond a course grade. They must work in situations without predictable results,
receive consistent faculty mentoring, and participate in ongoing reflection about what they are learning.
Given the definition above, EL could include a variety of experiences. For simplicity, El can be categorized into
two major categories: 1) Field-based experiences, which include internships, practicums, cooperative education,
and service learning. 2) Classroom-based learning, with activities such as role-playing games, case studies,
simulations, presentations, and various types of group work. xvi However, the present research limits its analysis
to internships, cooperative education programs (co-ops), and project-based learning opportunities (PBL),
described below.
Internship is defined here as a short-term work assignment where students work for an organization to gain work
experience. xvii Dependent on the employer and the career field, these can be full- time or part-time, as well as
paid or unpaid. Academic departments have varied requirements for internships, with some having mandatory
programs with clearly defined requirements and granting academic credit. Students usually engage in full-time
opportunities in the summer and in part-time opportunities during the semester.
Cooperative education opportunities (co-ops) are usually well-defined academic programs where students have a
hands-on application component in their field of study. Co-ops are traditionally full-time, paid positions. A co-
op usually involves multiple work-term agreement with one employer; traditionally with at least three full-time
work stints alternated with school terms throughout a student’s undergraduate careerxvii. Students are assigned
with increasing tasks and responsibilities as the student progresses through courses, obtaining in-depth work
experience. Other models include an alternating model where students alternate between semesters of full-time
work and full-time school, and a parallel model where students work part-time while attending classes.xviii
Project-based learning (PBL) is a dynamic classroom approach, which organizes student learning around
projects. Students actively explore real-world problems and challenges and acquire in-depth knowledge by
answering challenging questions that involve a range of student activities. These projects give students the
opportunity to work relatively autonomously over extended periods of time, culminating in work products such
as presentations. xix Other defining features of PBLs include defined educational goals and content, teacher
facilitation, a reflection component, and some form of assessment. xix
Criteria for Assessment of Experiential Learning
A quality student EL opportunity has a mix of the following components: tangible and meaningful work with
manageable expectations; aligned with students’ academic program; dual supervision from institution and
participating organization; provide financial support to students who cannot afford them; can qualify for
academic credit; reflection before the beginning of the opportunity and at the culmination; incorporates
academic and career advising; embedded in the curriculum; and support retention of college partnerships and
students.xx The best EL opportunities have most, if not all, of these elements.
The outcomes of EL can be varied and unpredictable. The way one student chooses to solve a problem will be
different from another and what students take away from an experience may also differ. Moreover, the process
is as important as the final product. Therefore, it is necessary to develop practicable and flexible assessments
that measure success in both the learning process and the final outcomes while making sure students are able to
actively participate in the assessments. A detailed outline of recommended assessment measures can be found in
Appendix E at the end of this report.
Equity Concerns in Experiential Learning
Today's college students face a unique educational and employment landscape generations before them have
encountered. Tuition costs and related fees at IHEs across the nation continue to increase and do not indicate

Page | 8
any signs of stopping. The National Center for Education Statistics estimates for the 2014–15 academic year,
average annual current dollar prices for undergraduate tuition, fees, room, and board were estimated to be
$16,188 at public IHEs, $41,970 at private nonprofit IHEs, and $23,372 at private for-profit IHEs. Between
2004–05 and 2014–15, prices for undergraduate tuition, fees, room, and board at public IHEs rose 33 percent,
and prices at private nonprofit IHEs rose 26 percent, after adjustment for inflation.xxi These figures are important
to understand the cost barriers students might face when considering participation in workplace EL.
Students obtaining an advanced degree have financial and other constraints that may prevent them from
participating in EL opportunities. Roughly 14 million college students in the U.S. are working, where about 40
percent of undergraduates and 76 percent of graduate students work at least 30 hours a week; 25 percent of all
working learners are simultaneously employed full-time and enrolled in college full-time.xxii Working more than
20 hours a week has a negative impact on students’ grades whether on or off campus, but off campus contributes
to a higher likelihood that students will drop out of school before receiving a degree.xxiii
Many high-quality internships are often unpaid, leaving low-income students with the issue of financially
supporting themselves during the duration of such opportunities. These disadvantaged students often have to pay
for higher education and personal expenses themselves, leaving career-rich opportunities out of their college
experience. Students interested in internships in the non-profit or government realms have a more difficult time
finding paid opportunities. It becomes difficult for college students to accept unpaid internships in context of
rising tuition costs, cuts to state financial aid, and the increasing emphasis on loans in place of need-based
grants.xxiv Young adults in their mid-twenties with highly paid, highly educated parents are eight times more
likely to attain a bachelor's degree than those from more disadvantaged households.xxv The lack of affordability
of both internships and, more broadly, a college education, leaves low-income students at a significant
disadvantage in a competitive labor market. The ‘glass floor’ keeps less talented children born to affluent
parents at the top of the income ladder, which is one of the obstacles to greater intergenerational mobility, by
using personal or professional connections to arrange job or internship opportunities and possibly including
paying the summer living costs associated with unpaid internships.xxvi
Some significant discoveries were found in a survey distributed by Intern Bridge in 2009 to 234 colleges and
universities throughout the United States.xxvii Before delving into the findings, it is important to keep in mind
that 70 percent of the respondents identified as white women with an average age of 23.8 (80 percent), and had a
GPA above a 3.0 (82 percent). These students were attending private colleges and universities (36 percent),
public colleges under 15,000 students (30 percent) and large public colleges (29 percent). Of these respondents,
over 70 percent were receiving some form of federal financial aid. Thirty-seven percent were from households
earning less than $40,000 a year; 32 percent from households with $40,000 to $80,000; 21 percent from
households with $80,000 to $120,000; and 10 percent from households with income above $120,000.
Based on the aforementioned demographic data, there are interesting gender differences when it comes to
participation in EL opportunities and internships in particular. Women are more likely to be engaged in unpaid
internships (77 percent) than men. Of the women who participated in paid internships, their participation in for-
profit paid internships never exceeded 67 percent, inclusive of women from the lowest to highest income
brackets. Furthermore, approximately 25 percent of the women were in paid non-profit internships and roughly
18 percent in government internships. As for men, they seem to seek and participate in paid internships with for-
profit companies. Over 65 percent of men were in paid, for-profit internships with the remainder evenly
distributed over nonprofits and government agencies (about 16 percent each).
A students’ selection of their major will ultimately determine the range of paid versus unpaid opportunities that
will be available to them based on the evidence from the Intern Bridge study. Students majoring in education,
social sciences, health sciences, communication, and arts & humanities are more likely to be engaged in unpaid
internships. Arts and humanities students, for example, will more likely have internships from non-profits with
slightly more unpaid than paid. High income students were over-represented in business programs and under-
represented in agriculture & natural resources, education, and health majors. Low income students have a much

Page | 9
higher level of participation in unpaid internships than students from high income families. High income
students are more likely to be engaged in internships of any kind with for-profit companies.
Limiting internships to those who can afford them simply perpetuates existing inequalities. Making paid
internships more accessible to low-income students will help ensure they can gain the contacts and experience
needed to secure employment in their preferred careers after graduation. Many graduates with college degrees
financed by burdensome loans without the relevant work experience needed to get the jobs that will help pay off
said loans. Additionally, increasing opportunities in the nonprofit and government sectors may help foster civic
engagement and lead students to pursue careers in these fields. This would lead to a more inclusive democracy
by having a wider range of diversity in public service and public policy.
METHODS
Field research was conducted to garner a greater sense of how EL programs operate and are marketed to
students at IHEs in New Jersey. Three central research methods, described below, were utilized.
Experiential Learning Survey
A major component of the research was a survey to colleges and universities in the state of New Jersey.
Approximately 400 individuals from all 44 public, private, and community colleges were invited to participate.
The targeted population for the survey was individuals who work with students to help them access and take part
in EL opportunities—primarily those working in career services offices. The purpose of the survey was to gain a
better understanding of several dynamics of EL from professionals who work directly with students.
Specifically, more information was sought regarding: student participation in three types of EL (internships, co-
ops, and PBL); the extent to which career services offices market and/or get directly involved in EL; when
students begin to participate in such opportunities; which areas of study are perceived to have highest levels of
participation in EL; and any challenges that students are perceived to experience in accessing/committing to
such opportunities as they move through their college experience.
A first round of emails asking for initial participation in the survey was sent to the New Jersey Consortium of
Career Counselors; four subsequent follow-up emails were sent to a listserv that included career services staff
listed on individual IHE websites, as well as certain college presidents and their staff. Response collection began
on March 6, 2018 and ended on March 27, 2018. There was a total of 78 completed responses—36 of whom
were from public colleges, 25 of whom were from private colleges, and 17 of whom were from community
colleges. In total, 31 IHEs participated in the survey—10 of whom were from public colleges, 11 of whom are
from private colleges, and 10 of whom are from community colleges. Of those 31 IHEs, 19 had multiple
responses, meaning different people within the IHEs answered the survey. Please see Appendix A for the
survey topline.
Focus Groups
To supplement findings from other research methods used, two focus groups were conducted at a large public
research university in New Jersey. Recruitment for the focus groups were done through the university’s career
services office, who solicited participation through email. The first focus group included six students, all of
whom had participated in internships. The second focus group included seven students, none of whom had
participated in internships. The goal of having two separate focus groups was to assess how experiences might
differ or be similar between those who have engaged in such opportunities and those who have not. Please see
Appendix D for the focus group items for both the internship and non-internship groups.
Career Services Website Assessment
A central vehicle through which college students today access information for EL opportunities is their IHEs’
career services websites. A well-designed career services website is one that is intuitive, follows a logical path
Page | 10
given predicted user questions, and includes specific links or landing pages for that a student would want to look
for in accessing information. Garett et. al. (2016) describes the elements of a good web design as “navigation,
graphical representation, organization, content utility, purpose, simplicity, and readability.”xxviii
Under this criteria, specific aspects of career services websites were evaluated, given what were thought to be
central questions EL-seekers might have. A list was developed to evaluate every IHE’s website in New Jersey
and included: 1) any mention of EL programs (such as internships, co-ops, and PBL); 2) services for preparing
students who are applying for EL opportunities (such as resume-building, cover letter assistance, and
interviewing practice); 3) listings of EL opportunities; 4) funding assistance for EL opportunities; and 5)
services linked with contact information for further support.
In conducting the assessment process, the following steps were taken:
1. Google Search “IHE name + Career Services.”
2. Go to the website and see any mention of EL “buzz words” (internships, co-ops, etc.). If there was
any mention of those words, the institution was given a “Yes” in the respective column.
3. Click on those links and outline what is available.
4. Rate each institution by adding up the “Yes” across the rows for a final Accessibility Score, which
is a final tally of how helpful each career services website is in terms of preparation, opportunities,
contact information, support, and funding.
Limitations
This report has some limitations that include, but are not limited to: time constraints, non-representative sample
sizes, and data based only on perceptions of respondents, both career services staff and students, in the state.
While the methodologies yielded useful results, the claims in this report are not meant to be representative of
New Jersey IHE career services offices or IHEs in general, but are meant to serve as a starting point from where
IHEs can make improvements to their programs. In addition, responses to questions regarding student
experiences are solely the observations of the participants and should not be taken as generalizable.
Furthermore, certain IHEs had multiple responses from different individuals, which might slightly skew results
towards those institution’s experiences. Lastly, the researchers were unable to fully access/navigate the career
services websites requiring login information. IHEs may have chosen to leave this information off the website as
to not create demand for limited funding and may also provide external links for scholarships or further funding.
NOTABLE FINDINGS
The findings section seeks to summarize key themes seen throughout all methods of research. The analysis
further breaks down trends and differences seen by sector, where appropriate. The term “Community College”
represents the 2-year associate degree public community and county colleges. The term “Private College”
represents 4-year independent colleges and universities. The term “Public College” represents Senior Public
Colleges, otherwise defined as 4-year state colleges and universities. Given these terms, it should also be noted
that there are some disparities in the results for community colleges; this is likely because the mission of these
colleges is different from the other two sectors and is more geared toward helping students gain admission into
4-year schools. Much of what was found reaffirms earlier research and points to potential solutions at both the
institutional and statewide levels.
Career Services Offerings
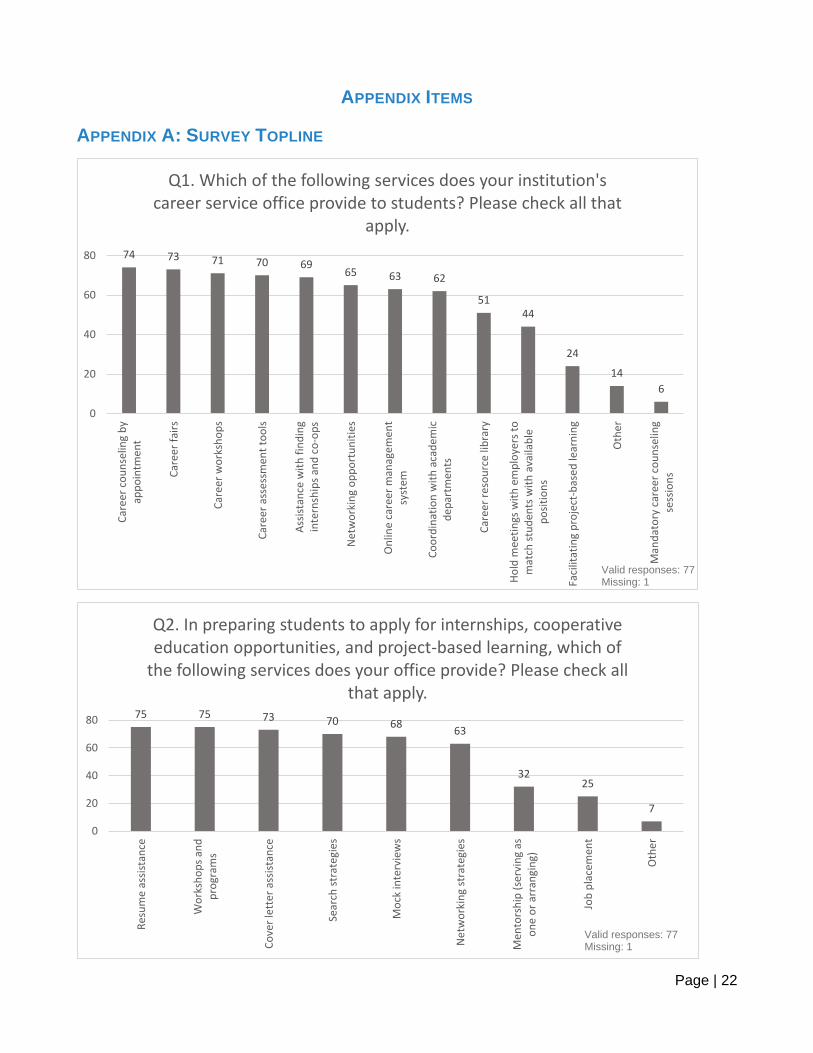
The opening portion of the survey asked career counselors about the services that their career services office
provides. Career services offices provide a variety of services and resources to assist students looking to engage
in EL. The numbers reported in the charts below further reaffirm findings from a 2014 survey of New Jersey
student attitudes on academic advising and career counseling services conducted by the Higher Education
Strategic Information and Governance Project’s (HESIG). Moreover, according to both focus groups, students
Page | 11
were aware that the university career services office provided a variety of assistance to get students prepared for
EL opportunities.
The assessment of career services websites also indicated that, on average, IHEs market these services fairly
well, although there is some variability by sector. As displayed in Table 1 below, most schools received an
accessibility score of 4 out of 5. For the most part, IHE websites: provide information regarding EL; list
internship/co-op opportunities (or have log-in portals to such information); display contact information for more
tailored student support (like one-on-one career counseling appointments) and have resources to help prepare
students applying to EL opportunities. Where IHEs lack is in the critical area of funding supports for EL
opportunities.
Table 1. Assessment for Career Services Websites
Sector Total
Community College Private College Public College
Accessibility Score
0 0 0 1 1
1 2 0 0 2
2 3 1 0 4
3 7 3 0 10
4 6 8 10 24
5 0 2 0 2
Could Not Evaluate 1 0 0 1
16
.7
20
.3
18
.3
14
.5
12
.5 17
.1
17
.8
15
.7
14
.5
13
.8
15
.9
13
.6 21
.4
50
33
.8
35
.2
36
.2 45
.8
35
.7
34
.2
33
.3
37
.1
38
.5
36
.5
36
.4 42
.9
33
.3
45
.9
46
.5
49
.3
41
.7 47
.1
47
.9
51
48
.4
47
.7
47
.6
50
35
.7
MA
ND
AT
OR
Y
CA
RE
ER
C
OU
NS
EL
ING
CO
UN
SE
LIN
G
AP
PO
INT
ME
NT
S
WO
RK
SH
OP
S
SE
AR
CH
A
SS
IST
AN
CE
FA
CIL
ITA
TE
P
BL
CA
RE
ER
A
SS
ES
SM
EN
T
CA
RE
ER
FA
IRS
CA
RE
ER
R
ES
OU
RC
E
LIB
RA
RY
CO
OR
DIN
AT
ION
WIT
H
FA
CU
LT
Y
NE
TW
OR
KIN
G
ON
LIN
E
CA
RE
ER
M
AN
AG
EM
E…
EM
PL
OY
ER
M
EE
TIN
GS
OT
HE
R
Figure 1. Services Provided to Students
Community College Private College Public College
20
.5
21
.3
20
14
.7
18
.8
21
.3
14
.3
18
.6
0
34
.2
33
.3
28
36
.8
34
.4
33
.3
36
.5
35
.7
57
.1
45
.2
45
.3 52
48
.5
46
.9
45
.3
49
.2
45
.7
42
.9
CO
VE
R
LE
TT
ER
A
SS
IST
AN
CE
RE
SU
ME
A
SS
IST
AN
CE
JOB
P
LA
CE
ME
NT
MO
CK
IN
TE
RV
IEW
S
ME
NT
OR
SH
IP
WO
RK
SH
OP
S
AN
D
PR
OG
RA
MS
NE
TW
OR
KIN
G
ST
RA
TE
GIE
S
SE
AR
CH
S
TR
AT
EG
IES
OT
HE
R
Figure 2. Preparation Services Provided to Students
Community Colleges Private Colleges Public College
Page | 12
Barriers to Experiential
Learning Opportunities
Despite the availability of
career services, students still
face certain challenges in
being able to engage in
workplace EL. Survey
participants were asked to
choose what they perceived
as the most significant
barrier students faced in
participating in an
internship, co-op, and PBL
experience. Interestingly, the
main barriers cited by
respondents differed by
sector. For instance, nearly
42 percent of public college
respondents stated that
students often have to work
a paid job unrelated to their
major. This finding was
supported by anecdotal
accounts from a student
focus group containing
students from a New Jersey
public college who had not
completed internships; 6 out
of 7 participants said that
they had working
experiences in major-
unrelated positions.
It is worth noting that fairly
significant portions of respondents from community colleges and private colleges (20 percent and 25 percent,
respectively) also felt that the main barrier for students was working a paid job. Meanwhile, over 29 percent of
private college respondents indicated that students do not know what opportunities they want to engage in. A
third of respondents from community colleges answered that students are not aware of resources.
Once again, these results reiterate findings from HESIG’s 2014 survey, which indicated that 76 percent of
student respondents worked a paying job—largely to help pay for tuition and living expenses. However, the
results also indicate that students at different types of schools might face different types of challenges.
Adding to these student barriers is the trend of IHEs not providing funding for EL opportunities. Table 2 below
shows that over 56 percent of respondents cited that their IHE does not provide any funding for student
participation in EL. Private colleges are most likely to provide EL funding, while community colleges and
public colleges are less likely. In addition to these findings, 20 percent, 12.5 percent, and 22.2 percent of
community, private, and public college respondents respectively believe that the most significant barrier
Total 19 14 11 44
20
.0%
33
.3%
0.0
% 6.7
%
20
.0%
20
.0%
12
.5%
12
.5%
29
.2%
20
.8%
25
.0%
0.0
%
22
.2%
11
.1%
13
.9%
11
.1%
41
.7%
0.0
%
FIN
DIN
G A
R
EL
EV
AN
T
PA
ID
OP
PO
RT
UN
ITY
LA
CK
OF
A
WA
RE
NE
SS
LA
CK
OF
K
NO
WL
ED
GE
TIM
E
CO
NS
TR
AIN
TS
UN
RE
LA
TE
D
PA
ID
OP
PO
RT
UN
ITY
OT
HE
R
Figure 3. Barr iers to EL Opportunit ies
Community College Private College Public College
9.1%
0.0%
16.7%
33.3%
40.0%
63.6%
0.0%
66.7%
66.7%
50.0%
60.0%
27.3%
0.0%
16.7%
33.3%
16.7%
O T H E R
S T I P E N D S
P A Y M E N T S T O E M P L O Y E R
T R A V E L A S S I S T A N C E
D I S C O U N T E D T U I T I O N C O S T S
G R A N T S S C H O L A R S H I P
Figure 4. Funding for EL Programs
Community College Private College Public College

Page | 13
students face in participating in workplace EL is difficulty in attaining paid employment related to their major.
The outcomes from the focus groups also aligned with this finding. Participants who had internship experiences
conveyed that it was very difficult for students to find paid, major-related internships, as well as external
funding to support unpaid internships. Students often had to either pay travel and housing expense by
themselves, or find extra paid, major-unrelated jobs to provide financial support.
Amongst those institutions that do offer some sort of funding for EL, the results indicate that private colleges
represent the highest percentages of respondents in each funding category. For example, amongst all
respondents who indicated that their IHE provides grants/scholarships for EL, 50 percent were from private
colleges (see Figure 4 above).
Types of Experiential
Learning
In addition to identifying
barriers to student
participation in EL, a
primary goal of the
research was to find out to
what extent students are
perceived to actually be
participating in three
common types of
workplace EL (internships,
co-ops, and PBL). In
general, it was found that,
in the aggregate, students
are more likely to
participate in internships
compared to co-ops and
PBL. However, there are
evident differences across
sector.
Table 2. Funding for Experiential Learning Programs by Sector
Sector
Total Community
College Private
College Public
College
Some funding for experiential learning
programs
Count 7 17 10 34
% within
sector 41.2% 68.0% 27.8% 43.6%
No funding for experiential learning
programs
Count 10 8 26 44 % within
sector 58.8% 32.0% 72.2% 56.4%
Total Count 17 25 36 78
% within
sector 100.0% 100.0% 100.0% 100.0%
70.6%
12.0%
33.3%
11.8%
44.0%
30.6%
5.9%
36.0%
22.2%
11.8%
8.0%
13.9%
C O M M U N I T Y C O L L E G E
P R I V A T E C O L L E G E
P U B L I C C O L L E G E
Figure 5. Percentage of Students Completing an Internship
Less than or equal to 25 percent Between 26 and 50 percent
Between 51 and 75 percent Between 76 and 100 percent
76.9%
61.5%
51.6%
15.4%
23.1%
25.8%
15.4%
12.9%
7.7%
9.7%
C O M M U N I T Y C O L L E G E
P R I V A T E C O L L E G E
P U B L I C C O L L E G E
Figure 6. Percentage of StudentsCompleting a Co -op
Less than or equal to 25 percent Between 26 and 50 percent
Between 51 and 75 percent Between 76 and 100 percent

Page | 14
Community college
respondents showed that
their students rarely
participate in internships as
nearly 71 percent indicated
that less than 25 percent of
their students engage in an
internship. Meanwhile, 80
percent of private college
respondents reported that
they believe between 26
and 75 percent of their
students participate in an
internship. Over half of public college respondendents observe that between 26 and 75 percent of their students
complete an internship before graduating.
When examining responses in regards to co-ops, it is clear that IHEs in all sectors see lower levels of
participation compared to participation in internships. The majority of respondents within each sector indicated
that 25 percent or less of their student populations engage in a co-op. This finding makes sense as oftentimes co-
ops are concentrated in certain sectors like engineering and technology, even if opportunities exist in other
areas.xxix
In regards to PBL, similarly high percentages of community, public, and private colleges all indicated that 25
percent or less of students at their IHEs engage in PBL. Somewhat surprisingly, the distributions across all three
sectors are fairly similar, indicating less prevalence of this type of EL across-the-board. It is possible that survey
respondents may not know the scope of PBL opportunities provided in classrooms, therefore leading them to
answer that less than or equal to 25 percent of their undergraduates participate.
Years of Student Engagement in Experiential Learning
While the research
certainly focused on
availability of services and
access to opportunities,
another area of emphasis
was gaining a sense of
perceived trends amongst
those students who are
able to participate in EL.
Prior research has asserted
that a larger breadth and
depth of participation in
EL helps to increase self-
reported learning
outcomes and post-
graduate results. In other words, having a higher number of experiences that are meaningful helps to better
educational and career results. Beginning such engagement earlier on in students’ postsecondary education can
allow them to have that breadth and depth in EL. Survey questions were asked, then, regarding years in which
respondents felt as though students first began to engage in in internships, co-ops, and PBL. In general,
respondents indicated that students begin engaging in such workplace opportunities later in their college careers.
This conclusion also coincided with the results from the focus groups. 5 out of 6 participants who had engaged
in internships started their experiences either their junior or senior years.
71.4%
61.9%
72.0%
14.3%
19.0%
16.0%
4.8%
12.0%
14.3%
14.3%
C O M M U N I T Y C O L L E G E
P R I V A T E C O L L E G E
P U B L I C C O L L E G E
Figure 7. Percentage of Students Completing PBL
Less than or equal to 25 percent Between 26 and 50 percent
Between 51 and 75 percent Between 76 and 100 percent
0.0
%
76
.5%
5.9
%
5.9
%
11
.8%
4.0
% 16
.0%
72
.0%
8.0
%
0.0
%
0.0
% 19
.4%
58
.3%
16
.7%
5.6
%
F R E S H M A N S O P H O M O R E J U N I O R S E N I O R O T H E R
PER
CC
ENTA
GE
OF
STU
DEN
TS
ENGAGEMENT YEAR
Figure 8. Year of Student Engagement in Internship
Community College Private College Public College

Page | 15
72 percent of respondents
from private colleges and
58 percent of respondents
from public colleges
answered that students
tend to begin participation
in internships during their
junior year. The majority
of community college
respondents, meanwhile,
think that engagement
generally begins in
sophomore year. Some
caution should be taken
when looking at this
number as community
colleges are usually two-
year schools. This
inclination amongst
respondents from
community colleges
continues throughout these
sets of questions. These
findings do indicate that
community college
students also do not seek
these opportunities until they are ready to exit the IHE.
Similar trends were seen when respondents were asked about co-ops. Exactly 40 percent of respondents from
private colleges and over 61 percent of respondents from public colleges reported that students generally begin
engaging in co-ops in their junior years. Interestingly, no respondents across any sectors reported that students
engaged in co-ops in their freshman year.
Results for PBL opportunities were somewhat more mixed compared to the other two types of EL. For example,
nearly 35 percent of respondents from public colleges indicated that students tend to engage in PBL in their
senior years. Meanwhile, 45 percent of respondents from private colleges felt as though most of their students
engage in their junior years. While the highest percentages amongst these two sectors still demonstrate
engagement in later years, there was not as much of a clear distinction as in the other two.
Participation by Major
Survey responses affirmed research from the literature review, which suggests that students in certain majors are
more likely to participate in EL opportunities than those in other majors.xxx Particular attention was paid to
participation in internships by major because this question had a high response rate compared to similar
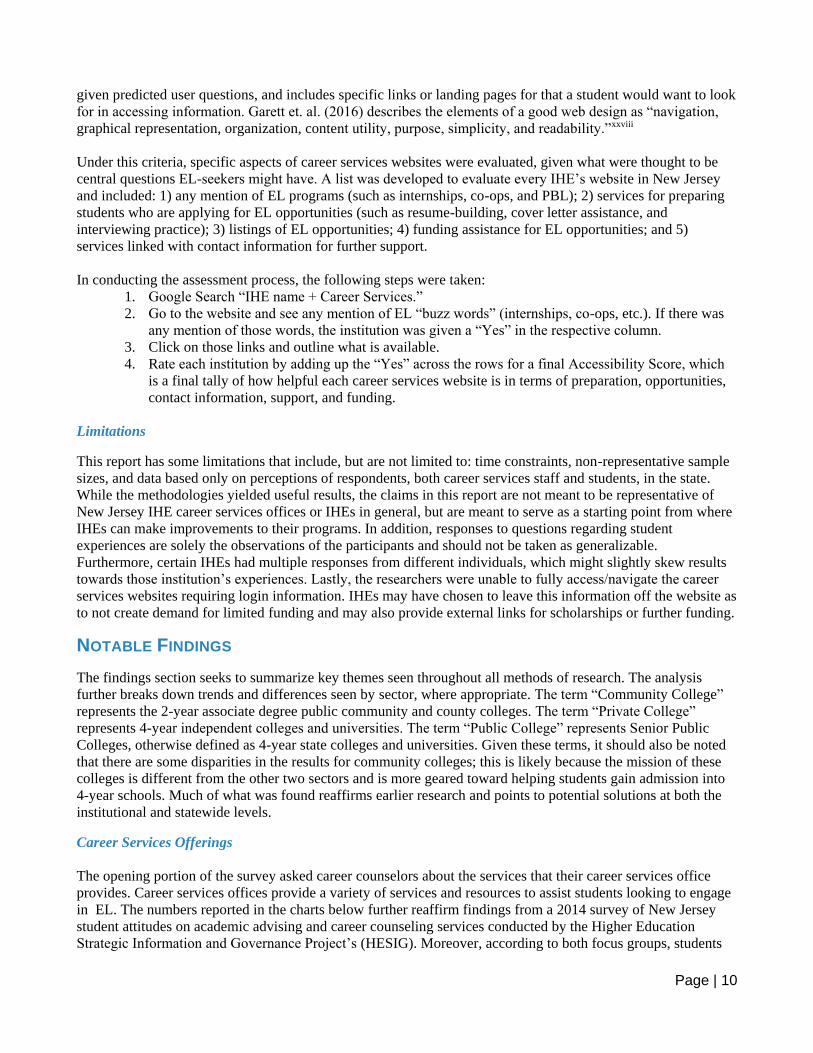
questions asked about co-ops and PBL . Nearly half of respondents (48 percent) felt as though, amongst all
major areas of academic study, the highest levels of internship participation came from those majoring in
business. Meanwhile, almost one-third (over 31 percent) felt that the lowest level of participation came amongst
those who major in the arts and humanities. Similarly, low levels of participation are seen in the Medical and
STEM fields, perhaps reflecting that these majors are more likely to participate in different sorts of EL, such as
clinical shadowing or co-ops.
61
.5%
0.0
%
0.0
%
38
.5%
20
.0%
40
.0%
13
.3%
26
.7%
12
.9%
61
.3%
19
.4%
6.5
%
S O P H O M O R E J U N I O R S E N I O R O T H E RP
ERC
ENTA
GE
OF
STU
DEN
TS
ENGAGEMENT YEAR
Figure 9. Year of Student Engagement in Co -ops
CommunityCollege Private College Public College
28
.6% 42
.9%
0.0
%
0.0
%
28
.6%
5.0
% 15
.0%
45
.0%
30
.0%
5.0
%
0.0
%
23
.1%
23
.1% 34
.6%
19
.2%
F R E S H M A N S O P H O M O R E J U N I O R S E N I O R O T H E R
PER
CEN
TAG
E O
F ST
UD
ENTS
ENGAGEMENT YEAR
Figure 10. Year of Student Engagement in PBLCommunity College Private College Public College
Page | 16
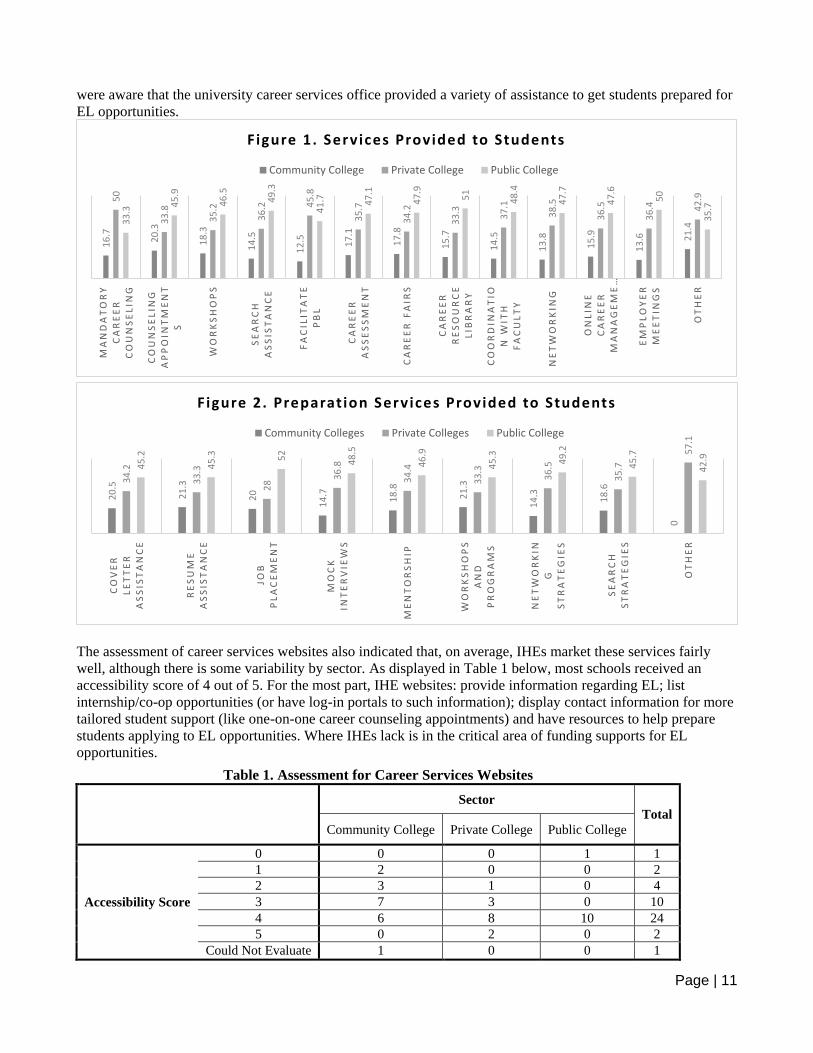
When examining perceived levels of participation in co-ops by major, respondents most frequently cited
Business (about 38 percent) and STEM (over 33 percent) as being foremost areas in which co-ops are
completed. The lowest levels of participation in the view of survey respondents were seen in Medical, Social
Science, and Arts majors.
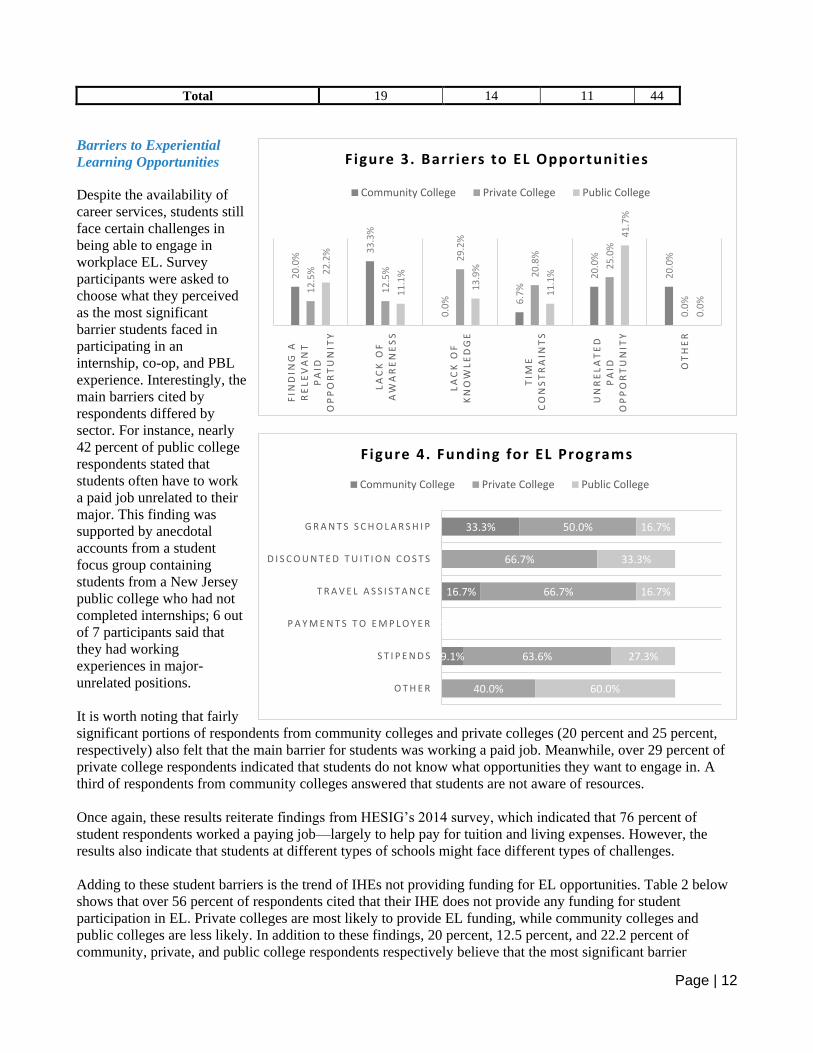
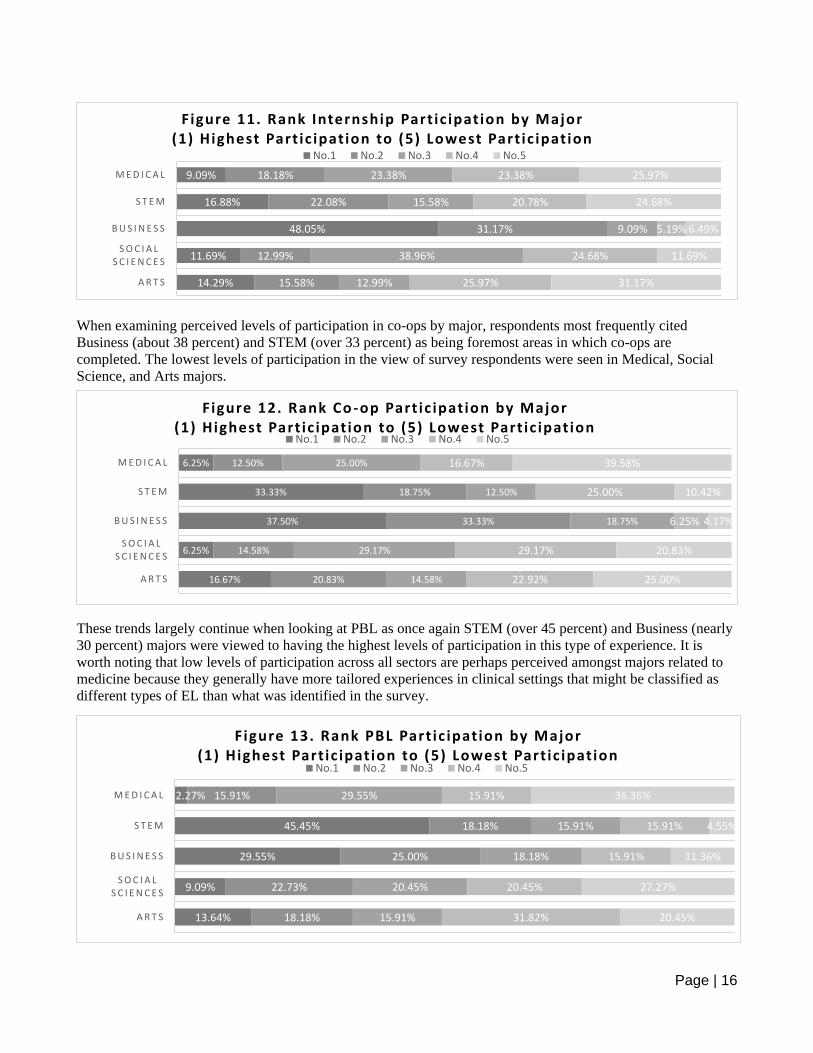
These trends largely continue when looking at PBL as once again STEM (over 45 percent) and Business (nearly
30 percent) majors were viewed to having the highest levels of participation in this type of experience. It is
worth noting that low levels of participation across all sectors are perhaps perceived amongst majors related to
medicine because they generally have more tailored experiences in clinical settings that might be classified as
different types of EL than what was identified in the survey.
16.67%
6.25%
37.50%
33.33%
6.25%
20.83%
14.58%
33.33%
18.75%
12.50%
14.58%
29.17%
18.75%
12.50%
25.00%
22.92%
29.17%
6.25%
25.00%
16.67%
25.00%
20.83%
4.17%
10.42%
39.58%
A R T S
S O C I A L S C I E N C E S
B U S I N E S S
S T E M
M E D I C A L
Figure 12. Rank Co -op Part ic ipation by Major (1) Highest Part ic ipation to (5) Lowest Part ic ipation
No.1 No.2 No.3 No.4 No.5
13.64%
9.09%
29.55%
45.45%
2.27%
18.18%
22.73%
25.00%
18.18%
15.91%
15.91%
20.45%
18.18%
15.91%
29.55%
31.82%
20.45%
15.91%
15.91%
15.91%
20.45%
27.27%
11.36%
4.55%
36.36%
A R T S
S O C I A L S C I E N C E S
B U S I N E S S
S T E M
M E D I C A L
Figure 13. Rank PBL Part ic ipation by Major (1) Highest Part ic ipation to (5) Lowest Part ic ipation
No.1 No.2 No.3 No.4 No.5
14.29%
11.69%
48.05%
16.88%
9.09%
15.58%
12.99%
31.17%
22.08%
18.18%
12.99%
38.96%
9.09%
15.58%
23.38%
25.97%
24.68%
5.19%
20.78%
23.38%
31.17%
11.69%
6.49%
24.68%
25.97%
A R T S
S O C I A L S C I E N C E S
B U S I N E S S
S T E M
M E D I C A L
Figure 11. Rank Internship Part ic ipation by Major(1) Highest Part ic ipation to (5) Lowest Part ic ipation
No.1 No.2 No.3 No.4 No.5

Page | 17
Internship Requirements
Research has shown that broad EL requirements at different institutions have enhanced self-reported learning
outcomes and contributed to students completing multiple opportunities during their time in school.xxxi Given
this background, the survey asked respondents whether or not their IHEs had requirements that their
undergraduate students complete an internship before graduation. The survey asked about internships
specifically because they are perceived to be the most common type of workplace EL.xxxii By and large, public,
private, and community colleges in New Jersey do not have such a requirement in place. There does not appear
to be significant variation across sector in regard to this question.
RECOMMENDATIONS
Given the findings of this study, there are certain trends that are evident throughout IHEs in New Jersey. The
following section lists key recommendations for IHEs, as well as the state, in encouraging and fostering quality
EL opportunities.
Implement mandatory EL requirements (ELRs). IHEs can directly promote access to EL by
requiring that students complete a certain amount of EL credits. They can also offer funding supports,
specifically targeted at low-income students completing unpaid or low-paid opportunities. IHEs in
different sectors and of different sizes have implemented ELRs.
o University of Georgia ELR. The University of Georgia (UGA), a large public research
university with nearly 27,000 undergraduates, implemented a campus-wide ELR in 2016. The
ELR can be met through the Center for Undergraduate Research Opportunities and other
supervised research courses; study-abroad and field school programs; service-learning;
internships; and other unique credit or noncredit options. UGA’s policy states that, “Each
school and college will determine which courses and/or experiences will fulfill the requirement
within its academic context, without increasing the hours required for graduation beyond the
approved limit.” xxxiii UGA offers a limited number of scholarship opportunities to support EL
activities.xxxiv An interview with a senior staff person at UGA who was heavily involved in the
policy’s implementation revealed that the university’s administration was willing from the start
to provide the resources necessary to make the ELR work. Most of the resources, it turns out,
were geared toward building the infrastructure and credit protocols needed to ensure that all
students are experiencing vetted, quality EL experiences. A few additional staff positions were
created to build an Office of Experiential Learning, but, for the most part, each individual
academic school assigned the responsibility of EL coordination to an existing staff person.
Monies used to fund scholarships and grants were largely garnered through alumni donations as
well as excess funds from other areas (including the Athletic Association). So, while cost may
be a concern for many schools, UGA’s experience shows that implementing this requirement
can be done efficiently and effectively—even at a large school with a diverse population.
94.1%
87.5%
85.7%
5.9%
12.5%
14.3%
C O M M U N I T Y C O L L E G E
P R I V A T E C O L L E G E
P U B L I C C O L L E G E
SE
CT
OR
Figure 14. Internship RequirementNo Yes

Page | 18
o Elon University ELR. Elon University, a private university in North Carolina with an
undergraduate population of about 6,000 students, has had an ELR as part of its undergraduate
curriculum since 1994. A 5-year study of graduating seniors from Elon showed that students
were quite engaged in EL throughout their undergraduate careers.xxxv On average, students
completed 376 hours and 9.4 course units. The study’s results further showed that students who
engaged in more EL hours and gained a wider breadth of experiences reported significantly
more learning gains.
o Bennington College, Field Work Term: At Bennington College, a private liberal arts college
with total undergraduate enrollment just over 700, students are required to complete Field Work
Terms (FWT). Every student is required to complete 210 hours during FWT over seven weeks
in January and February each year in their undergraduate careers.xxxvi At the end of the FWT
experience, students are given a pass/fail grade based on an evaluation from their internship
supervisor. Bennington does not charge tuition for the FWT and offers opportunities for some
assistance that students can apply for to make their experience more financially feasible.
Notably, students engaging in an unpaid FWT are allowed to use up to 70 supplemental hours at
a part-time job unrelated to their major. In addition, Bennington offers grants for students with
demonstrated financial need.xxxvii
Build effective workplace learning programs and integrate EL into course curricula. While
requiring students to complete a certain amount of EL credits is one strategy IHEs in New Jersey can
investigate, they can also strive to integrate EL as part of course curricula. Several schools across the
country have employed various models that allow academic faculty and departments, in coordination
with career services professionals, to foster EL as an important part of learning. Listed below are some
schools across the country that have implemented curricula that directly incorporate EL.
o SUNY Applied Learning. The State University of New York (SUNY) system contains 64
different campuses with a total of 460,000 students. In March 2015, SUNY leadership,
Governor Cuomo, and the State Legislature issued a policy directive mandating each campus to
make EL activities available to all students.xxxviii The various campuses, including community
colleges, have developed different types of programs, giving every SUNY student an
opportunity to engage in a campus-approved “applied learning” activity before they graduate.
As of January 2017, SUNY campuses offered a total of about 9,500 EL opportunities.xxxix A
case study analysis using student focus groups at three SUNY campuses also revealed that
students perceived applied learning programs as beneficial in developing their soft skills,
growing their networks, and applying classroom concepts.xl As students and their families
continue to perceive well-developed EL programs as integral in deciding where to attend
college, New Jersey IHEs might become less competitive if they do not further develop and
improve their EL programs.
o Northeastern Cooperative Education Program. Northeastern University, a private university
with an undergraduate population of about 18,000 students, has offered their Cooperative
Education program for over a century. Students alternate between academic semesters and co-
op semesters in which students engage in full-time employment. Along with an academic
coordinator, students also have co-op coordinators to assist them in schedule building
personalized to their career goals. The co-op curriculum requires students to take a course for
preparation prior to the co-op semesters and, after completion of the experience, to reflect and
detail how they related to their co-ops related to their academic experiences. Overall, about 92
percent of Northeastern students participate in at least one co-op and 75 percent do two or more.
Co-op arrangements not only allow students to better develop soft skills in real-world
workplace settings but also give employers the opportunity to fully evaluate and recruit talent
for full-time positions. In fact, Northeastern reports that 90 percent of graduates are employed

Page | 19
within nine months of graduation, half are employed with their co-op employer, and 85 percent
are working in their field of study.xli
o Drexel University Cooperative Education Program: Drexel University, a private research
university with an undergraduate population of about 15,500 students, has had a cooperative
education program, similar in structure to Northeastern University’s, in place since 1919. As a
part of the co-op curriculum, students are required to complete one of two co-op preparatory
courses, either to prepare students engaging in professional experiences for the first time or to
guide students looking to transition to a new field. Over 98 percent of undergraduate students
participate in the program, the majority of whom are paid for their experience. In fact, median
paid co-op salary for six months is over $18,000. Furthermore, nearly half (48 percent) of co-op
participants working full-time received a job offer from a former co-op employer.xlii
Leverage current channels and create new ways of funding EL opportunities for students. Often,
students do not engage in EL because of the prevalence of unpaid or low-paying opportunities. IHEs in
New Jersey, by and large, do not provide their own funding to students. They should consider
developing strategies to monetarily support students engaging in workplace EL—be it to help pay for
travel or living expenses or to provide base pay. Targeting low-income students, who often do not have
the connections to find well-paying opportunities or the means to complete unpaid opportunities, should
be an important focus. EL is beneficial overall but is especially advantageous for low-income students.
Several schools across the country have created channels for EL funding that is specifically targeted at
those students who receive financial aid and are looking to engage in unpaid or low-paid opportunities.
o Brown University BrownConnect LINK Program. In this program, Brown University alumni
and parents, the Office of Financial Aid, as well as other departments in the University, fund
stipends for students who secure an unpaid or low-paying internship. Students are awarded a
$3,500 stipend for domestic internships and $5,000 for internships abroad. To be eligible,
students must secure an unpaid internship or one which pays less than $1,000 over the summer.
These opportunities must have professional supervision according to LINK guidelines. Students
must work a minimum of 240 hours of supervised work to receive the financial awards.xliii
o Rutgers University “Report of the Task Force to Enhance Experiential Education for
Undergraduate Students at Rutgers University-New Brunswick.” This task force proposed the
creation of an Internship Opportunity Fund, which would be initially funded at $100,000. The
fund would be targeted to award students who are receiving financial aid an additional amount
to help offset expenses, such as travel to and from their job site, incurred during unpaid
internships. What is unique about this proposal is that it would be funded through either an
adjustment to the cost allocation formula or an adjustment to the distribution of student campus
fees, amounting to a charge of approximately $2 per student.xliv
These two institution-level programs listed above illustrate models that could be scaled up so
that all students receiving financial aid have the opportunity to receive some level of
EL/internship funding. Such a policy could further be means-tested such that it benefits
extremely low-income students who need internship funding most.
o New Jersey’s Many Paths, One Future Program. Currently, this program is administered by the
New Jersey Department of Labor and Workforce Development. This program reimburses
employers 50 percent of wages paid to up to a total of 1,000 new interns on a first-come, first-
serve basis. The limit per student is set at $1,500.xlv Due to lack of awareness and funding being
limited to internships in a few specific fields, as of April 2018, only 341 students from a small
concentration of IHEs in New Jersey have applied and received funding through the program.
The state should look into increased funding for marketing to students, especially low-income

Page | 20
students who could doubly benefit from an EL opportunity and some financial assistance.
Additionally, this program could be expanded such that it covers more sectors and offers
assistance more specifically targeted to those low-income students who need it most.
While this program is monetarily small given the broader need for EL funding, it might be
integrated into the current financial aid system for sustainability and better access to students.
Elevate career services offices’ roles to meet the emerging demands and trends. Moving forward,
IHEs’ career services offices will play a critical and perhaps central role in helping to produce
successful career outcomes for students. Experts suggest that career services offices should strive to
fully engage the entire network of students, alumni, faculty, employers, families, and surrounding
communities.xlvi Central themes seen in newly conceived career services models are that they strive to
interact with all parts of campus and student life, are tailored toward student needs and interests, and
offer guidance in settings outside of formal counseling appointments. Listed below are IHEs across the
country that are employing innovative, new models of career counseling.
o George Mason University’s “Customized Connectors” Model. This model is based on the
premise that students often consult their networks of family and friends when making career
decisions. George Mason’s career services office seeks to get within a couple degrees of
students’ inner circles. They primarily strive to do this by creating partnerships with university
life offices, faculty, and area employers. The goal of the model is to spread the word that career
services staff are the experts on career education and valuable resources for facilitating
connections between employers and students. People in students’ networks, then, should be
pointing students to the office when they are seeking career advice. In 2013-2014, the office’s
efforts saw success as there was an 18 percent increase in appointments, 45 percent increase in
freshman and sophomore engagement, and a 78 percent increase in career program
attendance.xlvii
o Rutgers University-New Brunswick “Career Cluster” Model. In this model, students can sign
up to be part of one of seven clusters, namely: Arts, Communications, and Entertainment;
Business, Financial Services, and Logistics; Education and Public & Human Services; Food &
Agriculture and Environmental & Natural Resources; Life Sciences and Health; STEM; and
Students Still Deciding.xlviii The goal of these clusters is to tailor information toward students’
career interests rather than solely their major. Since switching to this model, the office has seen
a 25 percent increase in students seeking out services.xlix
Foster further collaboration between IHEs and employers. Although IHEs might spearhead much of
the reform efforts toward better promotion of EL on their campuses, the state can provide much-needed
resources to further fostering collaborations. New Jersey should look into either creating or investing
more in new or existing programs that seek to address industry needs and that help create meaningful
workplace opportunities for students. Of note, there may be some programs that are being conducted
already that this study was not able to learn about.
o Maryland Employment Advancement Right Now (EARN) Program. This program allows
employers and employer groups to receive EARN grants to help provide education and skills
training to primarily unemployed, underemployed, and incumbent workers. The program has a
specific focus on helping underserved populations who face significant barriers to employment.
While the program largely targets those currently in the workforce or who were previously
employed, some of the partnerships also provide internship opportunities for students that are
still in school and completing educational requirements. For instance, the Maryland
Manufacturing Extension Partnership implemented a structured internship program for college
students. The most recent data suggest that 2,767 unemployed and underemployed participants

Page | 21
completed entry level training programs. Of those, 2,323 (84 percent) obtained employment.
For every dollar the state invests into the program, an additional $18.97 in economic activity is
created. State leadership has further recognized the value of the program, doubling the program
budget for FY 2018 to over $8 million.l
New Jersey should consider development of a similar program that is even more targeted
toward college students, especially those who are low-income and have disproportionately
lower access to workplace EL opportunities. The EARN program also involves partnerships
with many community colleges. Perhaps EL disparities seen amongst community colleges in
this study can be reduced if New Jersey develops a statewide program similar to EARN.
CONCLUSION
There is widespread recognition that EL, specifically workplace EL, helps students develop skills that increase
their chances of employment after graduation. As employers increasingly value prior workplace experience
when hiring recent graduates, it is crucial that access to EL opportunities be expanded for all students. IHEs can
play a significant role in breaking down the several barriers that might prevent students from participating in
workplace learning opportunities. In fact, schools across the country have already implemented structured EL
models that allow students to: engage in meaningful work, receive helpful feedback, reflect upon their
experiences, and obtain funding support. Some IHEs have even valued EL so highly that they require all
undergraduate students to complete a certain amount of EL credits before graduation. As students and their
families are increasingly viewing higher education in terms of returns on investment in the form of employment
outcomes, they may find such innovative EL programs as attractive when selecting schools to attend. IHEs in
New Jersey can emulate models at other schools across the country and improve upon existing successful
programs to not only promote EL to their students but to also attract prospective students both inside and outside
of the state.
Page | 22
APPENDIX ITEMS
APPENDIX A: SURVEY TOPLINE
74 73 71 70 6965 63 62
5144
24
14
6
0
20
40
60
80
Car
eer
cou
nse
ling
by
app
oin
tmen
t
Car
eer
fair
s
Car
eer
wo
rksh
op
s
Car
eer
asse
ssm
ent
too
ls
Ass
ista
nce
wit
h f
ind
ing
inte
rnsh
ips
and
co
-op
s
Net
wo
rkin
g o
pp
ort
un
itie
s
On
line
car
eer
man
agem
ent
syst
em
Co
ord
inat
ion
wit
h a
cad
emic
de
par
tmen
ts
Car
eer
reso
urc
e lib
rary
Ho
ld m
eeti
ngs
wit
h e
mp
loye
rs t
om
atch
stu
den
ts w
ith
ava
ilab
lep
osi
tio
ns
Faci
litat
ing
pro
ject
-bas
ed le
arn
ing
Oth
er
Man
dat
ory
car
eer
cou
nse
ling
sess
ion
s
Q1. Which of the following services does your institution's career service office provide to students? Please check all that
apply.
75 75 73 70 6863
3225
7
0
20
40
60
80
Res
um
e as
sist
ance
Wo
rksh
op
s an
dp
rogr
ams
Co
ver
lett
er a
ssis
tan
ce
Sear
ch s
trat
egie
s
Mo
ck in
terv
iew
s
Net
wo
rkin
g st
rate
gies
Men
tors
hip
(se
rvin
g as
on
e o
r ar
ran
gin
g)
Job
pla
cem
ent
Oth
er
Q2. In preparing students to apply for internships, cooperative education opportunities, and project-based learning, which of
the following services does your office provide? Please check all that apply.
Valid responses: 77 Missing: 1
Valid responses: 77 Missing: 1

Page | 23
67 6561 61 60 59 59
54
8
0
15
30
45
60
75
Emai
ls
Flye
rs, b
ann
ers,
po
ster
s
Dir
ect
advi
sin
g
Soci
al m
edia
Wo
rd o
f m
ou
th
Pre
sen
tati
on
s
On
line
job
bo
ard
Par
tici
pat
ion
in/s
po
nso
rin
g o
fca
mp
us-
wid
e e
ven
ts Oth
er
Q3. How does the career services office make students aware of internships, co-ops, and project-based learning opportunities?
Please check all that apply.
84.42%
15.58%
Q4. Do your students engage in on-campus internships, off-campus internships, or both?
Both
Off campus
Valid responses: 77 Missing: 1
Valid responses: 77 Missing: 1

Page | 24
88.16%
11.84%
Q5. Does your institution have a requirement that all undergraduate students complete an internship in order to
graduate?
No
Yes
72.73%
6.49%
20.78%
Q6. Are students able to receive academic credit for the internships they participate in?
Yes
No
Not sure
Valid responses: 76 Missing: 2
Valid responses: 77 Missing: 1

Page | 25
18.18%
56.36%
18.18%
7.27%
Q7. In order for students to receive academic credit for internships in one semester, how many working hours are
required of a student in that semester?
100 hours or less
Between 101 and 200 hours
Between 201 and 300 hours
301 hours or more
38.96%
33.77%
27.27%
Q8. In your observation, do students more frequently participate in unpaid internships or paid internships?
Paid
Unpaid
Not sure
Valid responses: 55 Missing: 23
Valid responses: 77 Missing: 1
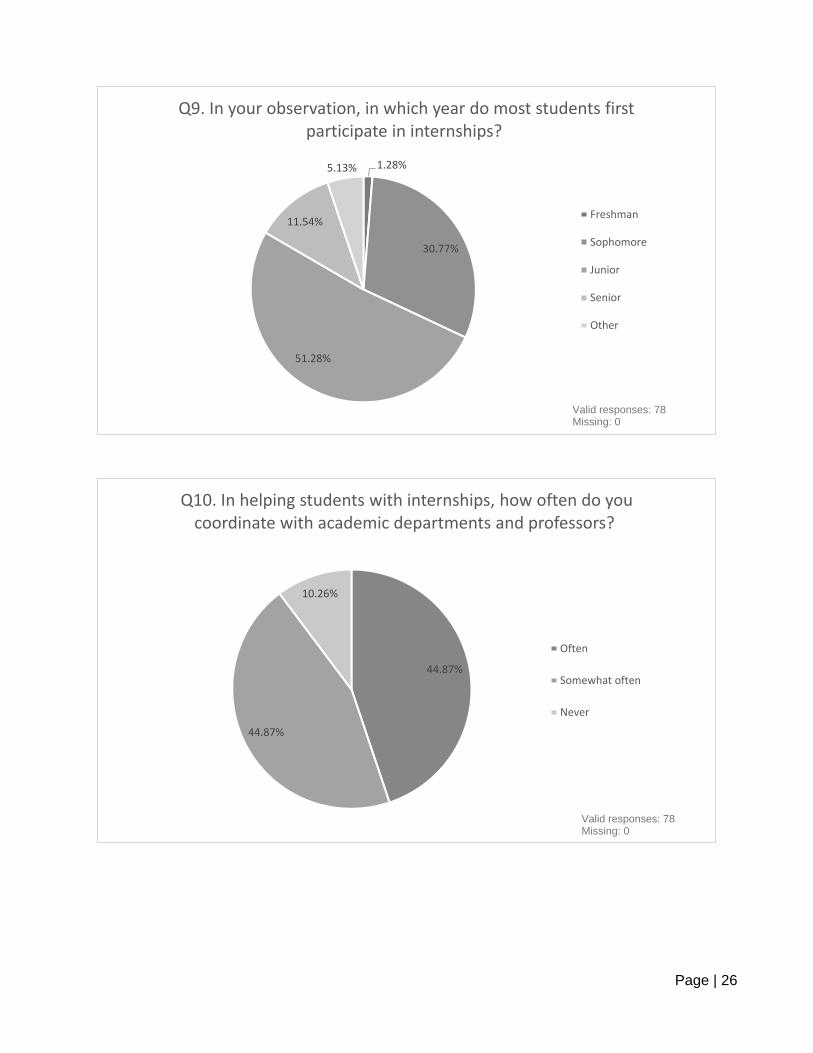
Page | 26
1.28%
30.77%
51.28%
11.54%
5.13%
Q9. In your observation, in which year do most students first participate in internships?
Freshman
Sophomore
Junior
Senior
Other
44.87%
44.87%
10.26%
Q10. In helping students with internships, how often do you coordinate with academic departments and professors?
Often
Somewhat often
Never
Valid responses: 78 Missing: 0
Valid responses: 78 Missing: 0
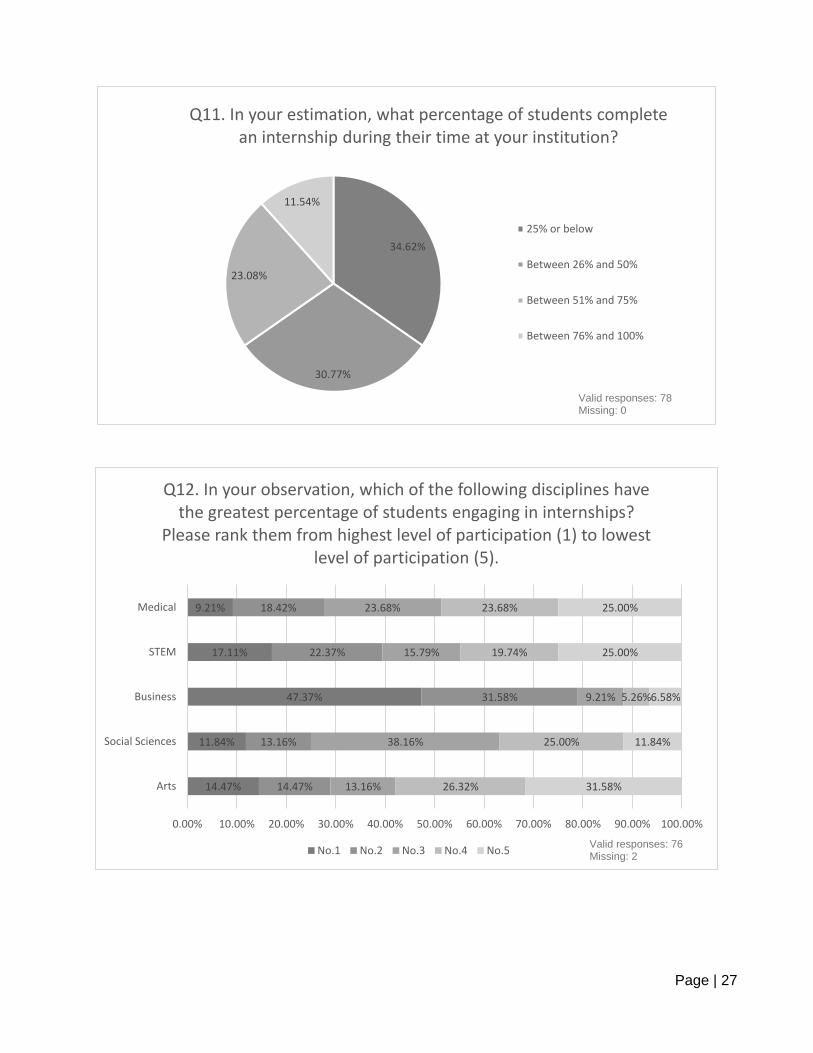
Page | 27
34.62%
30.77%
23.08%
11.54%
Q11. In your estimation, what percentage of students complete an internship during their time at your institution?
25% or below
Between 26% and 50%
Between 51% and 75%
Between 76% and 100%
14.47%
11.84%
47.37%
17.11%
9.21%
14.47%
13.16%
31.58%
22.37%
18.42%
13.16%
38.16%
9.21%
15.79%
23.68%
26.32%
25.00%
5.26%
19.74%
23.68%
31.58%
11.84%
6.58%
25.00%
25.00%
0.00% 10.00% 20.00% 30.00% 40.00% 50.00% 60.00% 70.00% 80.00% 90.00% 100.00%
Arts
Social Sciences
Business
STEM
Medical
Q12. In your observation, which of the following disciplines have the greatest percentage of students engaging in internships?
Please rank them from highest level of participation (1) to lowest level of participation (5).
No.1 No.2 No.3 No.4 No.5
Valid responses: 78 Missing: 0
Valid responses: 76 Missing: 2

Page | 28
55.13%29.49%
15.38%
Q13. Does your institution offer academic credit for co-ops?
Yes
No
Not sure
17.65%
41.18%
21.57%
19.61%
Q14. In offering academic credit for co-ops in one semester, how many working hours are required of a student in that semester?
100 hours or less
Between 101 and 200 hours
Between 201 and 300 hours
301 hours or more
Valid responses: 78 Missing: 0
Valid responses: 51 Missing: 27

Page | 29
25.97%
33.77%5.19%
35.06%
Q15. Does your office help students find co-ops and/or does it arrange specific co-op assignments for individual students?
Both find and place
Find
Place
None
25.42%
42.37%
13.56%
18.64%
Q16. In your observation, in which year do most students first participate in co-ops?
Sophomore
Junior
Senior
Other
Valid responses: 77 Missing: 1
Valid responses: 59 Missing: 19

Page | 30
43.64%
40.00%
16.36%
Q17. In helping students find and/or get placed into co-ops, how often do you coordinate with academic departments and
professors?
Often
Somewhat often
Never
59.65%22.81%
10.53%
7.02%
Q18. In your estimation, what percentage of students complete a co-op during their time at your institution?
25% or below
Between 26% and 50%
Between 51% and 75%
Between 76% and 100%
Valid responses: 55 Missing: 23
Valid responses: 57 Missing: 21

Page | 31
16.67%
6.25%
37.50%
33.33%
6.25%
20.83%
14.58%
33.33%
18.75%
12.50%
14.58%
29.17%
18.75%
12.50%
25.00%
22.92%
29.17%
6.25%
25.00%
16.67%
25.00%
20.83%
4.17%
10.42%
39.58%
0.00% 10.00% 20.00% 30.00% 40.00% 50.00% 60.00% 70.00% 80.00% 90.00% 100.00%
Arts
Social Sciences
Business
STEM
Medical
Q19. In your observation, which of the following disciplines have the greatest percentage of students engaging in co-ops? Please rank them from highest level of participation (1) to lowest level
of participation (5).
No.1 No.2 No.3 No.4 No.5
14.29%
49.35%
15.58%
20.78%
Q20. Does your institution offer project-based learning opportunities for students?
Yes, most programs/divisions do
Yes, some programs/divisions do butthere could be more
No, most programs/divisions do not
Not sure
Valid responses: 48 Missing: 30
Valid responses: 77 Missing: 1

Page | 32
73.21%
25.00%
1.79%
Q21. Does your institution offer on-campus project-based learning, off-campus project-based learning, or both?
Both
On campus
Off campus
73.33%
26.67%
Q22. Does your office help in coordinating project-based learning opportunities for students?
No
Yes
Valid responses: 56 Missing: 22
Valid responses: 60 Missing: 18
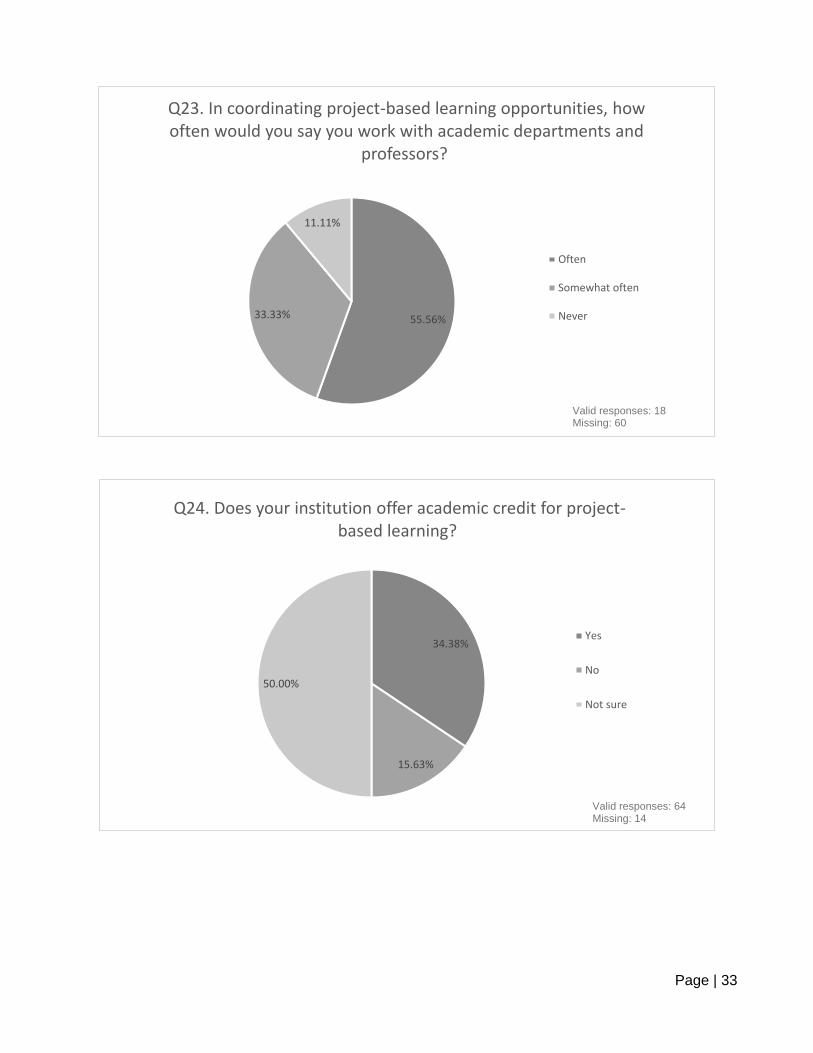
Page | 33
55.56%33.33%
11.11%
Q23. In coordinating project-based learning opportunities, how often would you say you work with academic departments and
professors?
Often
Somewhat often
Never
34.38%
15.63%
50.00%
Q24. Does your institution offer academic credit for project-based learning?
Yes
No
Not sure
Valid responses: 18 Missing: 60
Valid responses: 64 Missing: 14

Page | 34
29.09%
7.27%63.64%
Q25. Does your institution provide paid project-based learning, unpaid project-based learning, or both?
Both
Paid
Unpaid
67.92%
16.98%
7.55%
7.55%
Q26. In your estimation, what percentage of students complete a project-based learning opportunity during their time at your
institution?
25% or below
Between 26% and 50%
Between 51% and 75%
Between 76% and 100%
Valid responses: 55 Missing: 23
Valid responses: 55 Missing: 23
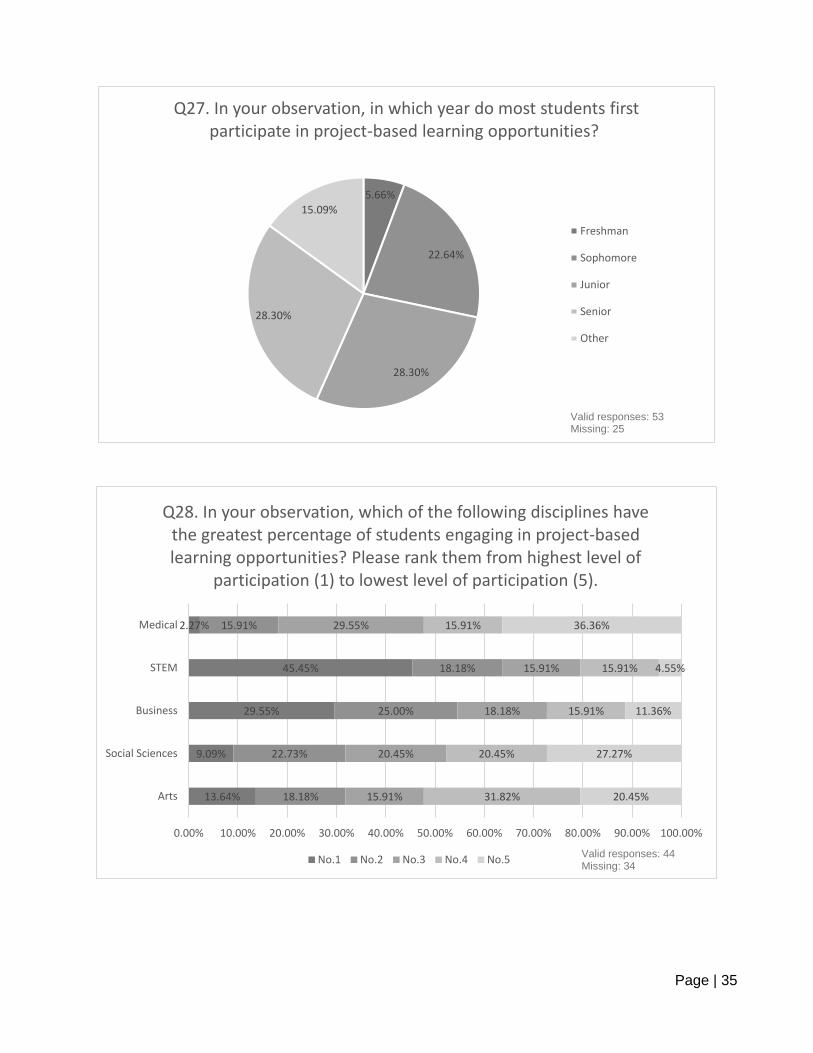
Page | 35
5.66%
22.64%
28.30%
28.30%
15.09%
Q27. In your observation, in which year do most students first participate in project-based learning opportunities?
Freshman
Sophomore
Junior
Senior
Other
13.64%
9.09%
29.55%
45.45%
2.27%
18.18%
22.73%
25.00%
18.18%
15.91%
15.91%
20.45%
18.18%
15.91%
29.55%
31.82%
20.45%
15.91%
15.91%
15.91%
20.45%
27.27%
11.36%
4.55%
36.36%
0.00% 10.00% 20.00% 30.00% 40.00% 50.00% 60.00% 70.00% 80.00% 90.00% 100.00%
Arts
Social Sciences
Business
STEM
Medical
Q28. In your observation, which of the following disciplines have the greatest percentage of students engaging in project-based learning opportunities? Please rank them from highest level of
participation (1) to lowest level of participation (5).
No.1 No.2 No.3 No.4 No.5
Valid responses: 53 Missing: 25
Valid responses: 44 Missing: 34

Page | 36
37.18%
42.31%
8.97%
11.54%
Q29. Does your institution capture data on students’ experiences with the experiential learning opportunities that
they engage in?
Yes, most programs/divisions do
Yes, some programs/divisions do butthere could be more
No, most programs/divisions do not
Not sure
53.03%
22.73%
9.09%
15.15%
Q30. Which of the following methods does your institution use to capture this data?
Both
Online surveys
Written reports from students
Other
Valid responses: 78 Missing: 0
Valid responses: 66 Missing: 12

Page | 37
64
3229
2316
4
0
10
20
30
40
50
60
70In
div
idu
al a
cad
em
icd
ep
artm
ents
Edu
cati
on
al O
pp
ort
un
ity
Fun
d P
rogr
am o
ffic
es
Stu
de
nt
Emp
loym
ent/
Fin
anci
al A
id
Stu
de
nt
Ath
leti
cs d
ep
artm
ent
Oth
er
Cu
ltu
ral C
ente
rs
Q31. Which of the following offices, if any, also help students in finding opportunities discussed in the survey? Please check all
that apply.
18.67%
32.00%
13.33%
16.00%
16.00%
4.00%
Q32. In your personal view, which of the following do you feel is the most significant barrier students face in partaking in an internship, co-op, or project-based learning experience?
Difficulty in finding a paidinternship/co-op/project-basedlearning opportunityWorking a paid job unrelated to theirmajor
Time constraints in course schedules
Not knowing what opportunities theywant to engage in
Not being aware of resources
Valid responses: 72 Missing: 6
Valid responses: 75 Missing: 3

Page | 38
44
12 11
6 53
00
10
20
30
40
50N
on
e
Gra
nts
Sch
ola
rsh
ips
Stip
end
s
Trav
el a
ssis
tan
ce
Oth
er
Dis
cou
nte
d t
uit
ion
co
sts
Pay
men
ts t
o e
mp
loye
r
Q33. Which financial supports, if any, does your institution provide to students participating in internships, co-ops, or
project-based learning. Please check all that apply.
29.87%
49.35%
15.58%
5.19%
Q34. What is the size of your institution's undergraduate population?
5,000 students or less
5,001 to 10,000 students
10,001 to 15,000 students
15,001 students or more
Valid Responses: 77Missing: 1
Valid responses: 68 Missing: 10
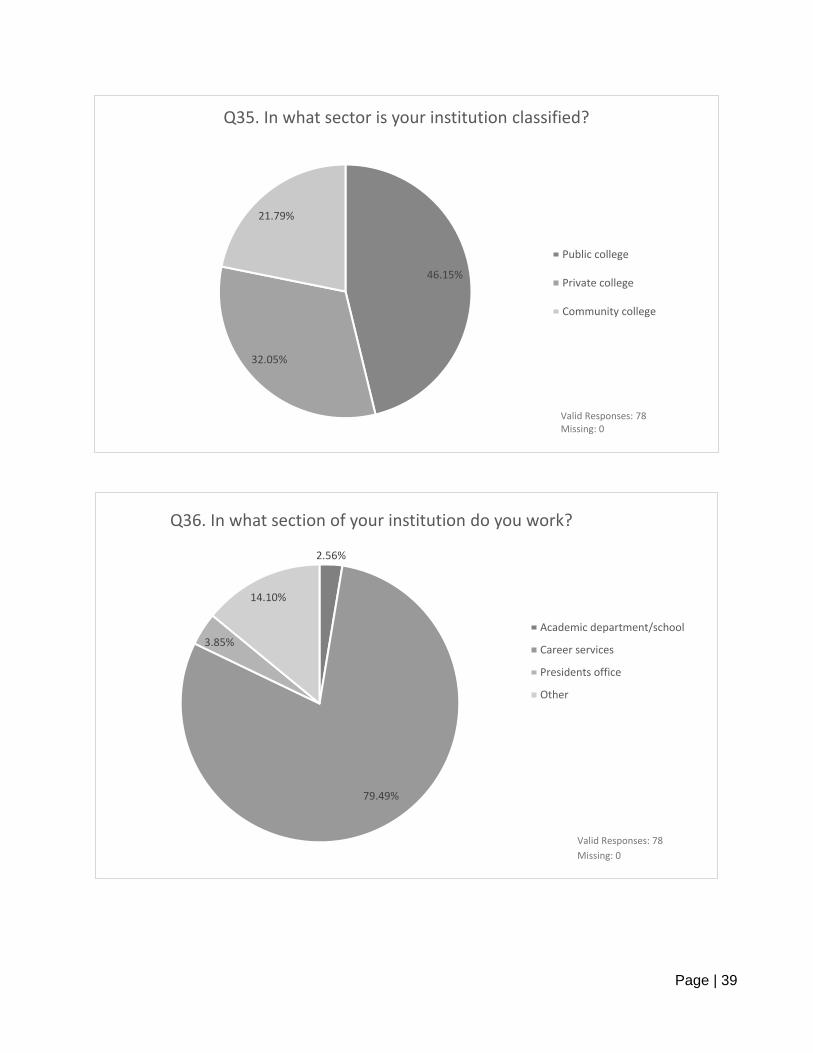
Page | 39
46.15%
32.05%
21.79%
Q35. In what sector is your institution classified?
Public college
Private college
Community college
Valid Responses: 78Missing: 0
2.56%
79.49%
3.85%
14.10%
Q36. In what section of your institution do you work?
Academic department/school
Career services
Presidents office
Other
Valid Responses: 78 Missing: 0

Page | 40
APPENDIX B: EMAIL OUTREACH FOR SURVEY PARTICIPATION
March 12, 2018
Greetings,
My name is Christopher Myles. I am part of a graduate student research team at Rutgers University that is partnering with New Jersey’s Office of the Secretary of Higher Education to develop an important report on experiential learning in New Jersey. We are seeking to gather information about internship, cooperative education, and project-based learning programs at colleges and universities across the state. The Presidents at your institutions have been notified that we are reaching out to you about our research.
I am writing to ask for your help with a key element of this project, the 2018 OSHE Experiential Learning Survey. Your responses are sincerely appreciated and integral to our research. The questionnaire contains a series of short questions, and should take less than ten minutes to complete.
Follow this link to the Survey: ${l://SurveyLink?d=Take the Survey}
Or copy and paste the URL below into your internet browser: ${l://SurveyURL}
Your thoughts on these critical experiential learning issues will give our team a better understanding of how students are engaging in hands-on learning experiences that enhance their employability. If you have already responded to this survey and would like to be removed from future emails, please feel free to unsubscribe below or email me at [email protected]. We thank you for your help with this survey.
Best, Christopher Myles
Master of Public Policy Candidate
Edward J. Bloustein School of Planning and Public Policy
Rutgers University
Follow the link to opt out of future emails: ${l://OptOutLink?d=Click here to unsubscribe}
March 15, 2018
Hello,

Page | 41
Earlier this week, I sent an email to you asking for your participation in the 2018 OSHE Experiential Learning Survey. The survey is being conducted by Rutgers graduate students on behalf of the New Jersey Office of the Secretary of Higher Education.
Follow this link to the Survey: ${l://SurveyLink?d=Take the Survey}
Or copy and paste the URL below into your internet browser: ${l://SurveyURL} Your responses to this survey will help us better understand how New Jersey students are engaging in opportunities that improve their chances of employment after graduation.
If you have already responded to this survey and would like to be removed from our email list, please feel free to unsubscribe below or email [email protected]. We appreciate you considering our request.
Best,
Christopher Myles
Master of Public Policy Candidate
Edward J. Bloustein School of Planning and Public Policy
Rutgers University
Follow the link to opt out of future emails: ${l://OptOutLink?d=Click here to unsubscribe}
March 22, 2018
Good Afternoon,
Recently, we sent an e-mail asking you to complete a survey about how you view students’
experiences with internships, cooperative education, and project-based learning. Your Presidents
have been notified about our research (see attached). While our initial deadline for the survey was
today, we are extending the open date for responses to Tuesday, March 27th, to allow for more
input.
If you have not answered the 2018 OSHE Experiential Learning Survey yet, we please urge you to do
so. It should only take less than ten minutes to complete. Simply click on the link below to begin
answering questions.
Follow this link to the Survey:
${l://SurveyLink?d=Take the Survey}
Or copy and paste the URL below into your internet browser:
${l://SurveyURL}
If you have already completed this survey, we thank you very much. We truly appreciate your help.
Please feel free to unsubscribe below if you do not wish to receive further emails.

Page | 42
This survey is very important in seeing how students learn about and gain access to experiential
learning opportunities. If you have any questions or comments, please feel free to contact me at
[email protected] or (848) 469-6931. Thank you so much.
Best,
Christopher Myles
Master of Public Policy Candidate
Edward J. Bloustein School of Planning and Public Policy
Rutgers University
Oshe2018research Follow the link to opt out of future emails:
${l://OptOutLink?d=Click here to unsubscribe}
March 27, 2018
Good Morning,
We are writing for to follow up on our requests asking for your participation in the 2018 OSHE
Experiential Learning Survey. Our assessment of student experiential learning programs at colleges
across the state is wrapping up, and this message is the last email reminder we are sending out about
the study. Your Presidents have been informed of our research (see attahced). To reiterate from our
last message, we extended the survey's timeline so that close of business TODAY is the deadline.
Follow this link to the Survey:
${l://SurveyLink?d=Take the Survey}
Or copy and paste the URL below into your internet browser:
${l://SurveyURL}
Thank you for considering participating in our research. We hope to hear your thoughts on this
important higher education issue.
Best,
Christopher Myles
Master of Public Policy Candidate
Edward J. Bloustein School of Planning and Public Policy
Rutgers University
Oshe2018research Follow the link to opt out of future emails:
${l://OptOutLink?d=Click here to unsubscribe}

Page | 43
APPENDIX C: OSHE INITIAL OUTREACH TO NEW JERSEY IHES

Page | 44
APPENDIX D: FOCUS GROUP ITEMS
Main Questions for Internship Group
● Introduce yourself (your name, program/major, year) and when/where you had your internship, cooperative education, or project-based learning experience. ● What was your reason for engaging in this opportunity?
● How did you find this opportunity?
● What was the nature of your internship (or co-op/project-based learning experience)? What kind of tasks did you regularly perform? Were you compensated and in what form (college credit, stipend, payment etc.)?
● How valuable was the experience in developing your workplace skills or deepening the knowledge you gained in the classroom? In other words, how would you say you benefited from your experience, if at all? ● Did you experience any challenges or obstacles during your experience?
● What do you think are some reasons why students would not engage in an experiential learning opportunity?
● In your college experience, have you ever worked at a job unrelated to your major? If so, did you need to leave that job in order to participate in your internship? Did working for your internship “cost” you anything (loss wages from previously held job, college tuition, etc.)?
● Where would you rank the level of importance of having an experiential learning opportunity when thinking about your priorities, responsibilities, and obligations?
● Do you have any recommendations for how your hands-on (experiential) learning experience could have been improved?

Page | 45
Internship Focus Group Pre-Discussion Questionnaire
*Handed out prior to focus group discussion
What is your first name? ____________________________________________
What is your major? ____________________________________________
What year are you?
□ Freshman
□ Sophomore
□ Junior □ Senior □ Other ______________________
Which of the following have you participated in during your undergraduate career? Please check all that apply. □ Internship □ Cooperative Education (Co-Op) □ Project-Based Learning
□ Other ______________________
Below, please feel free to jot down some notes about your experience. This will help us get started with today’s discussion. Here are some questions for guidance: Did you find the experience meaningful? What skills do you feel you gained from it? Did the experience influence your thoughts on a potential career path?
________________________________________________________________________________________________________________________________________________________________________________________________________________________________________________________________________________________________________________________________________________________________________________________________________________________________________________________________________________________________________________________________________________________________________________________________________________

Page | 46
Main Questions for Non-Internship Group
● Introduce yourself (your name, program/major, year).
● What was your reason for engaging in the focus group?
● During your undergraduate career, have you worked at a paying job that is unrelated to your major?
● We’d like to hear about the career services—career advising, etc. that you have participated in.
o In what ways were the services helpful to you? o In what ways do you feel that the services fell short in helping you reach your goals?
● What are your thoughts behind experiential learning opportunities?
o Were there certain circumstances/barriers that might have prevented you from participating in some sort of experiential learning opportunity?
● What skills do you hope to develop in future experiential learning opportunities?
● What are your thoughts on future career goals?
● What plans do you have for applying to or participating in experiential learning opportunities down the line, if any?

Page | 47
Focus Group Non-Internship Pre-Discussion Questionnaire
What is your first name? ____________________________________________
What is your major? ____________________________________________
What year are you?
□ Freshman
□ Sophomore
□ Junior □ Senior □ Other ______________________
Are you engaged in any activities outside of academics? If any, please list them in the space provided below. __________________________________________________________________________________________________________________________________________________________________________________________________________________
What skills do you think are important for the workplace? Please write any thoughts you have about this topic in the space provided below.
________________________________________________________________________________________________________________________________________________________________________________________________________________________________________________________________________________________________________________________________________________________________________________________________________________________________________________________________________________________________________________________________________________________________________________________________________________

Page | 48
Experiential Learning Focus Group Agenda
March 26, 2018
Thank you for participating in our focus group. We are looking forward to hearing your
perspective on experiential learning to include in research for our client, the New Jersey
Office of the Secretary of Higher Education (OSHE).
● Complete Focus Group Pre-Discussion Questionnaire and Consent Form
● Introduce Graduate Student Researchers
● Explain Scope of Research Project ● Research Participants Introduce Themselves
● Continue with Focus Group Questions
● Debriefing
● Gift card rewards for participating in our study
If you have any questions regarding your participation in this focus group, please feel free to contact today’s focus group leaders Kellie Palomba at [email protected], Daniyal Rahim at [email protected], or Christina Huang at [email protected].
Thank you!

Page | 49
APPENDIX E: SUMMARIZED CRITERIA FOR ASSESSMENT OF EXPERIENTIAL
LEARNING
Before starting an experiential learning opportunity, it is encouraged for students to submit a detailed report to
illustrate:
The knowledge (e.g. fundamental principles/concepts/theories) they learned in coursework that can be
possibly applied to this experience and why;
The kinds of skills are they expecting to gain from the experience and how these skills can strengthen
their future career;
The outcomes they hope to attain from the opportunity. If possible, they should provide an outline plan
based on the length of their placement;
Define how they want their work to be judged and in what way these descriptions make sense.
In the experiential learning process, a reflective portfolio will work as a progress report to allow both students
and their supervisors to participate in the experience. Students would update their work, while their instructors
would be responsible for making records of the student’s performance. The following categories should be given
attention because these categories make up the key points in evaluating the results of experiential learning:
Whether there is a true connection between what students’ have learned in class and their chosen
experiential learning opportunity;
Whether students are able to gain “soft skills” in the process, such as communication, critical-thinking
analysis, etc.;
Whether students are making progress in achieving their goals and if not, what changes need to be made
and why;
Both a student self-evaluation and instructor evaluation should be conducted at the culmination of the
opportunity. The following criteria should work as the general guideline to the assessment of
experiential learning:
o Students’ self-evaluation should start from a re-examination of their first report and then
identify:
If they applied their previous academic knowledge, learned transferable skills, and
achieved their goals. If not, what did they gain and what would have improved the
experience;
If their plan for their work function and if not, where would they have made
adjustments;
How they perceived the experience (i.e. did they consider it different from traditional
jobs).
o The instructor evaluation should focus on measuring:
Whether it was an integrative learning process;
If the student completed what they expected to accomplish and what they could
improve upon for the future.
One-on-one oral assessments between students and their instructors are also recommended, which
would provide a chance for students and their instructors to communicate about the experience.
Source: Teaching and Learning Services at McGill University. “Guidelines for Assessment of Experiential Learning.”
Montreal. 2014. https://www.mcgill.ca/tls/files/tls/guidelines_-_assessment_of_experiential_learning_1.pdf

Page | 50
SOURCES
i Stockton Polling Institute, Higher Education Strategic Information and Governance (HESIG), William J. Hughes Center
for Public Policy at The Richard Stockton College of New Jersey. “Study of Students’ Attitudes on Academic Advising and
Career Counseling Services.” Report to the Office of the Secretary of Higher Education of the State of New Jersey.
November 2014.
https://intraweb.stockton.edu/eyos/hughescenter/content/docs/HESIG/Working%20Papers/HESIG%20Student%20Survey
%20Final.pdf
ii Ibid.
iii Fede, Jacquelyn H., et al. "Student Employment as a Model for Experiential Learning." Journal of Experiential
Education, vol. 41, no. 1, 01 Mar. 2018, pp. 107-124. EBSCOhost. Web.
iv Pellegrino, J. W., & Hilton, M. L. (Eds.). Education for Life and Work: Developing Transferable Knowledge and Skills in
the 21st Century. Washington, DC: National Academies Press. 2013.
http://www.leg.state.vt.us/WorkGroups/EdOp/Education%20for%20Life%20and%20Work-
%20National%20Academy%20of%20Sciences.pdf
v Kuh, George D. “High Impact Educational Practices: What They Are, Who Has Access to Them, and Why They Matter.”
Association of American Colleges and Universities. 2008. http://provost.tufts.edu/celt/files/High-Impact-Ed-Practices1.pdf
vi National Association of Colleges and Employers. “The Key Attributes Employers Seek on Students’ Resumes.”
November 2017. http://www.naceweb.org/about-us/press/2017/the-key-attributes-employers-seek-on-students-resumes/
vii Hart Research Associated on behalf of Association of American Colleges and Universities. “Falling Short? College
Learning and Career Success.” January 2015.
https://www.aacu.org/sites/default/files/files/LEAP/2015employerstudentsurvey.pdf
viii Hanover Research for McGraw-Hill Education. “2017 Future Workforce Survey.” May 2017.
https://s3.amazonaws.com/ecommerce-prod.mheducation.com/unitas/corporate/promotions/2017-future-workforce-survey-
analysis.pdf
ix Saltikoff, Nathalie. “The Positive Implications of Internships on Early Career Outcomes.” NACE Journal, vol. 77, no. 4,
May 2017, p. 34. EBSCOhost. Web.
x Coker, Jeffrey Scott, et al. “Impacts of Experiential Learning Depth and Breadth on Student Outcomes.” Journal of
Experiential Education, vol. 40, no. 1, 01 Mar. 2017, pp. 5-23. EBSCOhost. Web.
xi Gallup and Purdue University. “Great Jobs, Great Lives: The 2014 Gallup-Purdue Index Report.” 2014.
https://www.luminafoundation.org/files/resources/galluppurdueindex-report-2014.pdf
xii Gentry, James W. "What is Experiential Learning?" Guide to business gaming and experiential learning. Nichols/GP
Pub., 1990. 10. xiii Kolb, David A. Experiential Learning: Experience as the Source of Learning and Development. Englewood Cliffs, N.J.:
Prentice-Hall, Inc., 1984. p. 41. Web. xiv Foley, Griff. "Experience-Based Learning." Andersen, Lee, David Boud and Ruth Cohen. Understanding Adult
Education and Training. Sydney: Allen & Unwin, 2001. 225-239. Web.
xv Wurdinger, Scott D. and Julie Carlson. Teaching for experiential learning: five approaches that work. Rowman &
Littlefield Education, 2009. Web.
xvi Lewis, Linda H. and Carol J. Williams. "Experiential learning: Past and present." New Directions for Adult and
Continuing Education (1994): 5-16. Web. <10.1002/ace.36719946203>.
Page | 51
xvii Tech, Virginia. Internships and co-ops: what's the difference? n.d. 4th April 2018.
https://career.vt.edu/experience/ceip/ceip-internship-coop.html
xviii Barrick, Debra. Co-op Vs. Internship: What’s the Difference? 18 November 2016. 29 April 2018.
http://www.ceiainc.org/co-op-vs-internship-whats-difference/.
xix Thomas, John W. A Review of Research on Project Based Learning. San Rafael: The Autodesk Foundation, 2000.
xx Schwartz, Michelle. “Best Practices in Experiential Learning.” Prepared for the Vice Provost, Academic, Ryerson
University. https://www.ryerson.ca/content/dam/lt/resources/handouts/ExperientialLearningReport.pdf xxi U.S. Department of Education, National Center for Education Statistics. Digest of Education Statistics, 2015. NCES
2016-014, Chapter 3. 2016. https://nces.ed.gov/fastfacts/display.asp?id=76 xxii Carnevale, Anthony et al. “Learning While Earning: The New Normal.” Georgetown University Center on Education
and the Workforce, McCourt School of Public Policy. 2015. https://cew.georgetown.edu/wp-content/uploads/Working-
Learners-Report.pdf xxiii Lederman, Doug. “The Impact of Student Employment.” Inside Higher Ed. June 2009.
https://www.insidehighered.com/news/2009/06/08/work xxiv Mayo, Lucy and Pooja Shethji. “Reducing Internship Inequity.” Diversity and Democracy, vol. 13, no. 3, Fall 2010. The
Association of American Colleges and Universities. https://www.aacu.org/publications-research/periodicals/reducing-
internship-inequity xxv Edwards, Kathryn Anne and Alexander Hertel-Fernandez. “A Proposal to Expand Educational and Economic
Opportunities for Low-Income College Students.” Dēmos and the Economic Policy Institute. 2010.
http://www.demos.org/sites/default/files/publications/PavingWay_PaidInternships_Demos.pdf
xxvi Venator, Joanna and Richard V. Reeves. “Unpaid Internships: Support Beams for the Glass Floor.” Social Mobility
Memos, Brooking Institute. July 2015. https://www.brookings.edu/blog/social-mobility-memos/2015/07/07/unpaid-
internships-support-beams-for-the-glass-floor/ xxvii Gardner, Phil. “The Debate Over Unpaid College Internships.” Intern Bridge, Inc. 2010. http://www.ceri.msu.edu/wp-
content/uploads/2010/01/Intern-Bridge-Unpaid-College-Internship-Report-FINAL.pdf xxviii Garett, Renee et al. “A Literature Review: Website Design and User Engagement.” Online Journal of Communication
and Media Technologies, vol. 6, no. 3, 2016. p. 1–14. Web.
xxix Eyler, Jane. “The Power of Experiential Education.” Liberal Education, vol. 95, no. 4, Fall 2009. The Association of
American Colleges and Universities. https://files.eric.ed.gov/fulltext/EJ871318.pdf xxx Gardner, Phil. “The Debate Over Unpaid College Internships.” Intern Bridge, Inc. 2010. http://www.ceri.msu.edu/wp-content/uploads/2010/01/Intern-Bridge-Unpaid-College-Internship-Report-FINAL.pdf xxxi Coker, Jeffrey Scott, et al. “Impacts of Experiential Learning Depth and Breadth on Student Outcomes.” Journal of
Experiential Education, vol. 40, no. 1, 01 Mar. 2017, pp. 5-23. EBSCOhost. Web.
xxxii Eyler, Jane. “The Power of Experiential Education.” Liberal Education, vol. 95, no. 4, Fall 2009. The Association of
American Colleges and Universities. https://files.eric.ed.gov/fulltext/EJ871318.pdf xxxiii University Curriculum Committee Proposal to University of Georgia Council. “Experiential Learning Requirement.”
March 2015. https://el.uga.edu/pdfs/ELPolicy.pdf
xxxiv University of Georgia Experiential Learning, Resources. “EL Funding Opportunities: Experiential Learning
Scholarships.” https://el.uga.edu/resources

Page | 52
xxxv Coker, Jeffrey Scott, et al. “Impacts of Experiential Learning Depth and Breadth on Student Outcomes.” Journal of
Experiential Education, vol. 40, no. 1, 01 Mar. 2017, pp. 5-23. EBSCOhost. Web.
xxxvi Bennington College. “Field Work Term.” http://www.bennington.edu/academics/field-work-term
xxxvii Bennington College. “Funding Your Field Work Term.” http://www.bennington.edu/field-work-term-and-career-
development/field-work-term-resources/funding-your-field-work-term
xxxviii Zimpher, Nancy. “Experiential/Applied Learning Plan.” May 2015. https://www.suny.edu/about/leadership/board-of-
trustees/meetings/webcastdocs/Tab%205%20-%20Experiential%20-%20Applied%20Learning%20Plan.pdf
xxxix SUNY Applied Learning Team. “Fast Facts.” The Umbrella: The SUNY Applied Learning Newsletter. Issue 1:
January 2017. https://www.suny.edu/media/suny/content-assets/documents/applied-learning/The-Umbrella-Issue-1.pdf
xl Hezel Associates on behalf of SUNY. “A Case Study Analysis: Student Perceptions of the SUNY Applied Learning
Program.” May 2015. https://www.suny.edu/media/suny/content-assets/documents/applied-learning/CaseStudy-Student-
Perceptions-of-SUNY-AppliedLearningProgram.pdf xli Wagner, Alan, et al. “Applied Work-Based Learning at the State University of New York: Situating SUNY Works and
Study Effects.” The Nelson A. Rockefeller Institute of Government. May 2015. http://rockinst.org/wp-
content/uploads/2017/11/2015-05-12-Applied_Work-Based-min.pdf
xlii Drexel University. “The Value of Drexel: Average Salary and More.” http://drexel.edu/about/outcomes/ xliii Brown University. “BrownConnect LINK Award Program– Linking Internships and Knowledge.”
https://www.brown.edu/campus-life/support/careerlab/index.php?q=link
xliv Rutgers University-New Brunswick. “Report of the Task Force to Enhance Experiential Education for Undergraduate
Students at Rutgers University-New Brunswick.” May 2017.
https://middlestates.rutgers.edu/sites/default/files/TaskForcetoEnhanceExperientialEducation.pdf xlv New Jersey Career Connections. “Many Paths, One Future Internship Grant Program.”
http://careerconnections.nj.gov/careerconnections/hire/hiring/paths/many_paths_one_future.shtml
xlvi Dey, Farouk and Christine Y. Cruzvergara. “10 Future Trends in College Career Services.” July 2014.
https://www.linkedin.com/pulse/20140715120812-11822737-10-future-trends-in-college-career-services
xlvii George Mason University. “George Mason University Career Services 2013-2014 Annual Report.” July 2014.
https://www.youtube.com/watch?v=CLAuJbJVO64
xlviii Rutgers University -New Brunswick: Undergraduate Academic Affairs. “Student Resources: Career Clusters.”
http://careers.rutgers.edu/page.cfm?section_ID=8&page_id=432
xlix Alexander, Andrea. “How Rutgers Helps Students Advance on Their Career Track.” Rutgers Today. April 2018.
https://news.rutgers.edu/how-rutgers-helps-students-advance-their-career-track/20180422#.WuXHPIjwZPa
l Maryland Department of Labor, Licensing, and Regulation. “EARN Maryland 2017 Annual Report.” February 2018.
https://www.dllr.state.md.us/earn/earnannrep2017.pdf