Embed Size (px)
Citation preview

Are you over staffed Are you over staffed or or
under staffed?under staffed?
Elizabeth Hanna, PhD, RD, SNSElizabeth Hanna, PhD, RD, SNS

How do you determine how much How do you determine how much staff is need in kitchens?staff is need in kitchens?
�� Same number as last yearSame number as last year
�� Kitchen manager determines hours Kitchen manager determines hours neededneeded
�� Use MealsUse Meals--PerPer--LaborLabor--Hour (MPLH) Hour (MPLH) formulaformula
�� Evaluate labor cost, assign hours based Evaluate labor cost, assign hours based on coston cost
�� OtherOther

Purpose of ResearchPurpose of Research
�� Investigate management and financial Investigate management and financial attributes perceived by directors that attributes perceived by directors that impact performance measuresimpact performance measures
�� Investigate whether widely used Investigate whether widely used performance measures were relevantperformance measures were relevant

Surveyed Public School DistrictsSurveyed Public School Districts
�� Student enrollments: 2,500 Student enrollments: 2,500 -- 10,000 10,000 ((N=2,534)N=2,534)�� Based on NCES, 2005Based on NCES, 2005
�� With email addressWith email address
�� RespondentsRespondents�� 740740

Two SurveysTwo Surveys
Survey 1: Opinion SurveySurvey 1: Opinion Survey
�� Attitude about and use of performance Attitude about and use of performance measuresmeasures
�� Use of convenience foods and Use of convenience foods and disposablesdisposables
�� Factors that affect MPLHFactors that affect MPLH

Two Surveys, Two Surveys, conticonti
Survey 2: Convenience Sample (Survey 2: Convenience Sample (NN=32)=32)
Calculated MPLH and RevenueCalculated MPLH and Revenue--PerPer--Dollar Dollar Expense (RPDE)Expense (RPDE)

Demographics of RespondentsDemographics of Respondents
�� 80% has student enrollments between 80% has student enrollments between 3,000 and 9,9993,000 and 9,999
�� 82.5% offered 2, 3, or 4 federal child 82.5% offered 2, 3, or 4 federal child nutrition programsnutrition programs
�� 86.2% were self86.2% were self--operatedoperated
�� 57.8 were non57.8 were non--unionized unionized

Demographics, Demographics, conticonti
�� Type of kitchens, many districts have more Type of kitchens, many districts have more than one type of kitchenthan one type of kitchen�� OnsiteOnsite 93.3%93.3%
�� BaseBase 49.3%49.3%
�� Central Central 9.0%9.0%

Factors That Affect Labor HoursFactors That Affect Labor Hours
�� Workplace environmentWorkplace environment�� Service & preparation characteristicsService & preparation characteristics�� Serving methodsServing methods�� Human resources characteristicsHuman resources characteristics�� Staff characteristicsStaff characteristics�� Miscellaneous department characteristicsMiscellaneous department characteristics�� Availability of a la carte itemsAvailability of a la carte items�� Amount of convenience food usedAmount of convenience food used

Most Frequently Used Performance Most Frequently Used Performance MeasuresMeasures
�� FinancialFinancial
�� AccountingAccounting
�� ParticipationParticipation
�� MPLHMPLH

FinancialFinancial
�� All salesAll sales
�� ReimbursementReimbursement
�� ExpensesExpenses
�� Profit/loss statementsProfit/loss statements
�� Operating budgetOperating budget
�� Balance sheetBalance sheet
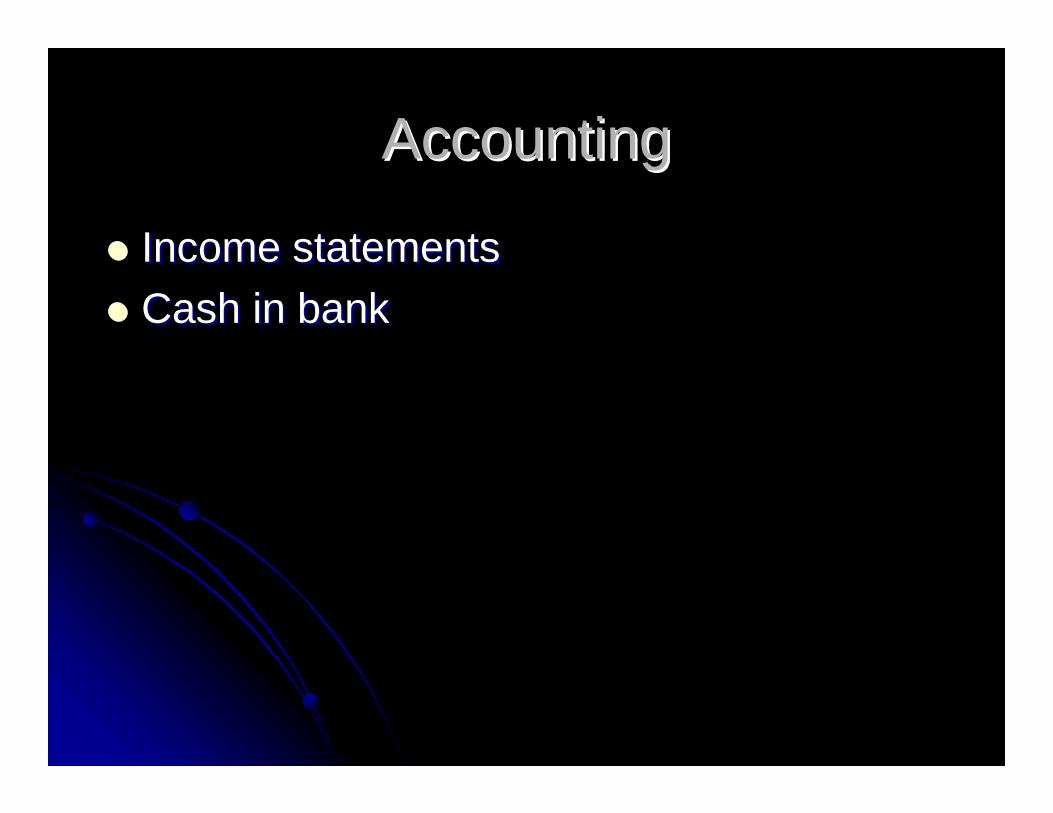
AccountingAccounting
�� Income statementsIncome statements
�� Cash in bankCash in bank

ParticipationParticipation
�� By buildingBy building
�� By categories, i.e., free, reduced, paidBy categories, i.e., free, reduced, paid
�� By program, i.e., breakfast, lunch, snackBy program, i.e., breakfast, lunch, snack
�� Average Daily ParticipationAverage Daily Participation
�� àà la carte salesla carte sales

Meals Per Labor Hour FormulaMeals Per Labor Hour Formula
Number of meals or meal equivalentsNumber of meals or meal equivalents
Number of paid productive labor hoursNumber of paid productive labor hours
Carter, 2005Carter, 2005

Meal Equivalent (ME)Meal Equivalent (ME)
�� 1 Lunch = 1 ME1 Lunch = 1 ME
�� Breakfast X .66 = 1 MEBreakfast X .66 = 1 ME
�� 3 Snacks = 1 ME3 Snacks = 1 ME
�� àà la carte or other revenue divided by free la carte or other revenue divided by free lunch reimbursement and commodity lunch reimbursement and commodity value per meal = 1 MEvalue per meal = 1 ME
Carter, 2005Carter, 2005

Meals Per Labor Hour (MPLH) by Type of Kitchen and Enrollment for School District Foodservice Operations Providing Detailed Financial Information (N = 34)
5.95.917.417.436.136.17.47.429291717TotalTotal
6.06.019.719.736.136.112.112.11515776,000 6,000 –– 10,00010,000
3.83.815.315.320.720.78.08.099774,000 4,000 –– 5,9995,999
7.27.214.314.324.124.17.47.455333,000 3,000 –– 3,9993,999
Production site serving more than 1 Production site serving more than 1 school by districtsschool by districts’’ student enrollmentstudent enrollment
7.77.717.117.147.747.71.61.61521521717TotalTotal
4.84.816.716.728.328.31.61.66464666,000 6,000 –– 10,00010,000
10.310.320.720.747.747.74.04.05252554,000 4,000 –– 5,9995,999
4.14.112.312.320.120.14.84.83131553,000 3,000 –– 3,9993,999
3.43.414.114.117.817.88.88.855112,500 2,500 –– 2,9992,999
Onsite production and service site by Onsite production and service site by districtsdistricts’’ student enrollmentstudent enrollment
HighHighLowLow
SDSDMean Mean MPLHMPLH
Range of MPLHRange of MPLH# of # of kitchenskitchens
# of # of districtsdistricts

aDistricts had more than one type of kitchen or site, thus sum of totals exceeds the number of districts. For example, one district had one onsite kitchen, one production kitchen, and nine satellite sites.
Satellite or finishing site by Satellite or finishing site by districtsdistricts’’ student enrollmentstudent enrollment
11.111.121.721.772.472.41.61.62842843434aaGrand totalGrand total
4.24.227.727.724.024.023.723.73322TotalTotal
3.23.221.721.724.024.019.419.422116,000 6,000 –– 10,00010,000
——27.727.727.727.727.727.711114,000 4,000 –– 5,9995,999
Central kitchen by districtsCentral kitchen by districts’’ student student enrollmentenrollment
12.112.127.127.172.472.429.929.91001001818TotalTotal
13.413.431.331.372.472.47.17.15252886,000 6,000 –– 10,00010,000
10.310.329.029.047.247.210.110.13939774,000 4,000 –– 5,9995,999
10.410.425.125.145.145.17.17.199333,000 3,000 –– 3,9993,999
SDSDHighHighLowLow
Mean Mean MPLHMPLH
Range of MPLHRange of MPLH# of # of kitchenskitchens
# of # of districtsdistricts
Meals Per Labor Hour (MPLH),Conti.

Comparison of Findings to Comparison of Findings to Established StandardsEstablished Standards
�� Established standards are from Established standards are from School School Foodservice Management for the 21st Foodservice Management for the 21st Century Century (5th ed.)(5th ed.), , by D. Pannellby D. Pannell--Martin, Martin, 1999, pp. 1551999, pp. 155--156, Alexandria. VA: 156, Alexandria. VA: inTEAMinTEAM Associates. Associates.
�� Special thanks to Dorothy PannellSpecial thanks to Dorothy Pannell--Martin Martin for her permission for her permission
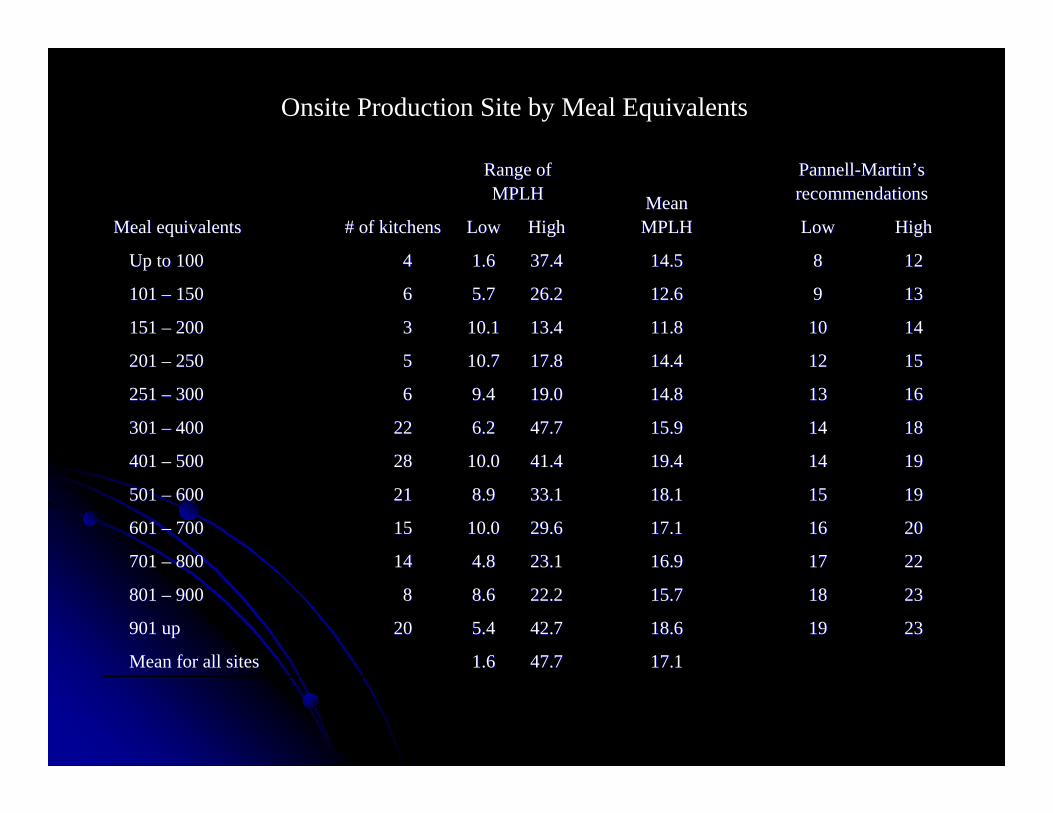
Onsite Production Site by Meal Equivalents
17.117.147.747.71.61.6Mean for all sitesMean for all sites
2323191918.618.642.742.75.45.42020901 up901 up
2323181815.715.722.222.28.68.688801 801 –– 900900
2222171716.916.923.123.14.84.81414701 701 –– 800800
2020161617.117.129.629.610.010.01515601 601 –– 700700
1919151518.118.133.133.18.98.92121501 501 –– 600600
1919141419.419.441.441.410.010.02828401 401 –– 500500
1818141415.915.947.747.76.26.22222301 301 –– 400400
1616131314.814.819.019.09.49.466251 251 –– 300300
1515121214.414.417.817.810.710.755201 201 –– 250250
1414101011.811.813.413.410.110.133151 151 –– 200200
13139912.612.626.226.25.75.766101 101 –– 150150
12128814.514.537.437.41.61.644Up to 100Up to 100
HighHighLowLowHighHighLowLow# of kitchens# of kitchensMeal equivalentsMeal equivalents
PannellPannell--MartinMartin’’ s s recommendationsrecommendationsMeanMean
MPLHMPLH
Range of Range of MPLHMPLH

18.518.536.136.17.97.9Mean for all sitesMean for all sites
13013011011021.721.724.024.019.419.4225,001 5,001 –– 9,9999,999
8585757519.119.122.822.813.813.8333,001 3,001 –– 5,0005,000
7575656516.716.721.221.212.812.8442,001 2,001 –– 3,0003,000
5555454518.618.627.727.712.112.114141,000 1,000 –– 2,0002,000
3535303019.819.836.136.17.97.966501 501 –– 1,0001,000
323225258.38.38.38.38.38.311200 200 –– 500500
HighHighLowLow
MeanMean
MPLHMPLHHighHighLowLowMeal equivalentsMeal equivalents
PannellPannell--MartinMartin’’ s s recommendations recommendations Bulk, Bulk, hothotbb or or coldcoldcc
Range of Range of MPLHMPLH
# of # of kitchenskitchens
Food Production for More than One School
bBulk cold: food cooked, then chilled or frozen (e.g. cook-chill system) and transported for finishing off in the satellite school, thus requires heating at site before serving.cBulk hot: food cooked and maintained hot through transporting and serving at satellite school.

29.929.972.472.47.17.1Mean for all sitesMean for all sites
3737303021.821.836.636.612.912.91313700 up700 up
3333262642.042.066.766.717.917.977501 501 –– 700700
3333262635.935.953.953.918.418.42121401 401 –– 500500
3131262635.535.572.472.410.110.12626301 301 –– 400400
2929222224.624.641.041.017.017.01616201 201 –– 300300
2626202019.719.731.831.87.17.11111101 101 –– 200200
2323181816.616.626.526.59.39.33376 76 –– 100100
HighHighLowLow
MeanMean
MPLHMPLHHighHighLowLow# of # of
kitchenskitchensMeal equivalentsMeal equivalents
PannellPannell--MartinMartin’’ s s recommendations recommendations Bulk, Bulk, hothotbb or or coldcoldcc
Range of Range of MPLHMPLH
Satellite or finishing kitchens
bBulk cold: food cooked, then chilled or frozen (e.g. cook-chill system) and transported for finishing off in the satellite school, thus requires heating at site before serving.cBulk hot: food cooked and maintained hot through transporting and serving at satellite school.

Revenue Per Dollar ExpenseRevenue Per Dollar Expense
Revenue Revenue ..Productive Labor Costs + Cost of Goods SoldProductive Labor Costs + Cost of Goods Sold

1.111.112.062.060.390.395575578.98.93434TotalTotal
1.101.101.501.500.880.8862262211.611.61313aa6,000 6,000 –– 10,00010,000
1.211.212.062.060.540.545025028.58.512124,000 4,000 –– 5,9995,999
1.001.001.591.590.390.394894895.65.6883,000 3,000 –– 3,9993,999
1.041.043203205.05.0112,500 2,500 –– 2,9992,999
RPDERPDEHighHighLowLowper siteper siteper districtper districtdistrictsdistrictsEnrollmentEnrollment
MeanMeanRange of RPDERange of RPDEMean meal Mean meal equivalentsequivalents
Mean # of Mean # of production & production & service sitesservice sites# of# of
aTwo districts did not report number of sites.
Revenue Per Dollar Expense