Embed Size (px)
Citation preview

LA-12986
,.
, .
~o.J _d aJ. ,qqs ER_ TD:ti-5~011
Area G Perimeter Surface-Soil and
Single-Stage Water Sampling
Environmental Surveillance for Fiscal Year 1993
ER Record J.D.# 52014
Los Alamos NATIONAL LABORATORY
Los Alamos National LAboratory is operated by the University ofCalifomu for the United States Department of Energy under contract W-7405-ENG·

Edited by Martin R. Riehm, B. I. Literary Services,for Group CIC-1
An Affirmative Action/Equal Opportunity Employer
This rqx1rt was prepared as an account of work sponsored Uy an agency of the United States G~ment. Neither The Regents of the University ofCalifornill, the United States Government nor any agency thereof, nor any of their employees, makes any warranty, erpress or implied, or assumes any legal liAbilrty or responsibility for the accuracy, completeness, or usefulness of any information, apparatus, product, or process disclosed, or represents that its use would not infringe privately owned rights. RLjerence herein to any specific commerciAl product, process, or service IJy trade name, trademark, manufacturer, or otherwise, does not necessarily constitute or imply its endorsement, recommendahon, or favoring IJy The Regents of the University of Californill, the United States ~ment, or any agency thereof. The views and opinions of authors erpressed herein do not necessarily state or reflect those of The Regents of the University of California, the United States ~ment, or any agency thereof.

Area G Perimeter Surface-Soil and Single-Stage Water Sampling Environmental Surveillance for Fiscal Year 1993
Ron Conrad Marquis Childs Catherine Rivera-Dirks Fawn Coriz
Los Alamos NATIONAL LABORATORY
Los Alamos, New Mextco 87545
LA-12986
UC-902 Issued: July 1995
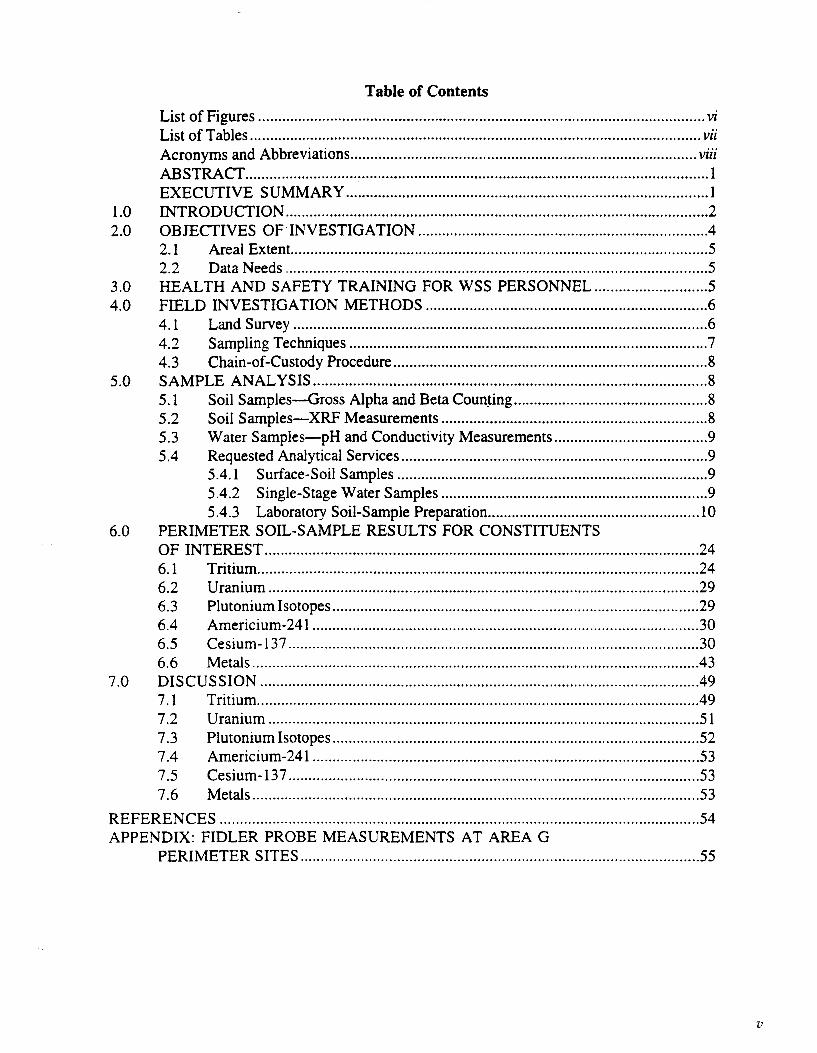
Table of Contents
List of Figures ............................................................................................................... vi List of Tables ................................................................................................................ vii Acronyms and Abbreviations ...................................................................................... viii ABSTRACT ................................................................................................................... I EXECUTIVE SUMMAR¥ .......................................................................................... 1
1.0 INTRODUCTION ......................................................................................................... 2 2.0 OBJECTIVES OF INVESTIGATION ....................................................................... .4
2.1 Areal Extent. ....................................................................................................... 5 2.2 Data Needs ......................................................................................................... 5
3.0 HEALTH AND SAFETY TRAINING FOR WSS PERSONNEL ............................ 5 4.0 FIELD INVESTIGATION METHODS ...................................................................... 6
4.1 Land Survey ....................................................................................................... 6 4.2 Sampling Techniques ......................................................................................... 7 4.3 Chain-of-Custody Procedure .............................................................................. 8
5.0 SAMPLE ANALYSIS .................................................................................................. 8 5.1 Soil Samples-Gross Alpha and Beta Coun~ing ................................................ 8 5.2 Soil Samples-XRF Measurements .................................................................. 8 5.3 Water Samples-pH and Conductivity Measurements ...................................... 9 5.4 Requested Analytical Services ............................................................................ 9
5.4.1 Surface-Soil Samples ............................................................................. 9 5.4.2 Single-Stage Water Samples .................................................................. 9 5.4.3 Laboratory Soil-Sample Preparation ..................................................... 10
6.0 PERIMETER SOIL-SAMPLE RESULTS FOR CONSTITUENTS OF INTEREST ............................................................................................................ 24 6.1 Tritium .............................................................................................................. 24 6.2 Uranium ........................................................................................................... 29 6.3 Plutonium Isotopes ........................................................................................... 29 6.4 Americium-241 ................................................................................................ 30 6.5 Cesium-137 ...................................................................................................... 30 6.6 Metals ............................................................................................................... 43
7.0 DISCUSSION ............................................................................................................. 49 7.1 Tritium .............................................................................................................. 49 7.2 U rani urn ........................................................................................................... 51 7.3 Plutonium Isotopes ........................................................................................... 52 7.4 Americium-241 ................................................................................................ 53 7.5 Cesium-137 ....... , .............................................................................................. 53 7.6 Metals ............................................................................................................... 53
REFERENCES .............................................................................. , ........................................ 54 APPENDIX: FIDLER PROBE MEASUREMENTS AT AREA G
PERIMETER SITES ................................................................................................... 55
v
List of Figures
Figure 1: Location ofT A-54 and Area G at Los Alamos National Laboratory .......................... 3
Figure 2: Perimeter sampling network established at Area G ............. (inside back cover pocket)
Figure 3: Tritium soil-sample locations and analytical results at Area 0 .................................. 25
Figure 4: Tritium analytical results for the filtered-water fraction from
single-stage samples at Area 0 ................................................................................. 27
Figure 5: Uranium soil-sample locations and analytical results at Area 0 ................................ 31
Figure 6: Uranium analytical results for the filtered-water fraction from
single-stage samples at Area 0 ................................................................................. 33
Figure 7: Total isotopic plutonium soil-sample locations and analytical results
at Area 0 .................................................................................................................. 35
Figure 8: Total isotopic plutonium analytical results for the filtered-water fraction
from single-stage samples at Area 0 ........................................................................ 37
Figure 9: Total isotopic plutonium analytical results for sediments from
single-stage samples at Area 0 ................................................................................. 39
Figure 10: Americium-241 soil-sample locations and analytical results at Area G ................. .41
Figure 11: Cesium-137 soil-sample locations and analytical results at Area G ....................... .45
Figure 12: Cesium-137 analytical results for the filtered-water fraction from
single-stage samples at Area G .............................................................................. .4 7
Appendix Figure 1: Scatter plot of FIDLER surveillance counts of low-energy
gamma activity around the periphery of Area G ....................................... 60

List of Tables
Table 1: 1993 TA-54 Area G (OU 1148) perimeter soil data ................................................... 11
Table 2: 1993 TA-54 Area G (OU 1148) water fraction data from
single-stage samplers .................................................................................................. l5
Table 3: 1993 TA-54 Area G (OU 1148) sediment fraction data from
single-stage samplers .................................................................................................. 20
Appendix Table 1: FIDLER surveillance counts of low-energy gamma activity around the
periphery of Area 0 .................................................................................... 58
vii
viii
cpm
CST
ER
ESH
FIDLER
FIMAD
HAZWOPER
keV
LANL
MDA
J.Lg J.Lmhos
J.lm NAD
ou pCi
RAS
RCRA
RFI
ROI
SOP
TA
TRU
TWISP
WILD
wss XRF
Acronyms and Abbreviations
counts per minute
Chemical Science and Technology Division, LANL
Environmental Restoration Project, LANL
Environment, Safety, and Health Division, LANL
field instrument for detection of low-energy radiation
Facility for Information Management and Display
hazardous waste operations
kiloelectron volts (103 electron volts)
Los Alamos National Laboratory
material disposal area
microgram ( 1 Q-6 grams)
micro mhos ( 1 Q-6 ohms- I, a measure of conductance)
micrometer ( 1 Q-6 meters)
North American Datum
Operable Unit
picocurie ( 1 Q-12 curies)
radioactivity/alpha spectroscopy
Resource Conservation and Recovery Act
RCRA Facility Investigation
(spectral) region of interest
standard operating procedure
Technical Area
transuranic (waste)
Transuranic Waste Inspection Project
brand-name surveying station
Waste Site Studies
x-ray fluorescence

AREA G PERIMETER SURFACE-SOIL
AND SINGLE-STAGE WATER SAMPLING
Environmental Surveillance for Fiscal Year 1993
by
Ron Conrad, Marquis Childs, Catherine Rivera-Dirks, and Fawn Coriz
ABSTRACT ESH -19 personnel collected soil and single-stage water samples around the
perimeter of Area Gat Los Alamos National Laboratory to characterize possible contaminant movement through surface-water runoff. These samples were analyzed for tritium, total uranium, isotopic plutonium, americium-241 (soil only), and cesium-137. The metals, mercury, lead, and barium, were analyzed using xray fluorescence.
Elevated levels of tritium (as high as 117,200 pCi/L) were found in soil samples along the eastern half of the north side of Area G. To the east and south of the transuranic waste pads, the soil samples showed slight increases (3000-5000 pCi/L) above baseline tritium levels (100-1000 pCi/L for Area G soils). Only one single-stage water sample had a tritium activity greater than 2000 pCi!L. Although we propose two subsurface-to-surface tritium migration mechanisms, we do not know how well our sample results reflect possible fluctuations in the Area G near-surface tritium distribution.
The uranium soil concentrations had an average value of 2.59 ± 0. 70 Jlg/g. For soil samples, the average plutonium-238 activity was 0.28 ± 0.80 pCi/g and the average for total plutonium-239 and -240 was 0.21 ± 0.51 pCilg. The locations of elevated plutonium readings in soil samples were consistent with the history of plutonium disposal at Area G, which was also reflected in the americium-241 results. Cesium-137 activities in soils had a wide distribution and ranged from 0.019-2.38 pCi/g. Soil mercury was detected in only 5 out of 83 samples, with the highest value at 6.1 Jlg/g. Other metal concentrations were found within natural background ranges.
EXECUTIVE SUMMARY
Area G, in Technical Area 54, has been the principal facility at Los Alamos National
Laboratory for the storage and disposal of low-level and transuranic (TRU) radioactive waste since
1957. Our investigation focused principally on the possibility of contaminated sediment
movement through surface-water runoff out of the site perimeter. Soil samples were analyzed for
tritium, total uranium, isotopic plutonium, americium-241, and cesium-137. The metals, mercury,
lead, and barium, were analyzed using x-ray fluorescence. Filtered-water fractions from single
stage collectors were analyzed for tritium, isotopic plutonium, total uranium, and cesium-137.
Filtered-sediment fractions were analyzed for isotopic plutonium only.
Elevated levels of tritium (as high as 117,200 pCi/L) in soil were found for sampling
locations along the eastern half of the north side of Area G. To the east and south of the TRU
1

2
pads, the soil samples showed slight increases (3~5000 pCi/L) above baseline tritium levels
(100-1000 pCi/L for soils in Area G). Six single-stage water samples had tritium activities over
1000 pCi/L, but in FY 93 only one single-stage water sample had a tritium activity greaterthan
2000 pCi/L. Two primary mechanisms, vapor-phase transport or capillary action, may allow
tritium to move from subsurface soils to surface soils. Tritium's residence time in surface soils is
unknown, however, and we do not know how well our sample results reflect tritium's actual
distribution at Area G.
The uranium concentrations ranged from 1.1-5.3 J.Lg/g with an average value of
2.59 ± 0. 70 J.Lg/g, slightly above background concentrations for soil uranium found throughout the
Laboratory. Plutonium-238 activities ranged from 0.001-4.987 pCi/g with an average of0.28 ± 0.80 pCi/g. The total activities for plutonium-239 and -240 ranged from 0.001-1.944 pCi/g with
an average of 0.21 ± 0.51 pCi/g. The locations of elevated plutonium readings were consistent
with the history of plutonium disposal at Area G: the sampling stations adjacent to the TRU pads
and the oldest disposal pits had the highest plutonium levels for both surface-soil and single-stage
sediment samples. The two areas of elevated americium-241 activity reflected the elevated
activities found for plutonium. Cesium-137 activities in soils had a wide distribution and ranged
from 0.019-2.38 pCi/g. The interpretation of the cesium-137 distribution may have to await
additional results from future studies.
Soil mercury was detected in only 5 out of 83 samples, and of these 5 samples, the highest
value was 6.1 J.Lg/g. Barium and lead concentrations around the Area G perimeter were found
within the expected natural background concentration ranges as reported by Longmire et al. ( 1995).
1.0 INTRODUCTION
Area G, in Technical Area 54 (TA-54), has been the principal facility at Los Alamos National
Laboratory (LANL or the Laboratory) for the storage and disposal of low-level and TRU
radioactive waste since 1957 (see Figure 1). From the environmental surveillance standpoint, one
question that has to be addressed is whether there has been an impact on the surrounding
environment from the disposal operations that have taken place at Area G. One aspect of this
question is whether contamination associated with surface soil within Area G somehow migrates
off-site. The two most likely pathways (ignoring the improbable ground water pathway) for
spread of radioactive contamination from Area G surface sediments are airborne dispersion of
particulate matter (and tritium in the form of water vapor) and off-site movement of contaminated
sediments and/or dissolved chemical compounds by surface-water runoff. This investigation was
carried out, in part, to ensure ongoing compliance with DOE order 5400.1, "General
Environmental Protection Program" (June, 1990), and DOE order 5820.2A, "Radioactive Waste
Management" (September, 1988).

SANTA FE NATIONAL FOREST
0 0.5
0 0.5 1 2 km
cARTography by A. Kron 9114/93
----- Los Alamos Nat1onal Laboratory boundary
---------------- Technical area boundary ==---- Major paved road
Laboratory road
\
71 'v, 7 -lt
··--- ... __ ~~ -. -
70 '-\. -; ;"
I 33 (-
\ y' I I'
\ _,........,
I ~--\ _/ I, ... ...--
Figure 1: Location ofT A-54 and Area Gat Los Alamos National Laboratory. The 74 technical areas (TAs) of the Laboratory are shown here. with TA-54 located south of the San Ildefonso Indian Reservation. Area G (in gray) runs along Mesita del Buey and parallels Pajarito Road.
Our investigation focuses principally on the possibility of contaminated sediment movement
through surface-water runoff out of the perimeter of Area G. Extensive surface-soil and surface
water-runoff sampling was initiated in FY 93 around the perimeter of Area G. Sampling locations
were intentionally selected to best indicate possible contamination moving outside the perimeter of
Area G; thus, these sampling locations should be considered as those locations most sensitive to
possible contaminant migration. The data collected during FY 93 can be used to
l. determine whether there has been movement of contaminants out of the site and
3

4
2. establish baseline concentrations for possible contaminants of concern for future
Area-G surveillance effons.
Sediment movement out of Area G via the surface-water pathway is important because this is
the major mechanism for disseminating nongaseous contaminants from the surface of Area G to
outlying areas. Contamination of the ground surface of Area G may have resulted from
I. dispersion of material from active pits by natural phenomena and anthropic activities;
2. movement of contaminated sediments off the TRU pads or other disposal areas by
wind, surface-water runoff, mass wasting, or anthropic activities;
3. capillary action or vapor movement of buried, radioactive contaminants in pits and
shafts to the surface;
4. inadvenent spills or discharges from facilities or vehicles handling contaminated
materials;
5. dispersion of radioactive material from trucks carrying waste into Area G; and
6. transport of contaminated materials to the surface by burrowing animals or vegetation.
Radioactive surface contamination has been documented within the confmes of Area G, and it is
important to determine if these contaminants are moving off the mesa top to areas where the public
may be exposed or to where there may be a detrimental impact to the environment.
To this end, an extensive perimeter sampling network has been established at Area G (Figure
2, inside back cover pocket).
2.0 OBJECTIVES OF INVESTIGATION
The objectives of these investigations are to
I. define those perimeter locations at Area G where concentrations of radioactive
contaminants are expected to be elevated in surface soils or where surface-water-runoff
channels are established;
2. quantify the levels of radioactive and several RCRA metal contaminants in surface soils
and in surface-water runoff at Area G and compare baseline levels from surface-soil
samples taken in adjacent, nonimpacted locations; or
3. provide data that can serve as a baseline for contaminant concentrations to compare
with future data from subsequent surveillance projects; and
4. document whether contaminants (either dissolved in water or as sediments) are moving
off-site through surface-water runoff.
Enhanced Area G surveillance is expected on an annual basis (depending on funding) in order
to provide an up-to-date picture of existing radioactive (and other constituent) contamination in
surface soils and surface-water runoff. Eventually, any measurable impacts on adjacent areas can
be documented by comparing these data with those from future surveillance efforts.
2.1 Areal Extent
The investigation to define off-site migration of radionuclides is limited to the near mesa top
perimeter outside the fence of Area G, the hillsides directly below Area G, and one major drainage
within the disposal area itself. Surface-soil sampling stations and single-stage water samplers
were installed in small arroyos or rivulets cut into the hillsides around the perimeter of Area G.
The single-stage-sampler locations are designed to collect runoff either on the mesa top Gust
outside the fence line) or at points before the runoff enters the bottom of the two adjoining
canyons, Canada del Buey and Pajarito Canyon.
This study is not intended to defme potential contamination in the environment downstream
from Area G. The sediments in the canyon bottoms, surface water, and ground water from wells
located downstream from Area G are all monitored on an annual basis by Environmental Safety
and Health Division, Group 18 (ESH-18).
2.2 Data Needs
The data needs for the perimeter surveillance study are
I. surveyed sample locations with specifications of 0.1-ft accuracy in the horizontal plane
and 1.0-ft accuracy in the vertical plane with northings and eastings referenced to NAD
1983,
2. surface-soil samples (0--6 in. deep) from preexisting runoff pathways just outside the
Area G perimeter fence,
3. surface-water-runoff samples collected with single-stage samplers from minor runoff
pathways that were estimated to have significant runoff volumes originating in Area G,
4. analyses of soil samples for those constituents listed below in Section 5.4, and
5. analyses of all s~ace-water-runoff samples for constituents listed below in
Section 5.4.
Several perimeter locations to the west of active operations at Area G also were sampled to
provide guidelines for analyte background levels in surface soil and water. These baseline sites are
located where no radioactive-waste disposal has occurred, along the perimeter of the area into
which Area G is expected to expand. In FY 94 a grid was established in this area, just west of the
old Area G gate. Surface-soil and water samples from this area were analyzed for the constituents
listed in Section 5.4. In the future, these data will serve as baseline concentrations for constituents
of interest at new disposal locations for Area G.
3.0 HEALTH AND SAFETY TRAINING FOR WSS PERSONNEL
All field work was performed by members of the ESH-19 Waste Site Studies (WSS) team.
Each member of the team received and was up-to-date for the following training:
General Employee Training (GET)
5

6
24- or 40-hour HAZWOPER Courses
Annual 8-hour HAZWOPER Refresher Courses
HAZWOPER Supervisor Course (if applicable)
Rad Worker I or IT Courses
CPR and First Aid Courses
All-Terrain Vehicle Safety Instruction
Area G Site-Specific Training
All members of the team also received radiation support personnel training, which allowed them to
competently operate the ESP-I beta/gamma and Model 139 alpha meters and to perform routine
frisking and radiation screening operations.
All field work was done according to the WSS site-specific Health and Safety Plan (HASP)
for Area G. All members of the team read and signed the HASP and agreed to abide by the plan.
In addition, each team member watched the Area G site-specific training video, was aware of
the health and safety rules and guidelines under which Area G employees operate, and performed
all field duties according to the Area G in-house health and safety protocols. Each WSS team
member formally checked in and out of Area G daily if the work was within Area G. Work
outside the fence at Area G did not require formal check-ins. Each field task was performed using
the buddy system: at no time did team members undertake a task at Area G without another team
member being present. Finally, all team members were also enrolled in an annual LANL medical
surveillance program.
4.0 FIELD INVESTIGATION METHODS
Accepted techniques were used to identify and certify sampling locations, install sampling
equipment, take samples, and make measurements on these samples. A summary of field
protocols is found in the following sections.
4.1 Land Survey
A WILD brand electronic theodolite, complete surveying station was used in the field. This
equipment was used and field data were collected using WILDsoft 2000 software for data
reduction. Bill Kopp, a LANL technical staff member and professional engineer registered in the
State of New Mexico, supervised all of the surveying for this project.
At all of the sampling locations, an aluminum stake was emplaced to memorialize the
position. A brass tag that was stamped with the unique site identification number was attached to
each stake.
The unique sampling locations at the perimeter of Area G were coded as G-##-0#. The first
two numbers after "G" in the sequence refer to one of seventy permanent survey monuments,
each of which is identified by a piece of rebar driven into the ground and tagged with an aluminum

cap marked with the location number. These 70 monuments were originally installed as part of the
old A411 material disposal area (MDA) low-energy gamma (FIDLER) study to characterize
potential movement of radioactive contaminants off-site. FIDLER readings are still taken on an
annual basis at each of these 70 locations; the data collected in FY 93 are found in Appendix A of
this report. For the perimeter surveillance study, the soil and single-stage sampling sites were
numbered in reference to these 70 permanent, surveyed locations. For instance, two soil or
combination soil/single-stage sampling sites are sited near monument MDA-24. These locations
are identified by a tagged aluminum stake with tags G-24-1 and G-24-2. The letters "S" and/or
"W" on the brass tag indicated whether these sites are for soil only, water only, or both types of
samples as follows:
1. surface-soil samples only ("S" on tag),
2. single-stage water samples only ("W'' on tag), and
3. surface-soil and single-stage water samples ("S" and "W'' on tag).
On the map depicting the perimeter surveillance locations (Figure 2), soil-sample points are in
orange, single-stage water sample points are in blue, and the combination points for surface-soil
and single-stage samples are in green. This map was prepared by the Facility for Information
Management and Display (FIMAD). These coordinates are referenced to NAD 1983.
4.2 Sampling Techniques
The following standard sampling and instrument procedures, adopted by the WSS team to
collect and preserve the soil and water samples and to make associated measurements, were used
during this investigation:
SOP Number
LANL-ER-SOP-01.02
LANL-ER-SOP-01.06
LANL-ER-SOP-03.01
LANL-ER-SOP-06.03
LANL-ER-SOP-06.09
LANL-ER -SOP-06.29
LANL-ER-SOP-10.04
LANL-ER-SOP-14.01
LANL-ESH-8-008
Title
Sample Containers and Preservation
Management of RFI -Generated Waste
Land Surveying Procedures
Sampling for Volatile Organics
Spade and Scoop Method for Collection of Soil Samples
Single-Stage Sampling for Surface-Water Runoff
MCA-465/FIDLER Instrument System
Berthold Low Alpha and Beta Activity Counter. Calibration, Quality Control, Detection Limit, and Use
General Field Work
Spectrace 9000 Instrumental Procedure for XRF Measurement
DOE GJffMC-07(83), UC-70A "Procedures for Field Chemical Analyses of Water Samples," by Nic Korte and Dennis Ealey
7
8
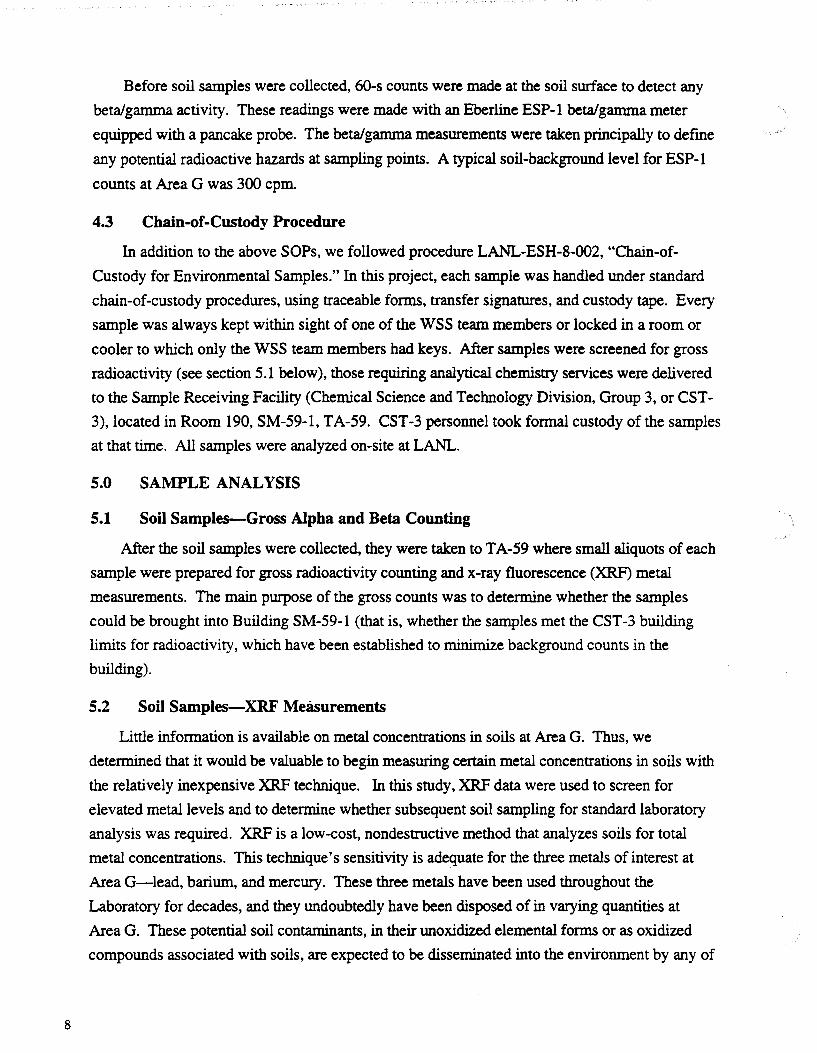
Before soil samples were collected, 60-s counts were made at the soil surface to detect any
beta/gamma activity. These readings were made with an Eberline ESP-I beta/gamma meter
equipped with a pancake probe. The beta/gamma measurements were taken principally to defme
any potential radioactive hazards at sampling points. A typical soil-background level for ESP-I
counts at Area G was 300 cpm.
4.3 Chain-of-Custody Procedure
In addition to the above SOPs, we followed procedure LANL-ESH-8-002, "Chain-of
Custody for Environmental Samples." In this project, each sample was handled under standard
chain-of-custody procedures, using traceable forms, transfer signatures, and custody tape. Every
sample was always kept within sight of one of the WSS team members or locked in a room or
cooler to which only the WSS team members had keys. After samples were screened for gross
radioactivity (see section 5.I below), those requiring analytical chemistry services were delivered
to the Sample Receiving Facility (Chemical Science and Technology Division, Group 3, or CST-
3), located in Room I90, SM-59-I, TA-59. CST-3 personnel took fonnal custody of the samples
at that time. All samples were analyzed on-site at LANL.
5.0 SAMPLE ANALYSIS
5.1 Soil Samples-Gross Alpha and Beta Counting
After the soil samples were collected, they were taken to T A-59 where small aliquots of each
sample were prepared for gross radioactivity counting and x-ray fluorescence (XRF) metal
measurements. The main purpose of the gross counts was to determine whether the samples
could be brought into Building SM-59-1 (that is, whether the samples met the CST-3 building
limits for radioactivity, which have been established to minimize background counts in the
building).
5.2 Soil Samples-XRF Measurements
Little infonnation is available on metal concentrations in soils at Area G. Thus, we
determined that it would be valuable to begin measuring certain metal concentrations in soils with
the relatively inexpensive XRF technique. In this study, XRF data were used to screen for
elevated metal levels and to determine whether subsequent soil sampling for standard laboratory
analysis was required. XRF is a low-cost, nondestructive method that analyzes soils for total
metal concentrations. This technique's sensitivity is adequate for the three metals of interest at
Area G-lead, barium, and mercury. These three metals have been used throughout the
Laboratory for decades, and they undoubtedly have been disposed of in varying quantities at
Area G. These potential soil contaminants, in their unoxidized elemental forms or as oxidized
compounds associated with soils, are expected to be disseminated into the environment by any of

the routes discussed above in Section 1.0. Therefore, it was important to begin assessing Area G
for elevated metal levels in soils.
XRF measurements were made using a Spectrace 9000 XRF instrument according to the
manufacturer's SOP. To prepare samples for XRF measurement, small plastic cups were half
filled with soil and a small ceramic mortar was used to grind the soil in the cup for one minute.
This procedure grinds larger particles to a smaller size, produces more surface area for the XRF
probe, and ultimately allows more accurate measurements. These XRF data are included in
Table 1.
5.3 Water Samples-pH and Conductivity Measurements
The single-stage water samples were collected in 1-gal. polyethylene bottles according to SOP
LANL-ER-SOP-06.10, referenced above in section 4.2. The bottles were collected as soon as
possible after a storm event and brought back to TA-59, where temperature, pH, and specific
conductivity measurements were made. The water was also prepared for submittal to CST-3 for
analyses. Although the pH, temperature, and conductivity measurements were made at T A-59 and
thus were not truly field measurements, we decided that the delay was not significant because there
was a built-in delay between the filling of the bottles during a storm event and collection of the
sample bottles. Single-stage sample collection occurs only after those storm events that result in
runoff significant enough to actually fill the bottles. Because these summer storm events normally
occur in the mid or late afternoon, it was not until the next day that the WSS team could go to
Area G to check whether or not the single-stage samplers collected water. If the sample bottles
collected water over the weekend, it may have been 72 h from the time the water flowed into the
bottle until it was picked up by the WSS team. For these reasons, it did not seem critical to
perform the pH and conductivity measurements in the field. The pH and specific conductivity
results are found in Table 2.
5.4 Requested Analytical Sernces
5.4.1 Surface-Soil Samples
The following analytical services were requested for soil samples taken during FY 93:
1. isotopic plutonium by radioactivity/alpha spectroscopy (RAS),
2. total uranium by kinetic phosphorescence analysis,
3. tritium by distillation of soil moisture and then scintillation counting,
4. cesium-137 by gamma spectroscopy and americium-241 by gamma spectroscopy or
RAS,and
5. percent moisture by gravimetric methods.
5.4.2 Single-Stage Water Samples
The following analyses were requested for single-stage water samples:
9

10
Unfiltered-water samples
1. total suspended solids.
For the remaining part of the water sample, we requested that the sample first be flltered
through a 0.45-J.Uil fllter. The following analyses were then requested for many of the samples:
Filtered-water fractions
1. tritium,
2. isotopic plutonium,
3. total uranium,
4. gross alpha, beta, and gamma activity, and
5. cesium-137 by gamma spectroscopy.
Filtered-sediment fractions
1. Isotopic plutonium.
5.4.3 Laboratory Soil-Sample Preparation
Before the CST-9 soil analyses for radionuclides (excepting tritium), the soils were first dried
overnight at 1 OOOC and then sieved through a number 12 Tyler sieve to remove large-sized
particles and foreign matter (twigs, grass, etc.). When these soils or sediment-fraction samples
were analyzed for plutonium and uranium, these radionuclides were first extracted from the dried
soils by a hot nitric acid/hydrofluoric acid leaching procedure that effectively dissolves the entire
sample. Standard CST analytical chemistry procedures were then followed for separating, plating,
and counting radionuclides.

Table 1: 1993 TA-54 Area G (OU 1148) perimeter soil data. Samples can be located on the maps of Figures 3 through 12 by referring to the sample location numbers listed in the first column of this table. Please note that negative values sometime result from counting statistics when average background activities are subtracted from gross analytical results.
Sample
Location Date
G-9-1 7/6/93
G-10-1 7/6/93
G-10-2 7/21/93
G-11-1 7/6/93
G-12-1 7/6/93
G-12-3 7/6/93
G-13-1 7/6/93
G-13-9 7/6/93
G-14-1 7/6/93
G-15-1 7/6/93
G-15-2
G-16-1
G-17-1
G-17-2
G-17-3
G-18-1
G-18-4
G-19-1
G-20-1
G-20-2
G-21-1
G-21-2
G-22-1
G-23-1
G-23-2
G-24-1
(continued)
7/6/93
116193
7/6/93
7/6/93
7/6/93
7/6/93
7/6/93
7/6/93
7/6/93
7/6/93
7/6/93
7/6/93
7/6/93
7/8/93
7/8/93
7/8/93
• Total Uranium
XRFdata Radioisotope data
Soil Total Ba Hg . Pb moisture 3H l41Am t37Cs u• llap0 l39p0 t pg;;
(}Lg/g) (}Lg/g) (}Lg/g) (wt 'i'D) (pCi/L) (pCi/g) (pCi/g) (}Lg/g) (pCi/g) (pCi/g) (pCi/g)
263. ~ 19. 1.4 600 -0.0156 0.332 3.5 0.002 0.02 0.022
189. ND 16. 1.56 1000 0.102 0.8 3.2 0.012 0.03 0.042
125. ND ND 22.26 300 cowt 2.38 3.87 0.022 o.092 o.114
165. ND ND 1.38 1200 0.141 0.474 2.3 0.009 0.016 0.025
268. ND 4. 1.56 1500 -0.015 0.151 2.3 O.Q18 0.01 0.028
273. ND 7. 2.16 700 0.005 1.43 3.1 0.012 0.07 0.082
299. ND 7. 2.58 300 0.001 -0.019 2.2 0.003 0.008 O.Q11
211. ND 6. 1.37 1000 -0.016 0.383 3.1 0.002 0.021 0.023
228. ND 18. 1.52 1500 0.009 0.389 2.3 0.006 0.009 O.Q15
216. ND ND 1.91 1300 -0.012 0.309 3. 0.014 0.02 0.034
206. ND 11. 1.07 ISM** -0.024 1. 5.3 0.007 0.047 0.054
208. ND 10. 1.65 3000 0.022 1.1 3.2 0.012 0.052 0.064
228. ND 21. 1.14 ISM 0.019 0.105 2.2 0.004 0.013 0.017
193. ND ND 2.71 3100 0.0002 1.83 3.8 O.Q11 0.077 0.088
236. ND ND 2.06 800 0.014 0.313 3.3 0.008 0.021 0.029
154. ND 4. 2.78 1300 0.037 0.404 3.1 0.005 0.015 0.02
80. ND . ND 0.26 0 0.0279 0.188 2.5 O.Q11 0.015 0.026
231. ND ND 2.39 1400 0.0834 0.0317 2.6 0.002 0.015 0.017
167. ND ND 1.29 3500 -0.024 1.25 2.4 O.Ql5 0.044 0.059
237. ND 7. 2.14 5100 -0.018 0.0374 2.3 0.009 0.014 0.023
180. 6. 2. 0.33 ISM -0.003 0.09 1.6 0.008 0.006 0.014
209. ND ND 1.46 1900 0.004 0.285 2.8 0.012 0.009 0.021
231. ND ND 1.68 3700 0.005 0.02 3.1 0.005 0.001 0.006
230. ND 22. 1.48 ISM 0.016 0.214 2.3 0.007 0.007 0.014
194. ND 3. 0.72 ISM -0.0091 0.371 2.2 0.032 0.027 0.059
187. ND 11. 0.49 ISM 0.0949 0.567 2.1 0.038 0.03 0.068
; ND-Not Detectable t Plutonium-239 and -240 •• ISM-Insufficient Soil Moisture
tt CON-Sample Consumed, No Data ;; Total plutonium-238, -239, and -240
11

Table 1 (continued): 1993 TA-54 Area G (OU 1148) perimeter soil data. Samples can be located on the maps of Figures 3 through 12 by referring to the sample location numbers listed in the first column of this table. Please note that negative values sometime result from counting statistics when average background activities are subtracted from gross analytical results.
Sample
Location Date
G-24-2 7/8/93
G-25-1 7/8/93
G-26-1 7/8/93
G-27-1 7/8/93
G-28-1 7/8/93
G-28-2 7/8/93
G-28-3 7/8/93
G-29-1 7/8/93
G-29-2 7/8/93
G-29-3 7/8/93
G-3~1 7/8/93
G-31-1 7/8/93
G-31-2 7/8/93
G-31-3 7/8/93
G-32-1 7/8/93
G-32-2 7/8/93
G-32-3 7/8/93
G-33-1 7/8/93
G-34-1 7/8/93
G-34-2 7/8/93
G-34-3 7/8/93
G-34-4 7/8/93
G-35-1 7/12193
G-35-2 7/12193
G-36-1 7/12193
G-36-2 7/12193
(continued)
• Total Uranium t Plutonium-239 and -240
12
XRFdata Radioisotope data
Soil Total Ba Hg . Pb moisture 3H :Z41Am t37Cs u· D&pu :Z39put Pu**
(I.Lg/g) (I.Lg/g) (I.Lg/g) (wt CJI.) (pCi/L) (pCi/g) (pCi/g) (I.Lg/c) (pCi/g) (pCi/g) (pCi/g)
213. ND 27. 4.33
222. ND 6. 1.8
223. 5. 26. 2.83
204. ND
234. ND
153. 4.
131. 6.
225. ND
170. ND
8.
5.
1.78
1.
6. 0.68
14. 0.77
1. 0.79
3. 1.17
165. 6. ND 0.7
139. ND ND 0.63
149. ND 4. 2.5
180. ND 23. 0.34
170. ND ND 0.37
164. ND 11. 1.12
164. ND 3. 1.31
188. ND 4. 1.3
220. ND 14. 1.49
94. ND 7. 0.35
154. ND ND 0.91
168. ND 2. 1.01
199. ND 10. 0.89
171. ND ND 5.14
306. ND ND 2.81
187. ND 14. 8.65
183. ND ND 3.58
* ND-Not Detectable
1 00 0.0552 1.11
ISM 0.116 1.75
ISM 0.151 1.7
2
4.5
4.3
ISM 0.0757 0.898 3.5
100 0.107 0.232 2.5
100 0.23 0.74 2.1
100 0.0915 0.376 2.5
1000 0.132
2200 0.123
11700 0.191
0.395 1.9
0.741 2.4
0.443 2.9
2000 0.218 0.39 3.2
11400 0.109 0.982 3.6
1000 0.094 0.376 2.4
500 0.124 0.231 2
2000 0.0604 0.787 2.2
800 0.196 0.495 2.8
500 0.0957 0.438 2.8
300 0.0567 1.17 3.4
ISM 0.0643 0.159 2
100 0.207 0.405 2.8
100 0.0185 0.144 3.1
100 -0.0241 0.2
3000 <.67
5700 <.61
1400 1.08
2800 0.64
0.21
0.97
0.69
0.1
2.7
2.1
2.2
2.2
1.9
0.007 0.045 0.052
0.007 0.058 0.065
0.009 0.08 0.089
0.005 0.033 0.038
0.003 0.006 0.009
0.011 0.027 0.038
0.063 0.054 0.117
0.059 0.025 0.084
0.007 0.025 0.032
0.013 0.012 0.025
0.041 0.043 0.084
0.023 0.065 0.088
0.004 0.01 0.014
0.004 0.009 0.013
0.007 0.028 0.035
0.007 0.024 0.031
0.012 0.027 0.039
0.009 0.107 0.116
0.007 O.Ql8 0.025
0.002 0.201 0.203
0.001 0.018 0.019
0.023 0.036 0.059
0.013 0.1 0.113
0.004 0.042 0.046
0.03 0.216 0.246
0.002 0.014 0.016
•• ISM-Insufficient Soil Moisture tt CON-Sample Consumed, No Data ** Total plutonium-238, -239, and -240

Table 1 (continued): 1993 TA-54 Area G (OU 1148) perimeter soil data. Samples can be located on the maps of Figures 3 through 12 by referring to the sample location numbers listed in the ftrst column of this table. Please note that negative values sometime result from counting statistics when average background activities are subtracted from gross analytical results.
Sample
Location Date
G-38-1 7/12/93
G-38-2 7/12/93
G-39-1 7112/93
G-39-2 7112/93
G-40-1 7/12/93
G-40-2 7/12/93
G-41-2 7112/93
G-42-1 7/12/93
G-43-1 7/12/93
G-43-2 7/12/93
G-44-1 7/12/93
G-45-1 7/12/93
G-46-1 7/12193
G-46-2 7/12/93
G-47-1 7/12193
G-48-1 7/13/93
G-48-2 7113/93
G-48-3 7113/93
G-49-1 7/13/93
G-50-1 7113/93
G-50-2 7/13/93
G-51-1 7/13/93
G-52-1 7/13/93
G-52-2 7113/93
G-52-3 7113/93
G-53-1 7/13/93
(continued)
• Total Uranium + P1utonium-239 and -240
XRFdata Radioisotope data
Soil Total Ba Hg . Pb moisture 38 241Am 137Cs 238pg 239pgt Pui:i:
()J.g/g) ()J.g/g) ()J.g/g) (wt ~)
245. ND ND 3.33
165. ND ND 2.74
163. ND 10. 10.66
189. ND ND 3.78
126. ND ND 3.4
136. ND ND 3.98
134. ND ND 4.06
77. ND 3. 3.3
124. ND ND 4.71
204. ND ND 5.18
131. ND ND 3.74
136. ND ND 3.24
148. ND ND
193. ND ND
251. ND 21.
273. ND ND
239. ND 23.
217. ND ND
180. ND ND
254. ND 10.
313. ND ND
281. ND ND
227. ND 8.
235. ND 8.
297. ND ND
243. ND ND
8.68
2.55
2.77
3.23
2.34
2.17
12.77
2.79
2.55
3.84
0.096
10.3
2.59
3.47
:i: ND-Not Detectable
(pCi/L) (pCi/g) (pCi/g) ()J.g/g) (pCi/g) (pCi/g) (pCi/g)
2600 <0.43 0.07 1.9
127600 <0.53 <0.05 1.7
800 <0.56 <0.06 1.9
3600 <0.44 <0.05 1.1
3100 <0.21 0.3 2.3
2600 <0.17 0.22 2.
2300 <0.26 0.45 2.8
5400 <0.25 0.23 22
11700 <0.44 <0.06 2.5
6300 <0.3 0.36 2.1
110800 <0.51 <0.09 2.7
117200 <0.43 <0.08 2.4
18800 0.33
21100 <0.25
7100 0.54
1.37 2.4
0.24 2.5
0.45 2.4
0.041 1.944 1.985
0.065 0.691 0.756
0.844 0.35 1.194
0.052 0.131 0.183
3.298 0.32 3.618
2.045 0.189 2.234
1.485 0.062 1.547
2.11 0.727 2.837
0.516 0.44 0.956
0.286 0.164 0.45
1.134 0.433 1.567
4.987 0.368 5.355
2.152 0.609 2.761
2.314 0.073
0.126 3.4
2.387
3.526
5450 0.162 0.74 2.11 0.099 0.237 0.336
5900 0.52 0.42 2.05 0.149 0.923 1.072
16100 0.469 0.09 1.87 0.185 1.613 1.798
1100 0.677 0.31 2.58 0.106 2. 2.106
20700 1.02 0.06 2.24 0.083 0.315 0.398
7600 0.4 <0.03 2.45 0.09 0.178 0.268
39050 0.257 0.15 2.98 0.035 0.034 0.069
2050 0.008 0.07 1.71 0.007 0.012 0.019
2300 0.183 0.5 2.8 0.016 0.024 0.04
3000 O.Ql 0.39 2.38 0.04 0.051 0.091
950 204. 0.41 2.91 0.012 0.03 0.042
•• ISM-Insufficient Soil Moisture tt CON-Sample Consumed, No Data :::; Total plutonium-238, -239, and -240
13
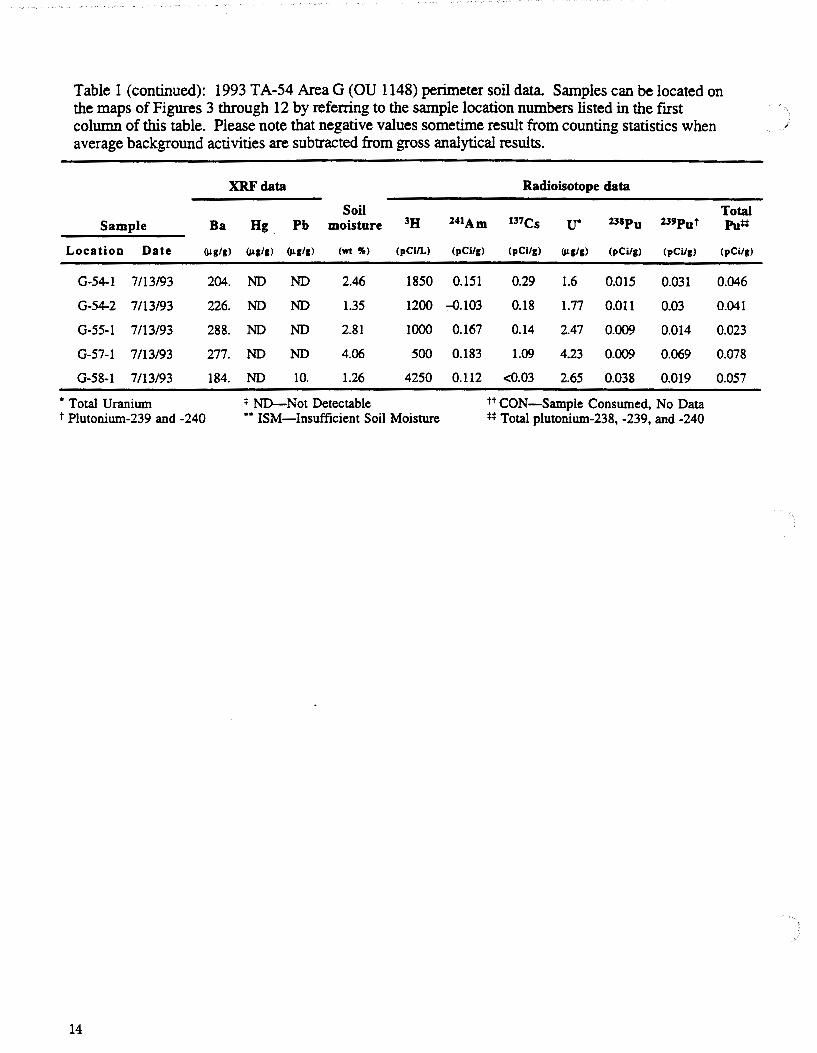
Table 1 (continued): 1993 TA-54 Area G (OU 1148) perimeter soil data. Samples can be located on the maps of Figures 3 through 12 by referring to the sample location numbers listed in the first column of this table. Please note that negative values sometime result from counting statistics when average background activities are subtracted from gross analytical results.
XRFdata Radioisotope data
Soil Total Sample Ba Hg. Pb moisture lH l41Am t37Cs u· l38pg l3!1pgt Pu*i
Location Date ijlg/g) ijlg/g) ijlg/g) (wt 'lfo) (pCi/L) (pCi/g) (pCi/g) ijlg/g) (pCi/g) (pCi/g) (pCi/g)
G-54-1 7/13/93 204. ND ND 2.46 1850 0.151 0.29 1.6 O.Ql5 0.031 0.046
G-54-2 7/13/93 226. ND ND 1.35 1200 -0.103 0.18 1.77 0.011 0.03 0.041
G-55-1 7/13/93 288. ND ND 2.81 1000 0.167 0.14 2.47 0.009 0.014 0.023
G-57-1 7/13/93 277. ND ND 4.06 500 0.183 1.09 4.23 0.009 0.069 0.078
G-58-1 7/13/93 184. ND 10. 1.26 4250 0.112 <0.03 2.65 0.038 0.019 0.057
• Total Uranium :1: ND-Not Detectable tt CON-Sample Consumed, No Data t Plutonium-239 and -240 •• ISM-Insufficient Soil Moisture ;; Total plutonium-238, -239, and -240
14

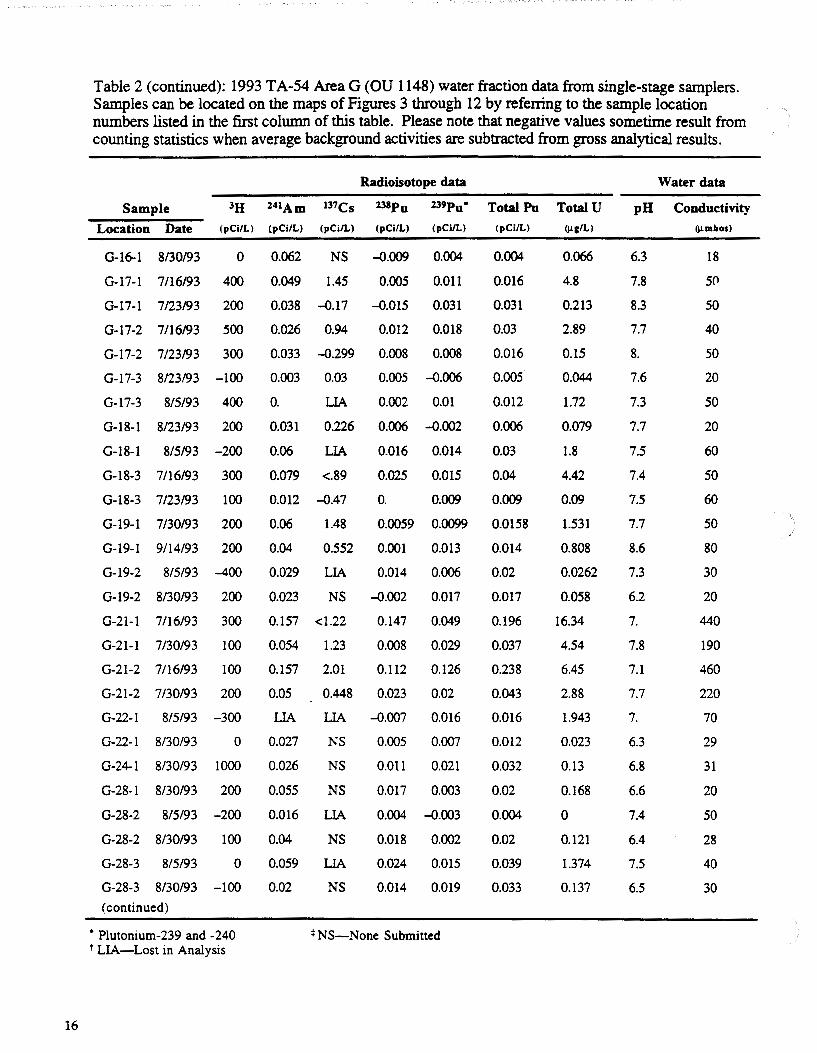
Table 2: 1993 TA-54 Area G (OU 1148) water fraction data from single-stage samplers. Samples can be located on the maps of Figures 3 through 12 by referring to the sample location numbers listed in the frrst column of this table. Please note that negative values sometime result from counting statistics when average background activities are subtracted from gross analytical results.
Radioisotope data
Sample lH 241Am 137Cs 23Sp0 239p0 • Total Pu Total U
Location Date (pCi/L) .(pCi/L) (pCi/L) (pCi/L) (pCi/L)
G-9-1 8/5/93 -300. LIAt LIA 0.044 0.005
G-10-2 8/5/93 -100. LIA LIA 0.009 O.Dl8
G-11-1 8/5/93 0. LIA LIA 0.006 0.006
G-11-1 8/30/93 -200. 0.042 NS:i: 0.002 -0.002
G-12-1 8/5/93 -100. O.Dl8 LIA 0.009 0.007
G-12-1 8/23/93 200. 0.023 0.235 0.004 0.004
G-12-2 8/5/93 -100. LIA LIA -0.001 0.023
G-13-1 7/16/93
G-13-1 7/23/93
G-13-2 7/16/93
200. 0.016 <0.64 0.011 0.023
0. 0.024 -0.067 0.016 0.032
300. 0.063 <0.92 0.022 0.033
G-13-2 8/5/93 -200. LIA LIA 0.019 0.014
G-13-2 7/23/93 200. O.Dl5 0.541 0. 0.052
G-13-3 815193 -300. LIA LIA 0.001 0.003
0. 0.074 LIA 0.016 -0.002 G-13-3 8/30/93
G-13-4 7/16/93
G-13-4 7/16/93
G-13-4 7/30/93
G-13-5 8/23/93
G-13-5 7/30/93
500. 0.058 <0.46 0.053 0.024
500. 0.058 39.5 0.053 0.024
100. 0.047 0.608 0.017 0.045
200. 0.056 0.406 0.046 0.013
100. 0.04 0.54 0.025 0.03
G-13-6 815193 -100.
G-13-9 815193 100.
LIA
LIA
LIA 0.009 0.007
LIA 0.007 0.019
G-13-9 8/23/93 -200. 0.049 0.318 0.012 0.002
G-14-1 7/16/93 300. 0.099 0.81 0.044 0.037
G-14-1 7/23/93 200. 0.046 -0.158 0.005 0.04
G-15-1 8/23/93 100. 0.076 0.478 0.006 O.Dl5
G-15-1 8/5/93 -100.
G-16-1 8/5/93 -400.
(continued)
• Plutonium-239 and -240 t LIA-Lost in Analysis
LIA
LIA
LIA 0.032 0.004
LIA 0.007 0.029
:1: NS-None Submitted
(pCi/L)
0.049
0.027
0.012
0.002
0.016
0.008
0.023
0.034
0.048
0.055
0.033
0.052
0.004
0.016
0.077
0.077
0.062
0.059
0.055
0.016
0.026
0.014
0.081
0.045
0.021
0.036
0.036
(l.lg/L)
1.918
1.862
1.69
0.213
0.139
0.295
0.859
5.4
0.79
2.33
3.031
0.496
2.968
1.132
3.69
3.69
1.874
0.878
2.01
2.619
5.04
0.028
3.04
0.628
0.735
2.542
1.761
Water data
pH Conductivity
7.1
7.3
7.1
6.2
7.2
7.7
7.1
7.1
8.
7.2
7.3
7.8
7.5
6.3
7.2
7.2
7.3
7.0
7.5
7.1
7.1
7.1
7.2
8.1
7.3
7.3
7.1
(j.lmhos)
40
70
40
30
30
20
50
100
100
110
80
90
40
18
250
250
290
130
290
30
140
80
340
100
100
30
30
15
16
Table 2 (continued): 1993 TA-54 Area G (OU 1148) water fraction data from single-stage samplers. Samples can be located on the maps of Figures 3 through 12 by referring to the sample location numbers listed in the first column of this table. Please note that negative values sometime result from counting statistics when average background activities are subtracted from gross analytical results.
Radioisotope data
Sample 3H 241Am 137Cs 231p0 239p0 • Total Pu Total U
Location Date (pCi/L) (pCi/L) (pCi/L) (pCi/L) (pCi/L)
G-16-1 8/30/93 0 0.062 NS -0.009 0.004
G-17-1 7/16/93 400 0.049 1.45 0.005 0.011
G-17-1 7/23/93 200 0.038 -0.17 -0.015 0.031
G-17-2 7116/93 500 0.026 0.94 0.012 O.Ql8
G-17-2 7/23/93 300 0.033 -0.299 0.008 0.008
G-17-3 8/23/93 -100 0.003 0.03 0.005 -0.006
G-17-3 8/5/93 400
G-18-1 8/23/93 200
G-18-1 8/5/93 -200
G-18-3 7116/93 300
G-18-3 7/23/93 100
0. LIA 0.002 O.Ql
0.031 0.226 0.006 -0.002
0.06 LIA
0.079 <.89
0.012 -0.47
0.016 0.014
0.025 O.Ql5
0. 0.009
(pCi/L)
0.004
0.016
0.031
0.03
0.016
0.005
0.012
0.006
0.03
0.04
0.009
G-19-1 7/30/93 200 0.06
0.04
1.48 0.0059 0.0099 0.0158
G-19-1 9/14/93 200
G-19-2 8/5/93 -400
G-19-2 8/30/93 200
0.552 0.001 0.013
0.029 LIA 0.014 0.006
0.023 NS -0.002 0.017
G-21-1 7116/93 300 0.157 <1.22 0.147 0.049
G-21-1 7/30/93 100
G-21-2 7/16/93 100
G-21-2 7/30/93 200
G-22-1 8/5/93 -300
G-22-1 8/30/93 0
G-24-1 8/30/93 1000
G-28-1 8/30/93 200
G-28-2 8/5/93 -200
G-28-2 8/30/93 100
G-28-3 8/5/93 0
G-28-3 8/30/93 -100
(continued)
• Plutonium-239 and -240 t LIA-Lost in Analysis
0.054 1.23 0.008 0.029
0.157 2.01 0.112 0.126
0.05 0.448 0.023 0.02
LIA
0.027
0.026
0.055
LIA -0.007 0.016
NS
NS
NS
0.016 LIA
0.04 NS
0.059 LIA
0.02 NS
0.005 0.007
O.Ql1 0.021
0.017 0.003
0.004 -0.003
O.Ql8 0.002
0.024 O.D15
0.014 0.019
* NS-None Submitted
0.014
0.02
0.017
0.196
0.037
0.238
0.043
0.016
0.012
0.032
0.02
0.004
0.02
0.039
0.033
(I.Lg/L}
0.066
4.8
0.213
2.89
0.15
0.044
1.72
0.079
1.8
4.42
0.09
1.531
0.808
0.0262
0.058
16.34
4.54
6.45
2.88
1.943
0.023
0.13
0.168
0
0.121
1.374
0.137
Water data
pH Conductivity (I.Lmbos)
6.3
7.8
8.3
7.7
8.
7.6
7.3
7.7
7.5
7.4
7.5
7.7
8.6
7.3
6.2
7.
7.8
7.1
7.7
7.
6.3
6.8
6.6
7.4
6.4
7.5
6.5
18
5(1
50
40
50
20
50
20
60
50
60
50
80
30
20
440
190
460
220
70
29
31
20
50
28
40
30
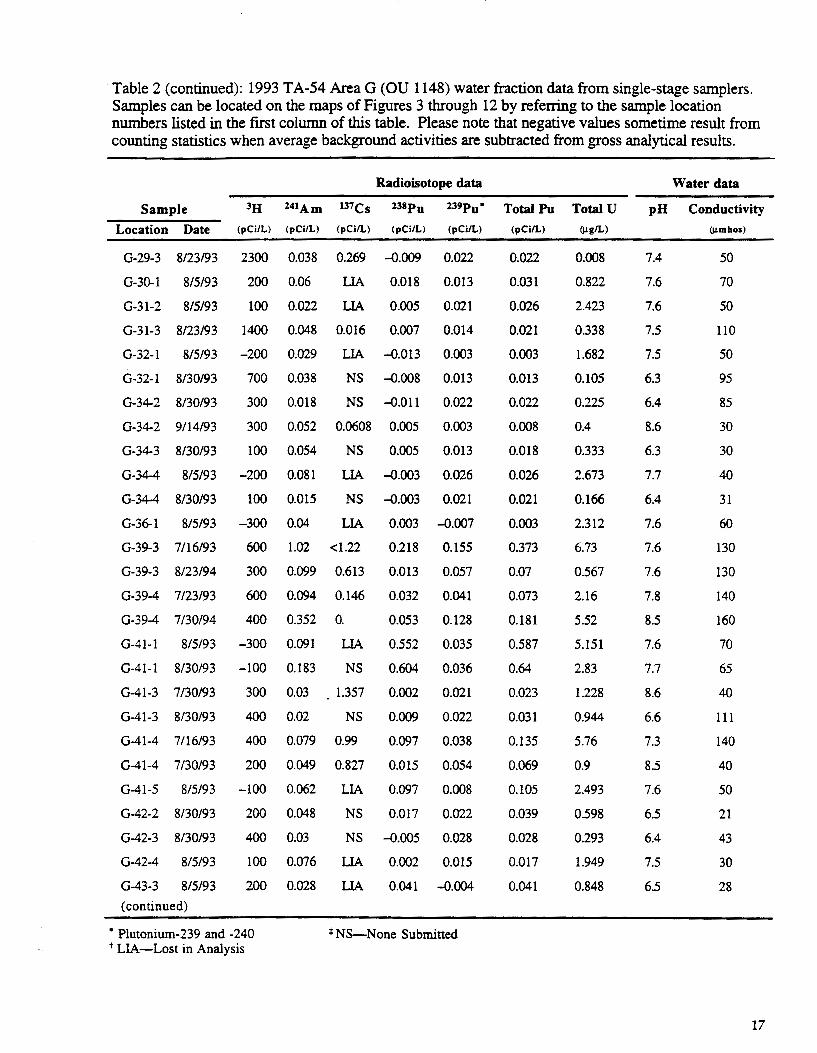
Table 2 (continued): 1993 TA-54 Area G (OU 1148) water fraction data from single-stage samplers. Samples can be located on the maps of Figures 3 through 12 by referring to the sample location numbers listed in the first column of this table. Please note that negative values sometime result from counting statistics when average background activities are subtracted from gross analytical results.
Radioisotope data
Sample 3H 241Am 137Cs 238pu 239pu• Total Pu Total U
Location Date (pCi/L) (pCi/L) (pCi/L) (pCi/L) (pCi/L)
G-29-3 8/23/93 2300 0.038 0.269 -0.009 0.022
G-30-1 8/5/93 200 0.06 LlA 0.018 0.013
G-31-2 8/5/93 100 0.022 LlA 0.005 0.021
G-31-3 8/23/93 1400 0.048 0.016 0.007 0.014
G-32-1 8/5/93 -200 0.029 LIA -0.013 0.003
G-32-1 8/30/93 700 0.038 NS -0.008 0.013
G-34-2 8/30/93 300 0.018 NS -0.011 0.022
G-34-2 9114/93 300 0.052 0.0608 0.005 0.003
G-34-3 8/30/93 100 0.054 NS 0.005 0.013
G-34-4 8/5/93 -200 0.081 LIA -0.003 0.026
G-34-4 8/30/93 100 O.oi5 NS -0.003 0.021
G-36-1 8/5/93 -300 0.04 LIA 0.003 -0.007
G-39-3 7116/93 600 1.02 <1.22 0.218 0.155
G-39-3 8/23/94 300 0.099 0.613 0.013 0.057
G-39-4 7/23/93 600 0.094 0.146 0.032 0.041
G-39-4 7/30/94 400 0.352 0. 0.053 0.128
G-41-1 8/5/93 -300 0.091 LlA 0.552 0.035
G-41-1 8/30/93 -100 0.183 NS 0.604 0.036
G-41-3 7/30/93 300 0.03 1.357 0.002 0.021
G-41-3 8/30/93 400 0.02 NS 0.009 0.022
G-41-4 7/16/93 400 0.079 0.99 0.097 0.038
G-41-4 7/30/93 200 0.049 0.827 0.015 0.054
G-41-5 8/5/93 -100 0.062 LIA 0.097 0.008
G-42-2 8/30/93
G-42-3 8/30/93
200 0.048
400 0.03
NS 0.017 0.022
NS -0.005 0.028
G-42-4 8/5/93 100 0.076 LlA 0.002 O.D15
G-43-3 8/5/93 200 0.028 LlA 0.041 -0.004
(continued)
• Plutonium-239 and -240 t LIA-Lost in Analysis
* NS-None Submitted
(pCi/L)
0.022
0.031
0.026
0.021
0.003
0.013
0.022
0.008
0,018
0.026
0.021
0.003
0.373
0.07
0.073
0.181
0.587
0.64
0.023
0.031
0.135
0.069
0.105
0.039
0.028
0.017
0.041
(llg/L)
0.008
0.822
2.423
0.338
1.682
0.105
0.225
0.4
0.333
2.673
0.166
2.312
6.73
0.567
2.16
5.52
5.151
2.83
1.228
0.944
5.76
0.9
2.493
0.598
0.293
1.949
0.848
Water data
pH Conductivity
7.4
7.6
7.6
7.5
7.5
6.3
6.4
8.6
6.3
7.7
6.4
7.6
7.6
7.6
7.8
8.5
7.6
7.7
8.6
6.6
7.3
8.5
7.6
6.5
6.4
7.5
6.5
(I! mhos)
50
70
50
110
50
95
85
30
30
40
31
60
130
130
140
160
70
65
40
Ill
140
40
50
21
43
30
28
17

18
Table 2 (continued): 1993 T A-54 Area G (OU 1148) water fraction data from single-stage samplers. Samples can be located on the maps of Figures 3 through 12 by referring to the sample location numbers listed in the first column of this table. Please note that negative values sometime result from counting statistics when average background activities are subtracted from gross analytical results.
Radioisotope data
Sample 3H l41Am mcs l31pu 239Pu* Total Pu Total U
Location Date (pCi/L) (pCi/L) (pCi/L) (pCi/L) (pCi/L)
G-44-2 8/5/93 -200 0.02 LIA 0.013
G-44-3 8/5/93 400 0.05 LIA 0.017
200 0.035 LIA LIA G-44-3 8/30/93
G-45-2 7/16/93
G-45-2 7/23/93
300 0.025 <1.67 0.023
100 O.Ql 0.072 0.014
0.012
0.013
LIA
0.034
0.056
G-47-2 8/5/93 -100 LIA LIA 0.027 -0.002
G-49-1 7/23/93
G-49-1 7/23/93
G-49-2 7/16/93
0 0.144 0.141 0.066
400 0.216 1.41 0.01
500 1.08 1.26 0.153
G-49-2 7/23/93 0 0.029 -0.429 0.009
G-50-1 7/16/93 1000 0.446 <0.91 0.01
0.199
0.119
0.593
0.065
0.045
G-50-1 8/30/93 100 0.065 NS 0. -0.005
G-50-3 7/16/93 1100 0.133 0.637 0.019 0.006
G-50-3 7/23/93 800 0.011 0.81 0.02 0.03
G-51-2 7/23/93 0 O.Ql8 0.288 0.033 0.019
G-51-2 7/30/93 300 0.03 0.944 0.012 0.006
200 0.024 NS -0.002 0.023 G-51-3 8/30/93
G-51-3 7/23/93
G-51-4 8/5/93
500 0.028 0.525 0.011 0.05
0.015
0.01
0.044
0.001
0.011
0 LIA LIA 0.004
G-51-4 7/23/93 1900 0.029 -0.172 0.
G-55-2 8/5/93 -300 LIA
G-56-1 8/5/93 -400 LIA
G-56-1 8/30/93
G-56-2 8/5/93
G-56-2 8/30/93
200 0.044
100 LIA
100 0.035
G-56-3 8/5/93 -100 LIA
G-56-3 8/30/93
(continued)
100 0.025
• Plutonium-239 and -240 t LIA-Lost in Analysis
LIA 0.001
LIA 0.003
NS 0.001
NS 0.003 -0.003
NS -0.004 0.01
LIA -0.003
NS -0.011
O.Dl8
0.026
i: NS-None Submitted
(pCi/L)
0.025
0.03
LIA
0.057
0.07
0.027
0.265
0.129
0.746
0.074
0.055
0.00
0.025
0.05
0.052
0.018
0.023
0.061
0.019
0.01
0.045
0.004
0.012
0.003
0.010
0.018
0.026
(llg/L)
1.923
0.303
0.005
4.26
1.55
2.071
1.45
2.06
0.
0.684
7.97
0.782
5.44
1.48
0.1
0.64
0.125
0.4
2.37
0.14
0.001
0.322
0.133
1.618
0.056
0.949
0.097
Water data
pH Conductivity (llmbos)
7.2
7.2
7.5
7.8
8.
7.3
7.5
7.1
6.9
7.6
7.3
7.3
7.3
8.
7.8
8.1
6.5
7.6
7.5
7.5
7.3
7.3
6.5
NS
6.6
7.7
6.8
50
40
50
30
30
20
140
900
900
600
310
310
410
150
80
80
45
80
110
60
20
20
15
NS
21
20
18
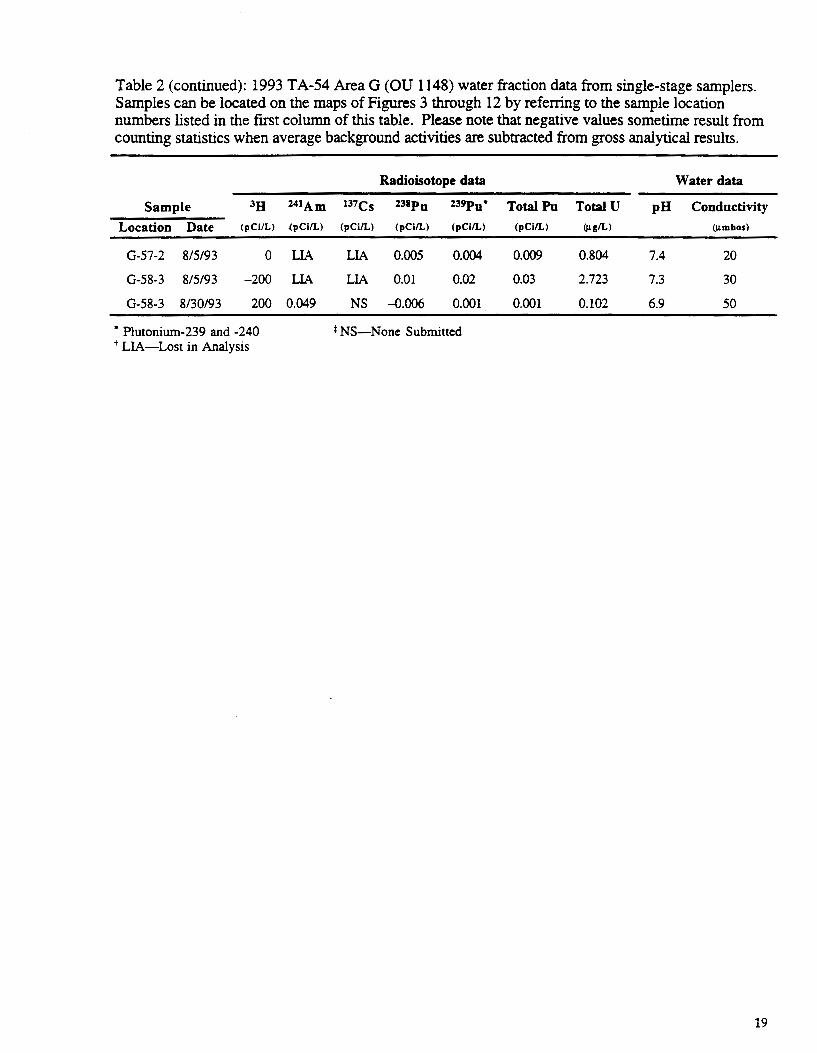
Table 2 (continued): 1993 TA-54 Area G (OU 1148) water fraction data from single-stage samplers. Samples can be located on the maps of Figures 3 through 12 by referring to the sample location numbers listed in the first column of this table. Please note that negative values sometime result from counting statistics when average background activities are subtracted from gross analytical results.
Radioisotope data Water data
Sample 3fi l41Am I37Cs l38pg l39pg• Total Pu Total U pH Conductivity
Location Date (pCi!L) {pCi/L) (pCi/L) (pCi/L) (pCi/L) (pCi/L) (j.lg/L) (j.lmbos)
G-57-2 8/5/93 0 LIA LIA 0.005 0.004 0.009 0.804 7.4 20
G-58-3 8/5/93 -200 LIA LIA 0.01 0.02 0.03 2.723 7.3 30
G-58-3 8/30/93 200 0.049 NS -0.006 0.001 0.001 0.102 6.9 50
• Plutonium-239 and -240 t NS-None Submitted t LIA-Lost in Analysis
19
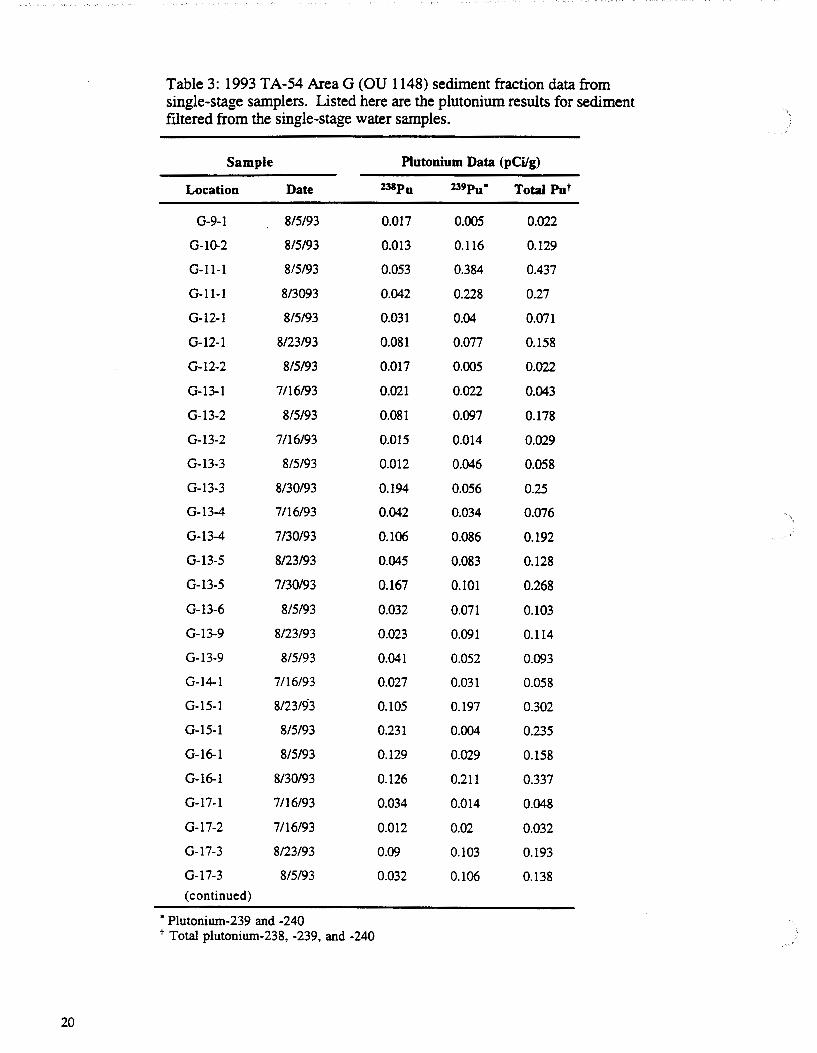
Table 3: 1993 TA-54 Area G (OU 1148) sediment fraction data from single-stage samplers. Listed here are the plutonium results for sediment flltered from the single-stage water samples.
Sample Plutonium Data (pCilg)
Location Date %38pu %39pu• Total Put
G-9-1 8/5/93 0.017 0.005 0.022
G-10-2 8/5/93 0.013 0.116 0.129
G-11-1 8/5/93 0.053 0.384 0.437
G-11-1 8/3093 0.042 0.228 0.27
G-12-1 8/5/93 0.031 0.04 0.071
G-12-1 8/23/93 0.081 0.077 0.158
G-12-2 8/5/93 0.017 0.005 0.022
G-13-1 7/16/93 0.021 0.022 0.043
G-13-2 8/5/93 0.081 0.097 0.178
G-13-2 7116/93 0.015 0.014 0.029
G-13-3 8/5/93 0.012 0.046 0.058
G-13-3 8/30/93 0.194 0.056 0.25
G-13-4 7/16/93 0.042 0.034 0.076
G-13-4 7/30/93 0.106 0.086 0.192
G-13-5 8/23/93 0.045 0.083 0.128
G-13-5 7/30/93 0.167 0.101 0.268
G-13-6 8/5/93 0.032 0.071 0.103
G-13-9 8/23/93 0.023 0.091 0.114
G-13-9 8/5/93 0.041 0.052 0.093
G-14-1 7/16/93 0.027 0.031 0.058
G-15-1 8/23/93 0.105 0.197 0.302
G-15-1 8/5/93 0.231 0.004 0.235
G-16-1 8/5/93 0.129 0.029 0.158
G-16-1 8/30/93 0.126 0.211 0.337
G-17-1 7/16/93 0.034 0.014 0.048
G-17-2 7/16/93 0.012 0.02 0.032
G-17-3 8/23/93 0.09 0.103 0.193
G-17-3 8/5/93 0.032 0.106 0.138
(continued)
• Plutonium-239 and -240 t Total plutonium-238, -239, and -240
20

Table 3 (continued): 1993 TA-54 Area G (OU 1148) sediment fraction data from single-stage samplers. Listed here are the plutonium results for sediment filtered from the single-stage water samples.
Sample Plutonium Data (pCi/g)
Location Date 238pu 239put Total Put
G-18-1 8/23/93 0.144 0.086 0.23
G-18-1 8/5/93 0.19 0.226 0.416
G-18-3 7/16/93 0.026 0.014 0.04
G-19-1 7/30/93 0.137 0.06 0.197
G-19-1 9/14/93 0.094 0.107 0.201
G-19-2 8/5/93 0.103 0.208 0.311
G-19-2 8/30/93 0.331 0.429 0.76
G-21-1 7/16/93 0.077 0.035 0.112
G-21-1 7/30/93 0.114 0.039 0.153
G-21-2 7/16/93 0.048 0.055 0.103
G-21-2 7/30/93 0.214 0.09 0.304
G-22-1 8/5/93 0.042 0.049 0.091
G-22-1 8/30/93 0.103 0.098 0.201
G-24-1 8/30/93 0.032 0.259 0.291
G-28-1 8/30/93 0.038 0.111 0.149
G-28-2 8/5/93 0.128 0.003 0.131
G-28-2 8/30/93 0.216 0.111 0.327
G-28-3 8/5/93 0.306 O.Ql5 0.321
G-28-3 8/30/93 0.244 0.119 0.363
G-29-2 8/23/93 0.072 0.137 0.209
G-30-1 8/5/93 0.079 0.013 0.092
G-31-2 8/5/93 0.094 0.021 0.115
G-31-3 8/23/93 0.077 0.083 0.16
G-32-1 8/5/93 0.066 0.003 0.069
G-32-1 8/30/93 0.028 0.063 0.091
G-34-2 8/30/93 0.037 0.155 0.192
G-34-2 9/14/93 0.129 0.147 0.276
G-34-3 8/30/93 0.329 0.632 0.961 (continued)
* Plutonium-239 and -240 t Total plutonium-238, -239, and -240
21

Table 3 (continued): 1993 TA-54 Area G (OU 1148) sediment fraction data from single-stage samplers. Listed here are the plutonium results for sediment filtered from the single-stage water samples.
Sample Plutonium Data (pCilg)
Location Date 238Pu 239put Total Put
G-34-4 8/5/93 0,015 0.026 0.041
G-34-4 8/30/93 0.367 0.227 0.594
G-36-1 8/5/93 0.005 0.027 0.032
G-39-3 7/16/93 0.321 0.098 0.419
G-39-3 8/23/93 0.054 0.102 0.156
G-39-4 7/30/93 0.582 1.017 1.599
G-41-1 8/5/93 1.188 0.082 1.27
G-41-1 8/30/93 26.61 1.258 27.868
G-41-3 7/30/93 0.132 0.074 0.206
G-41-3 8/30/93 0.003 0.019 0.022
G-41-4 7/16/93 0.104 0.032 0.136
G-41-4 7/30/93 0.451 0.085 0.536
G-41-5 8/5/93 0.182 0.038 0.22
G-42-2 8/30/93 0.271 0.135 0.406 )
G-42-4 8/5/93 0.623 0.46 1.083
G-43-3 8/3093 0.681 0.272 0.953
G-43-3 8/5/93 1.11 0.193 1.303
G-44-2 8/5/93 0.65 0.1 0.75
G-44-3 8/5/93 0.786 0.182 0.968
G-44-3 8/30/93 1.518 0.256 1.774
G-45-2 7/16/93 0.344 O.Ql8 0.362
G-47-2 8/5/93 0.375 0.087 0.462
G-49-1 7/23/93 0.136 0.665 0.801
G-49-2 7/16/93 0.136 0.768 0.904
G-50-1 7/16/93 0.093 0.157 0.25
G-50-1 8/30/93 0.086 0.207 0.293
G-50-3 7/16/93 0.055 0.054 0.109
G-51-2 7/30/93 0.181 0.161 0.342
(continued)
• Plutonium-239 and -240 t Total plutonium-238, -239, and -240
22

Table 3 (continued): 1993 TA-54 Area G (OU 1148) sediment fraction data from single-stage samplers. Listed here are the plutonium results for sediment filtered from the single-stage water samples.
Sample Plutonium Data (pCi/g)
Location Date 238pu 239put Total Put
G-51-3 8/30/93 0.1 0.098 0.198
G-51-4 8/5/93 0.123 0.205 0.328
G-55-2 8/5/93 0.241 0.044 0.285
G-56-1 8/5/93 0.062 0.001 0.063
G-56-1 8/30/93 0.667 0.732 1.399
G-56-2 8/5/93 0.024 0.003 0.027
G-56-2 8/30/93 0.039 0.036 0.075
G-56-3 8/5/93 0.018 O.Ql8 0.036
G-56-3 8/30/93 0.046 0.031 0.077
G-57-2 8/5/93 0.1 0.004 0.104
G-58-3 8/5/93 0.041 0.02 0.061
G-58-3 8/30/93 0.164 0.101 0.265
• P1utonium-239 and -240 t Total p1utonium-238, -239, and -240
23

24
6.0 PERIMETER SOIL-SAMPLE RESULTS FOR CONSTITUENTS OF
INTEREST
6.1 Tritium
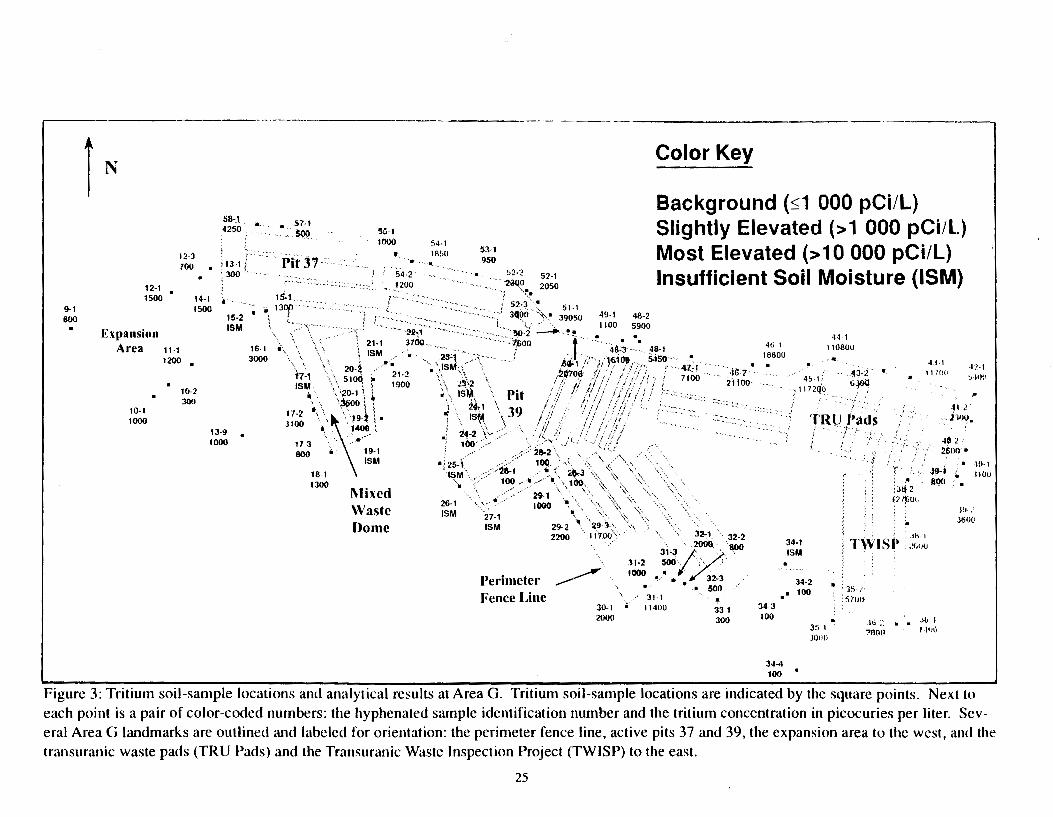
The analytical radiochemistry results from CST are presented in Tables 1-2. Figures 3 and 4
depict the perimeter tritium distributions for the soil and single-stage water samples. The tritium
values for the water samples depicted in Figure 4 may be an average of measurements made for
tritium if several samples were collected after individual storm events at a particular sampling
station. For the perimeter soil samples (those samples taken from locations in minor drainages
into which we expected sediments to be carried and water to flow during a storm event), there is
defmitely some elevated tritium activity. From Figure 3, elevated levels of tritium (as high as
117,200 pCi/L) in soil are apparent for sampling locations between monuments G-42 and G-51.
These locations are along the eastern half of the north side of Area G. To the east and south of the
TRU pads (between monuments G-35 and G-41), the soil samples show slight increases (3000-
5000 pCi/L) above baseline tritium levels (100-1000 pCi/L for soils in Area G). One isolated soil
sample, G-38-02, on the perimeter at the south edge of the TRU pads, had a relatively high tritium
activity (127 ,600 pCi!L). Adjacent soil samples, however, had soil tritium activities of only
several thousand pCi/L. The other area of elevated soil tritium activities is adjacent to the tritium
disposal shafts and encompasses sample series 29-31. Soil samples from this area had tritium
activities as high as 11,700 pCi/L.
Storm-water runoff (single-stage) samples were also collected in the majority of those
locations where perimeter soil samples were taken. We collected 110 water samples by the single
stage-sampler method (at many stations several collections were made on different dates). The
analytical chemistry data for these samples are presented in Tables 2 and 3. Only the water ,
fractions of the single-stage samples were analyzed for tritium. The tritium activity of the vast
majority (77%) of the samples ranged from reported values of 0-400 pCi!L. Although our
detection limit for tritium with this method is 300 pCi/L, the counting statistics may generate
values that are less than the detection limit, and sometimes even negative values may be generated.
We consider the activity range of 0-400 pCi/L to be at the baseline for surface-water runoff at
Area G. Six single-stage water samples had tritium activities over 1000 pCi/L, but in FY 93 only
one single-stage water sample had a tritium activity greater than 2000 pCi!L. This sample was
from location G-29-2, and the tritium activity was 2300 pCi/L. Another sample collected nearby at
G-31-3 had a tritium activity of 1400 pCi/L. Both G-29-2 and G-31-3 are adjacent to disposal
shafts where significant curies of tritium were disposed.
An important consideration regarding the tritium results for single-stage samplers is that they
reflect the surface-soil environment only at the time of the storm event. Recent ambient conditions
at a particular location will determine the availability of tritium at the time a sample is taken. When
9-1 600
IN
12-1 1500
Expansion Area
10·1 1000
12-3 700
58,1 4250
;...~
1 1:1·1 i 300 ' ..
14·1 ~-1500
15·2 ISM
• 57·1 -.$®
Pit 37
55-I 1000 .. 54-1
1850 53-1 950
Color Key
Background (~1 000 pCi/L) Slightly Elevated (> 1 000 pCi!l) Most Elevated (> 10 000 pCi/L)
. ;~t ~~~~ Insufficient Soil Moisture (ISM) 15.1. ··.,•
·-··.,., .....• 54-2 1200
. ··~·· .•... ·;:. ' ' ... ·~·.,
.. 130f' .. ,, ' ', .. . 52·3 .~. 51-1 •. ; i , . ·· . • ' · ·· .. , 3Q~O ·<:-.• 39050 49-1 48-2
H-1 110800 11·1
1200
16-1 ~\_-- · '\ i ~~~ ·-:~ri -~:~:·:··:: :: : ;~~-~~~ ~ ~ ·t···· · .. ~1
~::,; :
900
48-1
3000 · 1 • " ·., .. 23·1 , ·· ... · ,6i,. ii",, 1 \E.10D. 5~50
~. \~\ 1 i~: ,~;~~~. Pit :r1tf!if0; ... · :: 46 1
18800 .·... . . " 4.1-1
1170(1 • 4~-1
~·10{1
10-2 300
13·9 1000
41;-7 2il00
17-2 ·. ··.· • l ~ ·, .... 39 ''i ' ' ' ' .' ',, ' . ., ·., \19-~, • : IS.,"l /!· · /I :
"; \' ~~~ .:}.'.~·.:,·£.;:·~f I' ;.:.:;·::,•
18-1 ···IsM'. . · ,·>2$-1 · •.; ~3 1300 • ·-.. ;:•'' 1~" li / -. \1~ ..
M1xed \ ·.. . · · 29-1 \ · · 26-1 ''•< .... ' 1000 ·~. . ISM :27•1 • ..
ISM 2~2 •.
Waste Dome
2200
Perimeter Fence l.ine ~
J0-1 2000
33-1 32·2
3,h;~·~ .. -.·~··. 800 11·2 500 . ., ' .. 1000 • ~ ·, 32-3
' • • • 500 31·1
ii 11400 33 1 300
···., .. :t
.. ,
4~ 1:
! 1172!{0
43·2' •
6:JO'l ./.
'fRU Pads ! .. , - ·- ·.l'l• { /' ' ' . . '
r !.~. : ,. :J& 2 1.2$0<
.. · ' Jb I
.• t1 L
il·~.
4; 2 2600.
.$9-i • Hl-1
800 ... 1100
. . JY .• · J61)('
34-1 ISM
TWIS~· :~fJOO
34-2
•• 100 34-3 100
34-4 100
35 1 JOOO
'15· .'· S7fll}
16 ~~
:>non Jo 1 I .)II(•
Figure 3: Tritium soil-sample locations ami analytical results at Area G. Tritium soil-sample locations are indicated by the square points. Next to each point is a pair of color-coded numbers: the hyphenated sample identification number and the tritium concentration in picocuries per liter. Several Area G landmarks are outlined and labeled for orientation: the perimeter fence line, active pits 37 and 39, the expansion area to the west, and the transuranic waste pads (TRU Pads) and the Transuranic Waste Inspection Project (TWISP) to the east.
25

IN r,t( _l
{) . 1''
lilt'
IJ-1 1011
• - ... Pit 37
Expansion 9; Area -300
I~ 1 • bO
I:JJ 1~11
111
1uo
Ht ~, • 100
1.]:'
1!}11 . 14-1 2SO
1~ 4 1(J0
13 ~- .. l~ll
lit !()(;
i_,t; Sample 10 #~ '1
.
1
H-3Conc.~
Color Key
15 I ·•: () ,i
\ : \
\.,
I 7 1
l1 L •· 4C 11i
~-1 i .I -~'J'J
I~ I I)
···, ... I>):; 2tlll
r
Background (~400 pCi/L) Slightly Elevated (>400 pCi/L) Most Elevated (>800 pCi/L)
\tl;.
22 I •.• 1~(1
' . ·~,
'··-~ ...
~11 1 ·18 \
Perimeter I<'ence Line
'-,() J gr11J
'd :· ''lCl
~--.. 4~ 1 so·r· "- .. 2ou
50
\ ..
~-·
'30-1 2fHI •
1tHI
:31 J -:·-,_
11<: 141Jil
100 .
32 I 25t)
11.; 1·1 . . H111 /Hll
1'_, ! • }II!
,!
f .. ::: . .;
.....
'
)4- ., ••
t•H;
34 :• !IJIJ
J·l ~ a;o
I, ,.,
-r· 1 •
Ill:·
TRU . ,.
· _Pa"~
<' (.
~-···
'·
Twisp:
t' 'I
.:1('1)
16 I ')tiOI
II 1 ..'Iii)
Figure 4: Tritium analytical results for the filtered-water fraction from single-stage samples at Area G. Single-stage water-santple locations are indicated by the square points. Next to each point is a pair of color-coded numbers: the hyphenated sample identification number and the tritium concentration in picocuries per liter of filtered water. Several Area G landmarks are outlined and labeled for orientation: the perimeter fence line, active pits 37 and 39, the expansion area to the west, and the transuranic waste pads (TRU Pads) and the Transuranic Waste Inspection Project (TWISP) to the east.
27
precipitation falls, surface moisture interactions are limited to the top few centimeters of surface
soils. At that time, any tritium in those surface-soil regions could be mobilized by either the
I. solubilization of ionic forms of tritium or tritiated compounds,
2. erosion of tritium-bound sediments, or
3. upward movement of tritium from the subsurface and entrainment by running water.
With respect to the soil samples, we assumed that tritium was incorporated into the tightly
bound water that is associated with sediment particles. When the laboratory prepared a soil sample
for tritium analysis, water was distilled out of a weighed sample of soil. The tritium in the distilled
water was deemed to represent the tritium content of the soil and was reported as activity per liter
of soil moisture.
6.2 Uranium
All perimeter soil samples were also analyzed for total uranium. Total uranium analysis data
(Table 1) are reported as the mass of all of the uranium isotopes present in a soil sample. The
value reported is thus the total mass (in micrograms) of uranium per gram of soil. For the 83
perimeter soil samples analyzed, the uranium concentrations ranged from 1.1-5.3 !J.g/g. The
average value for total uranium in perimeter soils was 2.59 !J.g/g, with a standard deviation of
± 0.70 !J.g/g. The geographic distribution for these soil uranium readings is depicted in Figure 5.
Total uranium concentrations were also analyzed for the filtered-water fractions of the single-stage
samples. These data are tabulated in Table 2 and their locations are depicted in Figure 6. The
uranium values presented in Figure 6 may be an average of several uranium measurements made
on water samples collected during multiple precipitation events. The uranium in water varied from
less than 1 J..Lg/L to 16.3 J..Lg/L.
6.3 Plutonium Isotopes
During the FY 93 perimeter surface-soil sampling campaign, 83 perimeter soil samples were
analyzed for isotopic plutonium (plutonium-238, -239, and -240). Plutonium-239 and -240 are
reported as the sum of the activity of these two isotopes but hereafter they will be referred to only
as plutonium-239. The plutonium soil data also are presented in Table I. The plutonium-238
activities range from 0.001 pCilg to 4.987 pCilg. The average plutonium-238 activity for this data
set is 0.28 pCilg, with a standard deviation of± 0.80 pCilg. The mean value is far above the
median value because several samples have elevated plutonium levels. The median plutonium-238
value for the same sample set is 0.012 pCilg. For plutonium-239, activities range from 0.001-
1.944 pCilg. The mean plutonium-239 activity is 0.21 pCilg, with a standard deviation of
± 0.51 pCilg. The plutonium-239 data is also skewed upward, with the median plutonium-239
value for the same sample set at 0.034 pCilg. For convenience, the total plutonium isotope activity
for each sample is also presented in Table I. In the figures included in this paper, total plutonium
isotope activity is plotted by location. Table 1 and Figure 7 show that perimeter surface soils
29

30
increase slightly in plutonium activity as one moves from the west of Area G (with little or no
history of waste-disposal activity) to the east (where there was a great deal of waste-disposal
activity). The highest total plutonium activities are associated with the TRU pads and the lower
numbered inactive pits (location series 38-45), with elevated readings also found to the west of the
TRU pads along the northern edge of Area G up through location series 50. There are other
elevated plutonium readings from sites scattered around the perimeter but these sites are found
predominantly in the eastern half of Area G.
The single-stage samples collected during FY 93 were separated into a water fraction and a
sediment fraction. Isotopic plutonium analyses were run on both fractions. These data are
included in Tables 2 (filtered water data) and 3 (sediment data) and depicted in Figures 8 and 9.
Please note that calculations for total plutonium values in the tables treat as zero any negative
isotopic values. For example, the total plutonium reported for the water fraction of sample G-12-2
is 0.023 pCi/L. Also, the plutonium numbers presented in the figures may be an average of
several total plutonium values measured for separate samples collected during multiple
precipitation events.
6.4 Americium-241
Perimeter surface soils also were analyzed for americium-241, which is always found with
plutonium in soils because it is a direct radioactive decay product of plutonium-241.
Corroboration of plutonium results is possible by using the attendant americium-241 analytical
results. Table 1 includes the soil americium-241 results, while Figure 10 depicts the geographic
distribution of the americium-241 readings. The americium-241 results presented in Figure 10
may be the average of several measurements from separate samples collected after multiple
precipitation events. The americium-241 results for perimeter soils varied from 0.001 pCilg to as
much as 1.2 pCilg. A series of samples that were slightly elevated in americium-241 was found in
the vicinity of Pit 23, Pits A-H, and adjacent to the tritium disposal shafts in the area of sample
series 28-32 (all of these pits and shafts are inactive and covered). A second area with elevated
americium-241 soil levels was found adjacent to the TRU pads in the area of series 48-51. These
two areas of elevated americium-241 reflect the elevated activities of plutonium in soils reported
above in section 6.3 (compare Figures 7 and 10). The collocation of plutonium and americium
activity is expected as stated above.
6.5 Cesium-137
Cesium-13 7 is another isotope of interest at Area G. All perimeter soils and many of the
filtered-water fractions for single-stage samples were analyzed by gamma spectroscopy for
cesium-137, and these data are found in Tables 1 and 2. Figure 11 illustrates a fairly even
distribution of cesium-137 in perimeter surface soils at Area G. Cesium-137 activities in soils
range from 0.019 to 3.28 pCilg. The highest value came from a soil sample collected at the far

l ~1
3.5 .
N
1:1.;~
3.1
17·1 • 2.3
Expansion Area
11_1
~3
10-2 :1117
Sample ID#1o-1 U Cone. 3 ~
14-l 2.3
1··-····-·--· 57-1 ·-·--- .......... ~· 54·1 53-i ,._ ·"--~- •. , ·-~--, "! •• • ..
i" i==~-~"1"~2 1 -~-=-~-:: "- :;: .. .... 1,3-, L·-····-&!~~-~::::::.:~: .: ~~o_.i1 . ___ ~--. ""·' " .,.., "'' ,, .,,
u . r---~ ..• ___ ,·~---J .... .,. .... ... ,.. .... . . . ' ... :~ ·- ' ·:.;· -=:::::;-2?:c-:: c:;::.:--;-~::_ ~ ::....:, .. r~- ;..; . : :a;: - • '-- -- ''-l~. <:.:r· ~ ~ ' ~ -::_ ~ : ; -: ' • •\ , . ------ - .... ,, 2" 1 , '·f !r-·,··: l.t11 .--~--~· r·· f7· --. . ... • --. ., •I I ' •-, • ' ~ . . ··- " ., . . .. ···-..... ,., ..... ,., \ ( \ -- ,. >··;--•. J .,., ",, !~if~ 2 ~ f '----- ..... :t_., --t·:r···-.,~•--···1--1' . I. " \ \ ' ,._, . ;·, ,··~, · • .,,. ,)/• i h,, · '=.
0
-----. , I I/ ! I 1 !'!· '-' f 16-1 \\\\ ~.,/ .\\\223 \\ P•t ~~~- ~.-~~~~~1~~-Jc ---.... ---.. ·.::.-:.::;::;---,-.:::.,:~-:-,· ~- ~h_!l'•_'"_/1 _~, !
• • ' · /• • • · " •• 1 ./ /i ' · r .,., • • · • ,._, • '·' \ ' \\ ,..j f "" \\ ·~· . 39 1;/j' /1 I I I//~ !. ,----::::::· .. ::::.··.::-:.:::.--:.:.::.:.: . .:.~.:::.::1 ,-TR:Ltu. "i .,,.:{: .f.:l :f-.1.: :l.O i.
\
\ I ~ ~ 8 \' .,. 2 ' /j I '' • : ' ' '/ t j I j L J { · • • ~ 1 11-l.\ \\ 2
3
\ 1 "'\.. \ /_~ 'I !/,1; /i~'· - --------- ,_ ···'- n_·· 1J; !_/.
1
• 13-IJ 3.1
:.1,. \\ ·.w .• 1\ I ••• \ /;• t 1/'J ,,1,, 't Jt-.(,_,.., j 2
3 ~ \ \.. ... I ] ' " ' ........ I !{ I! !U '-.}II I (\ "-1', I • .. ..... •
"' ·\ \ \ .. ' • ,., '/ ~;~ "\ /<~-'\ (J\~\.\\ l lj I 3~:> 3
t( a.s .i~-.,_, ' •• ,:: ' • ~ '-\ '·' ' , I. , I'' ,., I .. ; •~• . d' /,,.. '\,, '~ '-<, \' ' I
Color Key
'·' ~-- " •1
:.:-; /?;.., ... > .. \'\... "'· '\ '" \\~, l II II ~ 38-1
'; V/ .... ' " " " '':-. '-\ '\(., \ I i I ' .. •~~-• ~-1 ixed ~.., ... \ /-;/ ~· '\ ~- '\ '\ '\ ·~- ' ! ' I I " .. ,., ..- ,. ' \ ,, ' '' ' .
Waste " .,. ' . ..., \ \,.. ·' .. '\.~ \ '··· .. ,.,. ' '.,.,.. ! TW) SP, '-' '' \ ,_,,. , "",,.I I< ~.
D
ome \\ ~· .. FJ~~'\ "' 3•-• '· . ., .. · -- -~ , , ! 1 1 Background (s5.3 pg1g) .. ) '· ," " ! • ' . ( • ' , '' ' .. .· •• ,._, • I ' , '
\ ... • ·. / .. ~· ' <. - ' i __..., '... 2.4 •. o··.... 32-.a ,· 0 i2.2 l I
_,....... \ r '2.1,· • ' - ! ,._, · eter · ·'" 1 1 • · "14·3 J 3&-
2
• · • 2 2
l
•er~m , ,.. ' · ,.., . , .. · Fence Lm ,.., • " . . e ,· ,. ,_, '·' " , . '· ::1.2
~ .. 1.1
Figure 5: Uranium soil-sample locations and analytical results at Area G. Soil-sample locations are indicated by the square points. Next to each point is a pair of color-coded numbers: the hyphenated sample identification number and the uranium concentration in micrograms per gram of soiL Several Area G landmarks are outlined and labeled for orientation: the perimeter fence line, active pits 37 and 39, the expansion area to the west, and the transuranic waste pads (TRU Pads) and the Transuranic Waste Inspection Project (TWISP) to the east.
31

~~<~ till
II :i-S:' ll.ll I N
Expansion ... : Area I 92
58 J 1 41
. --... "-'-... -!!. ... ., .. ._..,., .. ~ l. .. --·---· '-• ··-·· . 'l
I I
5H . 6.'4
·19 :· 68 .
...... ... . 207
44 ;j 4~-~-1!'\ " " I !f:'
i.l3 • f)'>
•:· .l :><~
1:1·111 i::.:.;P'tt 37:"~·~:::::::::::::::::..:·! ____ , r·····-···-·- ·=--::-.... ·-............ ,,, " ' ,, "·--~' .,_, ' I I• • '· .,_,
~·"· , .. ::~ ~~-. ~~~~~:~J~l~~~~~~i~~~:'~~~:;-·;:::::~:~~:::::::t1 L~~-=-:-~ .. --. I··; 13 4 '87
13 '• ... 1.44
Ill .95
10 2 • '86 t:-16
262
4:> 4 1%
2.os
1
\ ,. .. \,.. ... --- ~,_,\ '1·. ····:.:;;:·:::::;,;·-...... jl! 1/l!!!/l.fJ/iJ/ ' r<·'It~U.fJ ... ·::.+J-.r-~.J I ,, "'' \\ "'',.·'. '•-( \\ \ Pit ,/! /1 /II! /f,ft/;' ·'==""'==- =,J I .l.;d!/1 7 /'7/ 7 /
91, \\ <' 21·2 \\ \\. \ 39 f f/ 1
1
lj( f I /ffi/f/ '-·-.,-. 0 \'--J::o' •<,. ' f 0 ' ' /
\ \ \I \ f "' \;, ~~ I I II f i/fi 'IF. ' c---~"= ·"':c:! r-. f'f1 1- ''>:.ff~: :.
1
' ~~ 17-1\\ , \' . \ .\ \· .. \ \\ \ ;'//~'! /: i. ~-~ /~//. / ··-··--------- ... _'"-· .... ____ ..) ' ~.._...~ ~' ,.: ··t· ;v ,~_ . _,~ / .)
' \
; ' \I I 'I } ,,. '/ 'I' ' ' ---- ' ' ! ",,, ., ,..,,, ,, \ , y 1,. r,'t -...... "'-·· 7
,, ~\\\ \ '\ f j.19 <' 0
13
i \~, / ...-··"\.\ /,1~ l /./....I() l)j <"\.. t •• ·\1 1
1 r ·:· ~ · · • __ ) 1 c. \~ \ , I I <H ' " ' .,, ' N, ' ' , , ' , s2 \ \....... / \._. -o/ /v ,., ~. "\ ... , < \\ \ , 1
1
1 '! ' -' .. ' ·' /-' ' ·~ v ,, " \ ' , , '> ., ,~ d~ .• -~ ""', \ ,., "\ 1 i 1 1
1
Sample 10 #-U Cone.---
13·9 253
.88 o\ .. • • d . \ _..,:;:>· •<~'"\. \·. ~-\t, '~\"\ "' \ ! j I
•• ' ,_, ' ' < ' ' ,, ' ' ts.J Maxe ', ..,,."' ·'"' 28-J '\ t. "-> \,, \\, ' \ • ' ' 1
1
"' "'" Waste ', \ /. " " 'I\ '\ 'I\ \, ~' \\ ', ! T~IS~ ! '·'' / ' ' '' " ,, ,., \' '• . ' ' ' ' Dome ·, / "" '· "" .>'v ' , .;,, \- \ i I i ! '
" \ ~v \:;o'~c,}'' / -~ i ! ! ' ' ~\ ,,. ' ' ' " ' ' ! !. ~ ' "··'. .. . • 31 Perimeter \ '·"' " ' , .. • .....
Color Key
Background (sS mg/L) l<'cnce Line
Above Background (> 10 mg/L) \ .89 34-3 .. . ~ .82
:'14 4 1-42
16·1 2 :It
Figure 6: Uranium analytical results for the filtered-water fraction from single-stage samples at Area G. Single-stage-sample locations are indicated by the square points. Next to each point is a pair of color-coded numbers: the hyphenated sample identification number and total isotopic uranium concentration in milligrams per liter of filtered water. Several Area G landmarks are outlined and labeled for orientation: the perimeter fence line, active pits 37 and 39, the expansion area to the west, and the transuranic waste pads (TRU Pads) and the Transuranic Waste Inspection Project (TWISP) to the east.
33
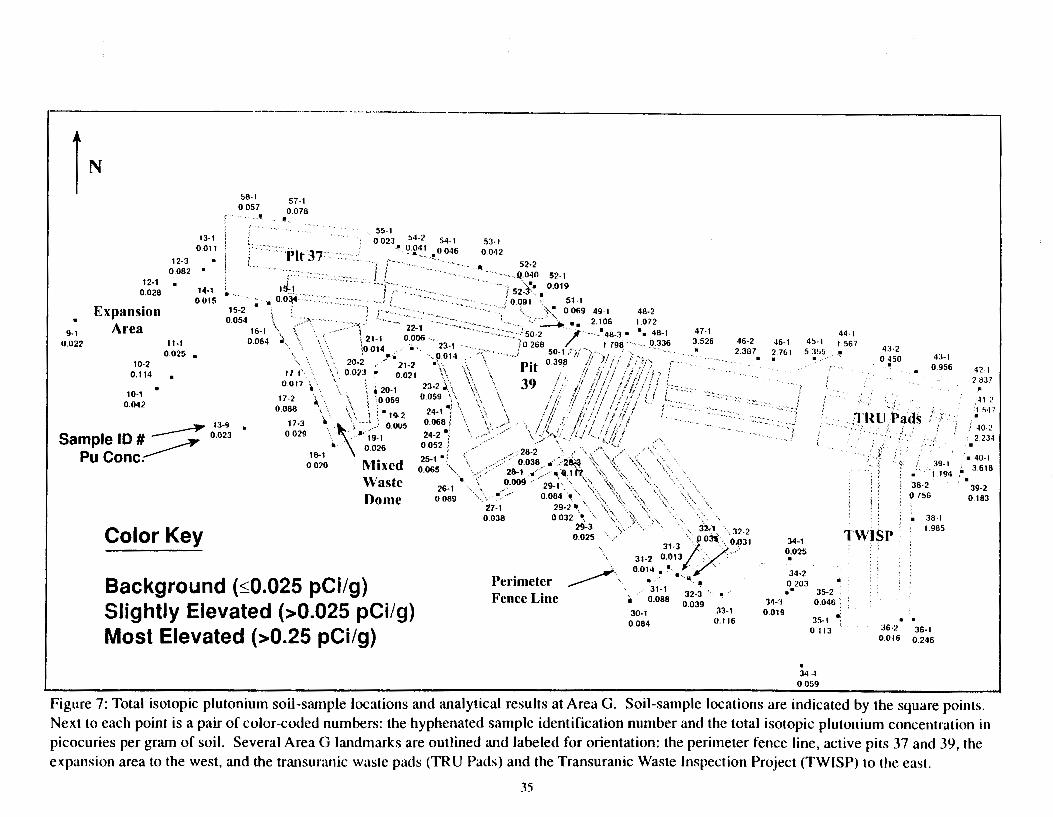
-~-~-
IN 58-1
0 057
9-1 0.022
12-1 0.026
Expansion Area
10-2 0.114
10-1 0.042
12-3
13-1 0.011
0.062 •
tl-1 0.025
14-1 0015
15-2 0.054
57-1 0.078
~
... ·rtt37
,~; • o o:ti
I :, ,
\ 16-1 \
0.064 "
55-1 54-2 54-1 0 023. 0.041 0 046
··. ~. '·"·- .. !1
53-1 0042
: .. ·~-:.:"·•
---- -T21-1
\0014
· .. :::· ........• ' .... ,"
52-2 . Q.040 52-1
52-:j~· 0.019
0.091 , ~ 51-1 ; -.,_ ;~\~ 0.069 49-1 48·2
22-1 .:~·:·... - '· - .. , __. •• 2.106 1.072 0.006 -.-.... -. .. , I 50-2 / O 48-3 0 °o 48-1
;,. 23·1 /0268 1.798 0.336
' •··· , 20-2 _--' :ll-2 -,0.014 ' --- 50-1 'li -;,- ., ; ·- -.
",.. \ · o.on • o.o21 •\:.. ..\ Pit o.39~ · ;/' /,' i/ /. ··_rt···, \~\ \\. \ / /? //// .. l~i;·?~/-~()
0.017 ~. '· ; .. 20-1
17-2 .• - \ \_ ':0.059
23-2ii,, -,·,_ .. 39 ! • /,! u !, ;_,I<·!!
47-1 3.526 46-2
2.387
.. <.::.::::·.:;.
........ •· .. f:~-1\ '\ \) \/l//!4f1/ i 00~-3 'r' \.~>-lJ "01~~
0.029 \_ \··· l9-1 .. 0.026
Sample 10 # ~ 13-9 p ' _-:y 0.023
u Cone.-----
Color Key
16-1 oo2o Mixed
Waste Dome
Background (~0.025 pCi/g) Slightly Elevated (>0.025 pCi/g) Most Elevated (>0.25 pCi/g)
2 • ; 28-2 '• ;
S-l 1 0.038 . , "2&:>:.1 0.065 "- ""/ 28-l .,--·· -~ "Q I tr ...
26·1 '··~. 0069
___ o.oo!l /--~9_";. __ :,_ \~\ • -~ 0.064 -~
27-1 0.036
29-2. 0032 \
29-3 0.025 · . .--
Perimeter Fence Line
___,. ... il
·-~-··
j~, ·-.. ,32-2
Jt-3/{0~ ~-f31 31-2 0.013 /· •' ; 0,014 • • ....
• ·' '4 -~
31-1 32-3 - ~ -·
0.086 0.039 33-1 30-1
0.064 0.116
46-1 2.761 . .
44-1 45-1 1 567
5 355 • 43-2 0 450 .
: .. :}., '-
4:1-1 0.956 42 I
2 8J7
TRll l)ads !· ,.; ' ~ ....
,41 2 '1 ,47
i I 40-2
14-:1 0019
34-1 0.025 .
34-2 0203 ..
.
35-2 0.046
35-1 0.113
34-4 0.059
i. /.
TWJSP
·~.,'_;
, 1 2.234
39-1 • 40-1
1 194 ' 3.618
38-2 0 756
• 38 1 ; 1 965
. 39-2
0.183
. . 36·2
0.016 36-1
0.246
Figure 7: Total isotopic plutonium soil-sample locations and analytical results at Area G. Soil-sample locations are indicated by the square points. Next to each point is a pair of color-coded numbers: the hyphenated sample identification number and the total isotopic plutonium concentration in picocuries per gram of soil. Several Area G landmarks are outlined and labeled for orientation: the perimeter fence line, active pits 37 and 39, the expansion area to the west, and the transuranic waste pads (TRU Pads) and the Transuranic Waste Inspection Project (TWISP) to the east.
35

41 (t(\~~ II l(fl I .•.r,.
II ll.J~).
N 'it. llllt'l
-4i .·: t.J027 I
~8 :J {}~If;
j4 .)
tiH:I 44<
• urr~s
·-···--··-- ........ , ...
I'H l c-.~·~:~·: .. _,_ . . ......... ! . 122 o.o41' ,---Pif37-··--·~---..... : t"··... .. ..... -\
•. ""'"J•,
"' -..... , ~-.. ·..,~
"""' . ,,., . I .. ..,,c =·· ~Li····· ·-.. -. i . ', "':' "'' '' .. , I ' I :::·' '· """'. """' ,., . ~ ~.~ . ,";" ~:.r- ;,~ ~-\ ·~~~~~~;:.JI=::,:z: .::~- "'=~ ,, ~~~ ~ ' r I':~·· . ..
Expansaon llOl o.tl2. \ ~- \ ........... l.,, , llo•4.. .... ··--.. :· ..................... _ ' ! .7 ''j' ~~ r,·_,, 7 I ....... ---.... .. ~ ; \\ • .,. ,.o.···~ ... ~-·\ .•\ ~ .. , ,. :/ •,'/ l,iJ.r'tf '
Are
a 11 ~ "\ \ • \ 'l ,, / • -;· \,.· · \ Pt"t ; !I !f · :; ! '1
': '/ •
1
• I M,tl • , , 1l 1 , f, l ~- .._ ., .. .. ""' '" \ '· ., ' .. ' '\• " I ,., •' ,, '/-I , ..... , ....... ""·-.. I . o . \ \ ' •' '' I \\ \\ < J!l q 'I /, f' C. "· " ~.· "~' "'· ' "" \\ \i ~~ OH' \\ \.\ \39 ;·r;!;'l!,ll!f.!i 'L·-· .::...: .. :.· .. ·.~.:--· .... -...... ./ ol)(u n.•;. \\ ·\\ \ \' •\ 1 ::'lri 1·1./·~·- .. ... ~- ....... . , ·, \ •. • ' '' I '
• '""' '" •. ,, ,, ·'. \;-. , ;J II"''! 'I ----- .. J 10> '• o "" • I . ' ' ' ' , I " ' 0' 1 I• '< 'I;,
4'i ·~
fjl}6 . ... -
II 0~7 ,;~.b . 17 :!" ·• \ '.\ I I" '"" " I I \ \I ; .. · • !.'>.ft. JJj u, if I .?\,
"""' ' .. ,.. """: \•:/ '"' ,.,. " <·., -"<· \ . \ \ IY"
1
~-· I / -~>·' ;, \{ \f "-\ \\ .. · .... '" . ' . "'" / ,.,. '"''. ~ 'I ,,, \'\ \ """' • " l \AY'~ ,.-:::-.\ "\ \ '\\ \~'\ ,., '" ' '(' " .· "' "" \ ,, \\ ,, \ """ """ \ \ ' "':.:: "'"' \\ " ,, .,, \\ \
Sample 10 # u 9
Pu Cone.---- oO?
Color Key
4·,: t Otltr
('
.!f.t,
. () "··
:I , '! t}
; I i
·•i":l ,.u • .,~
Background (:::.0.08 pCI/L) Slightly Elevated (>0.08 pCi/L) Most Elevated (>0.4 pCi/L) Insufficient Soil Moisture (ISM)
~;'" t.t\';\~~;<'\'\\ 0021 .. ~- . Perimeter
,.··.- ~ T~IS~ Fence Line
301 0.031
31-2 32-1. . ·o.w.:!6 o.ooa
34-'l 0018
. . 112 0.01S
• :14-4 0024
'' I ; i ' ( ~
. 36-1 ./. 0018
Figure 8: Total isotopic plutonium analytical results for the filtered-water traction from single-stage samples at Area G. Single-stage water-sample locations are indicated by the square points. Next to each point is a pair of color-coded numbers: the hyphenated sample identification number and total isotopic plutonium concentration in picocuries per liter of filtered water. Several Area G landmarks are outlined <md labeled for orientation: the perimeter fence line, active pits 37 and 39, the expansion area to the wes~. and the lransuranic W<llite pads (TRU Pad-;) and the Transuranic Waste Inspection Project (fWTSP) to the ea<;l.
37

..---- -~----· ---------··------·----.
IN . '
;~ ( ~ .. \.
1.1:!
l)ll.t.; . • : -~ 2
(~ l
I 1: .
1 ;' ~ • l,l l "·'. . 1 :) \ ~~ ! , ..... • • .!) ";t)•l
Expansion 9~ Area
uu2::
n-, I) ).~.\
14-l I} !_)l..lf'
1.J.t
. 'P•
Pit 37
. \
11 I 0 :1s
I) 1.1·1 lt. 1 13'J •• (j,l~iJ
~ d I ~~ ':) 1b \ ... • ,i2 I
llH
1H 2 • "129
Sample ID # .. Pu Cone.---
Color Key
') 1 '~'
11 ~ d I'!
iJ 1
q 1 tJ~I
\ (: :_)('j
21 1 ......
t1 •J H~ •
,._, . \\_·. · .. {;~·; 'liJ3:· •, "., i_ ~· ,I . .. ·' 1 . ·'Jell 1 . •11•l•i I I ~ t.t, • II
1 o 1 : n : ":1;1' ll ,,_, Mixed
Waste Dome
Background (s0.3 pCi/g) Slightly Elevated (>0.3 pCi/g) Most Elevated (> 1.0 pCi/g)
''
. '":
~
l. "·· ......
:Jl 1 •J.·p
:·d J
4g2 0 9(J.I
l) 103 '>0 j 0 ~72 4(!1
0 BOI . ,:; / ;·
.::1/
·•
~rl·f' O!>:i'f . ·.
2ill 28 j 0 11~ 0 3-12
o,
_>q :• il;?li'J
Perimeter ~ Fence Line
30 I :) 0'12
·- ,, -' " 0 IG2
'· , ..
\,'' ..
31 :3 0 j(,l)
• . . 11 2 J:> 1 0 II~ 0U6
·1·1 ,}
1'171 . .
31-1 f) ·l~l
.·
~ -l :, (I ;<,
-15·} 0 ll~?
).f.: II~~ f.f
'11 ·l II J 1 A
I 1 ,.,.
' .
TRU Pads
;'
TWISP
J6·1 I) I)J2
o I 1
Figure 9: Total isotopic plutonium analytical results for sediments from single-stage samples at Area G. Single-stage-sample locations are indicated by the square points. Next to each point is a pair of color-coded numbers: the hyphenated sample identification number and total isotopic plutonium concentration in picocuries per gram of filtered sediment. Several Area G landmarks are outlined and labeled for orientation: the perimeter fence line, active pits 37 and 39, the expansion area to the west, and the transuranic waste pads (TRU Pads) and the Transuranic Waste Inspection Project (TWISP) to the east.
39

IN
1-1 •.018
12·1 -.015
Expansion Area
10-1 ,102
.
13-1 .oot
1~ .005 •
11·1 . t41
14-1 .GOt
58-1 57-1
.112 .183 55-1
[
-- ........ __ .. ____ ··----·--~ .... '··....,_.167 154-2
:;4-1 53-1
r-----1 -~-·~" "' ,., L...... •. _______ -----~ ·---··- - ----a.. ... __ -...183 C"--nft J7---------.., I ---..,. .......... _ --..; • 52-1
..- If ----1 ':. -- .... ~--- -----.. - ---- --.... J 52-3 ·~ 51 1 48·2 2
' -- . - --- • :-::::_-:::::-.- - •iii _, - " ' ... , "' ... , .,_, "' .,_ ,, .,_, L ___ _______ J l__ - .. --
1 • -.,:),'-"!._ •:• "1 •• .,_, .,_, .,._, _,,. ··~- -·--_-·· .. ~--. :4o 42-1 '" ----------- -, - ------ -- ----, /" ( . -- ·-- "' "' "' , ~ - . - . - "" ·--·--;.·, \ I I !.::::::--~ --c::::::::::=:.'O:.·' . - •. · ::· '• · " - '---- -.! ___ ~ --- · / · ''> -----<::_::_'" •
1s.2 '-·--·--·------.. ,.,(_ 22-11 f 502
'' !/j'l·j 1'1~'' r~--------·····---····~--- L /J . 7, ~ ' _...- ... ., ---- -I ., • " -- • --- ' ·-·.024 \ t~ , .-- \ 2•-• .oos 23-1 .--.. ~-------y-----.1 40 5oo2 rf f.';· :l ... nr, t' : ,-< ::::.. :.;~-..£·t--·t··-1::--r._ -. I /41-2
.... ' \ . / ·- • \c~' . • . . i rz' . ---- . . . ·r--.-, -::r-·:: ,.,.. "" •, \ ··"'r. ·"!,. • I Pot 1" !, r I · I 1---=.-,,,.,,,,~,_! L . ll'a s • 1 I 1 ' ,.,_, \\ ~\\ :zo..o1:.!at ./ ~ 23-2 '\ ~\ \ 39 !l ;/~?111 1!1'1 ~fj I}!=.""' '-<~ "-'' ;"'-"
11
i ~l::tf-::~_-.::t:_j._ .. ·L--l !. 110 . \ ·- . ' ' ,, • '• •I ' I . I ' ' ' I ' ' ' ' ' . ~ ' 111\1 ''20-1\ t •
009
"\\ ·.,\,
1
\ I!J 1/ !:1 :;,/ -------.. ___ , < .... •., 'f'7i/ 1! t' 1•4°-• . \. ,.., \ I If " " I' I' --... ,_._ • ' • '" ,019 • • 024
95
° .,, , ; '; f •; 'I 'I •J, t._ ' f '/::.:}···.. 0 0 . 0 ' ' >; " "I . A ., , 7-2~ \\ ' · \ l l · '.\ -~· · \ t :L l1
!..1 ' J ( '{ / \ •• r··. -, 1 I r ............ 3YJ •3. 9· f \ \ l I 2 \ • / .,....,,,, ' .. -·· \ \ I ' ' ,.., "' ... 0.0 \\ ... ...!: 24- ·c ...-~ ,. , .,'"" _.,- '.·., . , ..
' ' / "" . ' 4, ' ( • "' ','- ·,\ \ I l I I 530 014 I . ' .... / / ·;•\ ·. " " " \\ \ I ' I ... .~ -'" ,_, . , ,,?"' -~.!.. \'"' .\. .. , ~. ·"' \. , L 1 ~ 3. 8·1
'\ ·"' v·? ,._,.A' ' .;;!'~ '<. "' '\'\ \). \ I 'jj. r 430 ••• . ··, ( .JD'7,_, \ \ " '\ \ ',\ '\ , ! , I
Sample ID #~ '" • Am-241 C ~ .. ote one.
Color Key ·'" Moxed ,._, '···\ <'/ .., ' \ '()._ '\. "'· \, ';. \, ~:Wl~P 1 l
Waste .151 '-27-1 29;; \ \\\~ )V\ , ... ~-.,.,!' i I ! .076 1 29·:!-, '· >' •. 1-\\,06 '.\ .~6 I ~ !
D
ome "' , v ,_,\ ~~' ' ..... ~.. ..... .. ---~ •
1
1 1 • , . \ . . ,. .- /" ,.., ' . ' ' ' __...,. -, "' , / , ,._, , , ,, 1 I --- \ ,_, •• . . ,_, .. ' I ---" I
Pe
rimeter \ "' _.- ... .• .,. / .• -" I 1 "' 1 ' ' ' . ' •-- I . l.ine • ,.,,_, •· ,.. ,_, ,i • ,. "'
tence v '"' ,_, • ., '.,, L... . .. ,._, ""
Background (s0.04 pCI/g) 30·1 • ,057 .2111
Slightly Elevated (>0.04 to 0.50 pCi/g) Most Elevated (>0.50 pCi/g)
34-4 -.024
640
Figure 10: Americium-241 soil-sample locations and analytical results at Area G. Soil-sample locations are indicated by the square points. Next to each point is a pair of color-coded numbers: the hyphenated sample identification number and the americium-241 concentration in picocuries per gram of soil. Several Area G landmarks arc outlined and labeled for orientation: the perimeter fence line, active pits 37 and 39, the expansion area to the west, and the transuranic waste pads (TRU Pads) and the Transuranic Waste Inspection Project (TWISP) to the east.
41

western end of the site, adjecent to an area where no disposal of radioactive waste has occurred to
date. Although there are no cesium-137 values as elevated as 2.38 pCilg for soil samples collected
at the eastern half of Area G (series 24-48), the soil activities for samples collected from this area
appear in general to have a somewhat higher cesium-137 activity than soil samples collected from
the western end of Area G (a mean of 0.53 pCilg for the eastern side versus 0.47 pCilg for the
western side).
The cesium-137 geographic distribution for the filtered-water measurements from single
stage samples is depicted in Figure 12. The numbers presented in the figure may be an average of
measurements of separate samples collected during multiple precipitation events. To calculate the
averages from any one sampling point when more than one sample was collected, any value
reported as a "less than" was ignored. These data show a wide distribution of cesium-137
activities around the Area G perimeter. Any interpretation of this distribution may have to await
additional results from future studies.
6.6 Metals
Because few data are available on RCRA-regulated metal concentrations in Area G surface
soils, we initiated a preliminary analysis of surface soils for three specific metals using XRF. The
XRF technique is a nondestructive method that irradiates soil particles with x-rays from one of
several sources. Measurements of the subsequent fluorescent radiation can identify particular
metals and determine their quantity when internal calibrations are performed using pure metals.
We chose three pilot metals for this study: barium, lead, and mercury. All three of these metals
have been used by the Laboratory throughout its history for one reason or another. Table 1
includes the results for the XRF determination of soil metals. The concentrations of barium in
perimeter soils varied from 77 Jlg/g to 331 Jlg/g. The concentrations of lead in perimeter soils
varied from nondetects (less than 0.92 Jlg/g) to 26.7 Jlglg. Soil mercury was detected in only 5
out of 83 samples, and of these 5 ~amples, the highest value was 6.1 Jlg/g. There is a very high
uncertainty for these low values for soil mercury when the XRF technique is used. Barium and
lead concentrations around the Area G perimeter are within the expected natural background
concentration ranges as reported by Longmire et al. (1995). Longmire did not report soil
background levels for mercury.
43

IN
,., 0.332 .
12-3 1.430 •
12·1 • 0.151
Expansion Area
11_1
0.474 10-2 2.38 •
14-1 0.381
57-1 5!H $4-1 53-1 ,511:L __ •···~.o ... ogo -·······~ ...•. ,4!:•40 ·o.30 _ ~--·- L-~-.. -·---·-.---1 "·, 0.210 0.410
I L ______ ... __ J ._',;;:;:--·-~---..... .. .•
I·~· LPif37 "--.., I ..... ------.... 'J-...... .... ~· .... .... ~019 ... ~r::..-:::::·::-.;::::;..::::::: .. :::::.L1 ..... ::--c____ /•~. ,_,., :,., ,,,. .,.., ..,, ....
I - •~L_=:c;c~- :.f:_:::::-:::::::::-·:::.:::;_'*'-· \._,. __._:_ • :~ ':'.:. . . ! " . v;:::: ::_,,., ~ ··'~ ~ ~ -- -~ " - - .
Sample 10 # :o-1
Cs~ 137 Cone. o.eoo
~--------.,0.. 1 I -·-------~---0.1130 t . ~ ---.IL! .. --.... ___ 1·--.-----.... 2""··· .. ··-... _ ..... 45-1L o.as --....... --·-·--, r 15-2 • \ L~----~... ior-02-_'l . ......._ .. _____ .. p·l It~ ... f/:. /';·*t1lr l::_r-·~--- .. _o:2 ... ________ 7 o.oa .·--·-#---:::·_~_. r-7 _ •.••. J .·' •• - '.... _,_ • --- I[ .. / !. ·, ~-- ·-,." "'=<: > " •
• . • ' d3-0 _. ' ' ' ' ' ' ' ' ' ' ','; ~ \ ~ \ ... /.. ''"''~·;\ 39 I /iII fl! /Ill_ ~fl C':'-=--,,,,,"~; iTJ!tlfi-7'-dS. II/ ~_/) /.
\\ ~ 20-1, (' 21·2 }23-2 I II !I ~~ J II;/ u~..::::.:::::..-::..-::::::::.:.::::::_.:..--•.. .1 r •f-. -· -~.::~.:.T::l~t·lfOo . .,! • ' · '·"' t '·"' a".1 1 !/ <! 7 ; • ' - --._, I , .1 {' ~ · .,_,
H·l, \ ~ . \ { • ~· ) ~. ,.. .;/;' I Jll . -··--····---.. ---. ._J t '"" I i .... ,f!, II. _I ' I !• 0 3 '·'"\ \ ... • ' I J f ¥1
I I !l I . ··-----........L·1·--..!...JI .... l .. J .... . 'l,ti1 J . ' '250 ° · 0 I! .• I ' ' ''/ · j _, 0s
· ' ' ' · <!I! ' ,- . •--•. @,._),
17-2 ),~ .\ .. \· ;.., :;/ \ IJUI..;J -.J&_ A''~, ! 11 ~2 39-2
'·" -,.~~ · .... / Y \ .. ~.;;: v '" \ \ ! 1 ~-~ o.os
Color Key
1~ • 0.383
n• ' • ,,., ' ,..- , /,A\ '-"' '. . ' I, .
..., i / .... {:'!~ ~~~\~~~~,~-(\-~"~\~~~\ il II •. ,, \/ ..., 1 ,~::/ \ \ ~ '\\ \ \: \ '< I I I
.... '> " - • ...- ... .. \ \\ \ ,... \ \\ J ! 10.074
0
·
404
Mixed
267
·: \.\ -~.., ,..., \\ '{. '\, \, 'c '\;,.,\ •2-2 i ,
1
SP ! .. •>4:- ,., \ " _,, '\\ '"'- • ' '
Waste ,,,. "·"' \!::~- " \ ~'s'""'\"l'' all~~ !
\ \. ·'" 31~~~'-, .. 34·1 ..... ~----- ·-· ... -.I ; ! : Dome \ .,,., ) . / ,'·"' ,.., • 3~5-2 , ·, 31·2 '• -3 ... \ · 1
. ~ \ ...,~_,.,,..._~/ •• '·"' ~" I ..... . l'enmeler \ ~,.., '• "" _, 38-2 • ~ 6-1
Background (s0.44 pCI/g) Above Background (>0.44 pCi/g} L
. 33·1 44 ...... "! 01·· . 3
F
'enec me '·"' •' .,, . .. - . " 0.380 30-1 • 1.170 0.
34-4 0.20
Figure 11: Cesium-137 soil-sample locations and analytical results at Area G. Soil-sample locations arc indicated by the square points. Next to each point is a pair of color-coded numbers: the hyphenated sample identification number and the cesium-137 concentration in picocuries per gram of soil. Several Area G landmarks are outlined and labeled for orientation: the perimeter fence line, active pits 37 and 39, the expansion area to the west, anJ the transuranic waste pads (TRU PaJs) and the Transuranic Waste Inspection Project (TWISP) to the east.
45

iN 01 '
0 1~:1 !
1 =~ , 23S
Expansion Area
Sample ID#Cs-137 Cone. --
0 I
132 • 1'H.
141 1:>6
I:J-·1 ')J~
rl!. ~n
""
1'1'-J • 'Jill
Color Key
··,.~~-
......... ...... ···~ ... ~
'1
~~'. t '191>
. . I (- \,
.4~· } uo~H; .
\ •.. 2\ ' _/ --'· .. ·~---->,;· ~:~\ .. 'J ~(~:-- ;,~~~~;~~ '~---\ '· '\\ I,,., ·i. \\. \;, 'Pit f;· '· ;.::; '/_'!,-. /'- .. \ I \ •~ ~· '· ' ' I' '' ' ' ' I ' \\F-1\- . \ .,,_;. \ \\ ~9 !1/ II!//; !ft,ljf··, ---~ _ ~ 6<1 \\ I 1 Z:l \ \\ I i/ ;! i I I I f I J• I I I I ---------•• \ '~'· 1 - \\' \\ , .
1~ :-- ,; ! • ;'/ t/ 1 I r---:. :::..""'=----- 1
I • ' ' ~ , '• ~· f jf ! I I l / 'it~.. ...... .... ~..:.. -:::::--......
17i. w\- \~, 'I- I'\ \~ \ ilt I '1/,!:,/.- u[_ ···--- -----.;,;;;::::._--:::~-/ -~·~ l -._ - \\ • •. - , • • , ,, • ; • r· , ~---- --- ·------ .. -c • \ \ \ \ I. ' '! 'I '' ' -. .... __ -·--- '
• \ \ ...... 1 , '• \ ' ~ ; ; ,! I; 11 ! /; I ....__ · - - .. ..__ .. - --- } II) ·, '_ ·•· .- B • 111 M"IX'd \ \'·---- / \ fit !lji'J' /f 1/f ~--...... ·--- --- ~-, fi'IIJ ~ -- _ _...;;.-- ! ()., 1~ - \ -:,..·"·\•!.. ' l., __ _, i :, , , • -~---~ ......
.. il w .,-' .. ;;~.;.' -· __ -..,J!i...J A(.._\ ·-11)1 tiV) a$le( _.-;....-:"' • .\ .. : \{\ _ _.-... _./ ·;_\ \ .m f) <'I Dorlle \ .. -;:: , ;-a a \·:.. ·x\ \.,, \~, \\ \.,
-., <··· 028'.. \;, 'tl \ ., \\ \ ·--, \ '• \ '1\ \\ '\··- \•. \\ .,
··-<·.:>- / ~--~~.:<>\,_:\~~~~-:;;~:\<->~;.:, 2fi9 \ \ \\ \, \'• \', \\
\\'>' V\~:;\:\,
•· 4'>~ l}l! ". ! . i J '" . ~-~;- . -, !' ::.:t~'lii i f::: .. fJ:) / L . ' I ; I I i 'l ' r; :-:: .Paqs I ! / ,' I I /./ /.l}Jf;t:::_J /
, 4 f "I .. i I r~ ····~ J j r.. -.) 1 ll I l I ! i I !
! I! ~ISP ·., I '
! I I : ~ t ~
Perimeter ~ Background (s1 0 pCI/L) Fence Line
JJIG 342 !llil
! ' l \ I; ! ( .,_
1 ~
Figure 12: Cesium-137 analytical results for the filtered-water fraction from single-stage samples at Area G. Single-stage water-sample locations are indicated by the square points. Next to each point is a pair of color-coded numbers: the hyphenated sample identification number and the cesium-137 concentration in picocuries per liter of filtered water. Several Area G landmarks are outlined and labeled for orientation: the perimeter fence line, active pits 37 and 39, the expansion area to tl1e west, and the transuranic waste pads (TRU Pads) and the Transuranic Waste Inspection Project (TWISP) to tl1e east.
47

7.0 DISCUSSION
7.1 Tritium
Tritium has unique chemical properties that distinguish it from most radionuclides. As an
isotope of hydrogen, tritium can exchange with the normal hydrogen atoms in compounds such as
water. From information gathered at many facilities where tritium is stored, including LANL,
weknow that tritium can migrate some distance from its place of origin. Tritium in the soils at Los
Alamos has a wide distribution from both fallout and Laboratory activities. Disposal of hundreds
of thousands of curies of tritium in a series of pits, shafts, or pads occurred at Area G since this
facility opened in 1957. A relatively unstable isotope, tritium has a half-life of 12.26 years, during
which time half of the tritium transmutes into helium by emitting a low-energy beta particle.
This investigation began a systematic sampling of perimeter soils at Area G for tritium
concentration, which will continue on an annual basis. These analytical results and their
interpretation will be an ongoing product of this investigation. An important question that needs to
be answered is that of the relationship between the tritium found in surface-soil and water-runoff
samples and the actual distribution of tritium at the site. Our goal is to better defme the actual
tritium distribution in surface soils at Area G by gathering these tritium concentration data over a
period of years.
Except for inadvertent discharges of tritium to the ground surface, the major sources of
tritium at Area G are material that has been disposed (buried or emplaced) in one or another of the
many shafts, pits, and pads at the site. We expect the probability offmding tritium at elevated
levels to be greatest in closest proximity to these sources. Tritium is found in almost all surface
soils and in surface-water runoff in the active part of Area G with activities greater than
background concentrations. The question is, by what pathway does subsurface tritium migrate to
the surface, from which it could possibly be carried offsite? We have identified two primary
mechanisms for tritium transport: vapor-phase migration of tritiated water and capillary action.
Secondary mechanisms would be evapotranspiration, transport to the surface via vegetation or
burrowing animals, and anthropic activities such as excavation of tritium-contaminated soils.
Tritiated water (or other tritiated compounds with high vapor pressures) can migrate in the
vapor phase from the subsurface to the surface. Upon reaching the surface, does tritium simply
vent into the atmosphere or is there a mechanism for it to concentrate in surface soils? There is no
apparent reason for tritiated water vapor to have a preference for either attenuating or concentrating
on surface-soil sediments except for the tendency of very dry surface soils to absorb water vapor
that may migrate from below.
A second mechanism through which tritium could arrive at the surface (and have some
residence time) would be by capillary action. Capillary action is the phenomenon by which a
liquid rises in a tube (or a network of"tubes," as in packed soil) because of the difference in
49

50
surface tension between the water molecules themselves and between the water molecules and the
surface of the tube (or packed soil particles). Unlike water transported in the vapor phase, water
transported by capillary action can also carry dissolved compounds. Thus, tritium that exists as a
dissolved chemical species can also migrate upwards to surface soils by capillary action.
By either of these two mechanisms-vapor-phase transport or capillary action-tritium could
move from subsurface soils to surface soils. Tritium's residence time in surface soils is unknown
because we do not know how the tritium migration rates from subsurface to surface soils compare
to the rates of tritium removal from the surface by evaporation or by other mechanisms. In
addition to evaporation, the mechanisms by which tritium can be removed from the surface are
1. exchange with and runoff with surface water,
2. percolation back into the subsurface after a storm event,
3. air reentrainment of surface soils (containing tritium) during periods of high winds or
human intervention, and
4. evapotranspiration by vegetation.
These tritium dispersal mechanisms are important because the date and time a sample is taken may
have an impact on the measured tritium concentrations in soils and waters. For example, during
long dry periods one would expect the movement of tritium on near-surface soils to be from the
subsurface to the surface, and ultimately away from the surface by evaporation. The first
significant surface-runoff event of the season might yield water samples that have higher or lower
than average tritium activities. Similarly, if soil sampling occurred after a long dry period, would
the tritium in the soil be higher or lower than the average value that would be found for that
sampling point if samples were taken every day of the year? If soil samples were taken the day
after a storm, would a lower than representative tritium concentration be expected because some of
the tritiated surface sediments were carried off in surface water or the tritium in the soil diluted by
the rain water? Or would a lower tritium concentration be expected because the tritium in the soil
exchanged with hydrogen in the precipitation water and was removed?
Is it worthwhile even taking surface-soil and surface-water-runoff samples for tritium? The
authors believe it is. If one looks at the maps of Area G tritium activities (Figures 3 and 4), it is
evident from the FY 93 data that there are regions of Area G where tritium concentrations are
particularly elevated. These regions are predominantly in the perimeter area adjacent to Canada del
Buey between MDA stations 42 and 51. The TRU pad surface and subsurface-soil data also
indicate an inventory of tritium in this area, while the other localized areas of elevated tritium are
adjacent to the tritium storage shafts (between MDA stations 28 and 31). There are several other
isolated locations at Area G where surface soils have elevated levels of tritium.
Unless more is learned about the surface tritium flux (and there are ongoing studies at Area
G), a sample taken at any given time can only provide a snapshot of the tritium surface
concentration at that particular time. The flux effect may be minimized by taking all samples at the

·same time because each surface-soil location would be subjected to the same atmospheric
conditions. A simultaneous sampling strategy would at least serve as a control for the seasonal
and daily changes in the rate at which tritium is removed from the surface.
As sampling for tritium continues on a year-to-year basis, the true or representative
distribution of tritium in soils throughout Area G should become more apparent. With more
tritium sample data in hand, the overall distribution of tritium at Area G should be established so
that a detennination can be made as to whether it is possible to defme annual increases or decreases
in tritium activity in surface soils.
7.2 Uranium
The measured range of total uranium in perimeter Area G soils is slightly above background
concentrations for soil uranium found throughout the Laboratory. Longmire et al. (1995) collected
72 soil samples from background soils at LANL, processed these soils using a nitric acid leaching
procedure (Method 3050), and analyzed the extracted metals (including uranium) according to
approved SW 846 methods. The mean for total background uranium was 0.94 J.Lg/g with the
range for total soil uranium between 0.20-2.40 J.Lg/g. When compared to Longmire's Laboratory
wide background data, perimeter soils at Area G apparently have slightly higher total uranium
values. It is possible that the extraction procedure Longmire used (Method 3050) was not
sufficiently quantitative because it does not involve as complete a digestion as the method we used
to extract soil samples for this study. Longmire also had 75 background soil samples analyzed by
neutron activation, a technique which would have yielded analytical results more analogous to the
total-soil-digestion method we used. Longmire's mean uranium value using this technique was
3.41 J.Lg/g, a number more in line with the uranium values we report for soils at Area G. In FY
94, soil samples were taken just to the west of active operations at Area G. This area is where
Waste Management intends to expand their disposal facilities. These surface-soil samples are
being analyzed for total uranium (and other radioisotope and hazardous constituents). The mean
value for total uranium from these samples may be more indicative of background levels for
Area G than the Longmire background data for LANL. The data on uranium levels in the new
expansion area at Area G will be presented at a later date in the FY 94 report on Area G perimeter
sampling.
The single-stage water samples were also analyzed for total uranium. Only the filtered-water
fractions (after the sediments were filtered out) were analyzed for uranium. The results varied
from a high of 16.34 J.Lg!L at G-21-1 to many values less than 1 J.Lg/L. The geographic
distribution of the readings for uranium in the water fraction of the single-stage samples is shown
in Figure 6.
51

52
7.3 Plutonium Isotopes
As stated above in section 6.3, the locations of elevated plutonium readings are consistent with
the history of plutonium disposal at Area G. Figure 2 indicates that the lower-numbered pits (Pits
1-24), all the disposal shafts, and the TRU pads are located in the eastern half of Area G. We
must consider the location of the disposal units, their age, and the estimated amount of disposed
radioactivity to explain wh)' elevated levels of plutonium are being detected. We assume that
increased levels of activity in surface soils are directly related to the location, quantity, and age of
the disposed material. In other words, there is a greater probability of fmding a contaminant
adjacent to its place of disposal, greater quantities of disposed contaminants should correlate with
higher environmental contaminant levels, and the longer a contaminant is in a specific location, the
greater the probability will be that this contaminant will be disseminated. In fact, we fmd the
highest plutonium activities in soils at the eastern end of Area G, in particular adjacent to the TRU
pads and disposal pits 2-10.
We also determined that there is a correlation between elevated plutonium levels in the water
fraction and elevated plutonium levels in the sediment fraction for the single-stage water samples.
Figures 8 and 9 show such a correlation for stations G-39-3, 41-1,49-1,41-4, and 49-2.
According to our definitions of elevated plutonium values, plutonium levels are elevated in both
the water fraction and the sediment fraction for single-stage water samples in these five cases. We
also observe a second geographic correlation between elevated plutonium levels in perimeter soils
and elevated levels in the sediment fractions of the water samples. Figure 7 (plutonium levels in
perimeter soils) and Figure 9 (plutonium levels in single-stage sediments), show that the area
adjacent to the TRU pads and disposal pits 2-10 have the highest plutonium levels for both
surface-soil and single-stage sediment samples.
Finally, as is known from historical data (Purtymun, 1990) and by examining plutonium
isotope activities in the water and sediment fractions for each single-stage sample collected in this
study, plutonium is concentrated in the sediment fraction of surface-water runoff. Plutonium and
its compounds are relatively water insoluble, thus we expect that plutonium isotope concentrations
in the water fraction of single-stage samples will be small. On the other hand, plutonium isotopes
can be associated with soil either by ion-exchange adsorption on soil particle surfaces or as
insoluble plutonium particles in their own right. If adsorbed on soil particles, plutonium would
preferentially bind the smaller-sized particle fractions because of the greater surface area per unit
mass of soil. Insoluble plutonium particles would also be expected to have a small diameter.
Also, the smaller-sized soil particles would be more easily transported out of Area G than larger
particles during a surface-water-runoff event.

7.4 Americium-241
As stated above in Section 6.4, the trend is to find elevated americium-24Ilevels in perimeter
surface-soil samples where there are elevated levels of plutonium isotopes. This trend is generally
illustrated by comparing the data depicted in Figures 7 and I 0.
7.5 Cesium-137
As discussed above in ·section 6.5, the highest cesium-137level found in perimeter soils at
Area G is located at a site adjacent to an area where no disposal of radioactive waste has occurred
and only slightly elevated levels of cesium-137 in surface perimeter soils have been found. In
general, however, there is a slightly higher average level of activity (0.5 pCi/g ) at the eastern end
of Area G than at the western end (0.47 pCi/g).
7.6 Metals
Our initial results for metals concentrations in perimeter soils at Area G are based on the XRF
analytical technique. These results indicate that the three metals tested-barium, mercury, and
lead-are within background concentrations for Laboratory soils. The XRF technique, however, is
not an accepted EPA method for quantitative metal analysis. For this reason, during the FY 94
field season, some perimeter soils will be collected and submitted to CST -3 for Method 3050
leaching followed by inductively coupled argon plasma and atomic absorption analytical
procedures for measuring metals in soil samples. These same samples will also be analyzed by
XRF for barium, mercury, and lead so that the accuracy of the XRF technique for these three
metals can be determined.
53
54
REFERENCES
Department of Energy, "General Environmental Protection Program," DOE order 5400.1 (June, 1990).
Department of Energy, "Radioactive Waste Management," DOE order 5820.2A (September, 1988).
N. Korte and D. Ealey, "Procedures for Field Chemical Analyses of Water Samples," Department of Energy report DOE GJ!fMC-07(83) (1983).
P. Longmire, S. Reneau, P. Watt, L. McFadden, J. Gardner, C. Duffy, and R. Ryti, "Natural Background Geochemistry, Geomorphology, and Pedogenesis of Selected Soil Profiles and Bandelier Tuff, Los Alamos, New Mexico," Los Alamos National Laboratory report LA-12913-MS (February, 1995).
W. Purtymun, R. Peters, and M. Maes, "Transport of Plutonium in Snowmelt Run-Off," Los Alamos National Laboratory report LA-11975-MS (July, 1990).

APPENDIX:
FIDLER PROBE MEASUREMENTS AT AREA G PERIMETER SITES Environmental Surveillance for Fiscal Year 1993
1.0 PURPOSE
A FIDLER (field instrument for the detection of low-energy radiation) probe was used during
FY93 to measure low-energy gamma and x-radiation on surface soils at 70 survey locations
around the perimeter of Area G. These 70 locations were surveyed and established in 1991 at
minor drainages emanating from Area G in locations that were considered most likely to receive
surface-water runoff (and associated sediments) from the site during precipitation events. By
configuring the FIDLER probe so that it measured surface-soil gamma activity, we could identify
any elevated gamma activity at these specific sites. Such annual measurements of low-energy
gamma radiation allow us to determine whether there have been any changes in surface-soil
gamma readings. These changes can serve as an early warning of the movement of radioactive
contaminants out of Area G.
These FIDLER measurements continue the environmental surveillance of radioactive material
disposal areas (MDAs) located at LANL. Until1991, a PHOSWICH instrument was used for
surface-soil, low-energy gamma measurements at Area G. At that time 16 unsurveyed locations
were measured annually. In 1991, 70 locations were surveyed and permanent markers were
established to standardize the surveillance points. In 1992, a FIDLER probe was purchased and
used for Area Glow-energy gamma surveys at the 70 MDA survey points. This procedure was
continued in FY93.
2.0 METHODOLOGY
A FIDLER probe (a thin-layered sodium iodide crystal/photomultiplier tube assembly) with a
multichannel analyzer can focus on regions of interest (ROn in the low-energy gamma and x-ray
spectra, regions that are responsive to radionuclides of interest.
At Area G, the radionuclides of interest to this study are americium-241 (as an indicator for
the presence of plutonium) and cesium-137. Americium-241 is found with plutonium and,
because it has a strong peak (60 keV) in the low-energy gamma spectrum, can be measured in the
field with a FIDLER probe to serve as an indicator of the presence of plutonium on surface soils.
The ROI around the 60 ke V peak is termed ROI 2. A second peak at 17 ke V is surrounded by
another ROI (ROI 1), which also indicates the presence of americium/plutonium. Cesium-137 has
a peak in the low-energy gamma spectrum at 32 keV, the region which is termed ROI 3.
The calibration of and measurements taken with the FIDLER instrument were done in
accordance with LANL-ER-SOP-10.04, "FIDLER Instrument System."
55
56
During field measurements, the probe was mounted using a tripod with the probe's entry
window fixed at 12.0 inches from and parallel to the ground surface. A 200-s count was made at
each of the 70 MDA survey locations (and at 10 background soil points located immediately
across the road from Area J). Three measurements are generated at each survey point: the number
of counts per 200-s period for each ROI, 1-3. In Appendix Table 1, the sum of the 200-s counts
for the two ROis that reflect americium/plutonium gamma emissions (ROis 1 and 2), is listed for
each MDA survey point. The 200-s count for ROI 3 (the cesium-137 ROI) is also listed. For
example, for location G-1 the sum of the 200-s count for ROI 1 and 2 is listed as 8758 and the
200-s count for ROI 3 is listed as 1712.
3.0 RESULTS AND DISCUSSION
The ten soil-background counts (measured at points located immediately across the road from
Area J) yielded an average of 8668 counts per 200 s as the count sum for ROis 1 and 2, and 1667
counts per 200 s for ROI 3. We compare these background averages to the counts measured
using the same procedures at each of the 70 MDA survey points around Area G. From this
comparison (Table 1), we can see that, except for location G-1 (or MDA-1), the low-energy
gamma activity for the other MDA survey points is decidedly higher than background.
A scatter plot of the count sum for ROis 1 and 2 at each MDA survey point is shown in
Appendix Figure 1. The count results at 2 of these locations (G-17 and G-43) are definitely higher
than the measurements at adjacent locations. It is not mere coincidence that these two MDA
survey points are adjacent to radioactive-waste-storage domes. One dome (nearest G-17) serves
as storage for thousands of drums of mixed waste. The secm1d dome is over TRU Pad 2. We
attribute the higher-than-expected count rate to "shine" that originates from the domes. Shine can
be thought of as gamma radiation emanating from a broad source (such as a dome or pile of hot
material). Shine manifests itself over larger distances than the 1-ft distance we used for FIDLER
counts of ground-surface activity .. We were able to determine if there were any counting artifacts
introduced by shine by using the following three tests: ( 1) placing a shield between the suspected
shine source and the FIDLER probe, (2) pointing the probe opening away from the suspected
source, both of which tests result in lower 200-s counts; and (3) taking a soil sample, which would
not exhibit extraordinary gamma activity because the soil itself is not the source of the measured
gamma radiation. From these three tests, we determined that the high readings at MDA survey
points G-17 and G-43 were due to shine and not high gamma activity in soils.
Finally, the scatter plot (Appendix Figure I) indicates that all of the MDA survey counts,
except for location G-1, are elevated over background. The counts are slightly elevated from
points G-2 through G-13 (moving from AreaL to the old Area G gate). From MDA survey
points G-14 through G-44, which encompass all the MDA survey points from the old gate
through the TRU pads, there is a slow upward trend in gamma activity. For MDA survey points

· G-45 through G-54, the gamma activity trends first downward through MDA survey point G-51,
then upward through MDA survey point G-54. Finally, from MDA survey points G-55 through
G-70, the gamma activity trends slowly downwards as the surveillance proceeds westward and out
of Area G. At this time we cannot determine whether the observed trends in low-energy gamma
radiation for the Area G MDA survey points are due to incremental increases or decreases in soil
gamma activity, or whether these trends are due to manifestations of area-wide shine that affects
individual soil gamma activities.
57

Appendix Table 1: FIDLER surveillance counts of low-energy gamma activity around the periphery of Area G.
Spectroscopic Regions of Interest (Counts/200 s)
MDA Survey Point ROI 1 ROI2 !R0Is(1+2) ROI3
G-1 1354 7404 8758 1712 G-2 1759 9371 11130 2026 G-3 1789 10614 12403 2333 G-4 1730 10205 11935 2318 G-5 1885 10491 12376 2418 G-6 1872 10444 12316 2375 G-7 1889 10634 12523 2429 G-8 1689 8002 9691 1942 G-9 1706 8803 10509 1989
G-10 1654 8911 10565 2029 G-11 1743 9060 10803 2152 G-12 1749 8968 10717 2002 G-13 1655 8713 10368 1919 G-14 1958 9717 11675 2254 G-15 1870 9752 11622 2315 G-16 1895 10030 11925 2285 G-17 2462 13236 15698 3044 G-18 1998 10777 12775 2506 G-19 2026 10885 12911 2507 G-20 2084 11056 13140 2588 G-21 1981 8628 10609 2169 G-22 1974 10538 12512 2699 G-23 2070 10874 12944 2764 G-24 1979 10700 12679 2424 G-25 2021 11054 13075 2547 G-26 1995 10687 12682 2330 G-27 1939 10031 11970 2313 G-28 2204 12755 14959 2728 G-29 2175 12323 14498 2672 G-30 1914 10160 12074 2346 G-31 1919 10610 12529 2308 G-32 2112 11322 13434 2499 G-33 1910 10590 12500 2435 G-34 1941 10576 12517 2334 G-35 1812 9426 11238 2205 G-36 1787 9525 11312 2138 G-37 1980 10167 12147 2358 G-38 2244 11026 13270 2943 G-39 2259 10706 12965 3135 G-40 2453 11634 14087 3335
(continued)
58
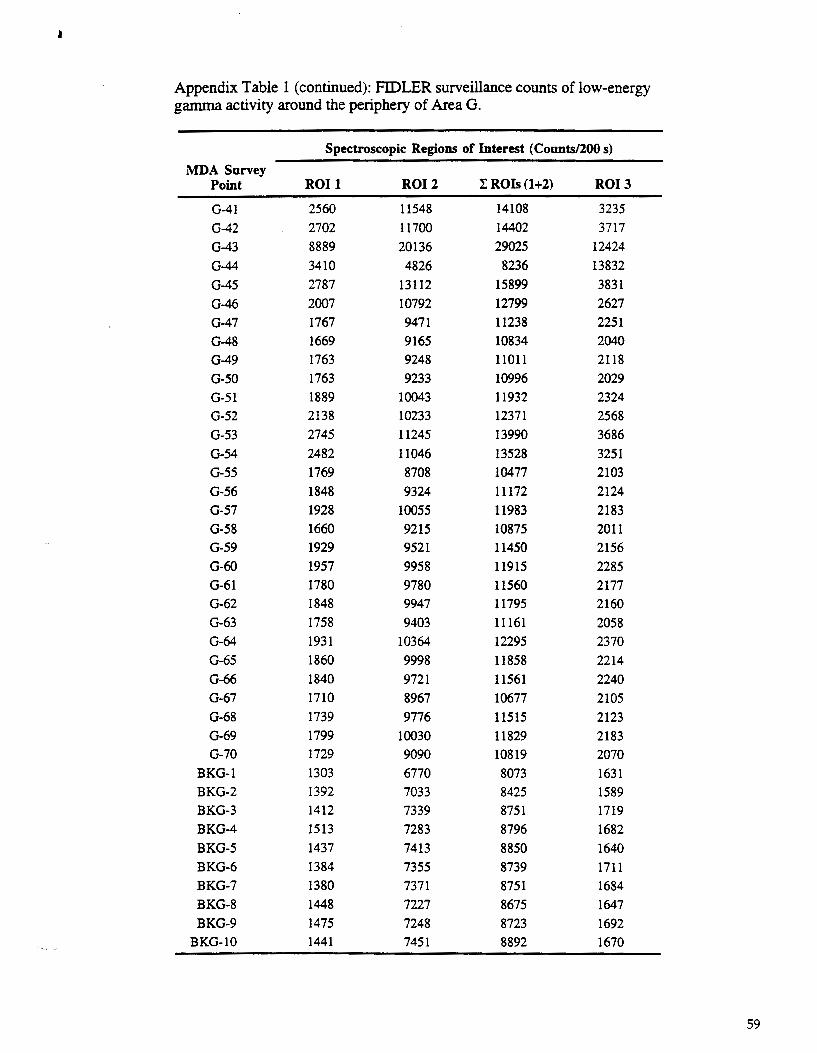
Appendix Table 1 (continued): FIDLER surveillance counts of low-energy gamma activity around the periphery of Area G.
Spectroscopic Regions of Interest (Counts/200 s)
MDA Survey Point ROI 1 ROI2 IR01s(1+2) ROI3
G-41 2560 11548 14108 3235 G-42 2702 11700 14402 3717 G-43 8889 20136 29025 12424 G-44 3410 4826 8236 13832 G-45 2787 13112 15899 3831 G-46 2007 10792 12799 2627 G-47 1767 9471 11238 2251 G-48 1669 9165 10834 2040 G-49 1763 9248 11011 2118 G-50 1763 9233 10996 2029 G-51 1889 10043 11932 2324 G-52 2138 10233 12371 2568 G-53 2745 11245 13990 3686 G-54 2482 11046 13528 3251 G-55 1769 8708 10477 2103 G-56 1848 9324 11172 2124 G-57 1928 10055 11983 2183 G-58 1660 9215 10875 2011 G-59 1929 9521 11450 2156 G-60 1957 9958 11915 2285 G-61 1780 9780 11560 2177 G-62 1848 9947 11795 2160 G-63 1758 9403 11161 2058 G-64 1931 10364 12295 2370 G-65 1860 9998 11858 2214 G-66 1840 9721 11561 2240 G-67 1710 8967 10677 2105 G-68 1739 9776 11515 2123 G-69 1799 10030 11829 2183 G-70 1729 9090 10819 2070
BKG-1 1303 6770 8073 1631 BKG-2 1392 7033 8425 1589 BKG-3 1412 7339 8751 1719 BKG-4 1513 7283 8796 1682 BKG-5 1437 7413 8850 1640 BKG-6 1384 7355 8739 1711 BKG-7 1380 7371 8751 1684 BKG-8 1448 7227 8675 1647 BKG-9 1475 7248 8723 1692
BKG-10 1441 7451 8892 1670
59

60
30000
25000
ell "0 20000 c 0 u a)
en 8 15000 N '-a) c. ell
E 10000 ::I 0 u
5000
0 0 10 20 30 40 50 60 70
MDA Survey Point Number
Appendix Figure 1: Scatter plot of FIDLER surveillance counts of low-energy gamma activity around the periphery of Area G. Counts per 200 seconds for the sum of ROis 1 and 2, spectral regions that indicate americium and plutonium activity, are plotted verses the MDA survey point number. The high values for the circled points at locations G-17 and G-43 were shown to be due to shine artifacts.

This report has been reproduced directly from the best available copy.
It is available to DOE and DOE contractors from the Office of Scientific and Technical Information, P.O. Box62, Oak Ridge, TN 37831. Prices are available from (615) 576-8401.
It is available to the public from the National Technical Information Service, US Department of Commerce, 5285 Port Royal Rd. Springfield, VA 22161.