Embed Size (px)
Citation preview

Areej Jouhar & Hafsa El-Zain 2015-2016
Biostatistics BIOS 101
Lecture #1 INTRODUCTION TO
BIOSTATISTICS
Foundation year

GRADE DISTRIBUTION
Grade :
Subject :
10 Quizzes
10 First Assessment exam
10 Second Assessment exam
20 Practical exam
10 Self learning (Project)
40 Final exam
100 Total 2

Resources
• Book: Biostatistics Basic Concepts and Methodology for Health Sciences.
• Online book: http://onlinestatbook.com/2/summarizing_distributions/measures.html
• Online book: http://www.statisticallysignificantconsulting.com/Statistics101.htm
3

Course Contents
• Lecture 1,2 and 3 – Introduction to Biostatistics and types of data variables.– Data collection methods.– Frequency distributions – Present data in form of graphically and numerical
• Lecture 4,5 and 6– Calculate and interpret Central trendy Measures– Calculate and interpret Variation Measures.– Introduction to Sampling distribution
4

Course Contents
• Lecture 7 and 8– Inferential statistics probability distributions – Inferential statistics normal distributions
• Lecture 9 – Central limit theorem
5

Outlines
Learning objectivesWhy we learn statisticsVariablesPopulation and samplesTools of statistics
Descriptive statisticsInferential statistics
Data typesQualitative dataQuantitative data
Data measurements levelsSummary 6

Learning Objectives
After completing this Lecture , you should be able to:
Know key definitions:Population vs. Sample What we mean by variables ( dependent vs.
independent).Qualitative vs. Quantitative data Explain the difference between descriptive and
inferential statisticsUnderstand how to categorize data by type and level of
measurement.7

What Is The Statistic Statistic is a field of study concerned with :
Collection, organization , summarization data
The drawing of inferences of a huge quantity of data when only a sample of the data is examined
8

Why We Learn Statistic
Statistic provides a way of organizing data to get information on wider and more formal (objective) basis than relying on personal experience (subjective).
9

Variables
variables are anything that might change from one
to another ( students marks, kids heights )
EXAMPLE : Math mark of students it will change from student to another ,,, Blood group of patients (O+ , O-, B+, B-, A+, A-, AB+, AB-) ,,, students ages
10

Populations and Samples
A Population is the set of all items or individuals of interest Examples: All registered patients of specific disease
A Sample is a subset of the population Examples: A few patients selected for dental testing Every
100th receipt selected for audit
11

Tools Of Statistics
Descriptive statisticsCollecting, presenting, and describing
data
Inferential statisticsDrawing conclusions and/or making
decisions concerning a population based only on sample data
12

Descriptive Statistics Collect data
e.g., Survey, Observation,
Experiments
Present data e.g., Charts and graphs
Characterize data e.g., Sample mean =
n
x i
13
Inferential Statistics
Sample Population
•Making statements about a population by examining sample results
Sample statistics Population parameters (known) Inference (unknown, but can
be estimated from sample evidence)
14

Inferential Statistics
Estimatione.g., Estimate the population
mean age using the sample mean age
Hypothesis Testinge.g., Use sample evidence to test
the state that the population mean age is 54 years
Drawing conclusions and/or making decisions concerning a population based on sample results.
15

Examples: Number of
Children Number of
students absent
Examples: Weight Age
Examples: Academic
grades Clothing
size(small, medium, large)
Examples: Marital Status Medical Specialist Tooth Stain Color
Data Types
Quantitative Qualitative
16

Qualitative Data Quantitative Data•Deals with descriptions.
•Data can be observed but not measured.
•Colors, textures, smells, tastes, appearance, beauty, etc.
• Deals with numbers.
•Data which can be measured.
•Length, height, area, volume, weight, speed, time, temperature, humidity, sound levels, cost, members, ages, etc.
17
Data Types
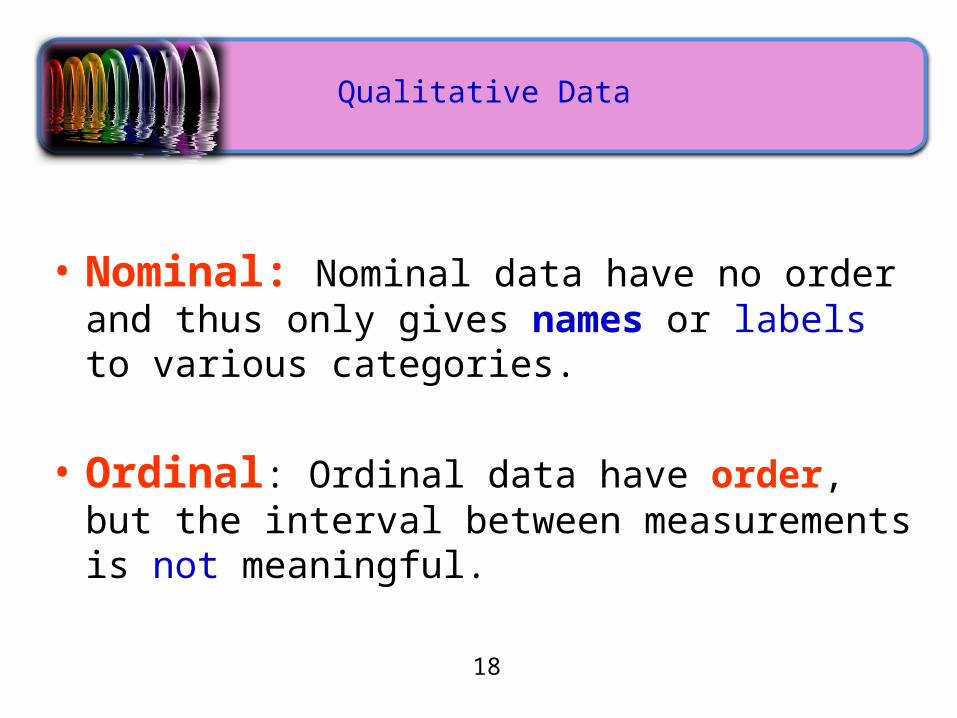
Qualitative Data
• Nominal: Nominal data have no order and thus only gives names or labels to various categories.
• Ordinal: Ordinal data have order, but the interval between measurements is not meaningful.
18

Data Measurement Levels
Ratio/Interval Data
Ordinal Data
Nominal Data
Highest Level
Complete Analysis
Higher LevelMid-level Analysis
Lowest Level
Basic Analysis
Categorical Codes ID Numbers
Category Names
Rankings
Ordered Categories
19

Reviewed key data collection methodsIntroduced key definitions:• Population vs. Sample
• Qualitative vs. Quantitative data
Examined descriptive vs. inferential statistics
Reviewed data types and measurement levels
Summary
20

21


![Amani Jamal Areej Alhothali arXiv:2111.05671v1 [cs.CL] 10](https://img.pdfslide.net/doc/110x75/62771c6dce7fb93448419174/amani-jamal-areej-alhothali-arxiv211105671v1-cscl-10-.jpg)