Embed Size (px)
Citation preview
AREF Energy Holding Company K.S.C.C ● January 2013 P a g e | 1
www.capstandards.com
Corporate Credit Rating Analysis – Update Investment Sector Report No: 1141003
AREF Energy Holding Company K.S.C.C.
January 20
th, 2013: Capital Standards (CSR) has affirmed the corporate credit rating for AREF Energy Holding
Company (K.S.C.C) at “BB+” on an international scale and “BBB+KW” on a national scale. The outlook for the rating remains stable. The previous rating was done in December 2011.
Key Indicators
Rating Action
9M2012 FY2011 FY2010 FY2009 FY2008
Total Core Income (KWD,mn) 1.09 1.10 25.09 0.06 0.00
Net Profits (consolidated) (KWD,mn) (13.9) (7.32) 10.43 (9.55) (3.50)
Net Profits (attributable to AREF Energy) (KWD,mn) (9.46) (5.11) 10.80 (7.96) (3.64)
Total Debt (KWD,mn) 3.74 3.10 10.54 20.00 16.43
Total Assets (KWD,mn) 83.05 93.74 113.07 109.97 116.62
Market Value to Debt (40.67%) (43.83%) (71.16%) 84.67% 48.62%
Coverage Ratio 10.23x 6.49x 0.07x 0.31x 0.01x
Adj. Liquidity Ratio 11.92x 16.35x 8.68x 2.96x 2.72x
Debt/ Equity 5.68% 4.17% 12.61% 27.03% 19.47%
Total Invested Assets/ Total Assets 71.15% 74.54% 35.83% 35.08% 35.57%
Return on Capital Employed (%) (19.97%) (9.46%) 11.08% (10.16%) (3.47%)
Mr. Mahir F. Palejwala
[email protected] +965-2244-3523 Ext. 108
Ms. Aminah M. Abotalaf
[email protected] +965-2244-3523 Ext. 105
Company Profile
AREF Energy Holding Company K.S.C.C “An investment holding company with key investments in energy exploration & production (E&P) services and energy services establishments with a geographical reach over the wider MENA and FSU regions, established in 2007 with a paid-up capital of KWD 75.0 mn”
Principal Activities Investments in influential stakes in both energy & energy service companies, with focus on value maximization are the company’s main activity.
Category Previous Rating (as of Dec. 2011)
Current Rating (as of Jan. 2013)
Corporate Credit Rating
BB+ BB+
National Rating BBB+kw BBB+kw Outlook Stable Stable
AREF Energy Holding Company K.S.C.C ● January 2013 P a g e | 2
www.capstandards.com
Corporate Credit Rating Analysis – Update Investment Sector
AREF Energy Holding Co. K.S.C.C. Salmiya Real Estate Co.
Salmiya Real Estate Co. Sa
Summary Rating Rationale
Established in 2007, AREF Energy continues strengthening its foothold in the energy services sector by investing in growth-centered firms. In October 2012, the company invested in a private equity, Shariah compliant, energy fund managed by Kerogen Capital, Hong Kong, with a total capital commitment of USD 20.0 mn (93.4% paid).
AREF Energy has changed its business focus to reduce sector concentration risk as per the strategic directive of the company. It aims to reduce its exposure in E&P energy services, and increase investments into the oil drilling, construction, and industrial equipment services sector.
AREF Energy continues its focus on investing in businesses which are in medium to high growth stages within attractive operating environments/sectors. A few heavy weight investments skew the portfolio towards the higher risk E&P sector, which the company has been trying to divest out of since FY2011.
Geographic reach of the portfolio has widened with new projects funneled through its subsidiary Nordic Energy Services (NES), and an associate, Kuwait Energy Company (KEC). However, the concentration of the invested portfolio, based on revenues, reflects that operating profitability is mainly generated from Kuwait, and a few other regional countries.
Most investments are yet at growth stage thus limiting the profitability to only a few portfolio constituents. The overall profitability of the portfolio remains weak, and is projected to improve following the adoption of the new investment strategy. Asset quality is considered moderately weak with the reduction in the overall portfolio book values.
AREF Energy’s focus on influencing business operations of investments remains with the viewpoint of streamlining growth and value, hence dividend upstream is still at similar levels as previously rated period. Dividend income followed the trend of FY2011, with dividends of KWD 0.82 mn received until 9M2012, however the overall core income is still volatile due to lack of investment exits as planned.
The leverage position is moderate compared to most investment holding peers, both locally and regionally. AREF Energy’s debt-to-capitalization ratio stood at 7.73% in 9M2012 compared to 11.8% in 9M2011. The company aims to increase leverage at moderate levels in the event it undertakes new investment opportunities as planned in 2013.
Liquidity position has historically been strong due to the low levels of debt maintained by AREF Energy. The strong cash positions further allowed the adjusted liquidity ratio to increase to 11.92x in 9M2012 from 9.93x in 9M2011, which was primarily backed by the reduction in short-term debt and the increase in liquid assets.
AREF Energy Holding Company K.S.C.C ● January 2013 P a g e | 3
www.capstandards.com
Corporate Credit Rating Analysis – Update Investment Sector
AREF Energy Holding Co. K.S.C.C. Salmiya Real Estate Co.
Salmiya Real Estate Co. Sa
Detailed Rating Considerations
Factor 1: Quality of Assets
Concentrations: B
AREF Energy has a sizeable investment in Kuwait Energy Co. (KEC) & Kuwait Energy PLC (KEplc) which is valued at KWD 32.40 mn as of FY2011. This single investment represents a 14.17% stake in KEC and 62.04% of AREF Energy’s invested portfolio, based on the book values as of FY2011. KEC concentrates AREF Energy’s exposure towards E&P services, skewing the company from its investment objective. Currently, AREF Energy is sourcing opportunities to profitably exit from its stake within its more mature investments. These divestments would allow AREF Energy to strategize its entry into acquiring smaller, growth/ mature stage firms, which are geared towards drilling services & equipment leasing. In addition to KEC, Higleig in Sudan and Makamin in Saudi Arabia, collectively represent 85.94% of the total equity participations in AREF Energy’s invested portfolio, valued at KWD 44.9 mn in FY2011 (9M2012: KWD 41.0 mn). CSR believes that the current concentration in AREF Energy’s portfolio imposes limitations to the rating.
Portfolio Volatility: A
Since AREF Energy’s primary business activity is to invest in unlisted, operating Oil & Gas (O&G) related services firms, the portfolio’s volatility over a 3-year track period has been relatively low. It is pertinent to note, that the computed values are based on conservative book values as calculated and recorded on the audited financial statements of the company. Weighted portfolio volatility based on relative percentage of book values of assets in the investment portfolio reflects a very moderate change in value from the previous analyzed period. The total weighted portfolio volatility measured until 9M2012 stood at 14.24%, with main drivers for volatility being Higleig’s impairment losses and reduction in values, and KEC’s relative appreciation as a heavy weight in the total investment portfolio. It is worth noting, none of the other portfolio constituents showed major fluctuations in enterprise book value. Geographic Reach: BB
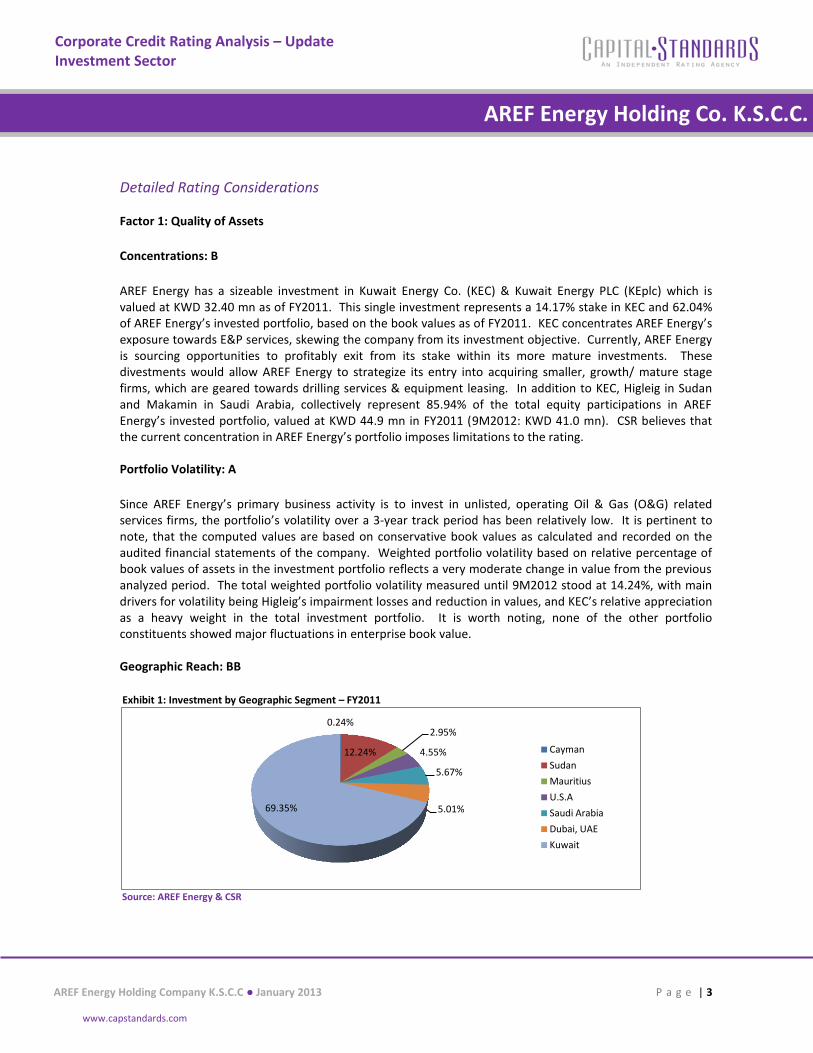
Exhibit 1: Investment by Geographic Segment – FY2011
Source: AREF Energy & CSR
0.24%
12.24%
2.95%
4.55%
5.67%
5.01% 69.35%
Cayman
Sudan
Mauritius
U.S.A
Saudi Arabia
Dubai, UAE
Kuwait
AREF Energy Holding Company K.S.C.C ● January 2013 P a g e | 4
www.capstandards.com
Corporate Credit Rating Analysis – Update Investment Sector
AREF Energy Holding Co. K.S.C.C. Salmiya Real Estate Co.
Salmiya Real Estate Co. Sa
AREF Energy’s investments are spread over Kuwait and the GCC region, with some subsidiaries and associates maintaining representative offices for operations in the MENA and Former Soviet Union (FSU) region. Geographic operations on a group basis have widened with KEC’s expansionary, oil-exploration and drilling activities across several sites in Egypt, Ukraine, and Pakistan. Nordic Energy, located in the Ras Al-Khaimah Freezone, has initiated work on its first contract located in Turkmenistan, and subsequently a branch office was set up at the work site. Apart from these, AREF Energy has maintained its presence in Sudan through its subsidiary Higleig. Though the operations are sizeable, Higleig has suffered from deteriorating operating profitability due to the socio-political imbalance, lack of systematic law and order and weak business ethics in Sudan. Additionally, AREF Energy maintains its growing foothold in India through its associate Kitara OFIL. Established in 2011, OFIL is the market leader in mud-logging services in India with a 45.0% market share as of FY2011. The company currently operates in India, Syria, Bangladesh, Kurdistan, Kazakhstan, and Oman. Due to the abundance in energy service related activities in the GCC/ MENA region, OFIL has ventured into establishing an associate in the UAE. In 2010, AREF Energy successfully divested its 50.00% joint venture stake in DeWitt Tract Co. in Texas, USA, reducing its investment exposure in the US market.
Kuwait is the primary driver for revenue contribution to the group, with other key contributions derived from neighboring markets of UAE and Saudi Arabia. As of FY2011, Kuwait revenues were KWD 1.34 mn compared to KWD 0.42 mn in the previous period, representing 75.84% of overall group revenues. Socio-political issues affected its key subsidiary, Higleig, reducing dependence on revenues from the MENA region post 2009. Operating activities of several of AREF Energy’s subsidiaries and associates are concentrated in non-GCC markets such as Egypt & Ukraine for KEC, and Turkmenistan for Nordic Energy, however, revenues have been reported based on the incorporated entity. Nonetheless, there is a moderate correlation in terms of activity between AREF Energy’s operating countries. As observed, the exposure has spread over to several countries in the FSU region, and also in India, Pakistan and Bangladesh, compared to only GCC/ MENA concentrations in 2011. As per the management discussions, the geographic focus going forward will remain highly centered towards the GCC, viz. in line with AREF Energy’s sectoral investment philosophy as mentioned in the next section.
Exhibit 2: Reported Segmental revenues skewed towards local operating environment
Segmental Revenues - by Geography (KWD mn) FY2011 FY2010 FY2009 FY2008
Kuwait 1.34 0.42 0.08 3.84
MENA 0.43 0.00 39.45 44.79
Others 0.00 0.00 (0.44) 0.00
Total 1.77 0.42 39.10 48.63
% Revenue Contribution – Kuwait 75.84% 100.00% 0.22% 7.90%
% Revenue Contribution – MENA 24.16% 0.00% 100.90% 92.10%
Source: AREF Energy & CSR
Sector Segmentation: B
AREF Energy signed a contract with Booz & Co. in 2008 to devise its business operating model, focusing on strategy direction and determining new sector concentrations, which was reviewed in 2011. In 2011’s strategy review, an increasing approach towards sub-sector diversification of investments was mandated, with a reduction of exposure in energy E&P services. Additionally, AREF Energy assessed feasibility of
AREF Energy Holding Company K.S.C.C ● January 2013 P a g e | 5
www.capstandards.com
Corporate Credit Rating Analysis – Update Investment Sector
AREF Energy Holding Co. K.S.C.C. Salmiya Real Estate Co.
Salmiya Real Estate Co. Sa
20.0%
60.0%
20.0%
FY2012-14; Budgeted Target Sector Exposure
Energy Equipment
Energy Services
Rest of Energy
43.0%
3.0%
30.0%
24.0%
FY2011; Actual Sector Exposure
E&P
Technology
Services
High Liquidity Assets
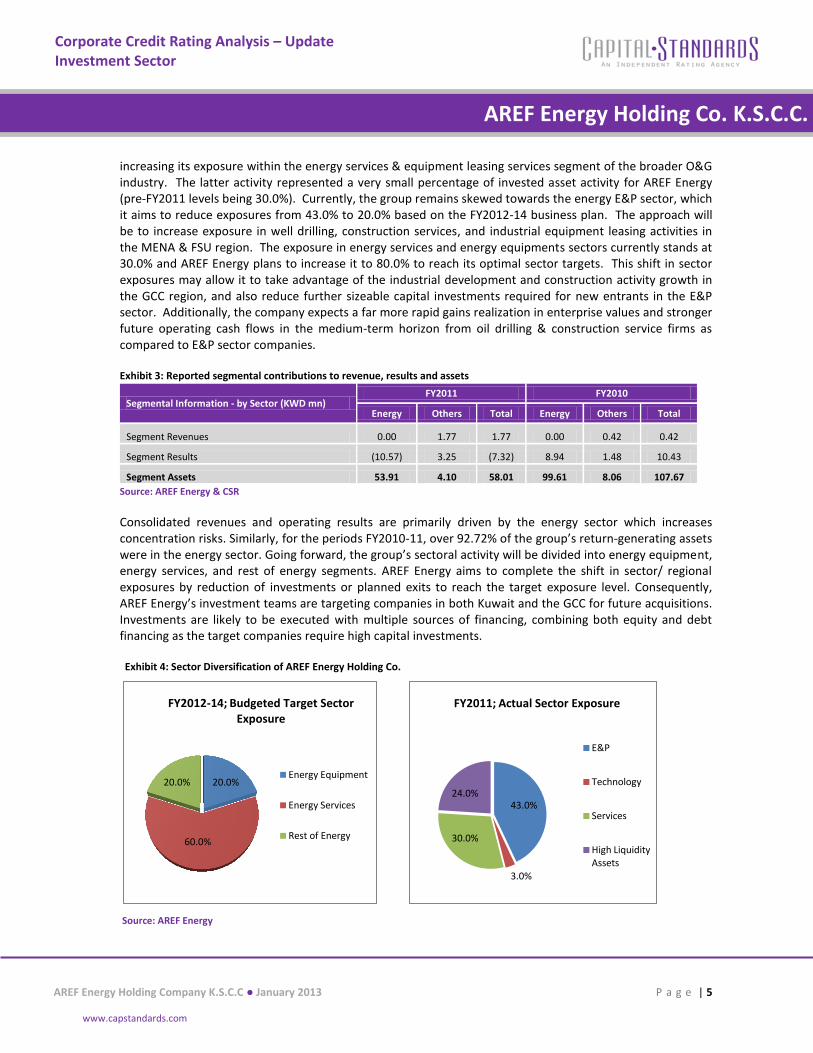
increasing its exposure within the energy services & equipment leasing services segment of the broader O&G industry. The latter activity represented a very small percentage of invested asset activity for AREF Energy (pre-FY2011 levels being 30.0%). Currently, the group remains skewed towards the energy E&P sector, which it aims to reduce exposures from 43.0% to 20.0% based on the FY2012-14 business plan. The approach will be to increase exposure in well drilling, construction services, and industrial equipment leasing activities in the MENA & FSU region. The exposure in energy services and energy equipments sectors currently stands at 30.0% and AREF Energy plans to increase it to 80.0% to reach its optimal sector targets. This shift in sector exposures may allow it to take advantage of the industrial development and construction activity growth in the GCC region, and also reduce further sizeable capital investments required for new entrants in the E&P sector. Additionally, the company expects a far more rapid gains realization in enterprise values and stronger future operating cash flows in the medium-term horizon from oil drilling & construction service firms as compared to E&P sector companies.
Exhibit 3: Reported segmental contributions to revenue, results and assets
Segmental Information - by Sector (KWD mn) FY2011 FY2010
Energy Others Total Energy Others Total
Segment Revenues 0.00 1.77 1.77 0.00 0.42 0.42
Segment Results (10.57) 3.25 (7.32) 8.94 1.48 10.43
Segment Assets 53.91 4.10 58.01 99.61 8.06 107.67
Source: AREF Energy & CSR
Consolidated revenues and operating results are primarily driven by the energy sector which increases concentration risks. Similarly, for the periods FY2010-11, over 92.72% of the group’s return-generating assets were in the energy sector. Going forward, the group’s sectoral activity will be divided into energy equipment, energy services, and rest of energy segments. AREF Energy aims to complete the shift in sector/ regional exposures by reduction of investments or planned exits to reach the target exposure level. Consequently, AREF Energy’s investment teams are targeting companies in both Kuwait and the GCC for future acquisitions. Investments are likely to be executed with multiple sources of financing, combining both equity and debt financing as the target companies require high capital investments.
Exhibit 4: Sector Diversification of AREF Energy Holding Co.
Source: AREF Energy
AREF Energy Holding Company K.S.C.C ● January 2013 P a g e | 6
www.capstandards.com
Corporate Credit Rating Analysis – Update Investment Sector
AREF Energy Holding Co. K.S.C.C. Salmiya Real Estate Co.
Salmiya Real Estate Co. Sa
Factor 2: Corporate Governance: BBB
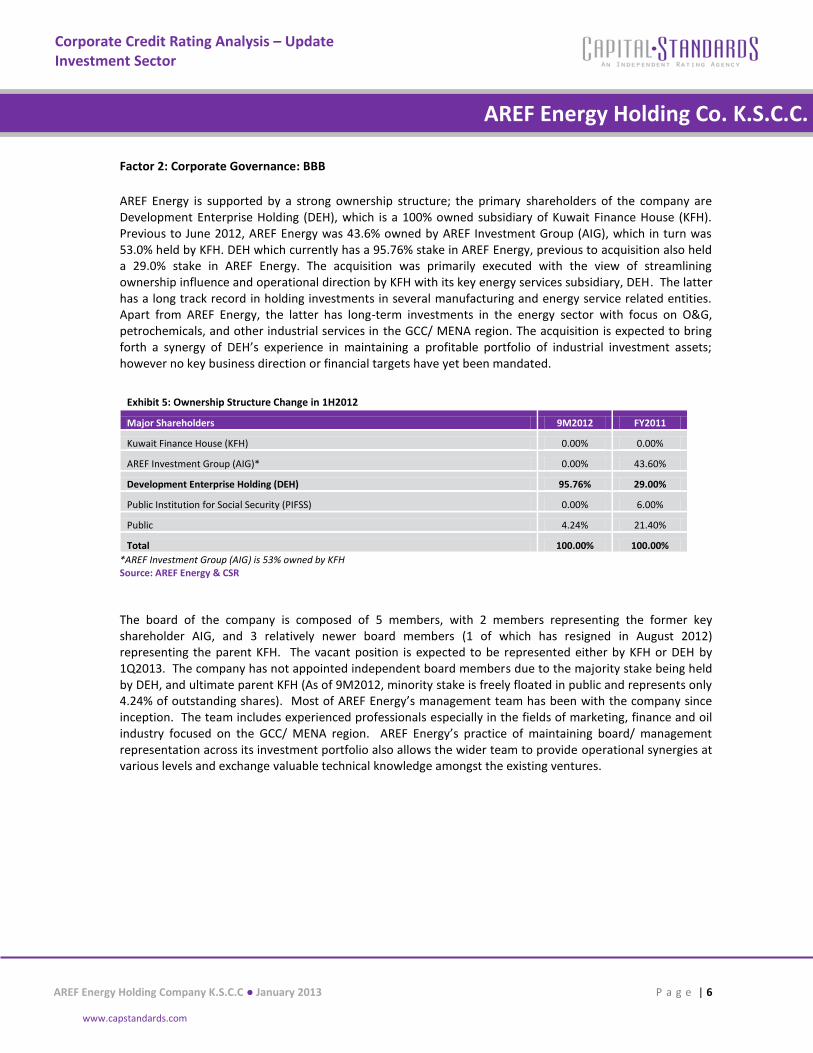
AREF Energy is supported by a strong ownership structure; the primary shareholders of the company are Development Enterprise Holding (DEH), which is a 100% owned subsidiary of Kuwait Finance House (KFH). Previous to June 2012, AREF Energy was 43.6% owned by AREF Investment Group (AIG), which in turn was 53.0% held by KFH. DEH which currently has a 95.76% stake in AREF Energy, previous to acquisition also held a 29.0% stake in AREF Energy. The acquisition was primarily executed with the view of streamlining ownership influence and operational direction by KFH with its key energy services subsidiary, DEH. The latter has a long track record in holding investments in several manufacturing and energy service related entities. Apart from AREF Energy, the latter has long-term investments in the energy sector with focus on O&G, petrochemicals, and other industrial services in the GCC/ MENA region. The acquisition is expected to bring forth a synergy of DEH’s experience in maintaining a profitable portfolio of industrial investment assets; however no key business direction or financial targets have yet been mandated.
Exhibit 5: Ownership Structure Change in 1H2012
Major Shareholders 9M2012 FY2011
Kuwait Finance House (KFH) 0.00% 0.00%
AREF Investment Group (AIG)* 0.00% 43.60%
Development Enterprise Holding (DEH) 95.76% 29.00%
Public Institution for Social Security (PIFSS) 0.00% 6.00%
Public 4.24% 21.40%
Total 100.00% 100.00%
*AREF Investment Group (AIG) is 53% owned by KFH Source: AREF Energy & CSR
The board of the company is composed of 5 members, with 2 members representing the former key shareholder AIG, and 3 relatively newer board members (1 of which has resigned in August 2012) representing the parent KFH. The vacant position is expected to be represented either by KFH or DEH by 1Q2013. The company has not appointed independent board members due to the majority stake being held by DEH, and ultimate parent KFH (As of 9M2012, minority stake is freely floated in public and represents only 4.24% of outstanding shares). Most of AREF Energy’s management team has been with the company since inception. The team includes experienced professionals especially in the fields of marketing, finance and oil industry focused on the GCC/ MENA region. AREF Energy’s practice of maintaining board/ management representation across its investment portfolio also allows the wider team to provide operational synergies at various levels and exchange valuable technical knowledge amongst the existing ventures.
AREF Energy Holding Company K.S.C.C ● January 2013 P a g e | 7
www.capstandards.com
Corporate Credit Rating Analysis – Update Investment Sector
AREF Energy Holding Co. K.S.C.C. Salmiya Real Estate Co.
Salmiya Real Estate Co. Sa
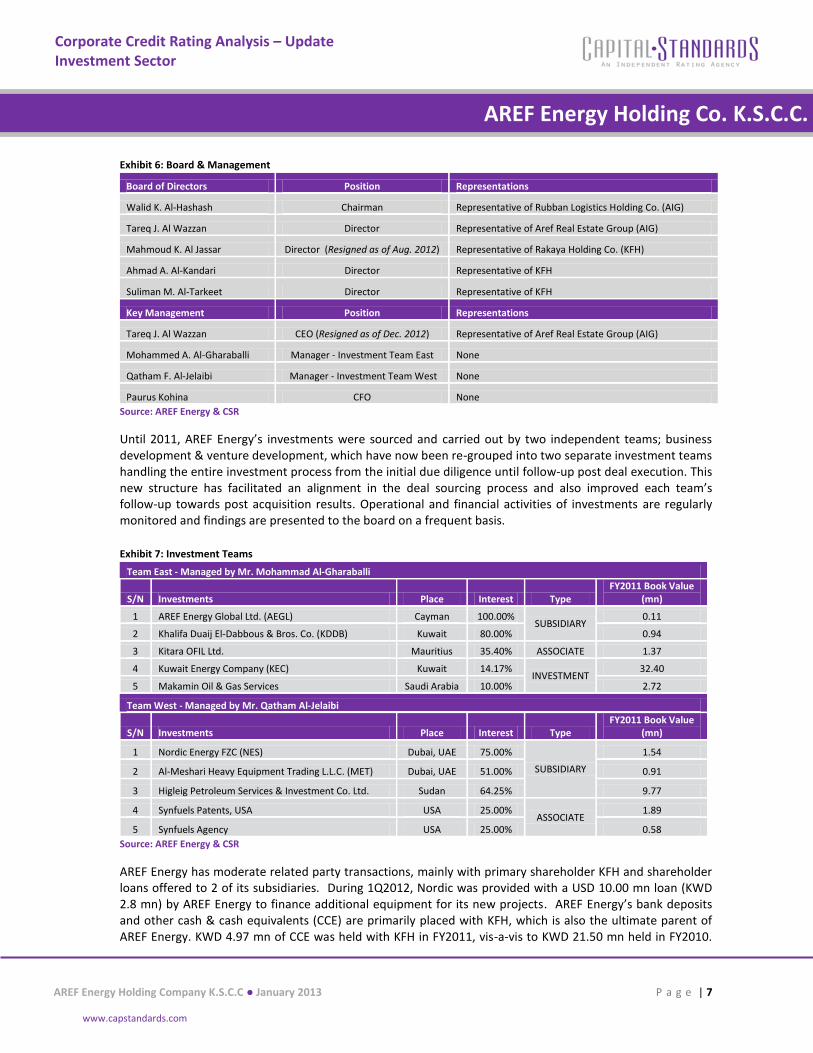
Exhibit 6: Board & Management
Board of Directors Position Representations
Walid K. Al-Hashash Chairman Representative of Rubban Logistics Holding Co. (AIG)
Tareq J. Al Wazzan Director Representative of Aref Real Estate Group (AIG)
Mahmoud K. Al Jassar Director (Resigned as of Aug. 2012) Representative of Rakaya Holding Co. (KFH)
Ahmad A. Al-Kandari Director Representative of KFH
Suliman M. Al-Tarkeet Director Representative of KFH
Key Management Position Representations
Tareq J. Al Wazzan CEO (Resigned as of Dec. 2012) Representative of Aref Real Estate Group (AIG)
Mohammed A. Al-Gharaballi Manager - Investment Team East None
Qatham F. Al-Jelaibi Manager - Investment Team West None
Paurus Kohina CFO None
Source: AREF Energy & CSR
Until 2011, AREF Energy’s investments were sourced and carried out by two independent teams; business development & venture development, which have now been re-grouped into two separate investment teams handling the entire investment process from the initial due diligence until follow-up post deal execution. This new structure has facilitated an alignment in the deal sourcing process and also improved each team’s follow-up towards post acquisition results. Operational and financial activities of investments are regularly monitored and findings are presented to the board on a frequent basis.
Exhibit 7: Investment Teams
Team East - Managed by Mr. Mohammad Al-Gharaballi
S/N Investments Place Interest Type FY2011 Book Value
(mn)
1 AREF Energy Global Ltd. (AEGL) Cayman 100.00% SUBSIDIARY
0.11
2 Khalifa Duaij El-Dabbous & Bros. Co. (KDDB) Kuwait 80.00% 0.94
3 Kitara OFIL Ltd. Mauritius 35.40% ASSOCIATE 1.37
4 Kuwait Energy Company (KEC) Kuwait 14.17% INVESTMENT
32.40
5 Makamin Oil & Gas Services Saudi Arabia 10.00% 2.72
Team West - Managed by Mr. Qatham Al-Jelaibi
S/N Investments Place Interest Type FY2011 Book Value
(mn)
1 Nordic Energy FZC (NES) Dubai, UAE 75.00%
SUBSIDIARY
1.54
2 Al-Meshari Heavy Equipment Trading L.L.C. (MET) Dubai, UAE 51.00% 0.91
3 Higleig Petroleum Services & Investment Co. Ltd. Sudan 64.25% 9.77
4 Synfuels Patents, USA USA 25.00% ASSOCIATE
1.89
5 Synfuels Agency USA 25.00% 0.58
Source: AREF Energy & CSR
AREF Energy has moderate related party transactions, mainly with primary shareholder KFH and shareholder loans offered to 2 of its subsidiaries. During 1Q2012, Nordic was provided with a USD 10.00 mn loan (KWD 2.8 mn) by AREF Energy to finance additional equipment for its new projects. AREF Energy’s bank deposits and other cash & cash equivalents (CCE) are primarily placed with KFH, which is also the ultimate parent of AREF Energy. KWD 4.97 mn of CCE was held with KFH in FY2011, vis-a-vis to KWD 21.50 mn held in FY2010.
AREF Energy Holding Company K.S.C.C ● January 2013 P a g e | 8
www.capstandards.com
Corporate Credit Rating Analysis – Update Investment Sector
AREF Energy Holding Co. K.S.C.C. Salmiya Real Estate Co.
Salmiya Real Estate Co. Sa
Additionally, the company currently has a KWD 2.50 mn Murabaha facility from KFH, which is secured against its KEC stake, and renewed every year. Finance cost over the Murabaha was KWD 0.17 mn in FY2011, a reduction of over 76.5% from FY2010 due to loan repayment of KWD 2.70 mn during FY2010-11.
The company has not developed a separate risk management department and the function is primarily carried out within each investment team and operational function. The main risks the company is exposed to include political risk in few of the FSU/ MENA countries, and currency risk as observed in the Higleig divestment, which failed due to overnight devaluation of the SDG against USD.
The financial statements reflect good levels of transparency and disclosure, supported by the company’s website which provides coverage over its keys investments, quarterly and annual financial statements and key financial highlights for each period.
Due to its relatively recent track record and investment objective, AREF Energy has maintained a conservative dividend policy. AREF Energy’s philosophy of acquiring investments at an early growth stage, with minimum holding duration of 5-7 years until exit, implies its focus on actual investee growth. Through value generation, AREF Energy seeks to realize steady cash flows at maturity and gains through profitable exits. Dividend income is expected in FY2012 from; a) KEC – KWD 0.80 mn, and from b) OFIL - KWD 0.05-0.06 mn. AREF Energy’s management believes that the dividend income received would be sufficient to cover its annual operating expenses.
Financial Analysis
To gain insight into the financial strength of AREF Energy Holding Co. K.S.C.C. & subsidiaries, the audited consolidated financials of the group have been analyzed in addition to the holding company’s unaudited standalone financials. The initial rating delivered in December 2011 was based on standalone financials. Additionally, AREF Energy has classified Higleig, a key subsidiary as a disposal group held for sale and disclosed it as a discontinued operation as per IFRS Standard 5: “Non-current assets held for sale and discontinued operations”. Accordingly, AREF Energy has reported FY2011 and 9M2012 financials in this manner. However, as the disposal offer has not materialized after negotiations, going forward, AREF Energy will be reconsolidating financials of its subsidiary, Higleig, in the consolidated group financials, starting from FY2012. The rating analysis has been performed on separately classified financials as per the audited FY2011 and the reviewed 9M2012 financial statements. No significant impact was observed on the assessed rating factors and overall rating due to the separate classification of key line items in these financials.
Factor 3: Financial Strength
Market Value to Debt: AA
AREF Energy’s investment portfolio mainly consists of unlisted, operating O&G service firms. These are recorded at conservative book values on the audited financial statements by the company in absence of available market values. On a conservative note, CSR has taken haircuts on management estimates in order to arrive at fairly adjusted ratios measuring the portfolio value against debt. AREF Energy’s debt position in FY2011 was KWD 3.10 mn (inclusive of Higleig’s debt it amounted to KWD 4.28 mn), compared to KWD 10.54 mn in the previous year due to significant debt repayments. Also, the high CCE position for the same period, from cash inflows after divestments from DeWitt Tract & Co. in 2010 resulted in a net debt of approximately KWD (14.41) mn, which has maintained similar levels in 9M2012. The 2-yr average net debt to invested portfolio value was (57.50%) in FY2011, compared to 6.85% in FY2010.
AREF Energy Holding Company K.S.C.C ● January 2013 P a g e | 9
www.capstandards.com
Corporate Credit Rating Analysis – Update Investment Sector
AREF Energy Holding Co. K.S.C.C. Salmiya Real Estate Co.
Salmiya Real Estate Co. Sa
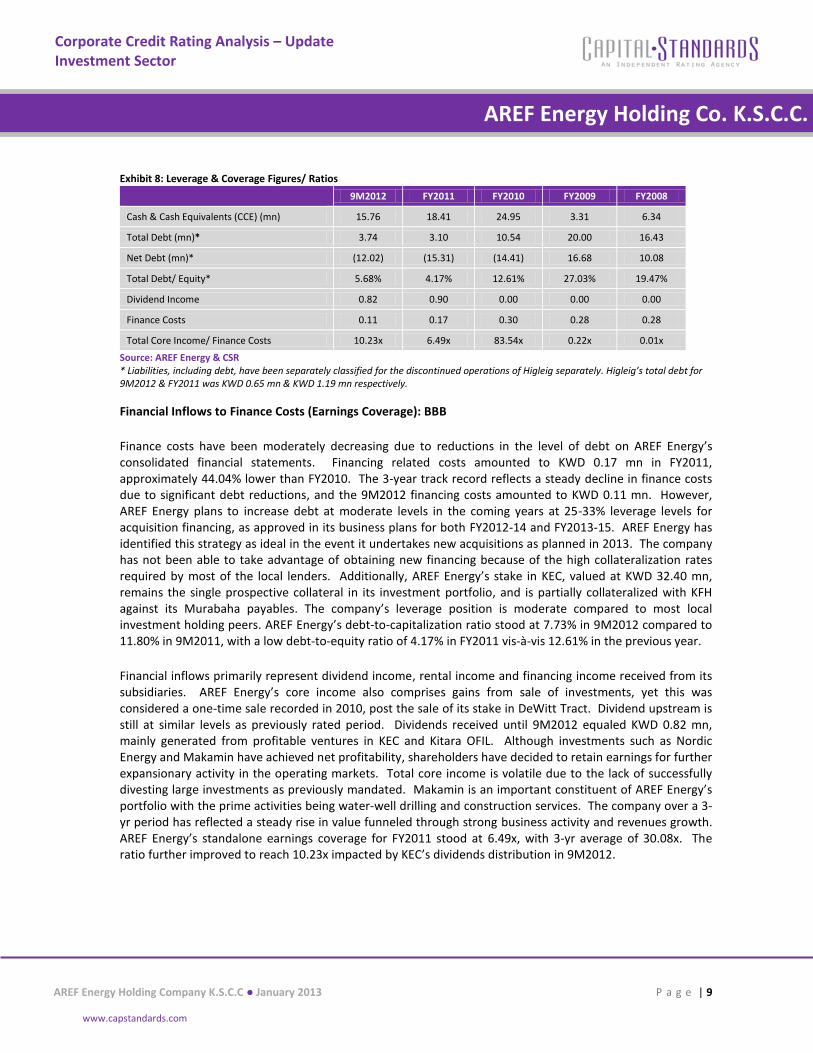
Exhibit 8: Leverage & Coverage Figures/ Ratios
9M2012 FY2011 FY2010 FY2009 FY2008
Cash & Cash Equivalents (CCE) (mn) 15.76 18.41 24.95 3.31 6.34
Total Debt (mn)* 3.74 3.10 10.54 20.00 16.43
Net Debt (mn)* (12.02) (15.31) (14.41) 16.68 10.08
Total Debt/ Equity* 5.68% 4.17% 12.61% 27.03% 19.47%
Dividend Income 0.82 0.90 0.00 0.00 0.00
Finance Costs 0.11 0.17 0.30 0.28 0.28
Total Core Income/ Finance Costs 10.23x 6.49x 83.54x 0.22x 0.01x
Source: AREF Energy & CSR * Liabilities, including debt, have been separately classified for the discontinued operations of Higleig separately. Higleig’s total debt for 9M2012 & FY2011 was KWD 0.65 mn & KWD 1.19 mn respectively.
Financial Inflows to Finance Costs (Earnings Coverage): BBB
Finance costs have been moderately decreasing due to reductions in the level of debt on AREF Energy’s consolidated financial statements. Financing related costs amounted to KWD 0.17 mn in FY2011, approximately 44.04% lower than FY2010. The 3-year track record reflects a steady decline in finance costs due to significant debt reductions, and the 9M2012 financing costs amounted to KWD 0.11 mn. However, AREF Energy plans to increase debt at moderate levels in the coming years at 25-33% leverage levels for acquisition financing, as approved in its business plans for both FY2012-14 and FY2013-15. AREF Energy has identified this strategy as ideal in the event it undertakes new acquisitions as planned in 2013. The company has not been able to take advantage of obtaining new financing because of the high collateralization rates required by most of the local lenders. Additionally, AREF Energy’s stake in KEC, valued at KWD 32.40 mn, remains the single prospective collateral in its investment portfolio, and is partially collateralized with KFH against its Murabaha payables. The company’s leverage position is moderate compared to most local investment holding peers. AREF Energy’s debt-to-capitalization ratio stood at 7.73% in 9M2012 compared to 11.80% in 9M2011, with a low debt-to-equity ratio of 4.17% in FY2011 vis-à-vis 12.61% in the previous year.
Financial inflows primarily represent dividend income, rental income and financing income received from its subsidiaries. AREF Energy’s core income also comprises gains from sale of investments, yet this was considered a one-time sale recorded in 2010, post the sale of its stake in DeWitt Tract. Dividend upstream is still at similar levels as previously rated period. Dividends received until 9M2012 equaled KWD 0.82 mn, mainly generated from profitable ventures in KEC and Kitara OFIL. Although investments such as Nordic Energy and Makamin have achieved net profitability, shareholders have decided to retain earnings for further expansionary activity in the operating markets. Total core income is volatile due to the lack of successfully divesting large investments as previously mandated. Makamin is an important constituent of AREF Energy’s portfolio with the prime activities being water-well drilling and construction services. The company over a 3-yr period has reflected a steady rise in value funneled through strong business activity and revenues growth. AREF Energy’s standalone earnings coverage for FY2011 stood at 6.49x, with 3-yr average of 30.08x. The ratio further improved to reach 10.23x impacted by KEC’s dividends distribution in 9M2012.
AREF Energy Holding Company K.S.C.C ● January 2013 P a g e | 10
www.capstandards.com
Corporate Credit Rating Analysis – Update Investment Sector
AREF Energy Holding Co. K.S.C.C. Salmiya Real Estate Co.
Salmiya Real Estate Co. Sa
Dividend Control: BB
AREF Energy maintains a significant dividend control within its investment portfolio by maintaining sufficient board and management representations. Historically, the portfolio has reflected a low dividend upstream, but this is primarily as a result of its portfolio constituents being in the growth stage and not having reached steady profitability. As of FY2011, KDDB, Kitara OFIL, KEC, and Makamin were the only investments which achieved positive earnings. KDDB and Makamin have identified new business avenues to achieve expansionary growth and hence have opted for retention of earnings for fuelling further investment activities. These activities include, purchasing new equipment, identifying profitable business acquisitions within their operating stream and region, and strengthening the company reserves. On the other hand, the sufficient influence is maintained across AREF Energy’s investments with significant board representation in all subsidiaries. The company has also appointed a single board member in its associates, and has members in the management team of both subsidiaries and associates. In certain circumstances, such as in affiliates, AREF Energy has solid and deep management involvement by attending as an observer in the board/ management meetings. AREF Energy has significant controlling interest in 8 of the 10 invested companies. The company’s controlling interest against percentage book value of total portfolio stood at 32.76% in FY2011, and decreased to 26.68% for 9M2012. This was due to the decrease in Higleig’s value, which realized impairments and foreign currency translation losses of ~KWD 3.90 mn during this period.
Liquidity: AAA
The total cash and portfolio investments increased from KWD 88.23 mn in FY2010 to KWD 89.40 mn in FY2011. CSR has taken necessary haircuts on the quoted and unquoted investments, which are the major liquid assets in AREF Energy’s investment portfolio. Liquid assets composition remains stable from the previous year, with strong cash balances in banks, investment deposits and holdings in profitable associates. The adjusted liquid assets of AREF Energy post haircuts reflects CSR’s estimate of realizable value upon liquidation of these group investments in a short period of time. The adjusted liquidity ratio for AREF Energy was substantially high in FY2011, standing at 16.35x compared to 8.68x in FY2010. In 9M2012, the ratio declined to 11.92x, due to the rise in bank overdrafts in 3Q2012, coupled with reduction in values of CCE, associates and current portion of accounts receivables. The ratio for this period is in the high ranges of sub-factor assessment, and has been greater than 8.5x since FY2010, indicating the strong liquidity position of the company and cautious approach in managing working capital requirements. Similarly, cash ratios for AREF Energy’s consolidated position are strong at 0.96x in FY2011, with a slight reduction in the last reported period of 9M2012 reaching 0.93x.
AREF Energy Holding Company K.S.C.C ● January 2013 P a g e | 11
www.capstandards.com
Corporate Credit Rating Analysis – Update Investment Sector
AREF Energy Holding Co. K.S.C.C. Salmiya Real Estate Co.
Salmiya Real Estate Co. Sa
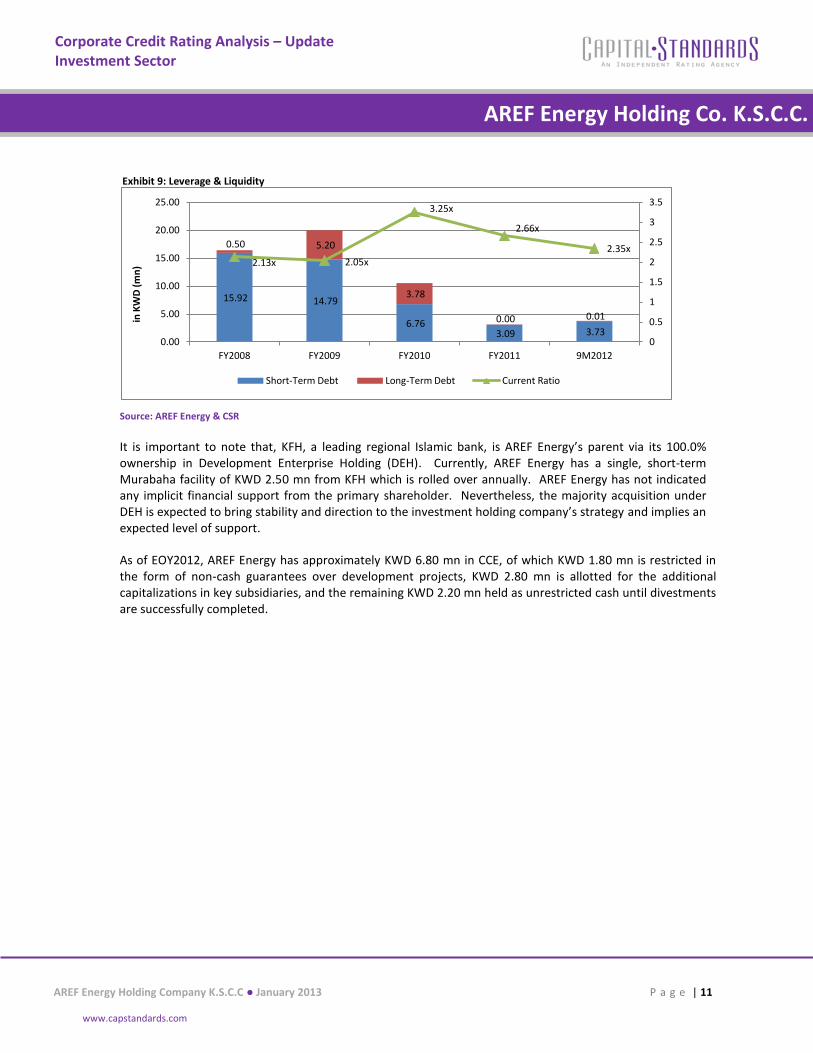
Exhibit 9: Leverage & Liquidity
Source: AREF Energy & CSR
It is important to note that, KFH, a leading regional Islamic bank, is AREF Energy’s parent via its 100.0% ownership in Development Enterprise Holding (DEH). Currently, AREF Energy has a single, short-term Murabaha facility of KWD 2.50 mn from KFH which is rolled over annually. AREF Energy has not indicated any implicit financial support from the primary shareholder. Nevertheless, the majority acquisition under DEH is expected to bring stability and direction to the investment holding company’s strategy and implies an expected level of support.
As of EOY2012, AREF Energy has approximately KWD 6.80 mn in CCE, of which KWD 1.80 mn is restricted in the form of non-cash guarantees over development projects, KWD 2.80 mn is allotted for the additional capitalizations in key subsidiaries, and the remaining KWD 2.20 mn held as unrestricted cash until divestments are successfully completed.
15.92 14.79
6.76 3.09 3.73
0.50 5.20
3.78
0.00 0.01
2.13x 2.05x
3.25x
2.66x
2.35x
0
0.5
1
1.5
2
2.5
3
3.5
0.00
5.00
10.00
15.00
20.00
25.00
FY2008 FY2009 FY2010 FY2011 9M2012
in K
WD
(m
n)
Short-Term Debt Long-Term Debt Current Ratio
AREF Energy Holding Company K.S.C.C ● January 2013 P a g e | 12
www.capstandards.com
Corporate Credit Rating Analysis – Update Investment Sector
AREF Energy Holding Co. K.S.C.C. Salmiya Real Estate Co.
Salmiya Real Estate Co. Sa
Rating Outlook
AREF Energy’s rating has been affirmed at BB+ and the outlook remains stable. This reflects the company’s sustained position in the industrial investment holdings segment within the local market, with a strong shareholder support from the parent KFH. CSR has observed the gradual strengthening of AREF Energy’s growth-centered investment portfolio, but has noted that the company’s portfolio lacks a long track record reflecting stable financial performance. As per CSR’s assessment, AREF Energy’s revised investment philosophy and business plans are yet to reflect the financial performance which will be based on the company’s success in planned divestments and strengthening dividend upstream. There are mixed signals regarding the short-term prospects of AREF Energy’s investment portfolio’s profitability. This is mainly factored in due to the volatility of a few portfolio constituents, the asset quality of the investment portfolio and low dividend upstream from its mature investments. The overall portfolio is deemed to improve operational profitability post a successful divestment in Higleig which will reduce the group’s impairment losses and losses due to foreign currency translations. Although prospects for dividend income have strengthened, further dividend upstream is not expected until FY2013-14.
AREF Energy’s objective is to retain earnings from its investments in order to finance expansionary activity and realize enterprise value growth. This is viewed favorably, as it would directly influence core income upon divestments in the medium-term. The portfolio volatility is foreseen to stabilize once the company successfully streamlines its sector concentrations by reducing high development stage costs inherent in E&P related services. Financial leverage is currently low, and AREF Energy would either use its unrestricted cash and bank balances or additional debt to finance acquisitions in 2013. Divestments from the portfolio’s investments may require capital to keep debt financing at the management’s target level. Nevertheless, an aggressively leveraged position in the short-term would be unsustainable in light of the coverage ratios, and could have an impact on the assigned rating.
AREF Energy Holding Company K.S.C.C ● January 2013 P a g e | 13
www.capstandards.com
Corporate Credit Rating Analysis – Update Investment Sector
AREF Energy Holding Co. K.S.C.C. Salmiya Real Estate Co.
Salmiya Real Estate Co. Sa
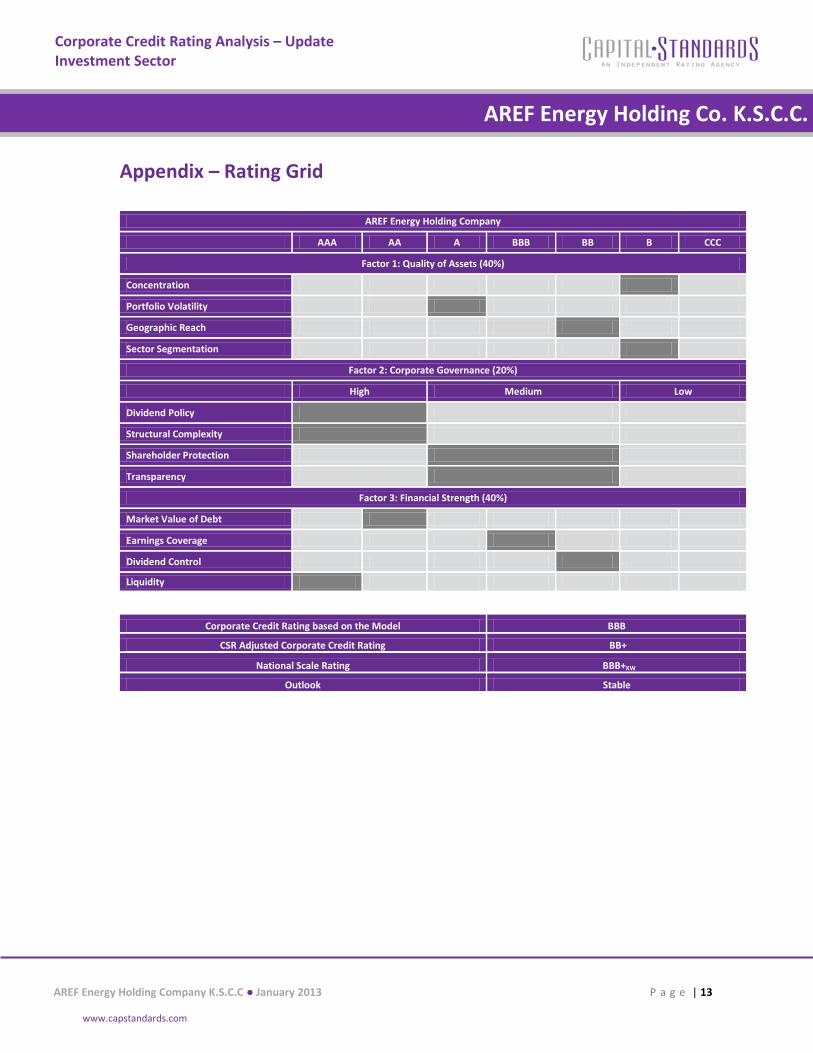
Appendix – Rating Grid
AREF Energy Holding Company
AAA AA A BBB BB B CCC
Factor 1: Quality of Assets (40%)
Concentration
Portfolio Volatility
Geographic Reach
Sector Segmentation
Factor 2: Corporate Governance (20%)
High Medium Low
Dividend Policy
Structural Complexity
Shareholder Protection
Transparency
Factor 3: Financial Strength (40%)
Market Value of Debt
Earnings Coverage
Dividend Control
Liquidity
Corporate Credit Rating based on the Model BBB
CSR Adjusted Corporate Credit Rating BB+
National Scale Rating BBB+KW
Outlook Stable
AREF Energy Holding Company K.S.C.C ● January 2013 P a g e | 14
www.capstandards.com
Corporate Credit Rating Analysis – Update Investment Sector
AREF Energy Holding Co. K.S.C.C. Salmiya Real Estate Co.
Salmiya Real Estate Co. Sa
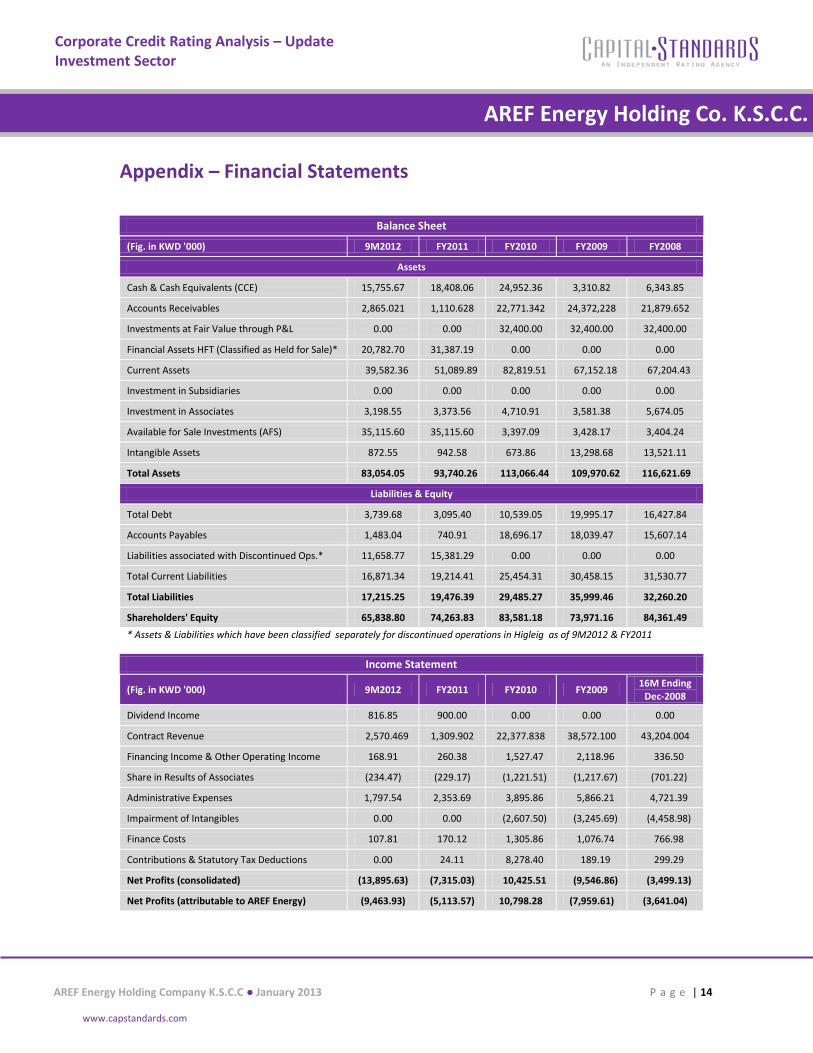
Appendix – Financial Statements
Balance Sheet
(Fig. in KWD '000) 9M2012 FY2011 FY2010 FY2009 FY2008
Assets
Cash & Cash Equivalents (CCE) 15,755.67 18,408.06 24,952.36 3,310.82 6,343.85
Accounts Receivables 2,865.021 1,110.628 22,771.342 24,372,228 21,879.652
Investments at Fair Value through P&L 0.00 0.00 32,400.00 32,400.00 32,400.00
Financial Assets HFT (Classified as Held for Sale)* 20,782.70 31,387.19 0.00 0.00 0.00
Current Assets 39,582.36 51,089.89 82,819.51 67,152.18 67,204.43
Investment in Subsidiaries 0.00 0.00 0.00 0.00 0.00
Investment in Associates 3,198.55 3,373.56 4,710.91 3,581.38 5,674.05
Available for Sale Investments (AFS) 35,115.60 35,115.60 3,397.09 3,428.17 3,404.24
Intangible Assets 872.55 942.58 673.86 13,298.68 13,521.11
Total Assets 83,054.05 93,740.26 113,066.44 109,970.62 116,621.69
Liabilities & Equity
Total Debt 3,739.68 3,095.40 10,539.05 19,995.17 16,427.84
Accounts Payables 1,483.04 740.91 18,696.17 18,039.47 15,607.14
Liabilities associated with Discontinued Ops.* 11,658.77 15,381.29 0.00 0.00 0.00
Total Current Liabilities 16,871.34 19,214.41 25,454.31 30,458.15 31,530.77
Total Liabilities 17,215.25 19,476.39 29,485.27 35,999.46 32,260.20
Shareholders' Equity 65,838.80 74,263.83 83,581.18 73,971.16 84,361.49
* Assets & Liabilities which have been classified separately for discontinued operations in Higleig as of 9M2012 & FY2011
Income Statement
(Fig. in KWD '000) 9M2012 FY2011 FY2010 FY2009 16M Ending
Dec-2008
Dividend Income 816.85 900.00 0.00 0.00 0.00
Contract Revenue 2,570.469 1,309.902 22,377.838 38,572.100 43,204.004
Financing Income & Other Operating Income 168.91 260.38 1,527.47 2,118.96 336.50
Share in Results of Associates (234.47) (229.17) (1,221.51) (1,217.67) (701.22)
Administrative Expenses 1,797.54 2,353.69 3,895.86 5,866.21 4,721.39
Impairment of Intangibles 0.00 0.00 (2,607.50) (3,245.69) (4,458.98)
Finance Costs 107.81 170.12 1,305.86 1,076.74 766.98
Contributions & Statutory Tax Deductions 0.00 24.11 8,278.40 189.19 299.29
Net Profits (consolidated) (13,895.63) (7,315.03) 10,425.51 (9,546.86) (3,499.13)
Net Profits (attributable to AREF Energy) (9,463.93) (5,113.57) 10,798.28 (7,959.61) (3,641.04)
AREF Energy Holding Company K.S.C.C ● January 2013 P a g e | 15
www.capstandards.com
Corporate Credit Rating Analysis – Update Investment Sector
AREF Energy Holding Co. K.S.C.C. Salmiya Real Estate Co.
Salmiya Real Estate Co. Sa
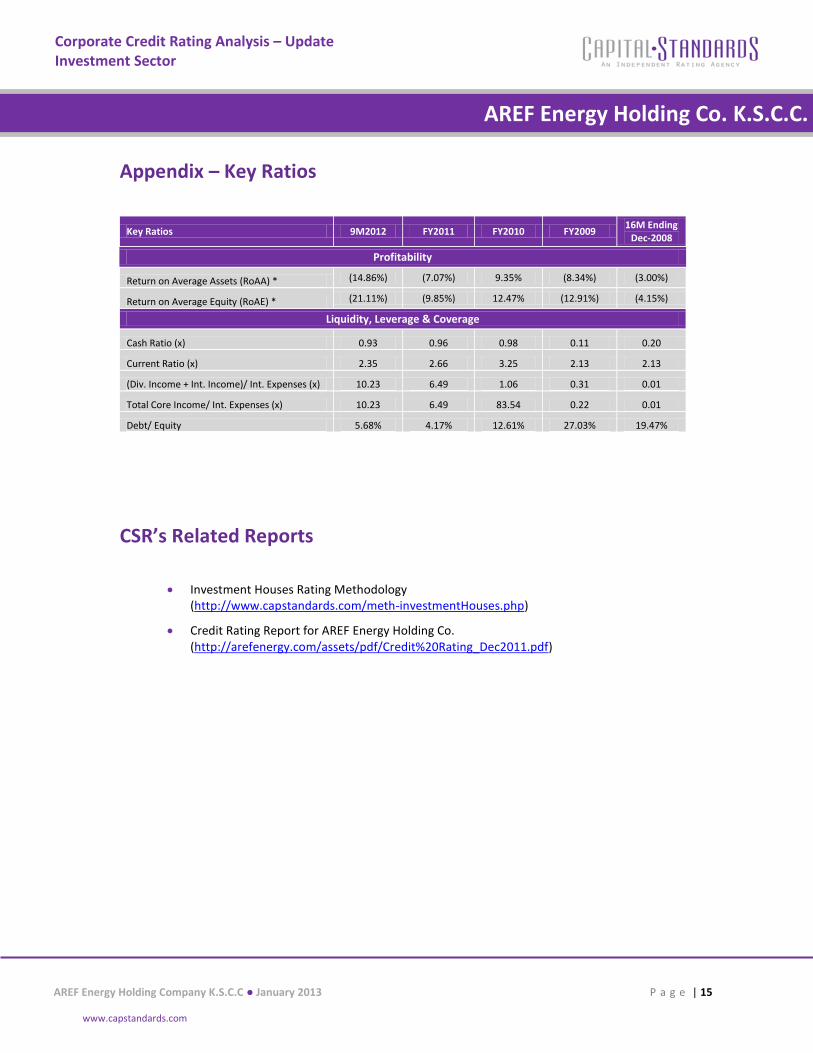
Appendix – Key Ratios
Key Ratios 9M2012 FY2011 FY2010 FY2009 16M Ending
Dec-2008
Profitability
Return on Average Assets (RoAA) * (14.86%) (7.07%) 9.35% (8.34%) (3.00%)
Return on Average Equity (RoAE) * (21.11%) (9.85%) 12.47% (12.91%) (4.15%)
Liquidity, Leverage & Coverage
Cash Ratio (x) 0.93 0.96 0.98 0.11 0.20
Current Ratio (x) 2.35 2.66 3.25 2.13 2.13
(Div. Income + Int. Income)/ Int. Expenses (x) 10.23 6.49 1.06 0.31 0.01
Total Core Income/ Int. Expenses (x) 10.23 6.49 83.54 0.22 0.01
Debt/ Equity 5.68% 4.17% 12.61% 27.03% 19.47%
CSR’s Related Reports
Investment Houses Rating Methodology (http://www.capstandards.com/meth-investmentHouses.php)
Credit Rating Report for AREF Energy Holding Co. (http://arefenergy.com/assets/pdf/Credit%20Rating_Dec2011.pdf)
AREF Energy Holding Company K.S.C.C ● January 2013 P a g e | 16
www.capstandards.com
Corporate Credit Rating Analysis – Update Investment Sector
AREF Energy Holding Co. K.S.C.C. Salmiya Real Estate Co.
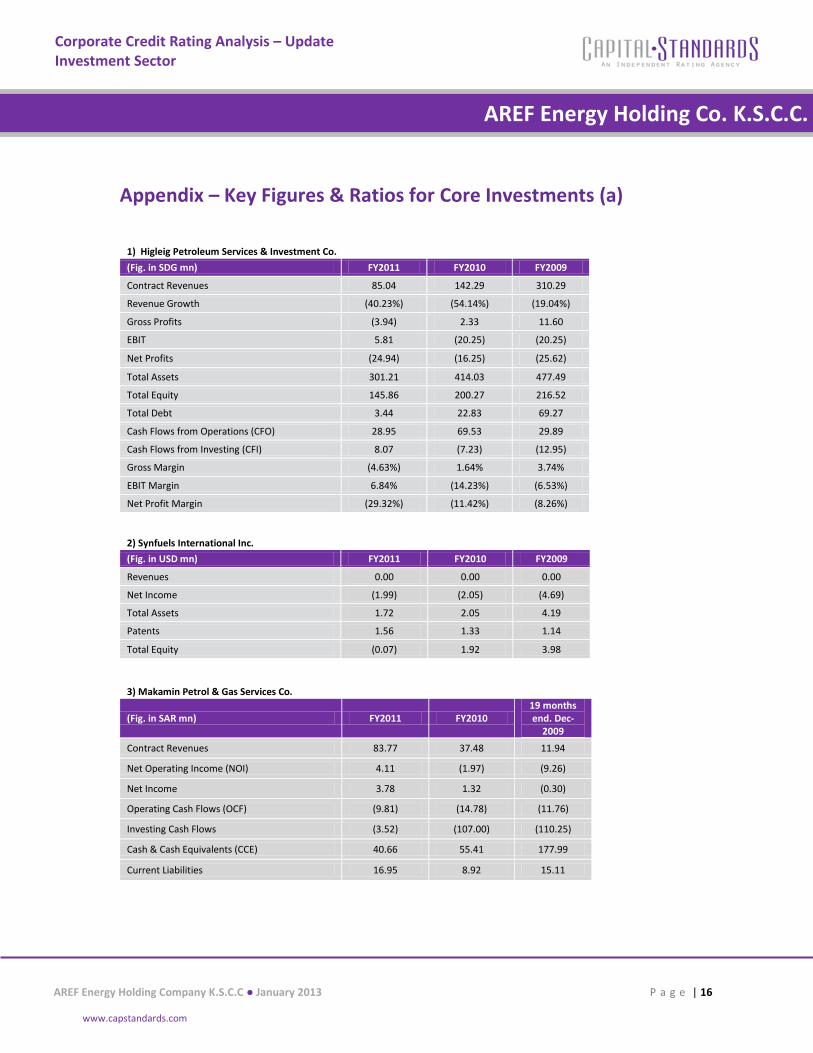
Salmiya Real Estate Co. Sa Appendix – Key Figures & Ratios for Core Investments (a)
1) Higleig Petroleum Services & Investment Co.
(Fig. in SDG mn) FY2011 FY2010 FY2009
Contract Revenues 85.04 142.29 310.29
Revenue Growth (40.23%) (54.14%) (19.04%)
Gross Profits (3.94) 2.33 11.60
EBIT 5.81 (20.25) (20.25)
Net Profits (24.94) (16.25) (25.62)
Total Assets 301.21 414.03 477.49
Total Equity 145.86 200.27 216.52
Total Debt 3.44 22.83 69.27
Cash Flows from Operations (CFO) 28.95 69.53 29.89
Cash Flows from Investing (CFI) 8.07 (7.23) (12.95)
Gross Margin (4.63%) 1.64% 3.74%
EBIT Margin 6.84% (14.23%) (6.53%)
Net Profit Margin (29.32%) (11.42%) (8.26%)
2) Synfuels International Inc.
(Fig. in USD mn) FY2011 FY2010 FY2009
Revenues 0.00 0.00 0.00
Net Income (1.99) (2.05) (4.69)
Total Assets 1.72 2.05 4.19
Patents 1.56 1.33 1.14
Total Equity (0.07) 1.92 3.98
3) Makamin Petrol & Gas Services Co.
(Fig. in SAR mn) FY2011 FY2010 19 months end. Dec-
2009
Contract Revenues 83.77 37.48 11.94
Net Operating Income (NOI) 4.11 (1.97) (9.26)
Net Income 3.78 1.32 (0.30)
Operating Cash Flows (OCF) (9.81) (14.78) (11.76)
Investing Cash Flows (3.52) (107.00) (110.25)
Cash & Cash Equivalents (CCE) 40.66 55.41 177.99
Current Liabilities 16.95 8.92 15.11
AREF Energy Holding Company K.S.C.C ● January 2013 P a g e | 17
www.capstandards.com
Corporate Credit Rating Analysis – Update Investment Sector
AREF Energy Holding Co. K.S.C.C. Salmiya Real Estate Co.
Salmiya Real Estate Co. Sa
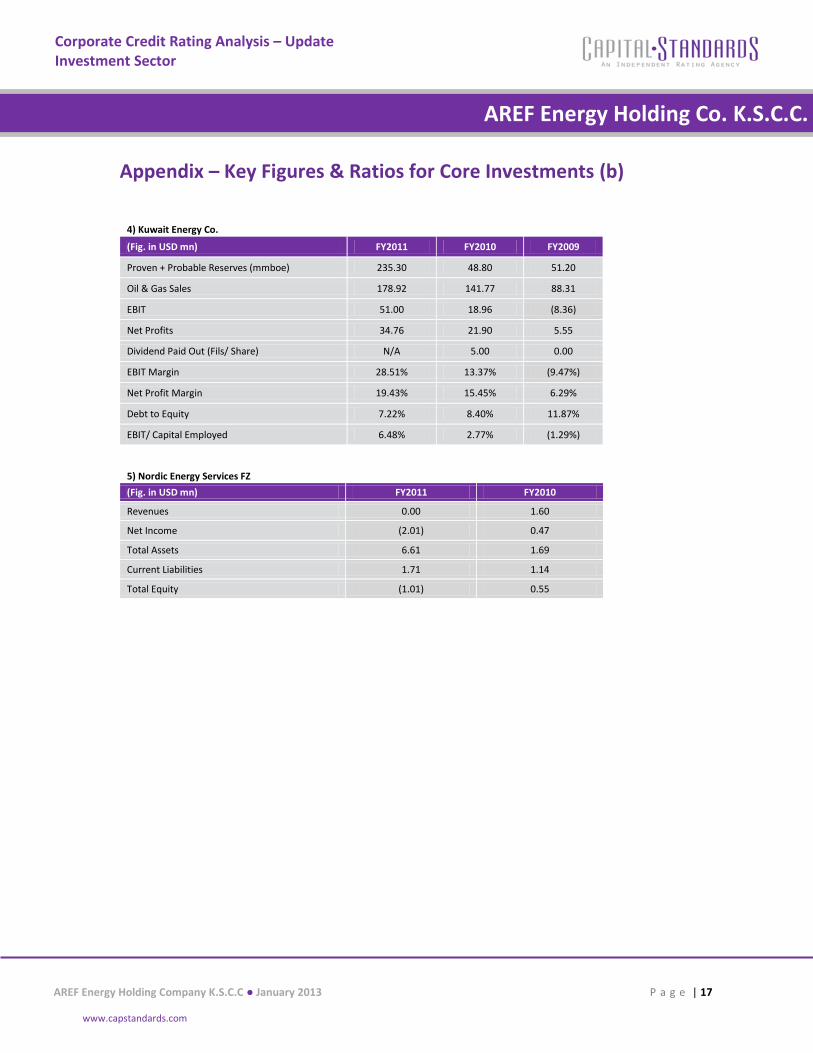
Appendix – Key Figures & Ratios for Core Investments (b)
4) Kuwait Energy Co.
(Fig. in USD mn) FY2011 FY2010 FY2009
Proven + Probable Reserves (mmboe) 235.30 48.80 51.20
Oil & Gas Sales 178.92 141.77 88.31
EBIT 51.00 18.96 (8.36)
Net Profits 34.76 21.90 5.55
Dividend Paid Out (Fils/ Share) N/A 5.00 0.00
EBIT Margin 28.51% 13.37% (9.47%)
Net Profit Margin 19.43% 15.45% 6.29%
Debt to Equity 7.22% 8.40% 11.87%
EBIT/ Capital Employed 6.48% 2.77% (1.29%)
5) Nordic Energy Services FZ
(Fig. in USD mn) FY2011 FY2010
Revenues 0.00 1.60
Net Income (2.01) 0.47
Total Assets 6.61 1.69
Current Liabilities 1.71 1.14
Total Equity (1.01) 0.55
AREF Energy Holding Company K.S.C.C ● January 2013 P a g e | 18
www.capstandards.com
Corporate Credit Rating Analysis – Update Investment Sector
AREF Energy Holding Co. K.S.C.C. Salmiya Real Estate Co.
Salmiya Real Estate Co. Sa
Disclaimer
Solicited
Capital Standards have exclusive proprietary rights in the data or information provided herein. This data/information may only be used internally for business purposes and shall not be used for any unlawful or unauthorized purposes. Dissemination, distribution or reproduction of this data/information in any form is strictly prohibited except with the prior written permission of Capital Standards. Because of the possibility of human or mechanical error, Capital Standards do not guarantee the accuracy, adequacy, completeness or availability of any information and is not responsible for any errors or omissions or for the results obtained from the use of such information. Capital Standards gives no express or implied warranties, including, but not limited to, any warranties of merchantability or fitness for a particular purpose or use. In no event shall Capital Standards be liable for any direct, indirect, special or consequential damages in connection with subscribers or others use of the data/information contained herein. Access to the data or information contained herein is subject to termination in the event any agreement with a third-party of information or software is terminated Reproduction or retransmission in whole or in part is prohibited except by permission. All rights reserved. All of the information contained herein is based on information obtained from issuers, other obligors, underwriters, and other sources which Capital Standards believes to be reliable. Capital Standards does not audit or verify the truth or accuracy of any such information. As a result, the information in this report is provided “as is” without any representation or warranty of any kind. A Capital Standards rating is an opinion as to the creditworthiness of a security. The rating does not address the risk of loss due to risks other than credit risk, unless such risk is specifically mentioned. The credit ratings and observations contained herein are solely statements of opinion and not statements of fact or recommendations to purchase, hold, or sell any securities or make any other investment decisions. Accordingly, any user of the information contained herein should not rely on any credit rating or other opinion contained herein in making any investment decision. Capital Standards has established policies and procedures to maintain the confidentiality of non-public information received during the rating process. Capital Standards is not engaged in the offer or sale of any security. A report providing a Capital Standards rating is neither a prospectus nor a substitute for the information assembled, verified and presented to investors by the issuer and its agents in connection with the sale of the securities. Ratings may be changed, suspended, or withdrawn at anytime for any reason in the sole discretion of Capital Standards. Capital Standards receives compensation for its ratings. Such compensation is normally paid either by the issuers of such securities or third parties participating in marketing the securities. While Capital Standards reserves the right to disseminate the rating, it receives no payment for doing so, except for subscriptions to its publications.


![Home Page [aref-bk.men.gov.ma]](https://img.pdfslide.net/doc/110x75/61745aa4e162c2299b5eeb5e/home-page-aref-bkmengovma.jpg)

