Embed Size (px)
Citation preview
Coastal managers and engineers increasingly need coastal state information at small scales of days to weeks and meters to kilometers. This is due to the frequent use of local beach nourishments and the demand for year-round exploitation of beaches, driven by the increasing recreational pressure on the coast. Coastal managers aim for a sustainable development of a variety of coastal functions, including protection of the hinterland against flooding, swimmer safety, beach recreation and nature conservation. The design and evaluation of coastal policy measures and engineering interventions is hampered by the dynamics of the natural system. Beach nourishments adapt to an equilibrium profile in a matter of weeks to months, through phases that may be unexpected and could pose temporary problems. Rip currents may even develop within days, hence forming a serious threat for swimmer safety. Effective decision making in this complex field thus demands the availability of detailed coastal state information with high resolution in time and space.
Remote sensing techniques offer the potential to provide this information against low costs.
The product: Coastal state information derived from videoSuccessful use of video monitoring techniques in sup-port of coastal management and engineering involves the quantification of relevant coastal state information from video data. Sophisticated, operational video analy-sis methods nowadays enable:
• the quantification of shoreline evolution and beach width, to evaluate the potential for recreation or to assess the morphological impact of a storm event (cf. Application 1);• the quantification of erosional and accretional sediment volumes at the intertidal beach, for example to evaluate the morphological impact of coastal structures, to investigate seasonal fluctuations in beach dynamics and beach nourishments or to study the behaviour of morphological features such as sand spits and tidal flats near a harbour entrance (cf Application 2); • the quantification of subtidal beach bathymetry, to evaluate coastal safety, to assess the behaviour and performance of shoreface nourishments or even to facilitate military operations (cf. Application 3); and
ARGUSVideo monitoring for coastal management and engineering
• the quantification of wave run-up, to evaluate the stability of coastal structures such as seawalls, harbour moles and revetments (cf. Application 4).
In a research context, video monitoring techniques have been applied to quantify alongshore flow velocities, wave characteristics such as wave angle and period, the occurrence of algae bloom and the distribution and persistency of rip currents. Future applications may involve the monitoring of visitor density at the beach and the prediction of rip currents. The continuous collection of long-term, high-resolution data sets carries the additional advantage of a posteriori data selection, for instance for the consistent assess-ment of storm damage to public and private property and the early recognition of important erosion trends.
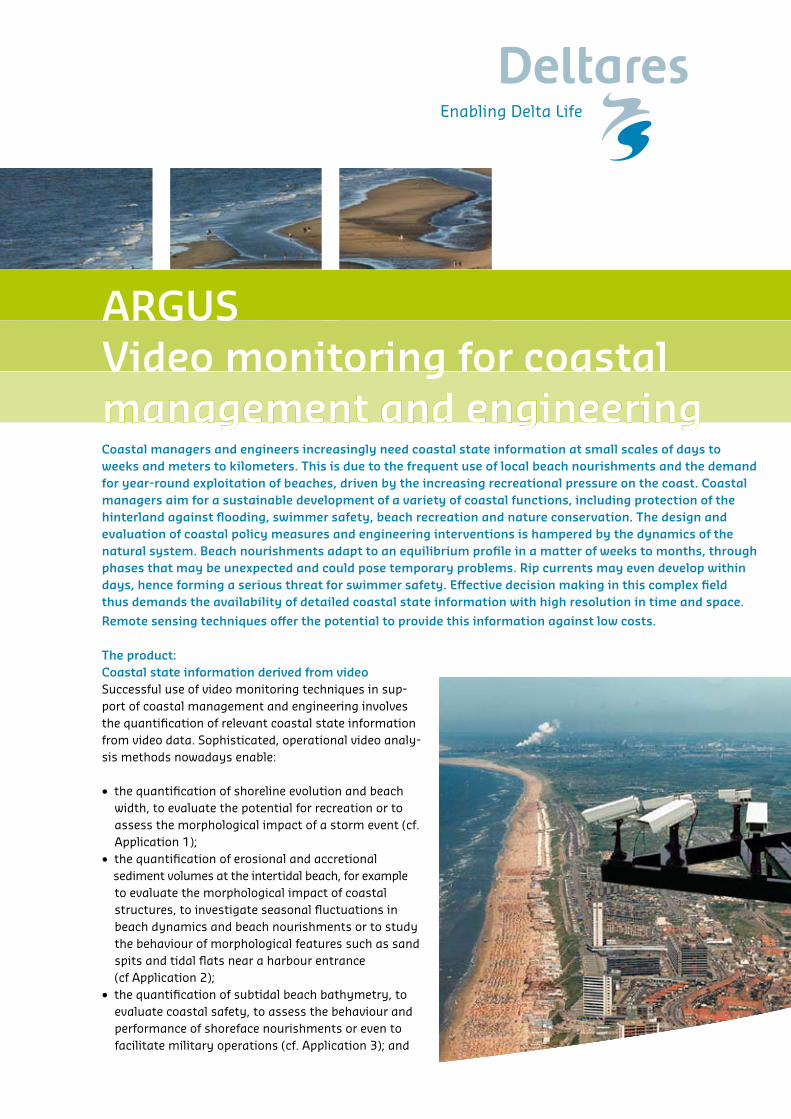
The approach: The Argus video technique. With the advent of digital imaging technology, shore-based remote video techniques like the advanced Argus system developed at Oregon State University (USA) have increasingly been used for the monitoring of coastal processes in support of coastal management and engineering. Unmanned, automated video stations guarantee the collection of video data at spatiotem-poral scales of decimeters to kilometers and hours to years. Being continuously improved since 1992, the system nowadays features fully digital video technology which provides high image quality in combination with detailed pixel resolution. An Argus monitoring system typically consists of four to five video cameras, spanning a 180º view, and allowing full coverage of about four to six kilometers of beach. The cameras are mounted on a high loca-tion along the coast and connected to an ordinary PC on site, which in turn communicates to the outside world using conventional techniques such as an analog
modems, ISDN, DSL, or a wireless LAN. Data sampling is usually hourly (although any schedule can be specified) and continues during rough weather conditions. As the process of data collection is fully automated, the marginal operating costs are virtually zero.
Each standard hourly collection usually consists of three types of images. A snapshot image serves as sim-ple documentation of the ambient conditions but offers little quantitative information. Time exposure images average out natural modulations in wave break-ing to reveal a smooth pattern of bright image intensi-ties, which are an excellent proxy for the underlying, submerged sand bar topography. Time exposures also ‘remove’ moving objects from the camera field of view, such as ships, vehicles and people. Variance images help identify regions which are changing in time (like the sea surface), from those which may be bright, but are unchanging (like the dry beach). Panoramic and plan view merged images can be composed by geo-ref-erencing the images from all the cameras of an Argus station. Plan view images enable the measurement of length scales of morphological features like breaker bars and the detection of rip currents. Besides time-averaged video data, data sampling schemes can be designed to collect time series of pixel intensities, typi-cally at 2 Hz, with which wave and flow characteristics can be investigated.
The collaboration: Services provided by Deltares
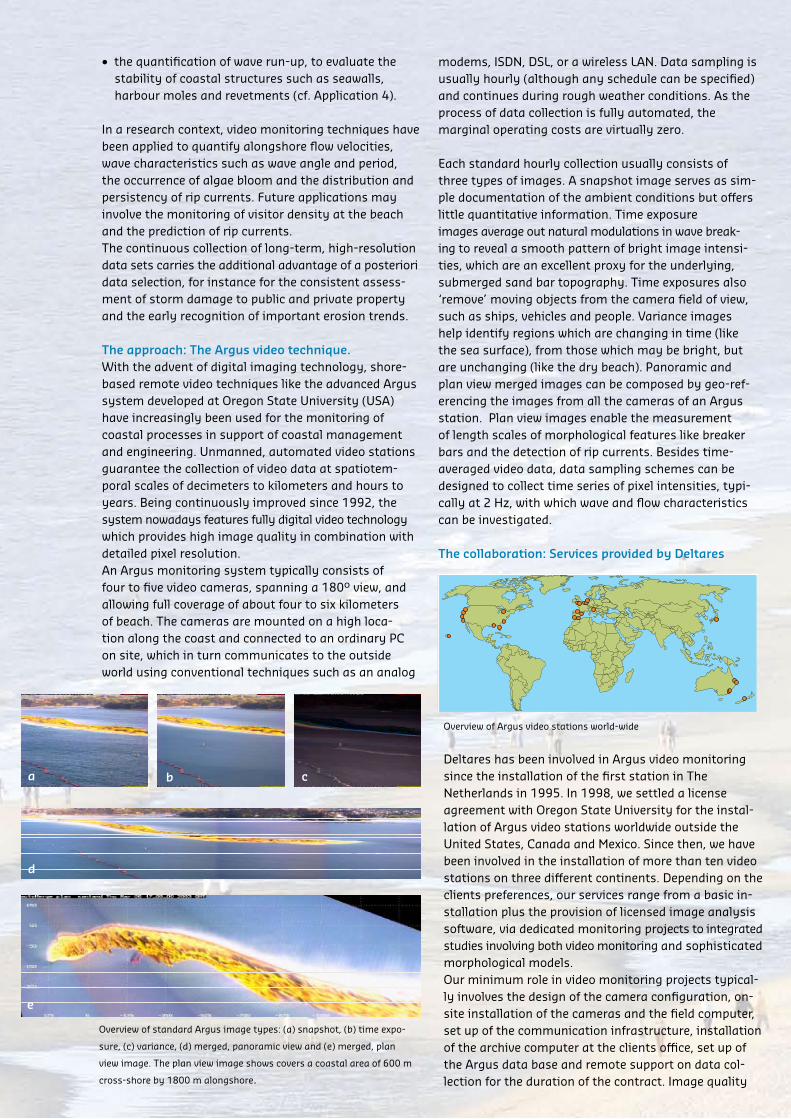
Overview of standard Argus image types: (a) snapshot, (b) time expo-
sure, (c) variance, (d) merged, panoramic view and (e) merged, plan
view image. The plan view image shows covers a coastal area of 600 m
cross-shore by 1800 m alongshore.
Overview of Argus video stations world-wide
Deltares has been involved in Argus video monitoring since the installation of the first station in The Netherlands in 1995. In 1998, we settled a license agreement with Oregon State University for the instal-lation of Argus video stations worldwide outside the United States, Canada and Mexico. Since then, we have been involved in the installation of more than ten video stations on three different continents. Depending on the clients preferences, our services range from a basic in-stallation plus the provision of licensed image analysis software, via dedicated monitoring projects to integrated studies involving both video monitoring and sophisticated morphological models. Our minimum role in video monitoring projects typical-ly involves the design of the camera configuration, on-site installation of the cameras and the field computer, set up of the communication infrastructure, installation of the archive computer at the clients office, set up of the Argus data base and remote support on data col-lection for the duration of the contract. Image quality
a b c
d
e
The collaboration: Services provided by WL| Delft Hydraulics
Fig. 2: Overview of Argus video stations world-wide
Wave run-up and wave overtopping are twoof the mechanisms that may cause damageor even failure of coastal structures suchas seawalls, harbour moles and groins. Highfrequency video observations (typically at2 Hz) can be used to determine thestatistics of wave run-up at beaches andcoastal structures. The figure above showsan example of a timestack image, wherepixel intensities are sampled along a cross-shore array in the swash zone and stackedover time. The position of the swash edgecan be visually identified by the sharp change
in intensity between the darker beachsurface and the lighter ‘foamy’ edge of theswash bore (after Holland and Holman,1993). This type of monitoring yieldsinformation on the wave attack atstructures during a single storm event orthroughout the year.
Reference:Holland, K.T. and Holman, R.A., 1993. Thestatistical distribution of swash maxima onnatural beaches. Journal of GeophysicalResearch, 98, pp. 10271-10278.
Application 4:Quantification of wave run-up on coastal structures
WL | Delft Hydraulics has been involved inArgus video monitoring since theinstallation of the first station in TheNetherlands in 1995. In 1998, we settled alicense agreement with Oregon StateUniversity for the installation of Argus videostations worldwide outside the UnitedStates, Canada and Mexico. Since then, wehave been involved in the installation ofmore than ten video stations on threedifferent continents (Fig. 2). Depending onthe clients preferences, our services rangefrom a basic installation plus the provisionof licensed image analysis software, viadedicated monitoring projects to integratedstudies involving both video monitoring andsophisticated morphological models.
Our minimum role in video monitoringprojects typically involves the design of thecamera configuration, on-site installation ofthe cameras and the field computer, set upof the communication infrastructure,installation of the archive computer at theclients office, set up of the Argus data baseand remote support on data collection forthe duration of the contract. Image qualitycontrol, standard post-processing and dataanalysis and interpretation are available onrequest. A suite of licensed, operationaltools for image post-processing and analysisis available, including tools for:
• geo-referencing and Argus databasemanagement;
• image rectification and merging(panoramic and plan view);
• generating movies (oblique images andmerges);
• inclusion and use of support data (tideand wave data);
• shoreline mapping and shorelineanalysis;
• quantification of intertidal beachbathymetry.
Due to our liaison with Oregon StateUniversity, state-of-the-art technology iscontinuously being embedded in ouroperational video analysis system. Practicalexperience is disseminated towards clientsby means of training, workshops andintensive contacts throughout a project.
WL | Delft Hydraulics, ARGUS
control, standard post-processing and data analysis and interpretation are available on request. A suite of licensed, operational tools for image post-processing and analysis is available, including tools for:• geo-referencing and Argus database management;• image rectification and merging (panoramic and plan view);• generating movies (oblique images and merges);• inclusion and use of support data (tide and wave data);
Application 2:Intertidal morphological changes at a
The product: Coastal state information derived from video
distribution and persistency of rip currents.Future applications may involve themonitoring of visitor density at the beachand the prediction of rip currents.The continuous collection of long-term,high-resolution data sets carries theadditional advantage of a posteriori dataselection, for instance for the consistentassessment of storm damage to public andprivate property and the early recognitionof important erosion trends.
Successful use of video monitoring techniques in support of coastal management andengineering involves the quantification of relevant coastal state information from videodata. Sophisticated, operational video analysis methods nowadays enable:
• the quantification of subtidal beachbathymetry, to evaluate coastal safety,to assess the behaviour andperformance of shoreface nourishmentsor even to facilitate military operations(cf. Application 3); and
• the quantification of wave run-up, toevaluate the stability of coastalstructures such as seawalls, harbourmoles and revetments (cf. Application 4).
In a research context, video monitoringtechniques have been applied to quantifyalongshore flow velocities, wavecharacteristics such as wave angle and period,the occurrence of algae bloom and the
• the quantification of shorelineevolution and beach width, to evaluatethe potential for recreation or toassess the morphological impact of astorm event (cf. Application 1);
• the quantification of erosional andaccretional sediment volumes at theintertidal beach, for example toevaluate the morphological impact ofcoastal structures, to investigateseasonal fluctuations in beachdynamics and beach nourishments orto study the behaviour ofmorphological features such as sandspits and tidal flats near a harbourentrance (cf. Application 2);
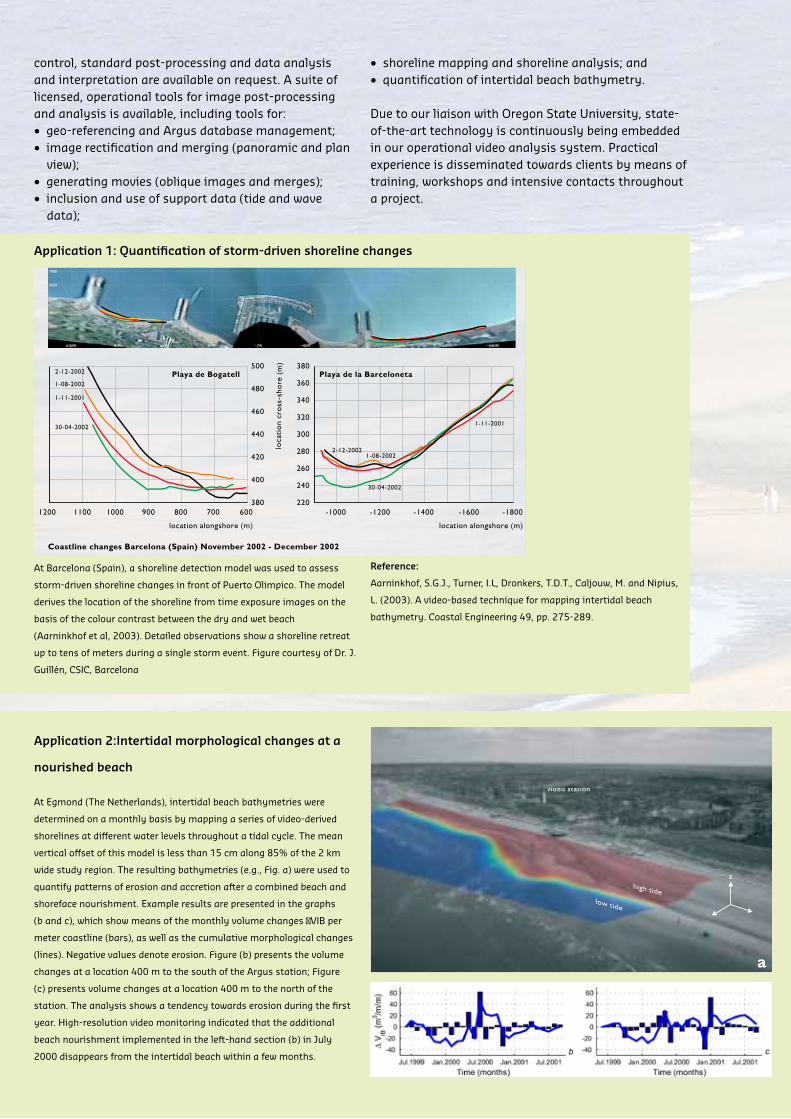
Coastline changes Barcelona (Spain) November 2002 - December 2002
At Barcelona (Spain), a shoreline detectionmodel was used to assess storm-drivenshoreline changes in front of PuertoOlímpico. The model derives the locationof the shoreline from time exposure imageson the basis of the colour contrast between
Reference:Aarninkhof, S.G.J., Turner, I.L, Dronkers,T.D.T., Caljouw, M. and Nipius, L. (2003).A video-based technique for mapping intertidalbeach bathymetry.Coastal Engineering 49, pp. 275-289.
the dry and wet beach (Aarninkhof et al,2003). Detailed observations show ashoreline retreat up to tens of metersduring a single storm event.
Figure courtesy of Dr. J. Guillén, CSIC, Barcelona.
Application 1: Quantification of storm-driven shoreline changes
WL | Delft Hydraulics, ARGUS
Application 1: Quantification of storm-driven shoreline changes
At Barcelona (Spain), a shoreline detection model was used to assess
storm-driven shoreline changes in front of Puerto Olimpico. The model
derives the location of the shoreline from time exposure images on the
basis of the colour contrast between the dry and wet beach
(Aarninkhof et al, 2003). Detailed observations show a shoreline retreat
up to tens of meters during a single storm event. Figure courtesy of Dr. J.
Guillén, CSIC, Barcelona
Reference:
Aarninkhof, S.G.J., Turner, I.L, Dronkers, T.D.T., Caljouw, M. and Nipius,
L. (2003). A video-based technique for mapping intertidal beach
bathymetry. Coastal Engineering 49, pp. 275-289.
• shoreline mapping and shoreline analysis; and• quantification of intertidal beach bathymetry.
Due to our liaison with Oregon State University, state-of-the-art technology is continuously being embedded in our operational video analysis system. Practical experience is disseminated towards clients by means of training, workshops and intensive contacts throughout a project.
nourished beach
At Egmond (The Netherlands), intertidal beach bathymetries were
determined on a monthly basis by mapping a series of video-derived
shorelines at different water levels throughout a tidal cycle. The mean
vertical offset of this model is less than 15 cm along 85% of the 2 km
wide study region. The resulting bathymetries (e.g., Fig. a) were used to
quantify patterns of erosion and accretion after a combined beach and
shoreface nourishment. Example results are presented in the graphs
(b and c), which show means of the monthly volume changes VIB per
meter coastline (bars), as well as the cumulative morphological changes
(lines). Negative values denote erosion. Figure (b) presents the volume
changes at a location 400 m to the south of the Argus station; Figure
(c) presents volume changes at a location 400 m to the north of the
station. The analysis shows a tendency towards erosion during the first
year. High-resolution video monitoring indicated that the additional
beach nourishment implemented in the left-hand section (b) in July
2000 disappears from the intertidal beach within a few months.
Application 2: Intertidal morphological changes at a nourished beach
At Egmond (The Netherlands), intertidal beach bathymetrieswere determined on a monthly basis by mapping a series ofvideo-derived shorelines at different water levels throughout atidal cycle. The mean vertical offset of this model is less than15 cm along 85% of the 2 km wide study region. The resultingbathymetries (e.g., Panel. a) were used to quantify patterns oferosion and accretion after a combined beach and shorefacenourishment. Example results are presented in the panels (b andc), which show means of the monthly volume changes
IB per
meter coastline (bars), as well as the cumulative morphologicalchanges (lines). Negative values denote erosion. Panel (b) presentsthe volume changes at a location 400 m to the south of the
At Egmond (The Netherlands), Argus video imagery has beenused to monitor the evolution of surf zone bathymetry afterimplementation of a shoreface nourishment in July 1999. Thebed elevation is continuously updated on the basis of acomparison of video-derived and model-computed patterns ofwave dissipation (Aarninkhof, 2003). This approach yields marginaldeviations in the order of 10 to 20 cm at the seaward face of thebars, which increase up to 20 to 40 cm near the bar crest. Theresults show a shoreward migration of the outer bar afterdeployment of the shoreface nourishment in combination witha net accretion of sediment along the shallow part of the beachprofile above the -2 m depth contour, thus confirming thebeneficial impact of the nourishment.
Reference:Aarninkhof, S.G.J. (2003). Nearshore bathymetry derived from videoimagery. PhD. Thesis, Delft University of Technology, 175 pp.
Argus station; Panel (c) presents volume changes at a location400 m to the north of the station. The analysis shows a tendencytowards erosion during the first year. High-resolution videomonitoring indicated that the additional beach nourishmentimplemented in the upper section (b) in July 2000 disappearsfrom the intertidal beach within a few months.
Application 3: Measurement of surf zone bathymetry
WL | Delft Hydraulics, ARGUS
a
b
c
P.O. Box 1772600 MH Delft, The [email protected]
Application 3: Measurement of surf zone bathymetry
Application 4: Quantification of wave run-up on coastal structures
Application 2: Intertidal morphological changes at a nourished beach
At Egmond (The Netherlands), intertidal beach bathymetrieswere determined on a monthly basis by mapping a series ofvideo-derived shorelines at different water levels throughout atidal cycle. The mean vertical offset of this model is less than15 cm along 85% of the 2 km wide study region. The resultingbathymetries (e.g., Panel. a) were used to quantify patterns oferosion and accretion after a combined beach and shorefacenourishment. Example results are presented in the panels (b andc), which show means of the monthly volume changes
IB per
meter coastline (bars), as well as the cumulative morphologicalchanges (lines). Negative values denote erosion. Panel (b) presentsthe volume changes at a location 400 m to the south of the
At Egmond (The Netherlands), Argus video imagery has beenused to monitor the evolution of surf zone bathymetry afterimplementation of a shoreface nourishment in July 1999. Thebed elevation is continuously updated on the basis of acomparison of video-derived and model-computed patterns ofwave dissipation (Aarninkhof, 2003). This approach yields marginaldeviations in the order of 10 to 20 cm at the seaward face of thebars, which increase up to 20 to 40 cm near the bar crest. Theresults show a shoreward migration of the outer bar afterdeployment of the shoreface nourishment in combination witha net accretion of sediment along the shallow part of the beachprofile above the -2 m depth contour, thus confirming thebeneficial impact of the nourishment.
Reference:Aarninkhof, S.G.J. (2003). Nearshore bathymetry derived from videoimagery. PhD. Thesis, Delft University of Technology, 175 pp.
Argus station; Panel (c) presents volume changes at a location400 m to the north of the station. The analysis shows a tendencytowards erosion during the first year. High-resolution videomonitoring indicated that the additional beach nourishmentimplemented in the upper section (b) in July 2000 disappearsfrom the intertidal beach within a few months.
Application 3: Measurement of surf zone bathymetry
WL | Delft Hydraulics, ARGUS
a
b
c
The collaboration: Services provided by WL| Delft Hydraulics
Fig. 2: Overview of Argus video stations world-wide
Wave run-up and wave overtopping are twoof the mechanisms that may cause damageor even failure of coastal structures suchas seawalls, harbour moles and groins. Highfrequency video observations (typically at2 Hz) can be used to determine thestatistics of wave run-up at beaches andcoastal structures. The figure above showsan example of a timestack image, wherepixel intensities are sampled along a cross-shore array in the swash zone and stackedover time. The position of the swash edgecan be visually identified by the sharp change
in intensity between the darker beachsurface and the lighter ‘foamy’ edge of theswash bore (after Holland and Holman,1993). This type of monitoring yieldsinformation on the wave attack atstructures during a single storm event orthroughout the year.
Reference:Holland, K.T. and Holman, R.A., 1993. Thestatistical distribution of swash maxima onnatural beaches. Journal of GeophysicalResearch, 98, pp. 10271-10278.
Application 4:Quantification of wave run-up on coastal structures
WL | Delft Hydraulics has been involved inArgus video monitoring since theinstallation of the first station in TheNetherlands in 1995. In 1998, we settled alicense agreement with Oregon StateUniversity for the installation of Argus videostations worldwide outside the UnitedStates, Canada and Mexico. Since then, wehave been involved in the installation ofmore than ten video stations on threedifferent continents (Fig. 2). Depending onthe clients preferences, our services rangefrom a basic installation plus the provisionof licensed image analysis software, viadedicated monitoring projects to integratedstudies involving both video monitoring andsophisticated morphological models.
Our minimum role in video monitoringprojects typically involves the design of thecamera configuration, on-site installation ofthe cameras and the field computer, set upof the communication infrastructure,installation of the archive computer at theclients office, set up of the Argus data baseand remote support on data collection forthe duration of the contract. Image qualitycontrol, standard post-processing and dataanalysis and interpretation are available onrequest. A suite of licensed, operationaltools for image post-processing and analysisis available, including tools for:
• geo-referencing and Argus databasemanagement;
• image rectification and merging(panoramic and plan view);
• generating movies (oblique images andmerges);
• inclusion and use of support data (tideand wave data);
• shoreline mapping and shorelineanalysis;
• quantification of intertidal beachbathymetry.
Due to our liaison with Oregon StateUniversity, state-of-the-art technology iscontinuously being embedded in ouroperational video analysis system. Practicalexperience is disseminated towards clientsby means of training, workshops andintensive contacts throughout a project.
WL | Delft Hydraulics, ARGUS
In summaryCoastal managers and engineers presently demand high-resolution monitoring information, which is not easily obtained from traditional survey techniques. With the advent of digital imaging technology, auto-mated shore-based video stations provide enhanced opportunities to support cost-efficient coastal resource planning and impact assessment studies. For further information, please contact Deltares
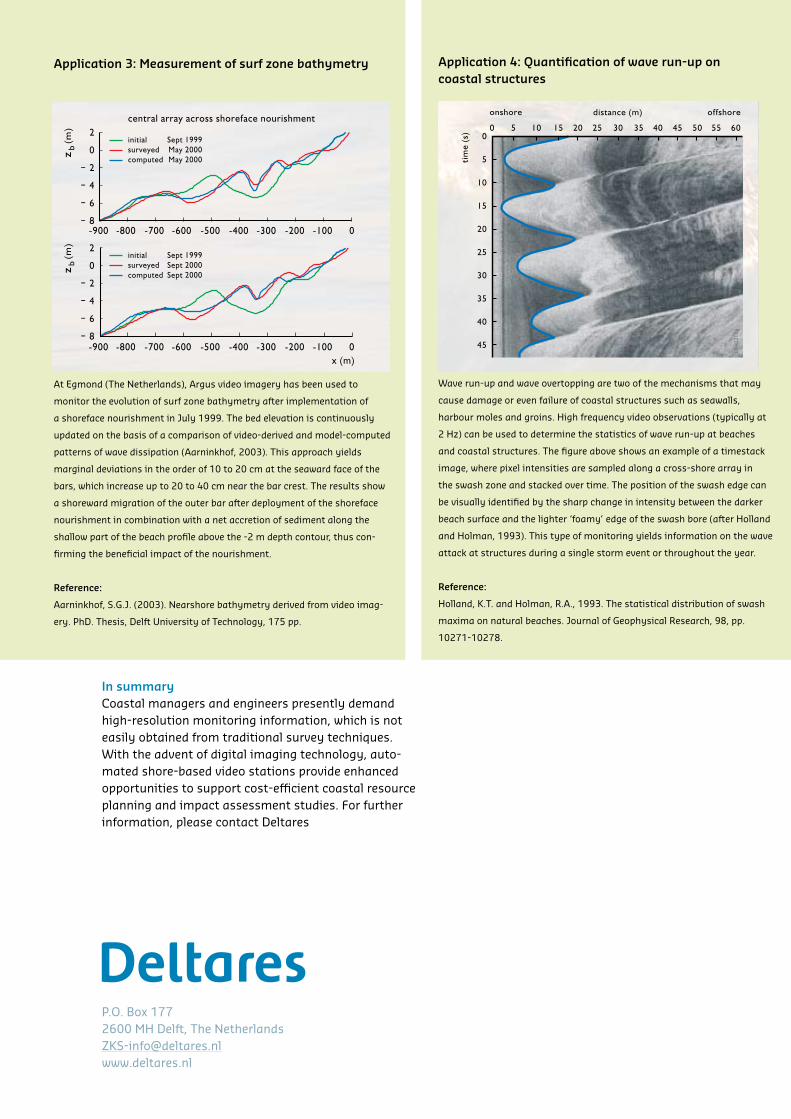
At Egmond (The Netherlands), Argus video imagery has been used to
monitor the evolution of surf zone bathymetry after implementation of
a shoreface nourishment in July 1999. The bed elevation is continuously
updated on the basis of a comparison of video-derived and model-computed
patterns of wave dissipation (Aarninkhof, 2003). This approach yields
marginal deviations in the order of 10 to 20 cm at the seaward face of the
bars, which increase up to 20 to 40 cm near the bar crest. The results show
a shoreward migration of the outer bar after deployment of the shoreface
nourishment in combination with a net accretion of sediment along the
shallow part of the beach profile above the -2 m depth contour, thus con-
firming the beneficial impact of the nourishment.
Reference:
Aarninkhof, S.G.J. (2003). Nearshore bathymetry derived from video imag-
ery. PhD. Thesis, Delft University of Technology, 175 pp.
Wave run-up and wave overtopping are two of the mechanisms that may
cause damage or even failure of coastal structures such as seawalls,
harbour moles and groins. High frequency video observations (typically at
2 Hz) can be used to determine the statistics of wave run-up at beaches
and coastal structures. The figure above shows an example of a timestack
image, where pixel intensities are sampled along a cross-shore array in
the swash zone and stacked over time. The position of the swash edge can
be visually identified by the sharp change in intensity between the darker
beach surface and the lighter ‘foamy’ edge of the swash bore (after Holland
and Holman, 1993). This type of monitoring yields information on the wave
attack at structures during a single storm event or throughout the year.
Reference:
Holland, K.T. and Holman, R.A., 1993. The statistical distribution of swash
maxima on natural beaches. Journal of Geophysical Research, 98, pp.
10271-10278.