Embed Size (px)
Citation preview
2012 SPECIALTY CROP REPORT
AGRICULTURES T A T I S T I C S
Acknowledgements
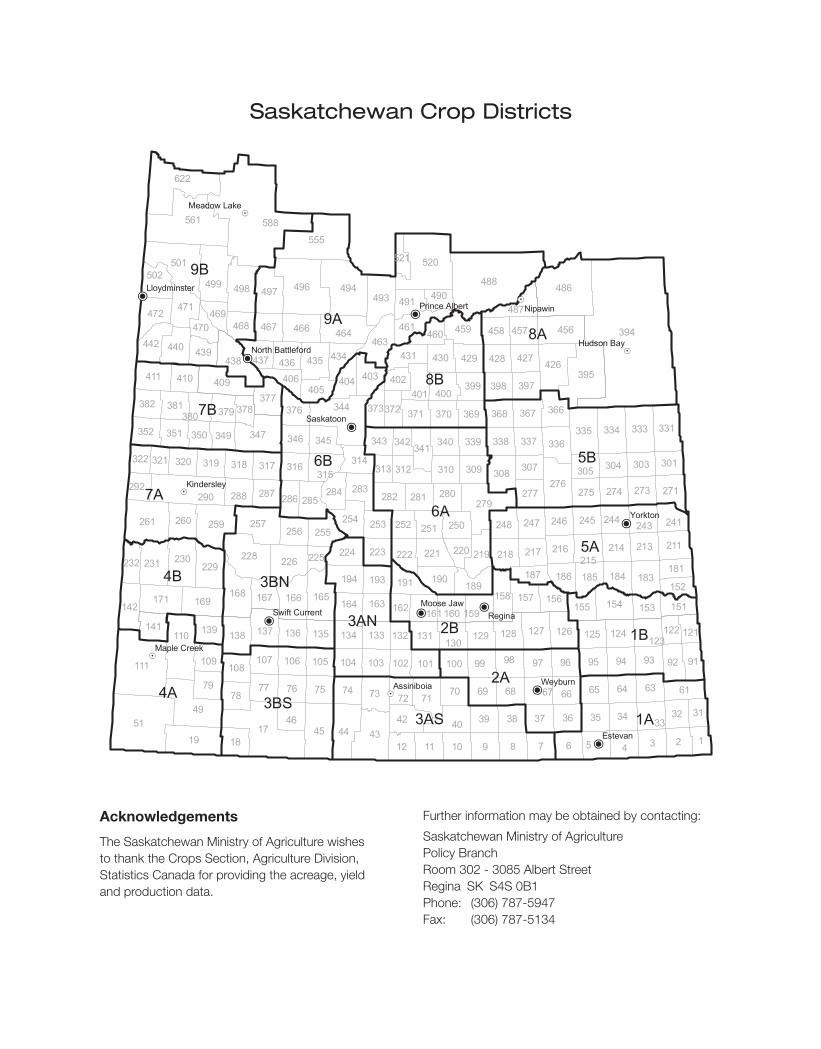
The Saskatchewan Ministry of Agriculture wishes to thank the Crops Section, Agriculture Division, Statistics Canada for providing the acreage, yield and production data.
Further information may be obtained by contacting:
Saskatchewan Ministry of AgriculturePolicy BranchRoom 302 - 3085 Albert StreetRegina SK S4S 0B1Phone: (306) 787-5947Fax: (306) 787-5134
Saskatchewan Crop Districts
Table of ContentsSummary ................................................................................................................................................................2
Peas .......................................................................................................................................................................4
Lentils .....................................................................................................................................................................6
Mustard ..................................................................................................................................................................9
Canaryseed ..........................................................................................................................................................11
Chickpeas ............................................................................................................................................................13
Other Crops .........................................................................................................................................................16
Tables, Maps and Charts
Figure 1: Area, Yield, and Production of Specialty Crops, Saskatchewan ................................................................2
Figure 2: Saskatchewan Specialty Crop Seeded Area .............................................................................................3
Figure 3: Saskatchewan Specialty Crop Production ................................................................................................3
Figure 4: Pea Production and Prices in Saskatchewan............................................................................................4
Figure 5: Pea Seeded Acres by Crop District ..........................................................................................................4
Figure 6: Saskatchewan Green, Yellow and Feed Pea Spot Price ...........................................................................5
Figure 7: Canadian Dry Peas Exports .....................................................................................................................5
Figure 8: Pea Supply and Disposition, Western Canada ..........................................................................................6
Figure 9: Lentil Production and Prices in Saskatchewan .........................................................................................6
Figure 10: Lentil Seeded Acres by Crop District ......................................................................................................7
Figure 11: Saskatchewan Large Green, Small Green and Red Lentil Spot Prices ....................................................7
Figure 12: Canadian Lentil Exports .........................................................................................................................8
Figure 13: Lentil Supply and Disposition, Western Canada .....................................................................................8
Figure 14: Mustard Production and Prices in Saskatchewan ...................................................................................9
Figure 15: Mustard Seeded Acres by Crop District..................................................................................................9
Figure 16: Saskatchewan Brown, Yellow and Oriental Mustard Spot Price ..............................................................9
Figure 17: Canadian Mustard Exports ...................................................................................................................10
Figure 18: Mustard Supply and Disposition, Western Canada ...............................................................................10
Figure 19: Canaryseed Production and Prices in Saskatchewan ...........................................................................11
Figure 20: Canaryseed Seeded Acres by Crop District ..........................................................................................11
Figure 21: Saskatchewan Canaryseed Spot Price .................................................................................................12
Figure 22: Canadian Canaryseed Exports .............................................................................................................12
Figure 23: Canaryseed Supply and Disposition, Western Canada .........................................................................13
Figure 24: Chickpea Production and Prices in Saskatchewan ...............................................................................13
Figure 25: Chickpea Seeded Acres by Crop District ..............................................................................................13
Figure 26: Saskatchewan Kabuli and Desi Chickpea Spot Prices ..........................................................................14
Figure 27: Canadian Chickpea Exports .................................................................................................................14
Figure 28: Chickpea Supply and Disposition, Western Canada .............................................................................15
Figure 29: Prairie Provinces Specialty Crops Area, Production, and Canadian Exports ..........................................17
2 2012 Specialty Crop Report, Saskatchewan Ministry of Agriculture
Last winter was fairly mild and there was not enough snow runoff in many parts of the province to provide sufficient moisture at seeding time. Parts of the west-central and southwestern regions had poor stubble subsoil moisture going into winter and there were concerns of drought-like conditions in the spring. Large amounts of precipitation fell in the months of April and May, helping to alleviate some of these concerns in the west. In the east excess moisture hindered seeding. However, most producers were able to seed and harvest a crop this year. For many in the southeast, it was the first time in several years that a crop was seeded.
Many producers were able to start seeding around the end of April, and, by the first week of May, five per cent of the crop was seeded. Field conditions were better than they had been for several years in many parts of
the province, and seeding quickly progressed once the rain stopped. By June 18, 98 per cent of the crop had been seeded, compared to just 82 per cent at the same time in 2011.
It was a difficult year for many crops, as flooding, heat stress, diseases, insects, wind and hail affected the whole province. The eastern side dealt with excess moisture for the majority of the year while the south dealt with high temperatures and heat stress. By mid-July, hail insurance claims were twice the average and the number continued to rise throughout the growing season.
Diseases were present in the majority of crops this year with canola affected the most. For the most part, insect damage was minimal in many areas, although there were pockets of the province that had more damage from wheat midge, diamondback moths
2012 Specialty Crop Report
Summary
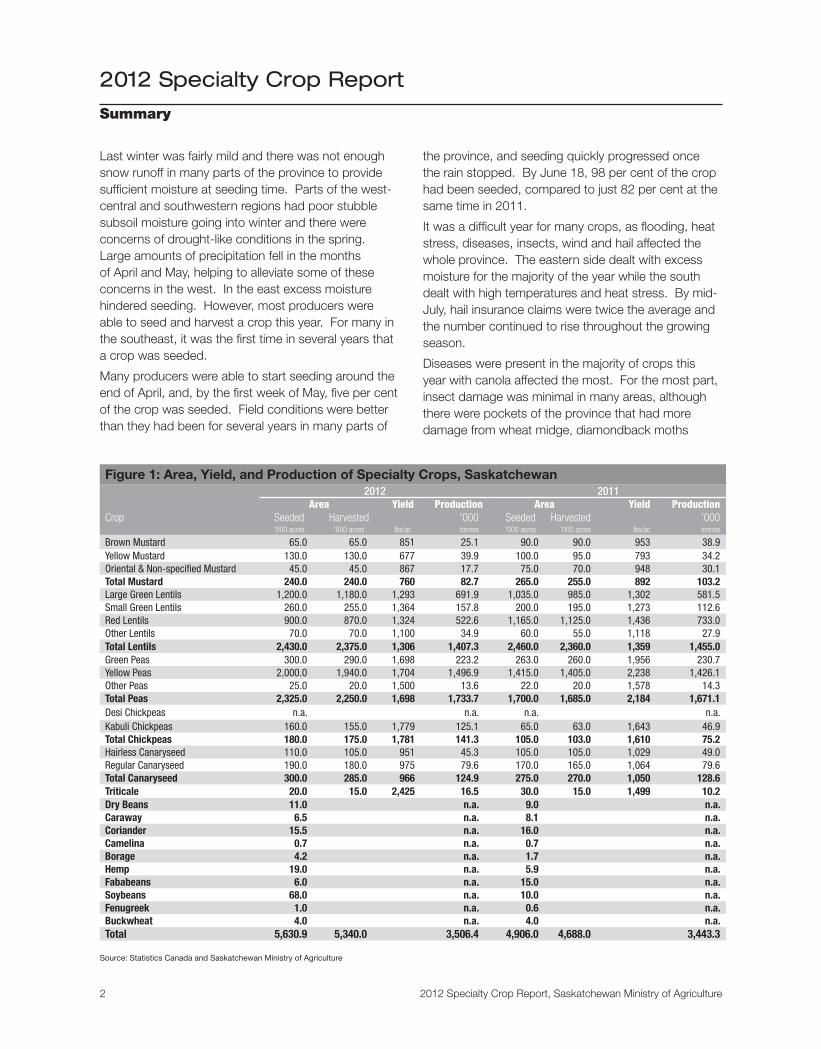
Figure 1: Area, Yield, and Production of Specialty Crops, Saskatchewan2012 2011
Area Yield Production Area Yield ProductionCrop Seeded Harvested '000 Seeded Harvested '000
'000 acres '000 acres lbs/ac tonnes '000 acres '000 acres lbs/ac tonnes
Brown Mustard 65.0 65.0 851 25.1 90.0 90.0 953 38.9Yellow Mustard 130.0 130.0 677 39.9 100.0 95.0 793 34.2Oriental & Non-specified Mustard 45.0 45.0 867 17.7 75.0 70.0 948 30.1Total Mustard 240.0 240.0 760 82.7 265.0 255.0 892 103.2Large Green Lentils 1,200.0 1,180.0 1,293 691.9 1,035.0 985.0 1,302 581.5Small Green Lentils 260.0 255.0 1,364 157.8 200.0 195.0 1,273 112.6Red Lentils 900.0 870.0 1,324 522.6 1,165.0 1,125.0 1,436 733.0Other Lentils 70.0 70.0 1,100 34.9 60.0 55.0 1,118 27.9Total Lentils 2,430.0 2,375.0 1,306 1,407.3 2,460.0 2,360.0 1,359 1,455.0Green Peas 300.0 290.0 1,698 223.2 263.0 260.0 1,956 230.7Yellow Peas 2,000.0 1,940.0 1,704 1,496.9 1,415.0 1,405.0 2,238 1,426.1Other Peas 25.0 20.0 1,500 13.6 22.0 20.0 1,578 14.3Total Peas 2,325.0 2,250.0 1,698 1,733.7 1,700.0 1,685.0 2,184 1,671.1Desi Chickpeas n.a. n.a. n.a. n.a.Kabuli Chickpeas 160.0 155.0 1,779 125.1 65.0 63.0 1,643 46.9Total Chickpeas 180.0 175.0 1,781 141.3 105.0 103.0 1,610 75.2Hairless Canaryseed 110.0 105.0 951 45.3 105.0 105.0 1,029 49.0Regular Canaryseed 190.0 180.0 975 79.6 170.0 165.0 1,064 79.6Total Canaryseed 300.0 285.0 966 124.9 275.0 270.0 1,050 128.6Triticale 20.0 15.0 2,425 16.5 30.0 15.0 1,499 10.2Dry Beans 11.0 n.a. 9.0 n.a.Caraway 6.5 n.a. 8.1 n.a.Coriander 15.5 n.a. 16.0 n.a.Camelina 0.7 n.a. 0.7 n.a.Borage 4.2 n.a. 1.7 n.a.Hemp 19.0 n.a. 5.9 n.a.Fababeans 6.0 n.a. 15.0 n.a.Soybeans 68.0 n.a. 10.0 n.a.Fenugreek 1.0 n.a. 0.6 n.a.Buckwheat 4.0 n.a. 4.0 n.a.Total 5,630.9 5,340.0 3,506.4 4,906.0 4,688.0 3,443.3
Source: Statistics Canada and Saskatchewan Ministry of Agriculture
2012 Specialty Crop Report, Saskatchewan Ministry of Agriculture 3
0.0 0.5 1.0 1.5 2.0 2.5 3.0 3.5 4.0 4.5 5.0
91 93 95 97 99 01 03 05 07 09 11
mill
ion
tonn
es
0.0 1.0 2.0 3.0 4.0 5.0 6.0 7.0 8.0
91 93 95 97 99 01 03 05 07 09 11
mill
ion
acre
s
and grasshoppers. Bertha armyworm numbers were high in many areas of the province, particularly on the western side. There were many reports of crop dusters working overtime to get fields sprayed before damage worsened.
The province received a lot of rain during early-to-mid June and again in mid-July. Many areas reported more than two inches of rain each time and some areas reported four inches or more. The Tisdale region received 112 mm in a matter of hours on July 18, flattening many crops in the area. Producers in some northern regions reported that many fields and roads could not support equipment and there were many ruts left in fields that needed to be worked this fall.
According to Crop Report records, the Tisdale area received the largest amount of cumulative rainfall in the province from April 1 to mid-October at 636 mm. The Nipawin area came in second at 579 mm and the Battleford area third with 556 mm. The least amount of cumulative rainfall for the province was recorded
around the Gainsborough area (181 mm). The Bengough area recorded 187 mm, while the Radville area recorded 193 mm.
Hot and dry weather in fall allowed producers to harvest the 2012 crop in mostly good condition.
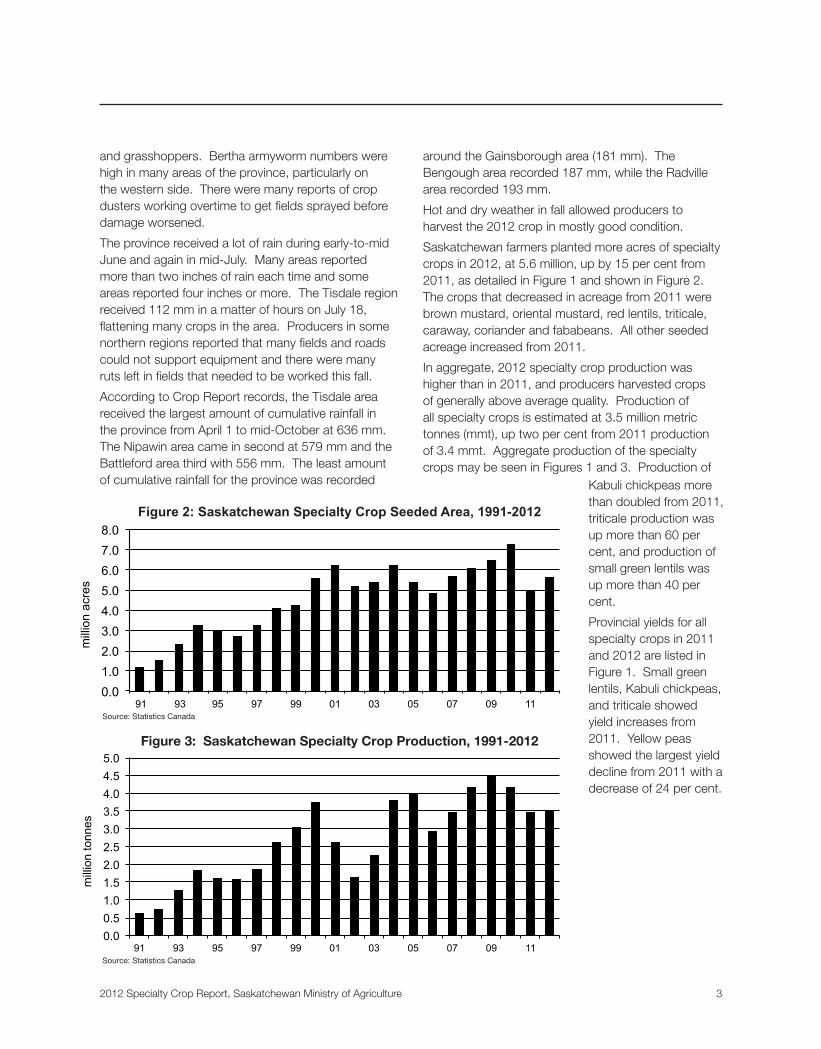
Saskatchewan farmers planted more acres of specialty crops in 2012, at 5.6 million, up by 15 per cent from 2011, as detailed in Figure 1 and shown in Figure 2. The crops that decreased in acreage from 2011 were brown mustard, oriental mustard, red lentils, triticale, caraway, coriander and fababeans. All other seeded acreage increased from 2011.
In aggregate, 2012 specialty crop production was higher than in 2011, and producers harvested crops of generally above average quality. Production of all specialty crops is estimated at 3.5 million metric tonnes (mmt), up two per cent from 2011 production of 3.4 mmt. Aggregate production of the specialty crops may be seen in Figures 1 and 3. Production of
Source: Statistics Canada
Source: Statistics Canada
Figure 3: Saskatchewan Specialty Crop Production, 1991-2012
Figure 2: Saskatchewan Specialty Crop Seeded Area, 1991-2012
Kabuli chickpeas more than doubled from 2011, triticale production was up more than 60 per cent, and production of small green lentils was up more than 40 per cent.
Provincial yields for all specialty crops in 2011 and 2012 are listed in Figure 1. Small green lentils, Kabuli chickpeas, and triticale showed yield increases from 2011. Yellow peas showed the largest yield decline from 2011 with a decrease of 24 per cent.
4 2012 Specialty Crop Report, Saskatchewan Ministry of Agriculture
For 2012, the estimated total pea production in Saskatchewan is 1.7 mmt, which is up four per cent from 2011 production. The change in pea production was a result of an increase in harvested acres by one third as yields were lower than in 2011. In 2012, the estimated seeded area for all peas was 2.3 million acres, up 37 per cent from a year earlier. The provincial pea yield in 2012 averaged 1,698 pounds per acre (28.3 bu.), down 22 per cent from the 2011 pea yield, and six per cent below the 10-year provincial average. In 2012, the pea crop is expected to grade 88 per cent in the top two grades, compared to a 10-year average of 83 per cent. A summary of the production and prices for all peas in the past ten years is shown in Figure 4.
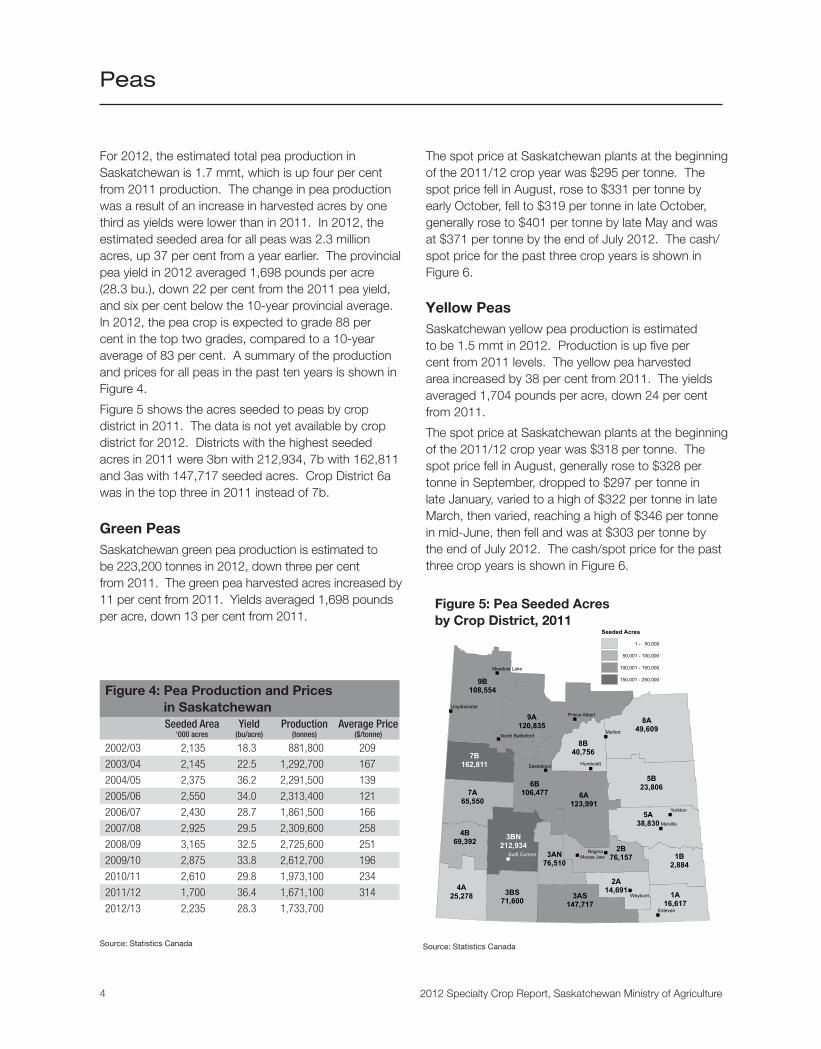
Figure 5 shows the acres seeded to peas by crop district in 2011. The data is not yet available by crop district for 2012. Districts with the highest seeded acres in 2011 were 3bn with 212,934, 7b with 162,811 and 3as with 147,717 seeded acres. Crop District 6a was in the top three in 2011 instead of 7b.
Green PeasSaskatchewan green pea production is estimated to be 223,200 tonnes in 2012, down three per cent from 2011. The green pea harvested acres increased by 11 per cent from 2011. Yields averaged 1,698 pounds per acre, down 13 per cent from 2011.
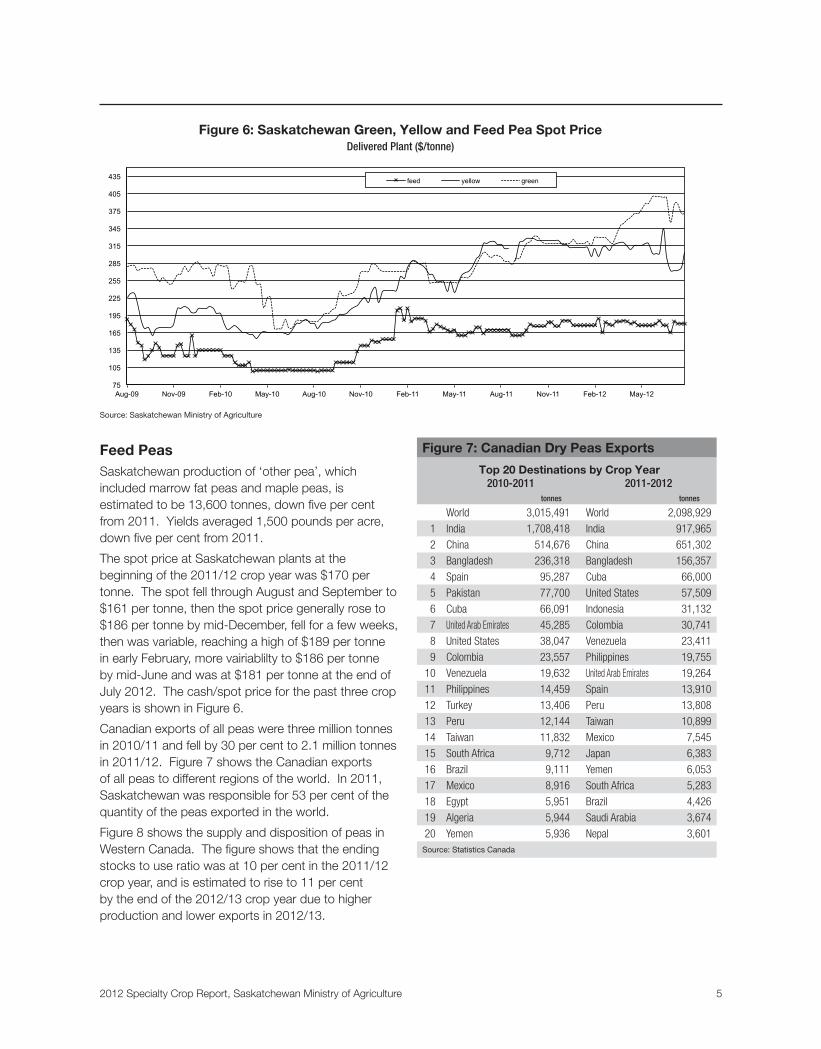
The spot price at Saskatchewan plants at the beginning of the 2011/12 crop year was $295 per tonne. The spot price fell in August, rose to $331 per tonne by early October, fell to $319 per tonne in late October, generally rose to $401 per tonne by late May and was at $371 per tonne by the end of July 2012. The cash/spot price for the past three crop years is shown in Figure 6.
Yellow PeasSaskatchewan yellow pea production is estimated to be 1.5 mmt in 2012. Production is up five per cent from 2011 levels. The yellow pea harvested area increased by 38 per cent from 2011. The yields averaged 1,704 pounds per acre, down 24 per cent from 2011.
The spot price at Saskatchewan plants at the beginning of the 2011/12 crop year was $318 per tonne. The spot price fell in August, generally rose to $328 per tonne in September, dropped to $297 per tonne in late January, varied to a high of $322 per tonne in late March, then varied, reaching a high of $346 per tonne in mid-June, then fell and was at $303 per tonne by the end of July 2012. The cash/spot price for the past three crop years is shown in Figure 6.
Source: Statistics Canada
Figure 4: Pea Production and Prices in SaskatchewanSeeded Area
‘000 acresYield
(bu/acre)Production
(tonnes)Average Price
($/tonne)
2002/03 2,135 18.3 881,800 209
2003/04 2,145 22.5 1,292,700 167
2004/05 2,375 36.2 2,291,500 139
2005/06 2,550 34.0 2,313,400 121
2006/07 2,430 28.7 1,861,500 166
2007/08 2,925 29.5 2,309,600 258
2008/09 3,165 32.5 2,725,600 251
2009/10 2,875 33.8 2,612,700 196
2010/11 2,610 29.8 1,973,100 234
2011/12 1,700 36.4 1,671,100 314
2012/13 2,235 28.3 1,733,700
"
"
"
"
"
"
"
"
""
"
"
"
"
Regina
Estevan
Saskatoon
Yorkton
Prince Albert
Swift Current
Humboldt
Meadow Lake
MelfortNorth Battleford
Weyburn
Lloydminster
Moose Jaw
Melville
1A16,617
1B2,884
2A14,691
2B76,1573AN
76,510
3AS147,717
3BN212,934
3BS71,600
4A25,278
4B69,392
5A38,830
5B23,806
6A123,991
6B106,4777A
65,550
7B162,811
8A49,609
8B40,756
9A120,835
9B108,554
Seeded Acres
1 - 50,000
50,001 - 100,000
100,001 - 150,000
150,001 - 250,000
Figure 5: Pea Seeded Acres by Crop District, 2011
Source: Statistics Canada
Peas
2012 Specialty Crop Report, Saskatchewan Ministry of Agriculture 5
75
105
135
165
195
225
255
285
315
345
375
405
435
Aug-09 Nov-09 Feb-10 May-10 Aug-10 Nov-10 Feb-11 May-11 Aug-11 Nov-11 Feb-12 May-12
feed yellow green
Feed PeasSaskatchewan production of ‘other pea’, which included marrow fat peas and maple peas, is estimated to be 13,600 tonnes, down five per cent from 2011. Yields averaged 1,500 pounds per acre, down five per cent from 2011.
The spot price at Saskatchewan plants at the beginning of the 2011/12 crop year was $170 per tonne. The spot fell through August and September to $161 per tonne, then the spot price generally rose to $186 per tonne by mid-December, fell for a few weeks, then was variable, reaching a high of $189 per tonne in early February, more vairiablilty to $186 per tonne by mid-June and was at $181 per tonne at the end of July 2012. The cash/spot price for the past three crop years is shown in Figure 6.
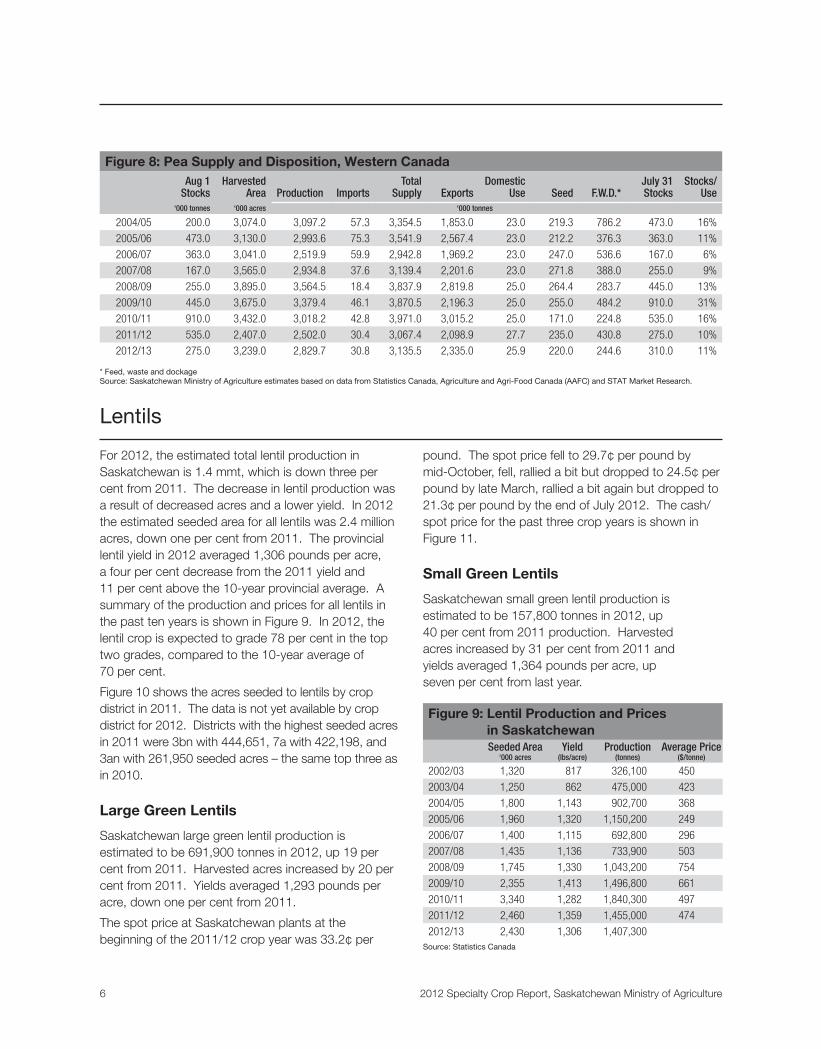
Canadian exports of all peas were three million tonnes in 2010/11 and fell by 30 per cent to 2.1 million tonnes in 2011/12. Figure 7 shows the Canadian exports of all peas to different regions of the world. In 2011, Saskatchewan was responsible for 53 per cent of the quantity of the peas exported in the world.
Figure 8 shows the supply and disposition of peas in Western Canada. The figure shows that the ending stocks to use ratio was at 10 per cent in the 2011/12 crop year, and is estimated to rise to 11 per cent by the end of the 2012/13 crop year due to higher production and lower exports in 2012/13.
Figure 7: Canadian Dry Peas Exports
Top 20 Destinations by Crop Year2010-2011 2011-2012
tonnes tonnes
World 3,015,491 World 2,098,929
1 India 1,708,418 India 917,965
2 China 514,676 China 651,302
3 Bangladesh 236,318 Bangladesh 156,357
4 Spain 95,287 Cuba 66,000
5 Pakistan 77,700 United States 57,509
6 Cuba 66,091 Indonesia 31,132
7 United Arab Emirates 45,285 Colombia 30,741
8 United States 38,047 Venezuela 23,411
9 Colombia 23,557 Philippines 19,755
10 Venezuela 19,632 United Arab Emirates 19,264
11 Philippines 14,459 Spain 13,910
12 Turkey 13,406 Peru 13,808
13 Peru 12,144 Taiwan 10,899
14 Taiwan 11,832 Mexico 7,545
15 South Africa 9,712 Japan 6,383
16 Brazil 9,111 Yemen 6,053
17 Mexico 8,916 South Africa 5,283
18 Egypt 5,951 Brazil 4,426
19 Algeria 5,944 Saudi Arabia 3,674
20 Yemen 5,936 Nepal 3,601Source: Statistics Canada
Figure 6: Saskatchewan Green, Yellow and Feed Pea Spot PriceDelivered Plant ($/tonne)
Source: Saskatchewan Ministry of Agriculture
6 2012 Specialty Crop Report, Saskatchewan Ministry of Agriculture
For 2012, the estimated total lentil production in Saskatchewan is 1.4 mmt, which is down three per cent from 2011. The decrease in lentil production was a result of decreased acres and a lower yield. In 2012 the estimated seeded area for all lentils was 2.4 million acres, down one per cent from 2011. The provincial lentil yield in 2012 averaged 1,306 pounds per acre, a four per cent decrease from the 2011 yield and 11 per cent above the 10-year provincial average. A summary of the production and prices for all lentils in the past ten years is shown in Figure 9. In 2012, the lentil crop is expected to grade 78 per cent in the top two grades, compared to the 10-year average of 70 per cent.
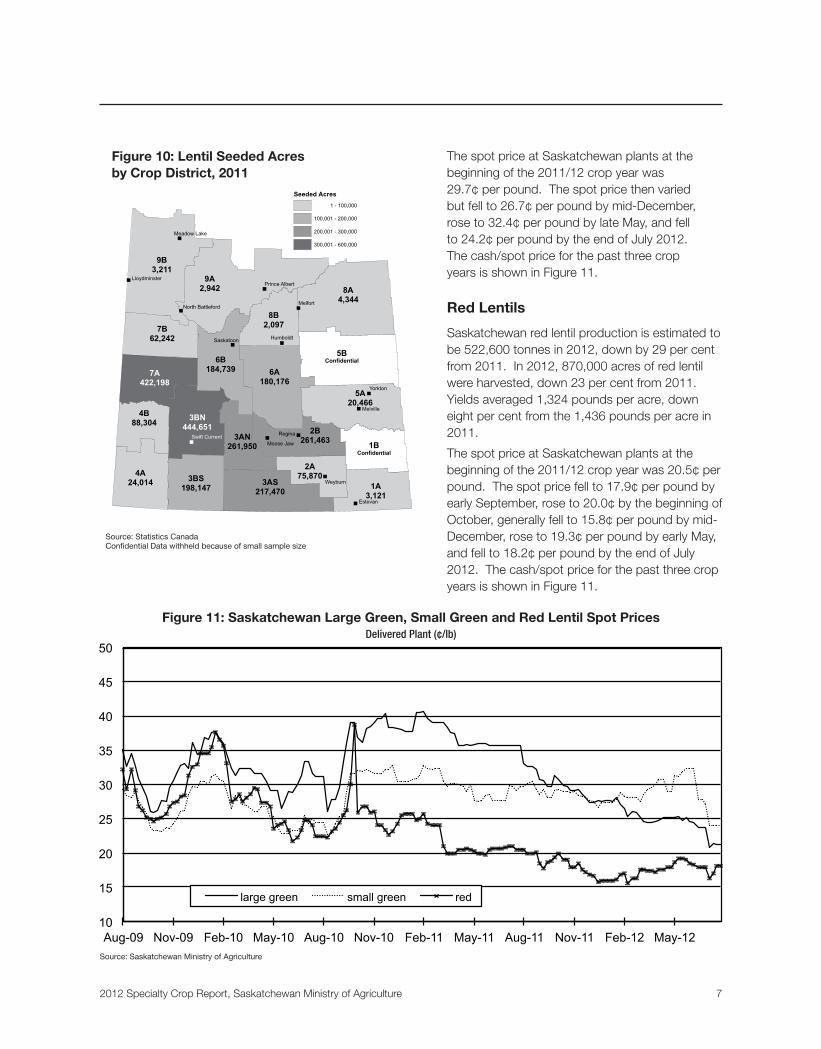
Figure 10 shows the acres seeded to lentils by crop district in 2011. The data is not yet available by crop district for 2012. Districts with the highest seeded acres in 2011 were 3bn with 444,651, 7a with 422,198, and 3an with 261,950 seeded acres – the same top three as in 2010.
Large Green Lentils
Saskatchewan large green lentil production is estimated to be 691,900 tonnes in 2012, up 19 per cent from 2011. Harvested acres increased by 20 per cent from 2011. Yields averaged 1,293 pounds per acre, down one per cent from 2011.
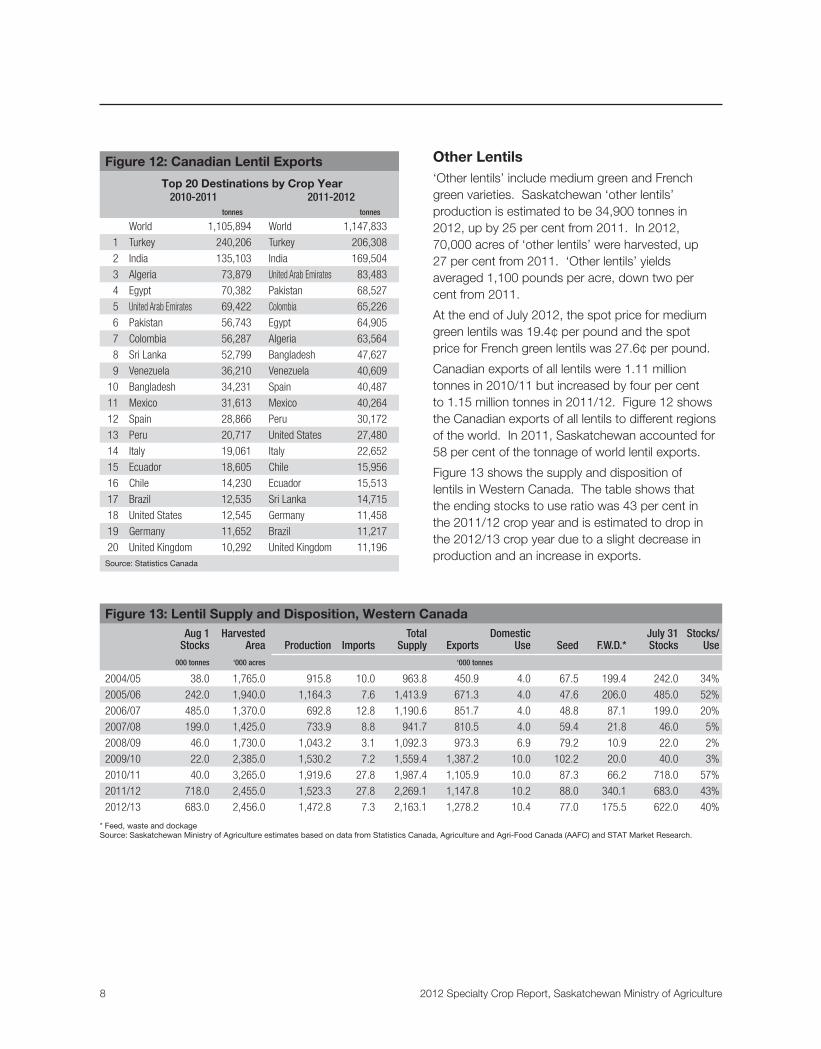
The spot price at Saskatchewan plants at the beginning of the 2011/12 crop year was 33.2¢ per
pound. The spot price fell to 29.7¢ per pound by mid-October, fell, rallied a bit but dropped to 24.5¢ per pound by late March, rallied a bit again but dropped to 21.3¢ per pound by the end of July 2012. The cash/spot price for the past three crop years is shown in Figure 11.
Small Green Lentils
Saskatchewan small green lentil production is estimated to be 157,800 tonnes in 2012, up 40 per cent from 2011 production. Harvested acres increased by 31 per cent from 2011 and yields averaged 1,364 pounds per acre, up seven per cent from last year.
Figure 8: Pea Supply and Disposition, Western CanadaAug 1
StocksHarvested
Area Production ImportsTotal
Supply ExportsDomestic
Use Seed F.W.D.*July 31Stocks
Stocks/Use
‘000 tonnes ‘000 acres ‘000 tonnes
2004/05 200.0 3,074.0 3,097.2 57.3 3,354.5 1,853.0 23.0 219.3 786.2 473.0 16%
2005/06 473.0 3,130.0 2,993.6 75.3 3,541.9 2,567.4 23.0 212.2 376.3 363.0 11%
2006/07 363.0 3,041.0 2,519.9 59.9 2,942.8 1,969.2 23.0 247.0 536.6 167.0 6%
2007/08 167.0 3,565.0 2,934.8 37.6 3,139.4 2,201.6 23.0 271.8 388.0 255.0 9%
2008/09 255.0 3,895.0 3,564.5 18.4 3,837.9 2,819.8 25.0 264.4 283.7 445.0 13%
2009/10 445.0 3,675.0 3,379.4 46.1 3,870.5 2,196.3 25.0 255.0 484.2 910.0 31%
2010/11 910.0 3,432.0 3,018.2 42.8 3,971.0 3,015.2 25.0 171.0 224.8 535.0 16%
2011/12 535.0 2,407.0 2,502.0 30.4 3,067.4 2,098.9 27.7 235.0 430.8 275.0 10%
2012/13 275.0 3,239.0 2,829.7 30.8 3,135.5 2,335.0 25.9 220.0 244.6 310.0 11%
* Feed, waste and dockageSource: Saskatchewan Ministry of Agriculture estimates based on data from Statistics Canada, Agriculture and Agri-Food Canada (AAFC) and STAT Market Research.
Source: Statistics Canada
Figure 9: Lentil Production and Prices in SaskatchewanSeeded Area
‘000 acresYield
(lbs/acre)Production
(tonnes)Average Price
($/tonne)
2002/03 1,320 817 326,100 450
2003/04 1,250 862 475,000 423
2004/05 1,800 1,143 902,700 368
2005/06 1,960 1,320 1,150,200 249
2006/07 1,400 1,115 692,800 296
2007/08 1,435 1,136 733,900 503
2008/09 1,745 1,330 1,043,200 754
2009/10 2,355 1,413 1,496,800 661
2010/11 3,340 1,282 1,840,300 497
2011/12 2,460 1,359 1,455,000 474
2012/13 2,430 1,306 1,407,300
Lentils
2012 Specialty Crop Report, Saskatchewan Ministry of Agriculture 7
10
15
20
25
30
35
40
45
50
Aug-09 Nov-09 Feb-10 May-10 Aug-10 Nov-10 Feb-11 May-11 Aug-11 Nov-11 Feb-12 May-12
large green small green red
The spot price at Saskatchewan plants at the beginning of the 2011/12 crop year was 29.7¢ per pound. The spot price then varied but fell to 26.7¢ per pound by mid-December, rose to 32.4¢ per pound by late May, and fell to 24.2¢ per pound by the end of July 2012. The cash/spot price for the past three crop years is shown in Figure 11.
Red Lentils
Saskatchewan red lentil production is estimated to be 522,600 tonnes in 2012, down by 29 per cent from 2011. In 2012, 870,000 acres of red lentil were harvested, down 23 per cent from 2011. Yields averaged 1,324 pounds per acre, down eight per cent from the 1,436 pounds per acre in 2011.
The spot price at Saskatchewan plants at the beginning of the 2011/12 crop year was 20.5¢ per pound. The spot price fell to 17.9¢ per pound by early September, rose to 20.0¢ by the beginning of October, generally fell to 15.8¢ per pound by mid- December, rose to 19.3¢ per pound by early May, and fell to 18.2¢ per pound by the end of July 2012. The cash/spot price for the past three crop years is shown in Figure 11.
"
"
"
"
"
"
"
"
""
"
"
"
"
Regina
Estevan
Saskatoon
Yorkton
Prince Albert
Swift Current
Humboldt
Meadow Lake
MelfortNorth Battleford
Weyburn
Lloydminster
Moose Jaw
Melville
1A3,121
1BConfidential
2A75,870
2B261,4633AN
261,950
3AS217,470
3BN444,651
3BS198,147
4A24,014
4B88,304
5A20,466
5BConfidential
6A180,176
6B184,7397A
422,198
7B62,242
8A4,344
8B2,097
9A2,942
9B3,211
Seeded Acres 1 - 100,000
100,001 - 200,000
200,001 - 300,000
300,001 - 600,000
Figure 10: Lentil Seeded Acres by Crop District, 2011
Source: Statistics CanadaConfidential Data withheld because of small sample size
Figure 11: Saskatchewan Large Green, Small Green and Red Lentil Spot PricesDelivered Plant (¢/lb)
Source: Saskatchewan Ministry of Agriculture
8 2012 Specialty Crop Report, Saskatchewan Ministry of Agriculture
Other Lentils‘Other lentils’ include medium green and French green varieties. Saskatchewan ‘other lentils’ production is estimated to be 34,900 tonnes in 2012, up by 25 per cent from 2011. In 2012, 70,000 acres of ‘other lentils’ were harvested, up 27 per cent from 2011. ‘Other lentils’ yields averaged 1,100 pounds per acre, down two per cent from 2011.
At the end of July 2012, the spot price for medium green lentils was 19.4¢ per pound and the spot price for French green lentils was 27.6¢ per pound.
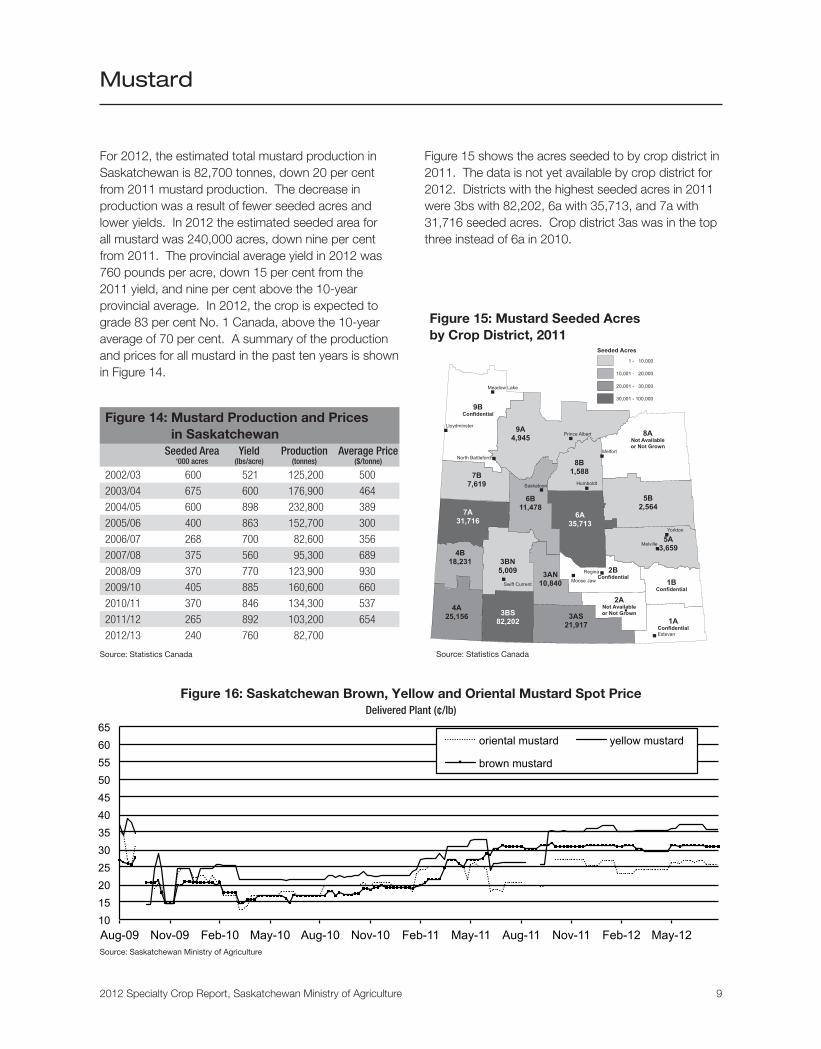
Canadian exports of all lentils were 1.11 million tonnes in 2010/11 but increased by four per cent to 1.15 million tonnes in 2011/12. Figure 12 shows the Canadian exports of all lentils to different regions of the world. In 2011, Saskatchewan accounted for 58 per cent of the tonnage of world lentil exports.
Figure 13 shows the supply and disposition of lentils in Western Canada. The table shows that the ending stocks to use ratio was 43 per cent in the 2011/12 crop year and is estimated to drop in the 2012/13 crop year due to a slight decrease in production and an increase in exports.
Figure 12: Canadian Lentil Exports
Top 20 Destinations by Crop Year2010-2011 2011-2012
tonnes tonnes
World 1,105,894 World 1,147,833
1 Turkey 240,206 Turkey 206,308
2 India 135,103 India 169,504
3 Algeria 73,879 United Arab Emirates 83,483
4 Egypt 70,382 Pakistan 68,527
5 United Arab Emirates 69,422 Colombia 65,226
6 Pakistan 56,743 Egypt 64,905
7 Colombia 56,287 Algeria 63,564
8 Sri Lanka 52,799 Bangladesh 47,627
9 Venezuela 36,210 Venezuela 40,609
10 Bangladesh 34,231 Spain 40,487
11 Mexico 31,613 Mexico 40,264
12 Spain 28,866 Peru 30,172
13 Peru 20,717 United States 27,480
14 Italy 19,061 Italy 22,652
15 Ecuador 18,605 Chile 15,956
16 Chile 14,230 Ecuador 15,513
17 Brazil 12,535 Sri Lanka 14,715
18 United States 12,545 Germany 11,458
19 Germany 11,652 Brazil 11,217
20 United Kingdom 10,292 United Kingdom 11,196Source: Statistics Canada
Figure 13: Lentil Supply and Disposition, Western CanadaAug 1
StocksHarvested
Area Production ImportsTotal
Supply ExportsDomestic
Use Seed F.W.D.*July 31Stocks
Stocks/Use
000 tonnes ‘000 acres ‘000 tonnes
2004/05 38.0 1,765.0 915.8 10.0 963.8 450.9 4.0 67.5 199.4 242.0 34%
2005/06 242.0 1,940.0 1,164.3 7.6 1,413.9 671.3 4.0 47.6 206.0 485.0 52%
2006/07 485.0 1,370.0 692.8 12.8 1,190.6 851.7 4.0 48.8 87.1 199.0 20%
2007/08 199.0 1,425.0 733.9 8.8 941.7 810.5 4.0 59.4 21.8 46.0 5%
2008/09 46.0 1,730.0 1,043.2 3.1 1,092.3 973.3 6.9 79.2 10.9 22.0 2%
2009/10 22.0 2,385.0 1,530.2 7.2 1,559.4 1,387.2 10.0 102.2 20.0 40.0 3%
2010/11 40.0 3,265.0 1,919.6 27.8 1,987.4 1,105.9 10.0 87.3 66.2 718.0 57%
2011/12 718.0 2,455.0 1,523.3 27.8 2,269.1 1,147.8 10.2 88.0 340.1 683.0 43%
2012/13 683.0 2,456.0 1,472.8 7.3 2,163.1 1,278.2 10.4 77.0 175.5 622.0 40%
* Feed, waste and dockageSource: Saskatchewan Ministry of Agriculture estimates based on data from Statistics Canada, Agriculture and Agri-Food Canada (AAFC) and STAT Market Research.
2012 Specialty Crop Report, Saskatchewan Ministry of Agriculture 9
For 2012, the estimated total mustard production in Saskatchewan is 82,700 tonnes, down 20 per cent from 2011 mustard production. The decrease in production was a result of fewer seeded acres and lower yields. In 2012 the estimated seeded area for all mustard was 240,000 acres, down nine per cent from 2011. The provincial average yield in 2012 was 760 pounds per acre, down 15 per cent from the 2011 yield, and nine per cent above the 10-year provincial average. In 2012, the crop is expected to grade 83 per cent No. 1 Canada, above the 10-year average of 70 per cent. A summary of the production and prices for all mustard in the past ten years is shown in Figure 14.
Figure 15 shows the acres seeded to by crop district in 2011. The data is not yet available by crop district for 2012. Districts with the highest seeded acres in 2011 were 3bs with 82,202, 6a with 35,713, and 7a with 31,716 seeded acres. Crop district 3as was in the top three instead of 6a in 2010.
Figure 14: Mustard Production and Prices in Saskatchewan
Seeded Area‘000 acres
Yield(lbs/acre)
Production(tonnes)
Average Price($/tonne)
2002/03 600 521 125,200 500
2003/04 675 600 176,900 464
2004/05 600 898 232,800 389
2005/06 400 863 152,700 300
2006/07 268 700 82,600 356
2007/08 375 560 95,300 689
2008/09 370 770 123,900 930
2009/10 405 885 160,600 660
2010/11 370 846 134,300 537
2011/12 265 892 103,200 654
2012/13 240 760 82,700
Source: Statistics Canada
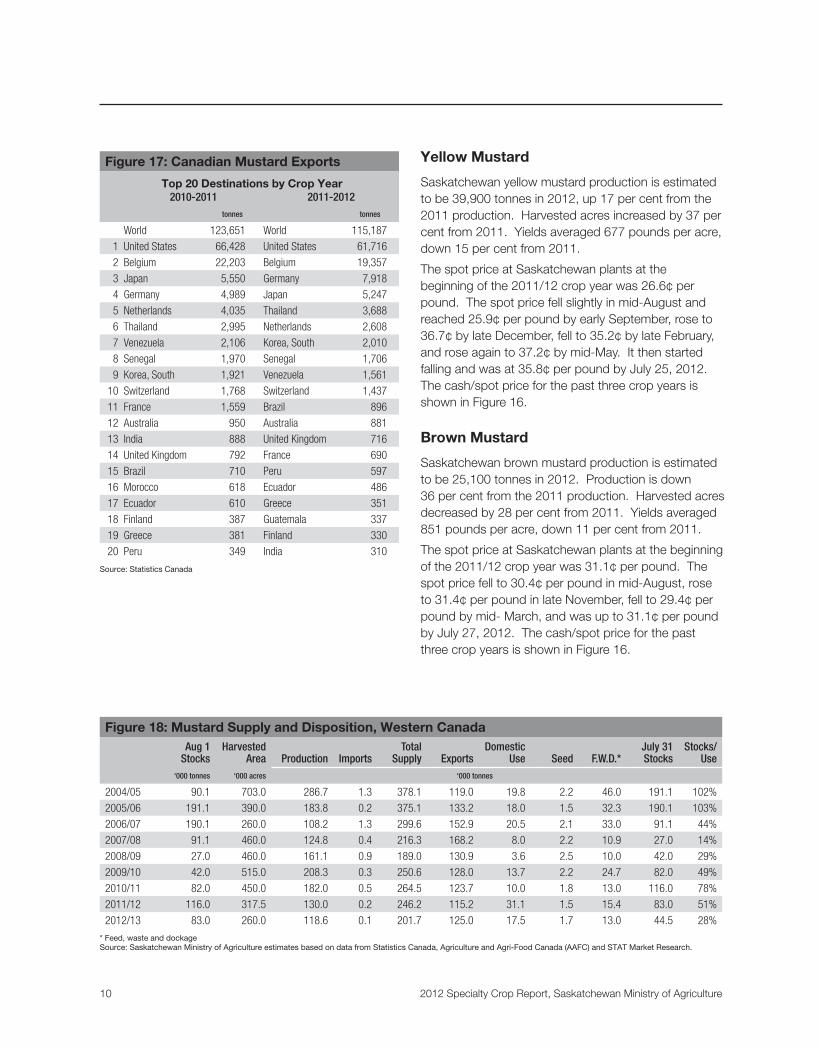
Figure 16: Saskatchewan Brown, Yellow and Oriental Mustard Spot PriceDelivered Plant (¢/lb)
"
"
"
"
"
"
"
"
""
"
"
"
"
Regina
Estevan
Saskatoon
Yorkton
Prince Albert
Swift Current
Humboldt
Meadow Lake
MelfortNorth Battleford
Lloydminster
Moose Jaw
Melville
1AConfidential
1BConfidential
2ANot Availableor Not Grown
2BConfidential3AN
10,840
3AS21,917
3BN5,009
3BS82,202
4A25,156
4B18,231
5A3,659
5B2,564
6A35,713
6B11,4787A
31,716
7B7,619
8ANot Availableor Not Grown
8B1,588
9A4,945
9BConfidential
Seeded Acres
1 - 10,000
10,001 - 20,000
20,001 - 30,000
30,001 - 100,000
Figure 15: Mustard Seeded Acres by Crop District, 2011
Source: Statistics Canada
Mustard
Source: Saskatchewan Ministry of Agriculture
10 15 20 25 30 35 40 45 50 55 60 65
Aug-09 Nov-09 Feb-10 May-10 Aug-10 Nov-10 Feb-11 May-11 Aug-11 Nov-11 Feb-12 May-12
oriental mustard yellow mustard
brown mustard
10 2012 Specialty Crop Report, Saskatchewan Ministry of Agriculture
Yellow Mustard
Saskatchewan yellow mustard production is estimated to be 39,900 tonnes in 2012, up 17 per cent from the 2011 production. Harvested acres increased by 37 per cent from 2011. Yields averaged 677 pounds per acre, down 15 per cent from 2011.
The spot price at Saskatchewan plants at the beginning of the 2011/12 crop year was 26.6¢ per pound. The spot price fell slightly in mid-August and reached 25.9¢ per pound by early September, rose to 36.7¢ by late December, fell to 35.2¢ by late February, and rose again to 37.2¢ by mid-May. It then started falling and was at 35.8¢ per pound by July 25, 2012. The cash/spot price for the past three crop years is shown in Figure 16.
Brown Mustard
Saskatchewan brown mustard production is estimated to be 25,100 tonnes in 2012. Production is down 36 per cent from the 2011 production. Harvested acres decreased by 28 per cent from 2011. Yields averaged 851 pounds per acre, down 11 per cent from 2011.
The spot price at Saskatchewan plants at the beginning of the 2011/12 crop year was 31.1¢ per pound. The spot price fell to 30.4¢ per pound in mid-August, rose to 31.4¢ per pound in late November, fell to 29.4¢ per pound by mid- March, and was up to 31.1¢ per pound by July 27, 2012. The cash/spot price for the past three crop years is shown in Figure 16.
Figure 18: Mustard Supply and Disposition, Western CanadaAug 1
StocksHarvested
Area Production ImportsTotal
Supply ExportsDomestic
Use Seed F.W.D.*July 31Stocks
Stocks/Use
‘000 tonnes ‘000 acres ‘000 tonnes
2004/05 90.1 703.0 286.7 1.3 378.1 119.0 19.8 2.2 46.0 191.1 102%
2005/06 191.1 390.0 183.8 0.2 375.1 133.2 18.0 1.5 32.3 190.1 103%
2006/07 190.1 260.0 108.2 1.3 299.6 152.9 20.5 2.1 33.0 91.1 44%
2007/08 91.1 460.0 124.8 0.4 216.3 168.2 8.0 2.2 10.9 27.0 14%
2008/09 27.0 460.0 161.1 0.9 189.0 130.9 3.6 2.5 10.0 42.0 29%
2009/10 42.0 515.0 208.3 0.3 250.6 128.0 13.7 2.2 24.7 82.0 49%
2010/11 82.0 450.0 182.0 0.5 264.5 123.7 10.0 1.8 13.0 116.0 78%
2011/12 116.0 317.5 130.0 0.2 246.2 115.2 31.1 1.5 15.4 83.0 51%
2012/13 83.0 260.0 118.6 0.1 201.7 125.0 17.5 1.7 13.0 44.5 28%
* Feed, waste and dockageSource: Saskatchewan Ministry of Agriculture estimates based on data from Statistics Canada, Agriculture and Agri-Food Canada (AAFC) and STAT Market Research.
Figure 17: Canadian Mustard Exports
Top 20 Destinations by Crop Year2010-2011 2011-2012
tonnes tonnes
World 123,651 World 115,187
1 United States 66,428 United States 61,716
2 Belgium 22,203 Belgium 19,357
3 Japan 5,550 Germany 7,918
4 Germany 4,989 Japan 5,247
5 Netherlands 4,035 Thailand 3,688
6 Thailand 2,995 Netherlands 2,608
7 Venezuela 2,106 Korea, South 2,010
8 Senegal 1,970 Senegal 1,706
9 Korea, South 1,921 Venezuela 1,561
10 Switzerland 1,768 Switzerland 1,437
11 France 1,559 Brazil 896
12 Australia 950 Australia 881
13 India 888 United Kingdom 716
14 United Kingdom 792 France 690
15 Brazil 710 Peru 597
16 Morocco 618 Ecuador 486
17 Ecuador 610 Greece 351
18 Finland 387 Guatemala 337
19 Greece 381 Finland 330
20 Peru 349 India 310
Source: Statistics Canada
2012 Specialty Crop Report, Saskatchewan Ministry of Agriculture 11
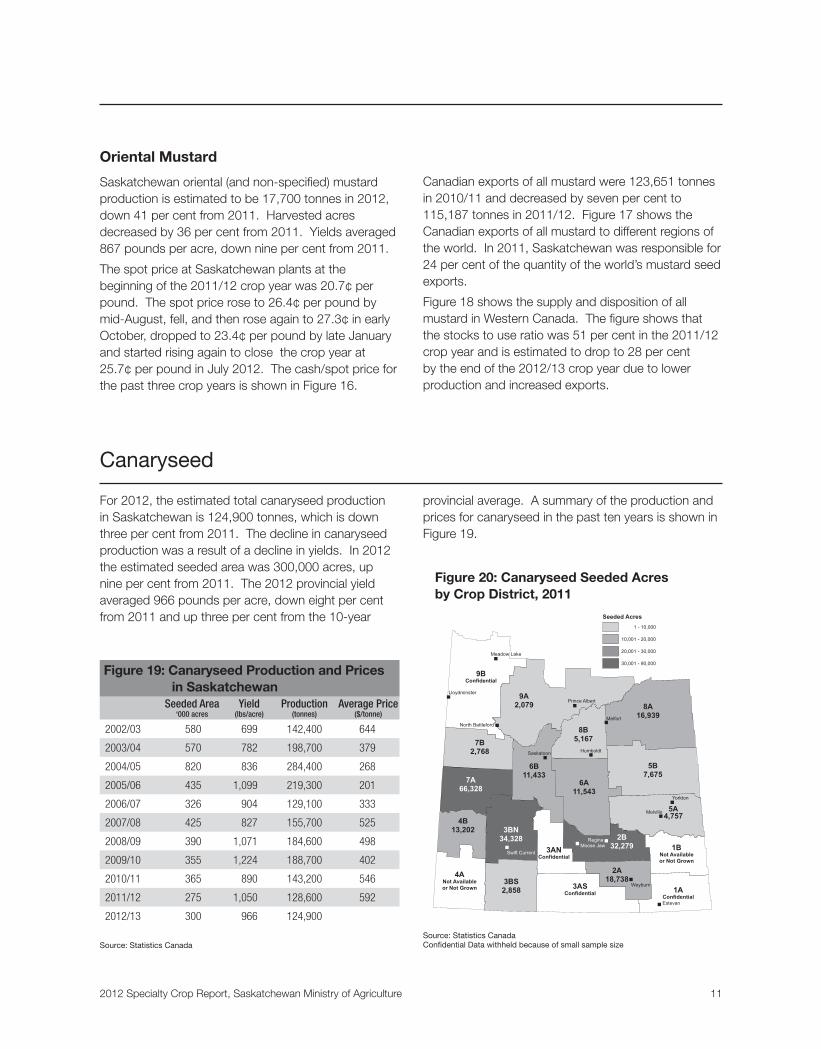
For 2012, the estimated total canaryseed production in Saskatchewan is 124,900 tonnes, which is down three per cent from 2011. The decline in canaryseed production was a result of a decline in yields. In 2012 the estimated seeded area was 300,000 acres, up nine per cent from 2011. The 2012 provincial yield averaged 966 pounds per acre, down eight per cent from 2011 and up three per cent from the 10-year
provincial average. A summary of the production and prices for canaryseed in the past ten years is shown in Figure 19.
Oriental Mustard
Saskatchewan oriental (and non-specified) mustard production is estimated to be 17,700 tonnes in 2012, down 41 per cent from 2011. Harvested acres decreased by 36 per cent from 2011. Yields averaged 867 pounds per acre, down nine per cent from 2011.
The spot price at Saskatchewan plants at the beginning of the 2011/12 crop year was 20.7¢ per pound. The spot price rose to 26.4¢ per pound by mid-August, fell, and then rose again to 27.3¢ in early October, dropped to 23.4¢ per pound by late January and started rising again to close the crop year at 25.7¢ per pound in July 2012. The cash/spot price for the past three crop years is shown in Figure 16.
Canadian exports of all mustard were 123,651 tonnes in 2010/11 and decreased by seven per cent to 115,187 tonnes in 2011/12. Figure 17 shows the Canadian exports of all mustard to different regions of the world. In 2011, Saskatchewan was responsible for 24 per cent of the quantity of the world’s mustard seed exports.
Figure 18 shows the supply and disposition of all mustard in Western Canada. The figure shows that the stocks to use ratio was 51 per cent in the 2011/12 crop year and is estimated to drop to 28 per cent by the end of the 2012/13 crop year due to lower production and increased exports.
Figure 19: Canaryseed Production and Prices in Saskatchewan
Seeded Area‘000 acres
Yield(lbs/acre)
Production(tonnes)
Average Price($/tonne)
2002/03 580 699 142,400 644
2003/04 570 782 198,700 379
2004/05 820 836 284,400 268
2005/06 435 1,099 219,300 201
2006/07 326 904 129,100 333
2007/08 425 827 155,700 525
2008/09 390 1,071 184,600 498
2009/10 355 1,224 188,700 402
2010/11 365 890 143,200 546
2011/12 275 1,050 128,600 592
2012/13 300 966 124,900
Source: Statistics Canada
"
"
"
"
"
"
"
"
""
"
"
"
"
Regina
Estevan
Saskatoon
Yorkton
Prince Albert
Swift Current
Humboldt
Meadow Lake
MelfortNorth Battleford
Weyburn
Lloydminster
Moose Jaw
Melville
1AConfidential
1BNot Availableor Not Grown
2A18,738
2B32,2793AN
Confidential
3ASConfidential
3BN34,328
3BS2,858
4ANot Availableor Not Grown
4B13,202
5A4,757
5B7,675
6A11,543
6B11,4337A
66,328
7B2,768
8A16,939
8B5,167
9A2,079
9BConfidential
Seeded Acres 1 - 10,000
10,001 - 20,000
20,001 - 30,000
30,001 - 90,000
Figure 20: Canaryseed Seeded Acres by Crop District, 2011
Canaryseed
Source: Statistics CanadaConfidential Data withheld because of small sample size
12 2012 Specialty Crop Report, Saskatchewan Ministry of Agriculture
Figure 20 shows the acres seeded to canaryseed by crop district in 2011. The data is not yet available by crop district for 2012. Districts with the highest seeded acres in 2011 were 7a with 66,328, 3bn with 34,328 and 2b with 32,279 seeded acres. Last year crop district 2a had more acres planted to canaryseed than 3bn did.
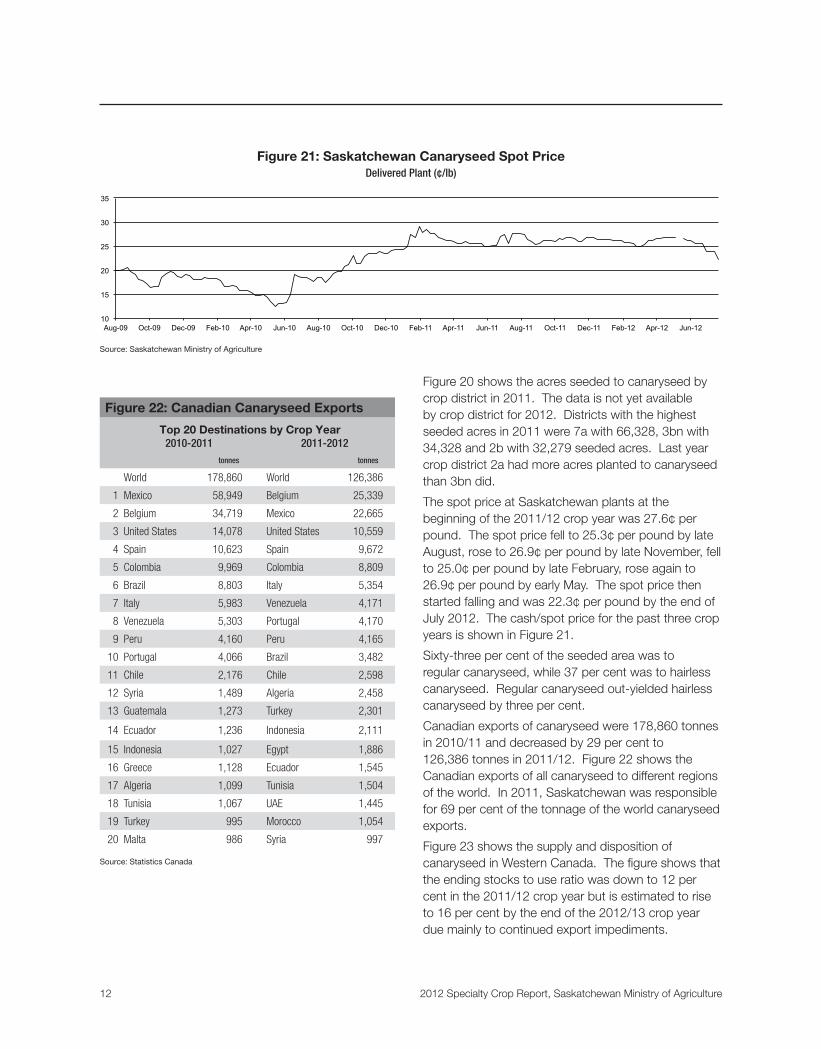
The spot price at Saskatchewan plants at the beginning of the 2011/12 crop year was 27.6¢ per pound. The spot price fell to 25.3¢ per pound by late August, rose to 26.9¢ per pound by late November, fell to 25.0¢ per pound by late February, rose again to 26.9¢ per pound by early May. The spot price then started falling and was 22.3¢ per pound by the end of July 2012. The cash/spot price for the past three crop years is shown in Figure 21.
Sixty-three per cent of the seeded area was to regular canaryseed, while 37 per cent was to hairless canaryseed. Regular canaryseed out-yielded hairless canaryseed by three per cent.
Canadian exports of canaryseed were 178,860 tonnes in 2010/11 and decreased by 29 per cent to 126,386 tonnes in 2011/12. Figure 22 shows the Canadian exports of all canaryseed to different regions of the world. In 2011, Saskatchewan was responsible for 69 per cent of the tonnage of the world canaryseed exports.
Figure 23 shows the supply and disposition of canaryseed in Western Canada. The figure shows that the ending stocks to use ratio was down to 12 per cent in the 2011/12 crop year but is estimated to rise to 16 per cent by the end of the 2012/13 crop year due mainly to continued export impediments.
Figure 22: Canadian Canaryseed Exports
Top 20 Destinations by Crop Year2010-2011 2011-2012
tonnes tonnes
World 178,860 World 126,386
1 Mexico 58,949 Belgium 25,339
2 Belgium 34,719 Mexico 22,665
3 United States 14,078 United States 10,559
4 Spain 10,623 Spain 9,672
5 Colombia 9,969 Colombia 8,809
6 Brazil 8,803 Italy 5,354
7 Italy 5,983 Venezuela 4,171
8 Venezuela 5,303 Portugal 4,170
9 Peru 4,160 Peru 4,165
10 Portugal 4,066 Brazil 3,482
11 Chile 2,176 Chile 2,598
12 Syria 1,489 Algeria 2,458
13 Guatemala 1,273 Turkey 2,301
14 Ecuador 1,236 Indonesia 2,111
15 Indonesia 1,027 Egypt 1,886
16 Greece 1,128 Ecuador 1,545
17 Algeria 1,099 Tunisia 1,504
18 Tunisia 1,067 UAE 1,445
19 Turkey 995 Morocco 1,054
20 Malta 986 Syria 997
Source: Statistics Canada
Figure 21: Saskatchewan Canaryseed Spot PriceDelivered Plant (¢/lb)
Source: Saskatchewan Ministry of Agriculture
10
15
20
25
30
35
Aug-09 Oct-09 Dec-09 Feb-10 Apr-10 Jun-10 Aug-10 Oct-10 Dec-10 Feb-11 Apr-11 Jun-11 Aug-11 Oct-11 Dec-11 Feb-12 Apr-12 Jun-12
2012 Specialty Crop Report, Saskatchewan Ministry of Agriculture 13
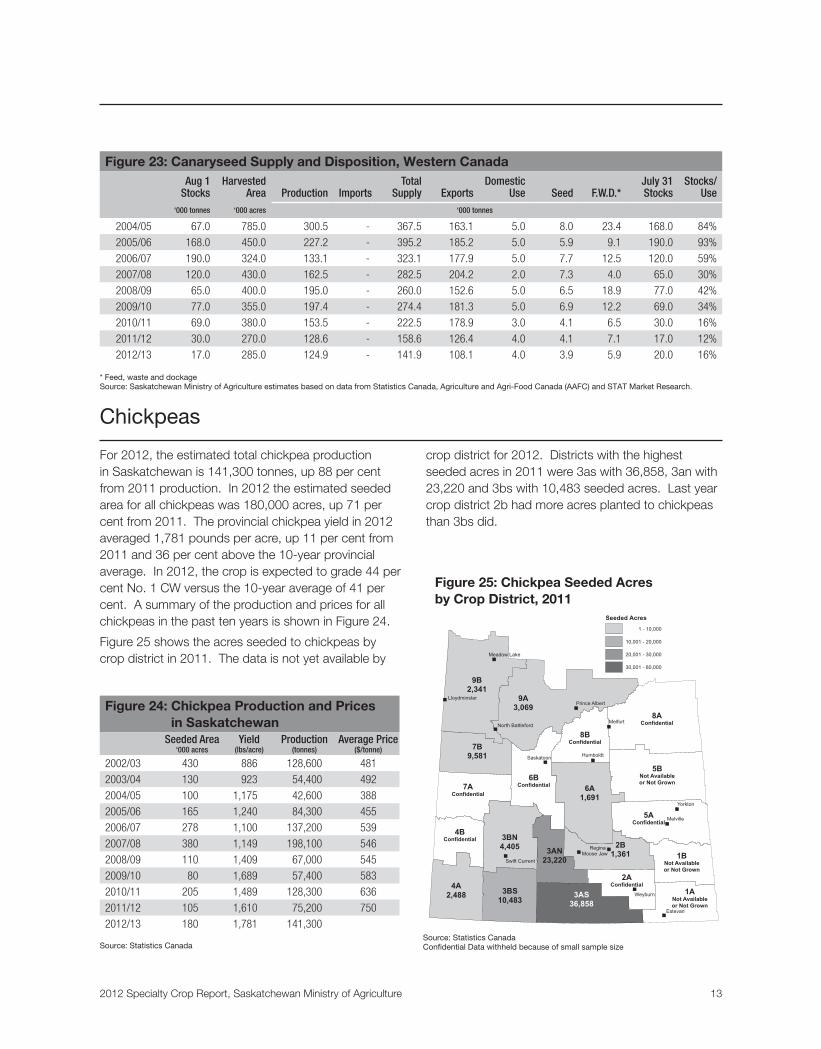
For 2012, the estimated total chickpea production in Saskatchewan is 141,300 tonnes, up 88 per cent from 2011 production. In 2012 the estimated seeded area for all chickpeas was 180,000 acres, up 71 per cent from 2011. The provincial chickpea yield in 2012 averaged 1,781 pounds per acre, up 11 per cent from 2011 and 36 per cent above the 10-year provincial average. In 2012, the crop is expected to grade 44 per cent No. 1 CW versus the 10-year average of 41 per cent. A summary of the production and prices for all chickpeas in the past ten years is shown in Figure 24.
Figure 25 shows the acres seeded to chickpeas by crop district in 2011. The data is not yet available by
crop district for 2012. Districts with the highest seeded acres in 2011 were 3as with 36,858, 3an with 23,220 and 3bs with 10,483 seeded acres. Last year crop district 2b had more acres planted to chickpeas than 3bs did.
Chickpeas
Figure 23: Canaryseed Supply and Disposition, Western CanadaAug 1
StocksHarvested
Area Production ImportsTotal
Supply ExportsDomestic
Use Seed F.W.D.*July 31Stocks
Stocks/Use
‘000 tonnes ‘000 acres ‘000 tonnes
2004/05 67.0 785.0 300.5 - 367.5 163.1 5.0 8.0 23.4 168.0 84%
2005/06 168.0 450.0 227.2 - 395.2 185.2 5.0 5.9 9.1 190.0 93%
2006/07 190.0 324.0 133.1 - 323.1 177.9 5.0 7.7 12.5 120.0 59%
2007/08 120.0 430.0 162.5 - 282.5 204.2 2.0 7.3 4.0 65.0 30%
2008/09 65.0 400.0 195.0 - 260.0 152.6 5.0 6.5 18.9 77.0 42%
2009/10 77.0 355.0 197.4 - 274.4 181.3 5.0 6.9 12.2 69.0 34%
2010/11 69.0 380.0 153.5 - 222.5 178.9 3.0 4.1 6.5 30.0 16%
2011/12 30.0 270.0 128.6 - 158.6 126.4 4.0 4.1 7.1 17.0 12%
2012/13 17.0 285.0 124.9 - 141.9 108.1 4.0 3.9 5.9 20.0 16%
* Feed, waste and dockageSource: Saskatchewan Ministry of Agriculture estimates based on data from Statistics Canada, Agriculture and Agri-Food Canada (AAFC) and STAT Market Research.
"
"
"
"
"
"
"
"
""
"
"
"
"
Regina
Estevan
Saskatoon
Yorkton
Prince Albert
Swift Current
Humboldt
Meadow Lake
MelfortNorth Battleford
Weyburn
Lloydminster
Moose Jaw
Melville
1ANot Availableor Not Grown
1BNot Availableor Not Grown
2AConfidential
2B1,3613AN
23,220
3AS36,858
3BN4,405
3BS10,483
4A2,488
4BConfidential
5AConfidential
5BNot Availableor Not Grown
6A1,691
6BConfidential7A
Confidential
7B9,581
8AConfidential
8BConfidential
9A3,069
9B2,341
Seeded Acres
1 - 10,000
10,001 - 20,000
20,001 - 30,000
30,001 - 80,000
Figure 25: Chickpea Seeded Acres by Crop District, 2011
Source: Statistics CanadaConfidential Data withheld because of small sample size
Figure 24: Chickpea Production and Prices in Saskatchewan
Seeded Area‘000 acres
Yield(lbs/acre)
Production(tonnes)
Average Price($/tonne)
2002/03 430 886 128,600 481
2003/04 130 923 54,400 492
2004/05 100 1,175 42,600 388
2005/06 165 1,240 84,300 455
2006/07 278 1,100 137,200 539
2007/08 380 1,149 198,100 546
2008/09 110 1,409 67,000 545
2009/10 80 1,689 57,400 583
2010/11 205 1,489 128,300 636
2011/12 105 1,610 75,200 750
2012/13 180 1,781 141,300
Source: Statistics Canada
14 2012 Specialty Crop Report, Saskatchewan Ministry of Agriculture
10
15
20
25
30
35
40
45
50
55
60
Aug-09 Nov-09 Feb-10 May-10 Jul-10 Oct-10 Jan-11 Apr-11 Jul-11 Oct-11 Jan-12 Apr-12 Jul-12
Desi Kabuli
Kabuli Chickpea
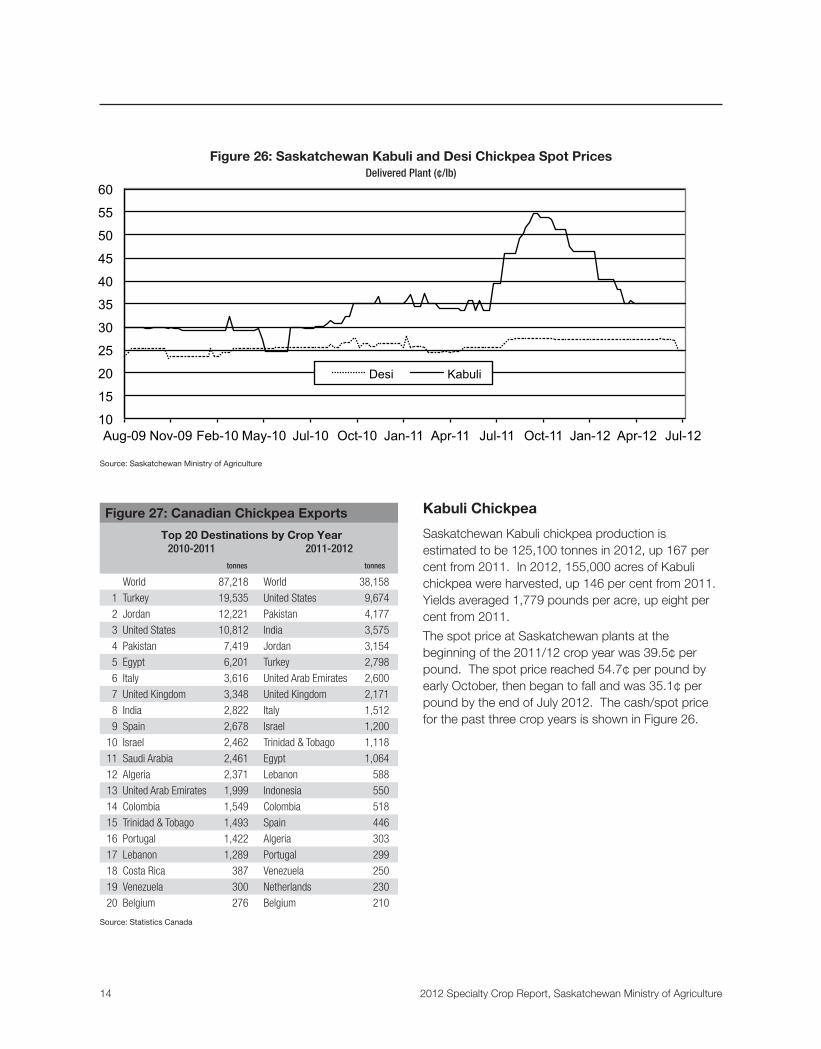
Saskatchewan Kabuli chickpea production is estimated to be 125,100 tonnes in 2012, up 167 per cent from 2011. In 2012, 155,000 acres of Kabuli chickpea were harvested, up 146 per cent from 2011. Yields averaged 1,779 pounds per acre, up eight per cent from 2011.
The spot price at Saskatchewan plants at the beginning of the 2011/12 crop year was 39.5¢ per pound. The spot price reached 54.7¢ per pound by early October, then began to fall and was 35.1¢ per pound by the end of July 2012. The cash/spot price for the past three crop years is shown in Figure 26.
Figure 26: Saskatchewan Kabuli and Desi Chickpea Spot PricesDelivered Plant (¢/lb)
Source: Saskatchewan Ministry of Agriculture
Figure 27: Canadian Chickpea Exports
Top 20 Destinations by Crop Year2010-2011 2011-2012
tonnes tonnes
World 87,218 World 38,158
1 Turkey 19,535 United States 9,674
2 Jordan 12,221 Pakistan 4,177
3 United States 10,812 India 3,575
4 Pakistan 7,419 Jordan 3,154
5 Egypt 6,201 Turkey 2,798
6 Italy 3,616 United Arab Emirates 2,600
7 United Kingdom 3,348 United Kingdom 2,171
8 India 2,822 Italy 1,512
9 Spain 2,678 Israel 1,200
10 Israel 2,462 Trinidad & Tobago 1,118
11 Saudi Arabia 2,461 Egypt 1,064
12 Algeria 2,371 Lebanon 588
13 United Arab Emirates 1,999 Indonesia 550
14 Colombia 1,549 Colombia 518
15 Trinidad & Tobago 1,493 Spain 446
16 Portugal 1,422 Algeria 303
17 Lebanon 1,289 Portugal 299
18 Costa Rica 387 Venezuela 250
19 Venezuela 300 Netherlands 230
20 Belgium 276 Belgium 210
Source: Statistics Canada
2012 Specialty Crop Report, Saskatchewan Ministry of Agriculture 15
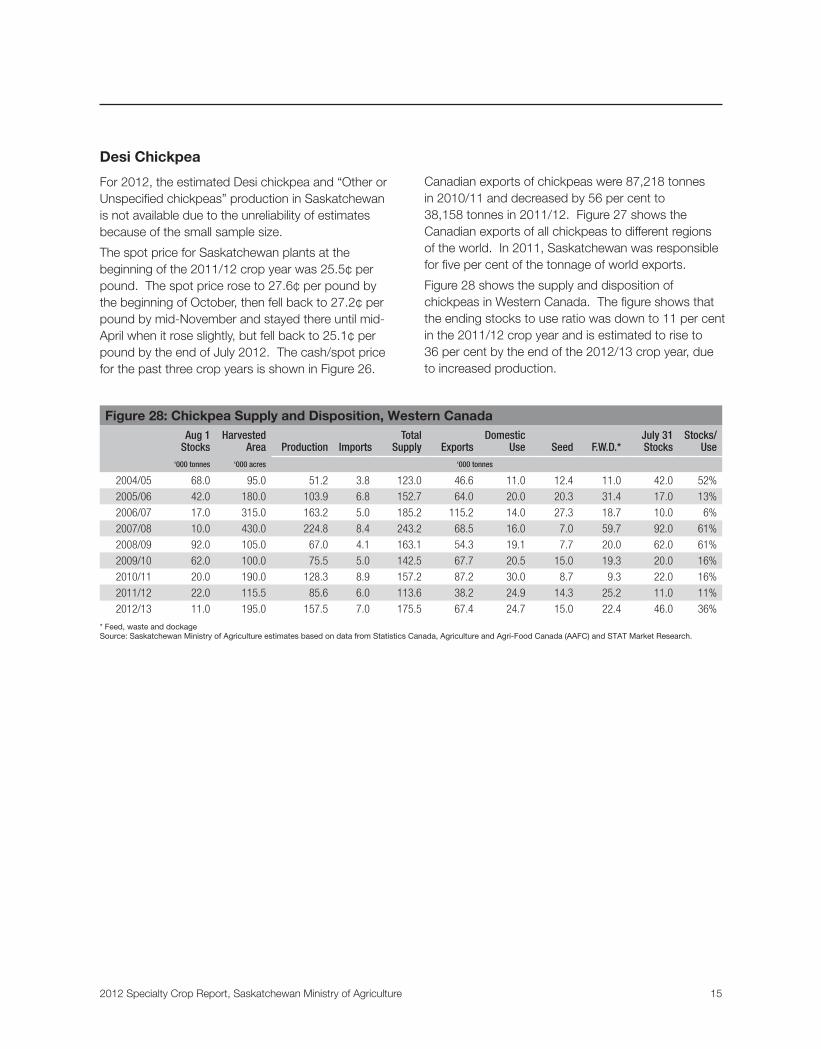
Desi Chickpea
For 2012, the estimated Desi chickpea and “Other or Unspecified chickpeas” production in Saskatchewan is not available due to the unreliability of estimates because of the small sample size.
The spot price for Saskatchewan plants at the beginning of the 2011/12 crop year was 25.5¢ per pound. The spot price rose to 27.6¢ per pound by the beginning of October, then fell back to 27.2¢ per pound by mid-November and stayed there until mid-April when it rose slightly, but fell back to 25.1¢ per pound by the end of July 2012. The cash/spot price for the past three crop years is shown in Figure 26.
Canadian exports of chickpeas were 87,218 tonnes in 2010/11 and decreased by 56 per cent to 38,158 tonnes in 2011/12. Figure 27 shows the Canadian exports of all chickpeas to different regions of the world. In 2011, Saskatchewan was responsible for five per cent of the tonnage of world exports.
Figure 28 shows the supply and disposition of chickpeas in Western Canada. The figure shows that the ending stocks to use ratio was down to 11 per cent in the 2011/12 crop year and is estimated to rise to 36 per cent by the end of the 2012/13 crop year, due to increased production.
Figure 28: Chickpea Supply and Disposition, Western CanadaAug 1
StocksHarvested
Area Production ImportsTotal
Supply ExportsDomestic
Use Seed F.W.D.*July 31Stocks
Stocks/Use
‘000 tonnes ‘000 acres ‘000 tonnes
2004/05 68.0 95.0 51.2 3.8 123.0 46.6 11.0 12.4 11.0 42.0 52%
2005/06 42.0 180.0 103.9 6.8 152.7 64.0 20.0 20.3 31.4 17.0 13%
2006/07 17.0 315.0 163.2 5.0 185.2 115.2 14.0 27.3 18.7 10.0 6%
2007/08 10.0 430.0 224.8 8.4 243.2 68.5 16.0 7.0 59.7 92.0 61%
2008/09 92.0 105.0 67.0 4.1 163.1 54.3 19.1 7.7 20.0 62.0 61%
2009/10 62.0 100.0 75.5 5.0 142.5 67.7 20.5 15.0 19.3 20.0 16%
2010/11 20.0 190.0 128.3 8.9 157.2 87.2 30.0 8.7 9.3 22.0 16%
2011/12 22.0 115.5 85.6 6.0 113.6 38.2 24.9 14.3 25.2 11.0 11%
2012/13 11.0 195.0 157.5 7.0 175.5 67.4 24.7 15.0 22.4 46.0 36%
* Feed, waste and dockageSource: Saskatchewan Ministry of Agriculture estimates based on data from Statistics Canada, Agriculture and Agri-Food Canada (AAFC) and STAT Market Research.
16 2012 Specialty Crop Report, Saskatchewan Ministry of Agriculture
Triticale production is estimated at 16,500 tonnes, up 62 per cent from 2011 production of 10,200 tonnes. The increase is due to a 62 per cent increase in yield. The average yield for triticale was 2,425 pounds per acres. In 2012, 78 per cent of the triticale crop is expected to grade No. 1 Canada.
Coriander seeded area was down from 2011, with around 15,500 acres planted. In 2011/12, Canadian exports to the world totaled 939 tonnes. This was an 80 per cent decrease from the 4,594 tonnes exported in 2010/11. The United States was the main importer followed by Sri Lanka and the United Kingdom.
Caraway seeded area was estimated to be down compared to 2011, with 6,500 acres planted. In 2011/12, Canadian exports to the world totaled 173 tonnes. This was an 80 per cent decrease from the 867 tonnes exported in 2010/11. The United States and Mexico were the importers.
No camelina acres were contracted in 2012, and thus there were essentially no changes to acres planted, at less than 1,000 acres. Borage seeded area is estimated to be higher than in 2011, with 4,200 acres planted. Dry bean acreage is estimated to be slightly higher than 2011 at 11,000 acres planted. Soybean acreage is back up due to the southeast being able to plant more acres this spring, compared to last. Hemp acreage is estimated to be more than double what was planted in 2011. Faba bean acres are down by more than half from 2011, while fenugreek acreages are estimated to be slightly higher than the 2011 acreage.
Other crops grown include buckwheat, sunflowers and quinoa.
Other Crops
2012 Specialty Crop Report, Saskatchewan Ministry of Agriculture 17
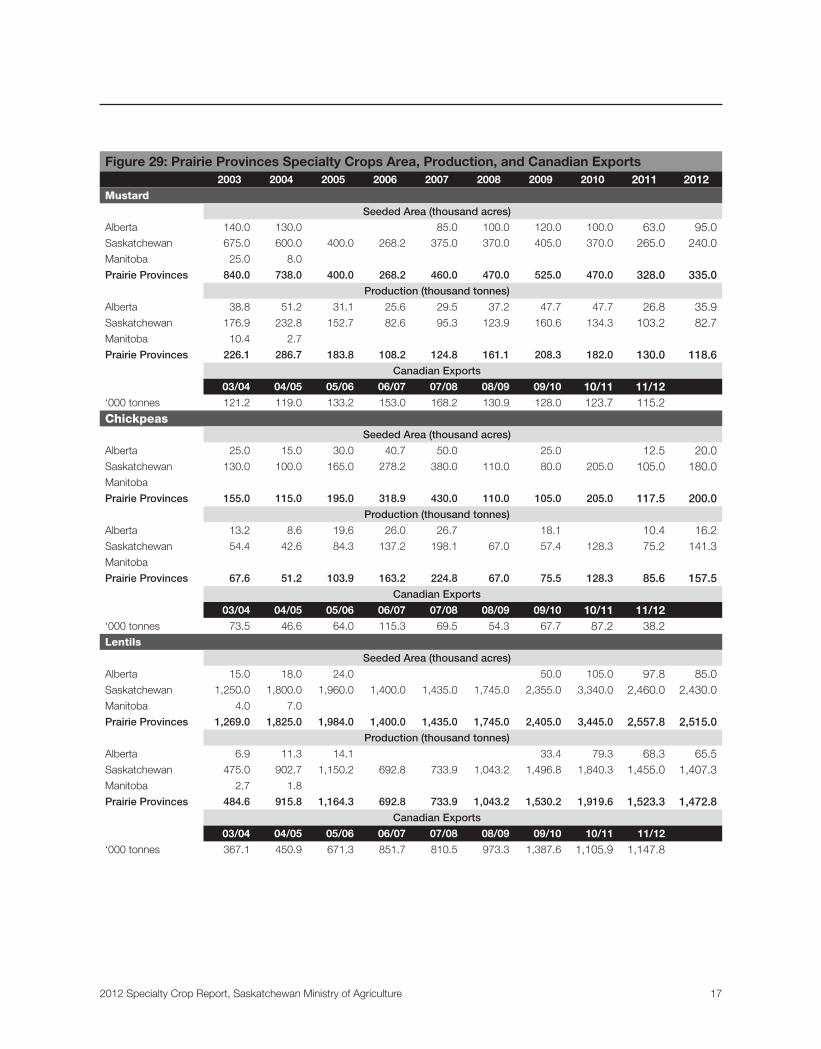
Figure 29: Prairie Provinces Specialty Crops Area, Production, and Canadian Exports2003 2004 2005 2006 2007 2008 2009 2010 2011 2012
Mustard
Seeded Area (thousand acres)
Alberta 140.0 130.0 85.0 100.0 120.0 100.0 63.0 95.0Saskatchewan 675.0 600.0 400.0 268.2 375.0 370.0 405.0 370.0 265.0 240.0Manitoba 25.0 8.0
Prairie Provinces 840.0 738.0 400.0 268.2 460.0 470.0 525.0 470.0 328.0 335.0Production (thousand tonnes)
Alberta 38.8 51.2 31.1 25.6 29.5 37.2 47.7 47.7 26.8 35.9Saskatchewan 176.9 232.8 152.7 82.6 95.3 123.9 160.6 134.3 103.2 82.7Manitoba 10.4 2.7
Prairie Provinces 226.1 286.7 183.8 108.2 124.8 161.1 208.3 182.0 130.0 118.6Canadian Exports
03/04 04/05 05/06 06/07 07/08 08/09 09/10 10/11 11/12‘000 tonnes 121.2 119.0 133.2 153.0 168.2 130.9 128.0 123.7 115.2 Chickpeas
Seeded Area (thousand acres)
Alberta 25.0 15.0 30.0 40.7 50.0 25.0 12.5 20.0Saskatchewan 130.0 100.0 165.0 278.2 380.0 110.0 80.0 205.0 105.0 180.0Manitoba
Prairie Provinces 155.0 115.0 195.0 318.9 430.0 110.0 105.0 205.0 117.5 200.0 Production (thousand tonnes)
Alberta 13.2 8.6 19.6 26.0 26.7 18.1 10.4 16.2 Saskatchewan 54.4 42.6 84.3 137.2 198.1 67.0 57.4 128.3 75.2 141.3 Manitoba
Prairie Provinces 67.6 51.2 103.9 163.2 224.8 67.0 75.5 128.3 85.6 157.5 Canadian Exports
03/04 04/05 05/06 06/07 07/08 08/09 09/10 10/11 11/12‘000 tonnes 73.5 46.6 64.0 115.3 69.5 54.3 67.7 87.2 38.2 Lentils
Seeded Area (thousand acres)
Alberta 15.0 18.0 24.0 50.0 105.0 97.8 85.0Saskatchewan 1,250.0 1,800.0 1,960.0 1,400.0 1,435.0 1,745.0 2,355.0 3,340.0 2,460.0 2,430.0Manitoba 4.0 7.0
Prairie Provinces 1,269.0 1,825.0 1,984.0 1,400.0 1,435.0 1,745.0 2,405.0 3,445.0 2,557.8 2,515.0Production (thousand tonnes)
Alberta 6.9 11.3 14.1 33.4 79.3 68.3 65.5Saskatchewan 475.0 902.7 1,150.2 692.8 733.9 1,043.2 1,496.8 1,840.3 1,455.0 1,407.3Manitoba 2.7 1.8
Prairie Provinces 484.6 915.8 1,164.3 692.8 733.9 1,043.2 1,530.2 1,919.6 1,523.3 1,472.8Canadian Exports
03/04 04/05 05/06 06/07 07/08 08/09 09/10 10/11 11/12
‘000 tonnes 367.1 450.9 671.3 851.7 810.5 973.3 1,387.6 1,105.9 1,147.8
18 2012 Specialty Crop Report, Saskatchewan Ministry of Agriculture
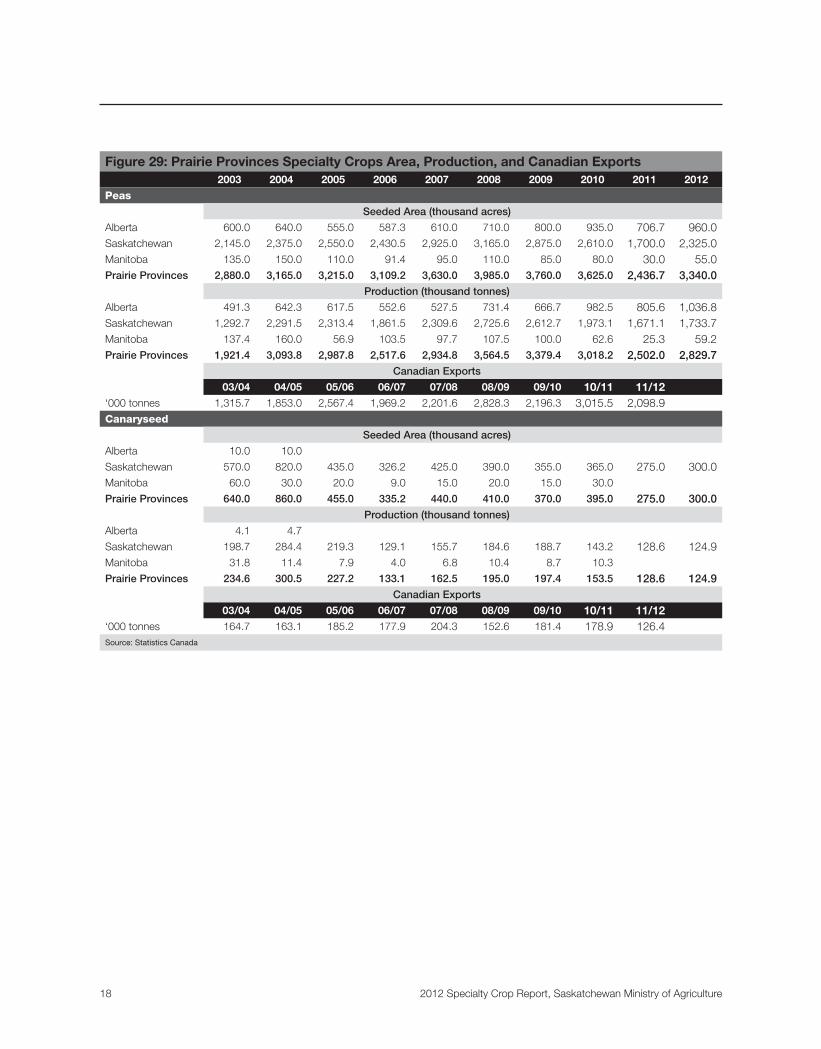
Figure 29: Prairie Provinces Specialty Crops Area, Production, and Canadian Exports2003 2004 2005 2006 2007 2008 2009 2010 2011 2012
Peas
Seeded Area (thousand acres)
Alberta 600.0 640.0 555.0 587.3 610.0 710.0 800.0 935.0 706.7 960.0Saskatchewan 2,145.0 2,375.0 2,550.0 2,430.5 2,925.0 3,165.0 2,875.0 2,610.0 1,700.0 2,325.0Manitoba 135.0 150.0 110.0 91.4 95.0 110.0 85.0 80.0 30.0 55.0Prairie Provinces 2,880.0 3,165.0 3,215.0 3,109.2 3,630.0 3,985.0 3,760.0 3,625.0 2,436.7 3,340.0
Production (thousand tonnes)
Alberta 491.3 642.3 617.5 552.6 527.5 731.4 666.7 982.5 805.6 1,036.8Saskatchewan 1,292.7 2,291.5 2,313.4 1,861.5 2,309.6 2,725.6 2,612.7 1,973.1 1,671.1 1,733.7Manitoba 137.4 160.0 56.9 103.5 97.7 107.5 100.0 62.6 25.3 59.2Prairie Provinces 1,921.4 3,093.8 2,987.8 2,517.6 2,934.8 3,564.5 3,379.4 3,018.2 2,502.0 2,829.7
Canadian Exports
03/04 04/05 05/06 06/07 07/08 08/09 09/10 10/11 11/12‘000 tonnes 1,315.7 1,853.0 2,567.4 1,969.2 2,201.6 2,828.3 2,196.3 3,015.5 2,098.9Canaryseed
Seeded Area (thousand acres)
Alberta 10.0 10.0
Saskatchewan 570.0 820.0 435.0 326.2 425.0 390.0 355.0 365.0 275.0 300.0Manitoba 60.0 30.0 20.0 9.0 15.0 20.0 15.0 30.0
Prairie Provinces 640.0 860.0 455.0 335.2 440.0 410.0 370.0 395.0 275.0 300.0 Production (thousand tonnes)
Alberta 4.1 4.7
Saskatchewan 198.7 284.4 219.3 129.1 155.7 184.6 188.7 143.2 128.6 124.9Manitoba 31.8 11.4 7.9 4.0 6.8 10.4 8.7 10.3
Prairie Provinces 234.6 300.5 227.2 133.1 162.5 195.0 197.4 153.5 128.6 124.9 Canadian Exports
03/04 04/05 05/06 06/07 07/08 08/09 09/10 10/11 11/12‘000 tonnes 164.7 163.1 185.2 177.9 204.3 152.6 181.4 178.9 126.4 Source: Statistics Canada


www.agriculture.gov.sk.ca
For more information, contact:
Agriculture Knowledge Centre (Toll-Free): 1-866-457-2377
Printed January 2013 1.5M 0165POLISSN 0828-3737 0112
Kindersley (306) 463-5513
Moose Jaw 1-866-457-2377
North Battleford (306) 446-7964
Outlook (306) 867-5575
Prince Albert (306) 953-2363
Swift Current (306) 778-8285
Tisdale (306) 878-8843
Watrous (306) 946-3230
Weyburn (306) 848-2857
Yorkton (306) 786-1531
Assiniboia 1-866-457-2377
Lloydminster (306) 446-7962
Moosomin (306) 786-1531
Shaunavon (306) 778-8285
Estevan (306) 848-2857
Meadow Lake (306) 446-7962
Wadena (306) 946-3230
Saskatchewan Agriculture Regional Offices
You may also contact us to make an appointment at one of our seven Regional Satellite Offices: