Embed Size (px)
Citation preview
Adult Drug Court
A specially designed
court docket that
employs a program
designed to reduce drug
use relapse and criminal
recidivism among
defendants and
offenders through risk
and needs assessment,
judicial interaction,
monitoring and
supervision, graduated
sanctions and
incentives, treatment
and various
rehabilitation services.
Arkansas Adult Drug Court Recidivism Study / Cost Benefit Analysis Measuring Recidivism and Performance
November 2014
1
Ark
ansa
s A
du
lt D
rug
Co
urt
Pro
ject
I. BACKGROUND
INTRODUCTION
Operation of the Nation’s first drug court began more than twenty years ago as a
way to address the increasing number of drug-related court cases. As of March 1,
2012, there were 2,231 adult drug court programs operating in the United States. 1
With the ever expanding increase in adult drug courts, there are a number of
variations of the courts but most are established on central criteria and principles:
drug courts are intended for offenders with chemical dependency issues facing the
possibility of prison or long-term incarceration.
Drug Court Programs are an interdisciplinary judicial process for diverting an
offender who has demonstrated dependence on alcohol or illegal drugs into a
strenuous treatment program that requires treatment and counseling, frequent drug
tests, employment, and regular court appearances. 2 Because of their intensive
substance abuse treatment programs, drug courts are not ideal for everyone;
however, for a number of participants wanting to become sober and end the
revolving door of the criminal justice system, drug courts provide significant
benefits.
When compared to traditional courts, Arkansas adult drug courts have
demonstrated the ability to increase offender likelihood of successful rehabilitation
by:
Providing drug related support services,
Providing ancillary services,
Requiring mandatory and random drug testing,
Delivering stringent supervision and involvement by the drug court team,
and
Offering incentives and sanctions.
1 BJA Drug Court Technical Assistance/Clearinghouse Project, “Drug Court Activity Update,”
(Washington, DC: American University, Justice of Programs Offices, March, 2012) pg. 1. 2 Arkansas Judiciary, Drug Court Programs, 2013, pg.1
2
Ark
ansa
s A
du
lt D
rug
Co
urt
Pro
ject
ARKANSAS ADULT DRUG COURTS
The first adult drug court emerged in Pulaski County Arkansas in 1994. Currently
Arkansas has a total of forty-three (43) adult drug courts. During the reporting
period for this project, Fiscal Year (FY) 2009, there were a total of forty (40) adult
drug courts (See Table 1, pg.3). Although the implementation of drug courts is a
fairly new concept within Arkansas’s judicial system, the State has seen a
considerable increase in the number of adult drug courts since its inception.
Drug courts are typically defined as special courts given responsibility to handle
cases involving substance-abusing offenders through comprehensive supervision,
drug testing, treatment services and immediate sanctions and incentives.3 Drug
courts were established as an alternative to traditional courts when dealing with
drug-using offenders in their communities while utilizing programs and services
aimed at assisting them with their drug dependences.
DRUG COURT STAFF. The courts’ personnel staffs are comprised of highly
specialized teams consisting of the judge, court staff, a prosecutor, a public defender
or private attorney representing the offender, a probation or parole officer and drug
a counselor.4 Collaborative efforts are made between the criminal justice and drug
treatment professionals with an elaborate balance of authority, supervision,
support, and encouragement for the offender. The teams are structured by
presiding judges that are actively involved throughout the continuum of care during
the drug court process.
DRUG COURT DESIGN. Drug courts’ structured intervention is in response to both
the availability of local resources, such as treatment modalities and ancillary
services, and to drug problems of particular concern to that community. With the
design of the court at the discretion of the judge, there is not a standard design for
the Arkansas drug courts. However, there are certain criteria that have been
established and must be followed by each drug court. Courts adhere to a set of ten
3 What is a Drug Court?, Superior Court of California, County of Alameda, Drug Court Services
Department, http://www.alameda.courts.ca.gov/dcs/whatisdcs.html (last visited Mar., 2013). 4 What is the Division of Drug Courts?, Arkansas Judiciary, https://courts.arkansas.gov/courts/circuit-
courts/drug-court-programs (last visited Mar., 2013).
3
Ark
ansa
s A
du
lt D
rug
Co
urt
Pro
ject
(10) recommended key components5, developed by the U.S. Department of Justice,
which provide guidance for operating effective courts. The components are a series
of inter-related functions that provides needed coordination and seamless
collaboration by ensuring: 1) clients are linked to relevant and effective services; 2)
all service efforts are monitored, connected, and in synchrony; and 3) pertinent
information gathered during assessment and monitoring is provided to the entire
drug court team in real time.6 In order to receive drug court funding, Arkansas drug
courts must comply with these components.
The courts are also charged with adopting one of the three drug court models
designated for the courts: pre-adjudication, post-adjudication and a hybrid model
that includes both pre/post-adjudication. In the pre-adjudication model, the
offender enrolls in drug court without entering a guilty plea or going through the
trial process.7 If there is successful completion of the program, charges are
dismissed. If offenders fail to complete the program, however, they proceed to the
traditional court model. Offenders entering drug courts under post-adjudication
plead guilty and face a suspended sentence while they participate in the drug court.8
If the offender fails to complete the program as part of the suspended sentence, a
prison sentence is imposed. The hybrid model is a merger of both the pre- and post-
models. In this model, offenders enter a plea that is held in abeyance while they
complete the program.9 As with pre-adjudication, charges are dismissed after
successful completion of the program. However, if the offender fails, the deferred
plea is entered and a sentence is imposed resulting in incarceration.
As with national data, the post-adjudication model (80.0%) is the model most highly
favored by Arkansas judges, followed by the pre-adjudication model (7.5%) and the
hybrid model (12.5%) respectively. Data obtained from the Administrative Offices of
the Courts indicate that the majority of the State’s drug courts’ average caseload
5 U.S. Department of Justice, Office of Justice Programs, Drug Courts: The Second Decade 3 (2006)
6 National Drug Court Institute, Drug Court Case Management: Monograph Series 7, 2006
7 America’s Problem-Solving Courts: The Criminal Costs of Treatment and the Case for Reform pg. 16
(2009) 8 America’s Problem-Solving Courts pg. 16 (2009)
9 Ibid., pg.16
4
Ark
ansa
s A
du
lt D
rug
Co
urt
Pro
ject
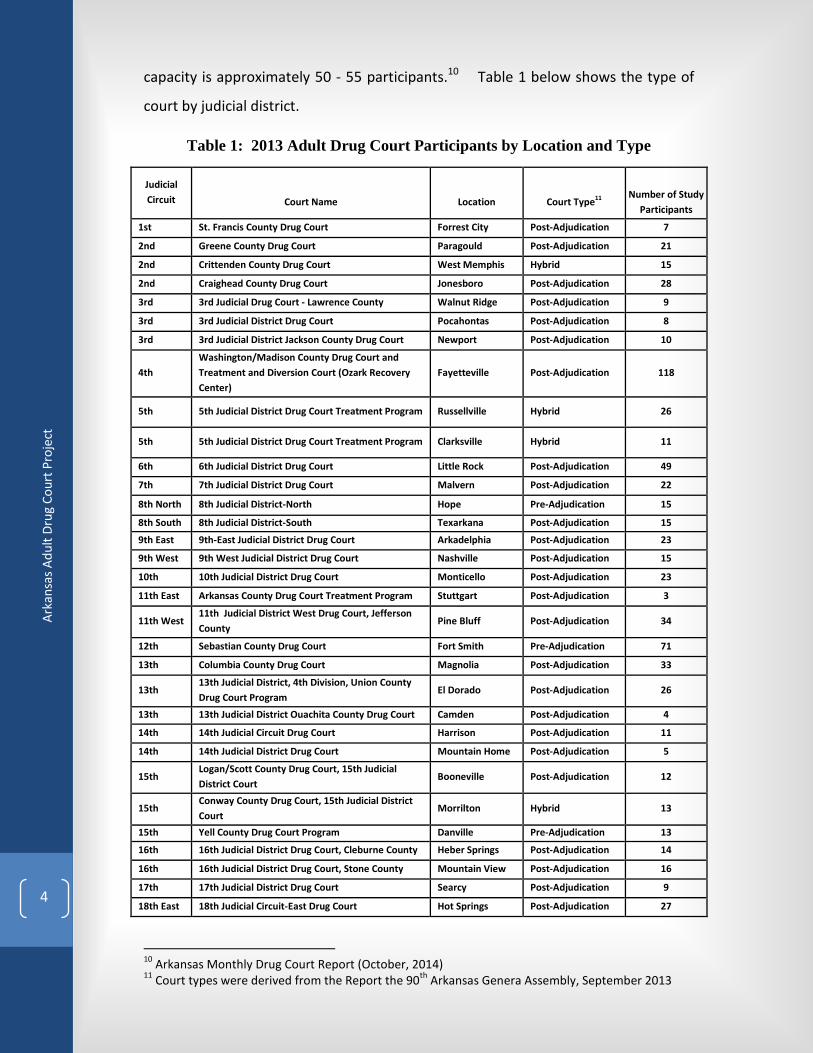
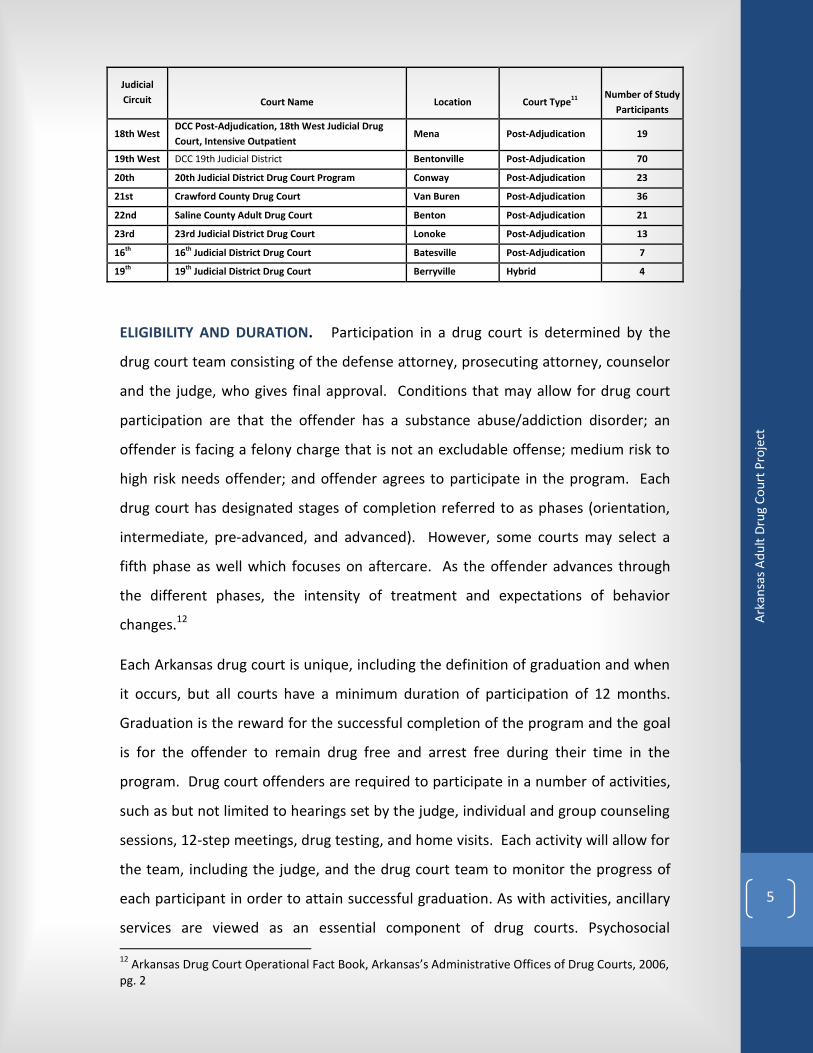
capacity is approximately 50 - 55 participants.10 Table 1 below shows the type of
court by judicial district.
Table 1: 2013 Adult Drug Court Participants by Location and Type
Judicial
Circuit
Court Name
Location
Court Type11
Number of Study
Participants
1st St. Francis County Drug Court Forrest City Post-Adjudication 7
2nd Greene County Drug Court Paragould Post-Adjudication 21
2nd Crittenden County Drug Court West Memphis Hybrid 15
2nd Craighead County Drug Court Jonesboro Post-Adjudication 28
3rd 3rd Judicial Drug Court - Lawrence County Walnut Ridge Post-Adjudication 9
3rd 3rd Judicial District Drug Court Pocahontas Post-Adjudication 8
3rd 3rd Judicial District Jackson County Drug Court Newport Post-Adjudication 10
4th Washington/Madison County Drug Court and
Treatment and Diversion Court (Ozark Recovery
Center) Fayetteville Post-Adjudication 118
5th 5th Judicial District Drug Court Treatment Program Russellville Hybrid 26
5th 5th Judicial District Drug Court Treatment Program Clarksville Hybrid 11
6th 6th Judicial District Drug Court Little Rock Post-Adjudication 49
7th 7th Judicial District Drug Court Malvern Post-Adjudication 22
8th North 8th Judicial District-North Hope Pre-Adjudication 15
8th South 8th Judicial District-South Texarkana Post-Adjudication 15
9th East 9th-East Judicial District Drug Court Arkadelphia Post-Adjudication 23
9th West 9th West Judicial District Drug Court Nashville Post-Adjudication 15
10th 10th Judicial District Drug Court Monticello Post-Adjudication 23
11th East Arkansas County Drug Court Treatment Program Stuttgart Post-Adjudication 3
11th West 11th Judicial District West Drug Court, Jefferson
County Pine Bluff Post-Adjudication 34
12th Sebastian County Drug Court Fort Smith Pre-Adjudication 71
13th Columbia County Drug Court Magnolia Post-Adjudication 33
13th 13th Judicial District, 4th Division, Union County
Drug Court Program El Dorado Post-Adjudication 26
13th 13th Judicial District Ouachita County Drug Court Camden Post-Adjudication 4
14th 14th Judicial Circuit Drug Court Harrison Post-Adjudication 11
14th 14th Judicial District Drug Court Mountain Home Post-Adjudication 5
15th Logan/Scott County Drug Court, 15th Judicial
District Court Booneville Post-Adjudication 12
15th Conway County Drug Court, 15th Judicial District
Court Morrilton Hybrid 13
15th Yell County Drug Court Program Danville Pre-Adjudication 13
16th 16th Judicial District Drug Court, Cleburne County Heber Springs Post-Adjudication 14
16th 16th Judicial District Drug Court, Stone County Mountain View Post-Adjudication 16
17th 17th Judicial District Drug Court Searcy Post-Adjudication 9
18th East 18th Judicial Circuit-East Drug Court Hot Springs Post-Adjudication 27
10
Arkansas Monthly Drug Court Report (October, 2014) 11
Court types were derived from the Report the 90th
Arkansas Genera Assembly, September 2013
5
Ark
ansa
s A
du
lt D
rug
Co
urt
Pro
ject
Judicial
Circuit
Court Name
Location
Court Type11
Number of Study
Participants
18th West DCC Post-Adjudication, 18th West Judicial Drug
Court, Intensive Outpatient Mena Post-Adjudication 19
19th West DCC 19th Judicial District Bentonville Post-Adjudication 70
20th 20th Judicial District Drug Court Program Conway Post-Adjudication 23
21st Crawford County Drug Court Van Buren Post-Adjudication 36
22nd Saline County Adult Drug Court Benton Post-Adjudication 21
23rd 23rd Judicial District Drug Court Lonoke Post-Adjudication 13
16th 16th Judicial District Drug Court Batesville Post-Adjudication 7
19th 19th Judicial District Drug Court Berryville Hybrid 4
ELIGIBILITY AND DURATION. Participation in a drug court is determined by the
drug court team consisting of the defense attorney, prosecuting attorney, counselor
and the judge, who gives final approval. Conditions that may allow for drug court
participation are that the offender has a substance abuse/addiction disorder; an
offender is facing a felony charge that is not an excludable offense; medium risk to
high risk needs offender; and offender agrees to participate in the program. Each
drug court has designated stages of completion referred to as phases (orientation,
intermediate, pre-advanced, and advanced). However, some courts may select a
fifth phase as well which focuses on aftercare. As the offender advances through
the different phases, the intensity of treatment and expectations of behavior
changes.12
Each Arkansas drug court is unique, including the definition of graduation and when
it occurs, but all courts have a minimum duration of participation of 12 months.
Graduation is the reward for the successful completion of the program and the goal
is for the offender to remain drug free and arrest free during their time in the
program. Drug court offenders are required to participate in a number of activities,
such as but not limited to hearings set by the judge, individual and group counseling
sessions, 12-step meetings, drug testing, and home visits. Each activity will allow for
the team, including the judge, and the drug court team to monitor the progress of
each participant in order to attain successful graduation. As with activities, ancillary
services are viewed as an essential component of drug courts. Psychosocial 12
Arkansas Drug Court Operational Fact Book, Arkansas’s Administrative Offices of Drug Courts, 2006, pg. 2
6
Ark
ansa
s A
du
lt D
rug
Co
urt
Pro
ject
education, referrals to outside agencies (education, job placement, and housing) and
community services are some of the most common ancillary services offered to and
utilized by drug court participants.
A complication arises when comparing drug courts in that the “point” at which a
participant is considered a graduate varies widely from court to court. For example,
one court may consider the final phase to be aftercare so that when a participant
completes the therapeutic portion of the program before the final phase they are a
graduate. The participant in this scenario moves on to the final phase with reduced
activities but is still considered under drug court supervision. In another court, the
participant may be required to complete all phases, including after care, in order to
be considered a graduate.
This variation in the definition of “graduate” leads to challenges in determination of
successful drug court participation. ACC’s recommendation is that all courts use the
term graduated only after a participant has finished the drug court program and is
finishing the three year probation term; however, this standard has not been
adopted by all courts.
Generally, drug court participants are placed on three years of probation when
admitted into drug court to provide sufficient time to complete the program.
INCENTIVES AND SANCTIONS. There are a number of immediate sanctions and
incentives that may be issued to the offender to ensure successful completion of a
drug court program. Compliance to drug court rules and positive behavior result in
the award of incentives such as waiver of court fees, reduction in court appearances,
praise from the judge, and dismissal of the client’s court case. Incentives valued by
the participant are usually awarded by the courts if the offender:
1. Is performing satisfactorily in drug court;
2. Is benefiting from education, treatment and rehabilitation;
3. Has not engaged in criminal conduct; or
4. Has not violated the term and condition of drug court.13
13
National Drug Court Institute, Model State Drug Court Legislation: Monograph Series 5, 2004, pg. 8
7
Ark
ansa
s A
du
lt D
rug
Co
urt
Pro
ject
If participants are non-compliant, sanctions, also described as “smart punishment”
are issued by the court. 14 Sanctions, such as verbal warnings, jail days, demotion in
phase, and additional community service hours are not used as punishment but as
methods to change behavior. Sanctions are imposed if the court finds that the
offender:
1. Is not performing satisfactorily in drug court;
2. Is not benefiting from education, treatment and rehabilitation;
3. Has engaged in new criminal activity;
4. Has engaged in conduct rendering him/her unsuitable for the program;
5. Has otherwise violated the term and condition of drug court; or
6. Is for any reason unable to participate.15
Repeat and serious offensives could possibly lead to the removal of a participant
from a drug court program. Both sanctions and incentives serve as additional
guidance for the participants and are used to keep participants actively engaged in
treatment.
SUMMARY. By combining drug treatment with ongoing judicial supervision, drug
courts seek to break the cycle of addiction, crime, and repeat incarceration. While
practice varies widely from court to court, the basics for all drug courts are clear:
addicted offenders participate in treatment; their progress is monitored by a drug
court team and participants engage in direct interaction with the judge to respond
to progress and setbacks with an associated range of incentives and sanctions. The
successful participants generally have the charges against them dismissed or
reduced and only those who fail receive jail or prison sentences.
14
Thomas Asbury, 2001, as cited in America’s Problem-Solving Courts (2009) 15
National Drug Court Institute, Model State Drug Court Legislation: Monograph Series 5, 2004, pg. 8
8
Ark
ansa
s A
du
lt D
rug
Co
urt
Pro
ject
DRUG COURT STUDY SIGNIFICANT FINDINGS
Below is a compilation of findings to be highlighted by this drug court study:
Arkansas’s drug courts have a high degree of support, credibility, and impact
on recovery and sobriety. They have a high graduation rate, are well-
conceived and reflect practices that meet or exceed national standards.
A great deal of differentiation exists among the drug courts in Arkansas from
pre and post adjudication courts to policies on the number of failures and
revocation rules. With these varied policies, it is difficult to compile results
statewide and even more challenging to compare these results with other
state or national studies.
Incarceration rates for the study group (FY 2009 drug court intakes) were
higher (27.7%) than the control cohort (sample of FY 2009 non-drug court
probation intakes) rate (19.7%). In contrast, the re-arrest rate was lower in
the drug court cohort (38.3%) than the control cohort (39.8%).
Data showed that 59.7 percent of the FY 2009 participants graduated from
the drug court programs. By gender, 68.5 percent of females graduated and
55.0 percent of males graduated.
The total FY 2009 drug court intake cohort averaged a length of stay (LOS) of
23.4 months. Graduates averaged a LOS of 24.7 months, 14.4 percent longer
than non-graduates who averaged 21.6 months.
Of the non-graduate group, 19.1 percent did not have a positive drug test
while 37.1 percent of the graduate group did not have a positive drug test.
Non graduates tested positive for THC/Marijuana and Heroin most
frequently.
Graduates and non-graduates had a similar percentage of cases which tested
positive for less than three drugs. However, graduates had a significantly
lower number of cases that tested positive for three or more drugs.
Only 4.3 percent of drug court graduates were revoked to prison within three
years of starting drug court supervision.
9
Ark
ansa
s A
du
lt D
rug
Co
urt
Pro
ject
Arkansas Drug Courts have admitted a large percentage of low risk offenders
in the program. National Standards call for high risk and medium risk only
offenders to be admitted in the drug court program. This best practice
should be adapted in the State.
It is also recommended that future iterations of this report attempt to focus
on individual drug courts. By individually measuring results by court over
time, patterns may start to emerge and best practices will be identified.
II. PROJECT DESCRIPTION
PROJECT SCOPE
The purpose of this Arkansas Community Correction (ACC) study was to determine if
drug courts have a noticeable effect on recidivism and sobriety. Act 570 of 2011
added a section to the Arkansas Drug Court Act to evaluate success by the rate of
recidivism of all drug court participants, including those who do not graduate. The
study focuses on the analyses of performance measures, their outcomes, and a cost
benefit analysis of the drug court program versus the traditional probation and
parole community supervision approach.
This study does not include any offenders in the SWIFT and HOPE court programs. A
separate study is being conducted on those programs.
DATA SOURCES
The data sources utilized were ACC’s electronic Offender Management Information
System (eOMIS) and the Arkansas Crime Information Center’s (ACIC) Arkansas
Uniform Crime Reporting (UCR) Program. ACC personnel are active members of
drug court teams and are responsible for gathering and entering data on each drug
court participant. eOMIS serves as the State’s offender tracking system designed to
collect data in support of comprehensive statewide operations of offender
management including offenders in prison, on probation, on parole or in any other
supervision/incarceration status. The data collected includes offender
demographics, offense, prior criminal history, current treatment needs, family
history, health and mental health history, treatment placement and outcome, court
10
Ark
ansa
s A
du
lt D
rug
Co
urt
Pro
ject
reported violations, and termination status of drug court participants. To ensure
data validity, a number of data fields established in eOMIS require mandatory entry.
For special data needs, the ACC used SharePoint for the coordination of data
collection not included in eOMIS. The UCR Program provided data on arrests. ACC
was responsible for data mining including data extraction and providing guidance on
policy information and drug court practices in Arkansas. JFA Associates performed
analysis on the data available to make recommendations and present significant
findings.
PROJECT METHODOLGY
DEMOGRAPHICS. Electronic data was gathered from 40 pre-adjudication, post-
adjudication and hybrid courts in twenty-three Judicial Districts to evaluate the
impact of drug courts. The study group consisted of all drug court participants
entering Arkansas drug courts during FY 2009 (July 1, 2008 – June 30, 2009). The
drug court participant sample for the study consisted of 899 offenders. For the
cohort study, a control group, consisting of 1,723 randomly selected offenders, was
identified from all other probation intakes from the same period that had a similar
criminogenic background as the drug court cohort.
A similar criminal background was chosen to avoid bias that might endow the
control group with traits favorable to a positive outcome. Three variables were used
to compare the FY 2009 drug court cohort to the FY 2009 probation intake
population to generate the control group sample: previous history of criminal
activity, most serious offense, and average term of supervision.
Previous history of criminal activity was measured by the presence of any previous
commitment information. The most serious offense was defined as the offense that
most influenced the sentence length of the offender. Finally, the term of supervision
specified the maximum sentenced probation supervision time the offender received.
These three factors were chosen because they highly influence the probability that
an offender will/will not violate the terms of their supervision. Certain crimes, for
11
Ark
ansa
s A
du
lt D
rug
Co
urt
Pro
ject
example property related crimes16, are historically associated with higher recidivism
rates. Traditionally, offenders with no previous criminal record are less likely to
recidivate than offenders with a history of criminal activity17. Lastly, length of
probation sentence was used because offenders with longer supervision times are
more likely to violate supervision than an offender that is supervised for a shorter
period of time.
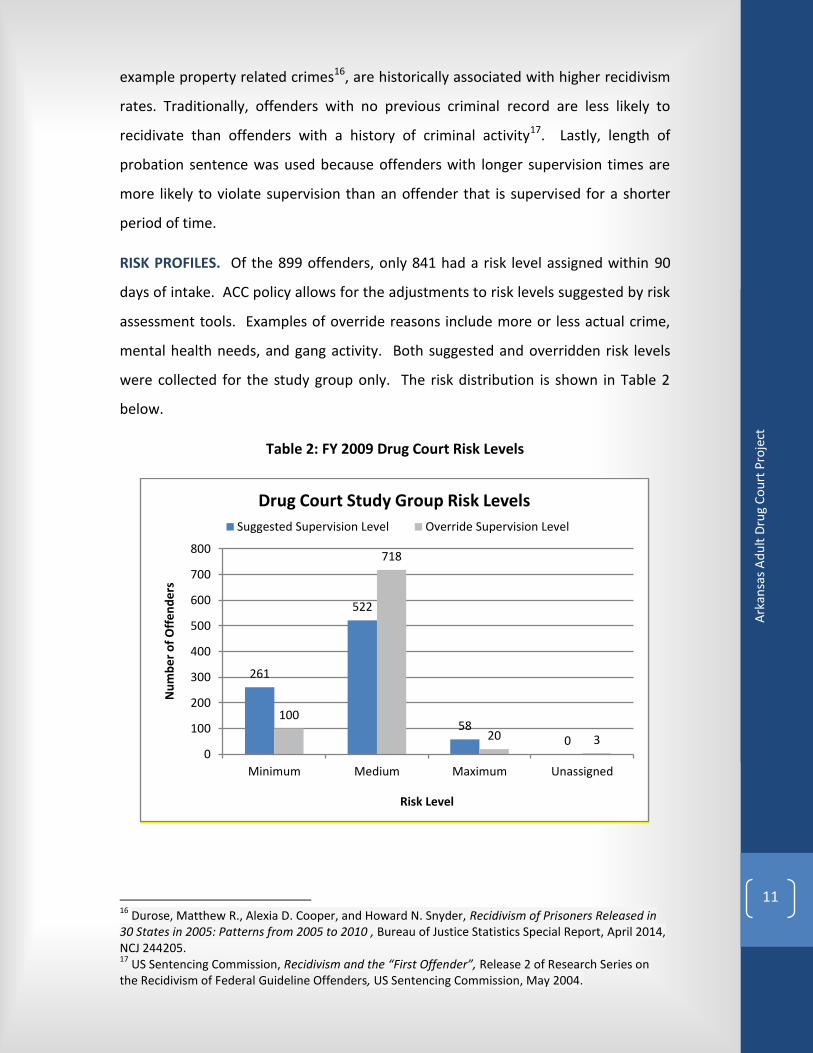
RISK PROFILES. Of the 899 offenders, only 841 had a risk level assigned within 90
days of intake. ACC policy allows for the adjustments to risk levels suggested by risk
assessment tools. Examples of override reasons include more or less actual crime,
mental health needs, and gang activity. Both suggested and overridden risk levels
were collected for the study group only. The risk distribution is shown in Table 2
below.
Table 2: FY 2009 Drug Court Risk Levels
16
Durose, Matthew R., Alexia D. Cooper, and Howard N. Snyder, Recidivism of Prisoners Released in 30 States in 2005: Patterns from 2005 to 2010 , Bureau of Justice Statistics Special Report, April 2014, NCJ 244205. 17
US Sentencing Commission, Recidivism and the “First Offender”, Release 2 of Research Series on the Recidivism of Federal Guideline Offenders, US Sentencing Commission, May 2004.
261
522
58 0
100
718
20 3 0
100
200
300
400
500
600
700
800
Minimum Medium Maximum Unassigned
Nu
mb
er
of
Off
en
de
rs
Risk Level
Drug Court Study Group Risk Levels
Suggested Supervision Level Override Supervision Level
12
Ark
ansa
s A
du
lt D
rug
Co
urt
Pro
ject
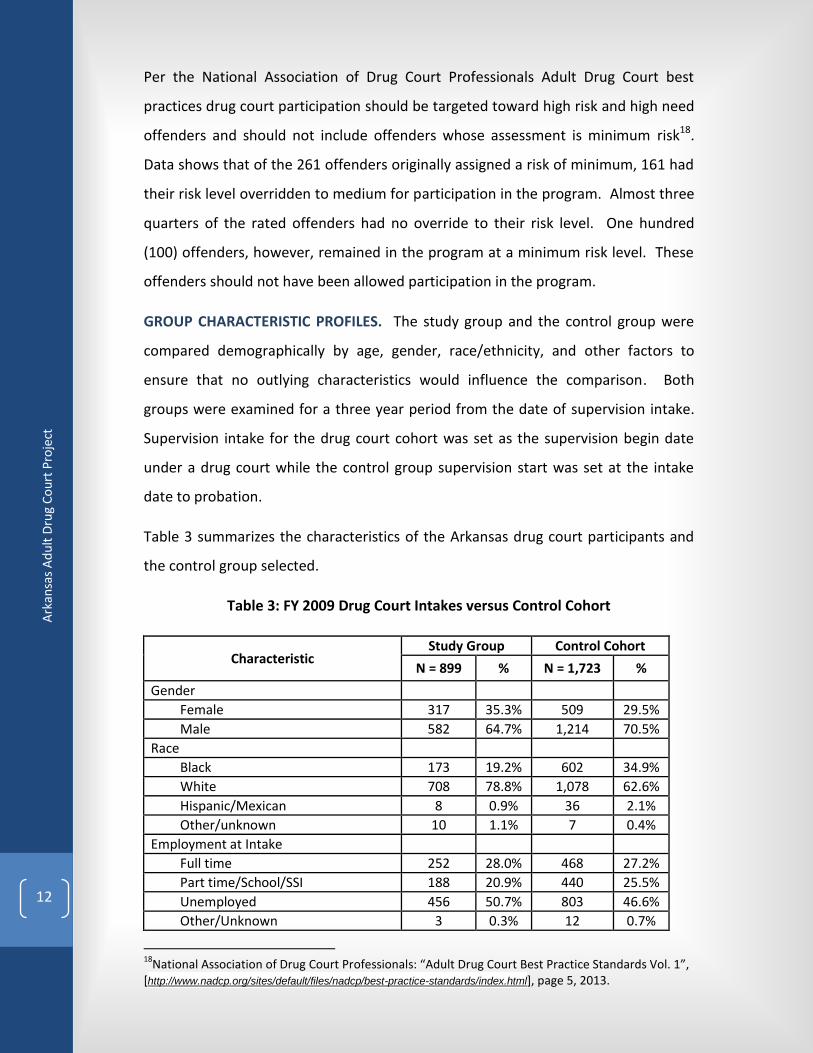
Per the National Association of Drug Court Professionals Adult Drug Court best
practices drug court participation should be targeted toward high risk and high need
offenders and should not include offenders whose assessment is minimum risk18.
Data shows that of the 261 offenders originally assigned a risk of minimum, 161 had
their risk level overridden to medium for participation in the program. Almost three
quarters of the rated offenders had no override to their risk level. One hundred
(100) offenders, however, remained in the program at a minimum risk level. These
offenders should not have been allowed participation in the program.
GROUP CHARACTERISTIC PROFILES. The study group and the control group were
compared demographically by age, gender, race/ethnicity, and other factors to
ensure that no outlying characteristics would influence the comparison. Both
groups were examined for a three year period from the date of supervision intake.
Supervision intake for the drug court cohort was set as the supervision begin date
under a drug court while the control group supervision start was set at the intake
date to probation.
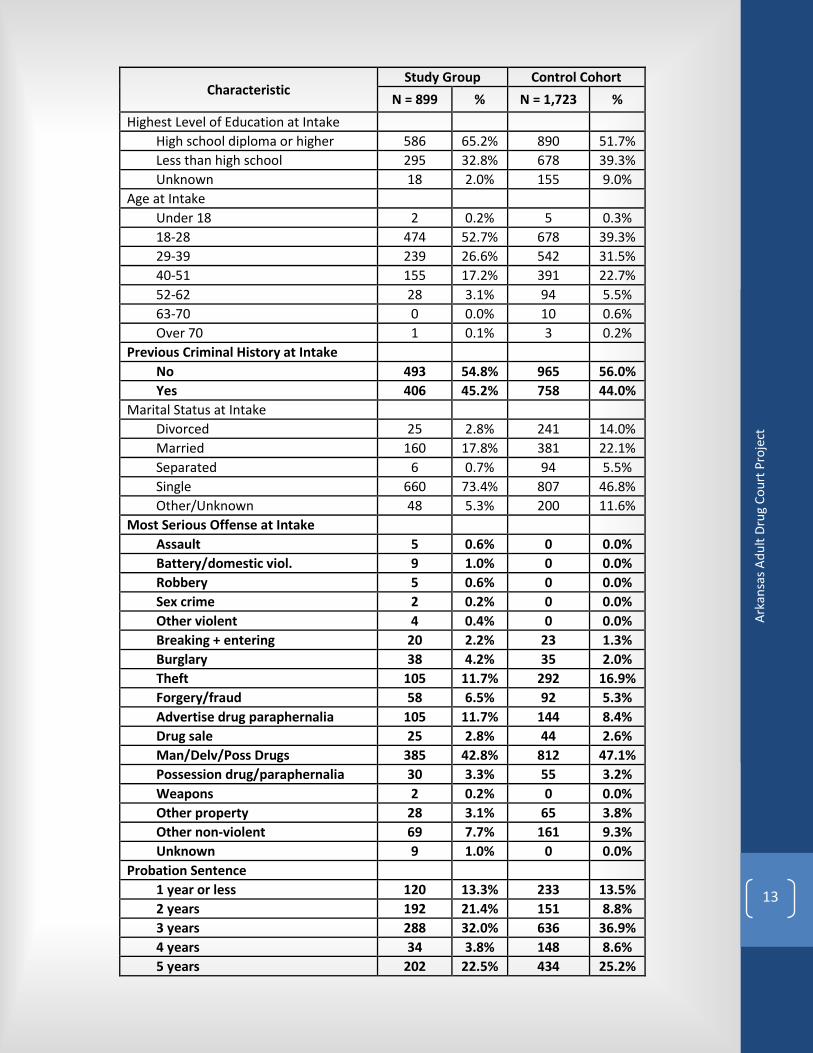
Table 3 summarizes the characteristics of the Arkansas drug court participants and
the control group selected.
Table 3: FY 2009 Drug Court Intakes versus Control Cohort
Characteristic Study Group Control Cohort
N = 899 % N = 1,723 %
Gender
Female 317 35.3% 509 29.5%
Male 582 64.7% 1,214 70.5%
Race
Black 173 19.2% 602 34.9%
White 708 78.8% 1,078 62.6%
Hispanic/Mexican 8 0.9% 36 2.1%
Other/unknown 10 1.1% 7 0.4%
Employment at Intake
Full time 252 28.0% 468 27.2%
Part time/School/SSI 188 20.9% 440 25.5%
Unemployed 456 50.7% 803 46.6%
Other/Unknown 3 0.3% 12 0.7%
18
National Association of Drug Court Professionals: “Adult Drug Court Best Practice Standards Vol. 1”, [http://www.nadcp.org/sites/default/files/nadcp/best-practice-standards/index.html], page 5, 2013.
13
Ark
ansa
s A
du
lt D
rug
Co
urt
Pro
ject
Characteristic Study Group Control Cohort
N = 899 % N = 1,723 %
Highest Level of Education at Intake
High school diploma or higher 586 65.2% 890 51.7%
Less than high school 295 32.8% 678 39.3%
Unknown 18 2.0% 155 9.0%
Age at Intake
Under 18 2 0.2% 5 0.3%
18-28 474 52.7% 678 39.3%
29-39 239 26.6% 542 31.5%
40-51 155 17.2% 391 22.7%
52-62 28 3.1% 94 5.5%
63-70 0 0.0% 10 0.6%
Over 70 1 0.1% 3 0.2%
Previous Criminal History at Intake
No 493 54.8% 965 56.0%
Yes 406 45.2% 758 44.0%
Marital Status at Intake
Divorced 25 2.8% 241 14.0%
Married 160 17.8% 381 22.1%
Separated 6 0.7% 94 5.5%
Single 660 73.4% 807 46.8%
Other/Unknown 48 5.3% 200 11.6%
Most Serious Offense at Intake
Assault 5 0.6% 0 0.0%
Battery/domestic viol. 9 1.0% 0 0.0%
Robbery 5 0.6% 0 0.0%
Sex crime 2 0.2% 0 0.0%
Other violent 4 0.4% 0 0.0%
Breaking + entering 20 2.2% 23 1.3%
Burglary 38 4.2% 35 2.0%
Theft 105 11.7% 292 16.9%
Forgery/fraud 58 6.5% 92 5.3%
Advertise drug paraphernalia 105 11.7% 144 8.4%
Drug sale 25 2.8% 44 2.6%
Man/Delv/Poss Drugs 385 42.8% 812 47.1%
Possession drug/paraphernalia 30 3.3% 55 3.2%
Weapons 2 0.2% 0 0.0%
Other property 28 3.1% 65 3.8%
Other non-violent 69 7.7% 161 9.3%
Unknown 9 1.0% 0 0.0%
Probation Sentence
1 year or less 120 13.3% 233 13.5%
2 years 192 21.4% 151 8.8%
3 years 288 32.0% 636 36.9%
4 years 34 3.8% 148 8.6%
5 years 202 22.5% 434 25.2%
14
Ark
ansa
s A
du
lt D
rug
Co
urt
Pro
ject
Characteristic Study Group Control Cohort
N = 899 % N = 1,723 %
6 years 18 2.0% 51 3.0%
7 years 4 0.4% 17 1.0%
8 years 1 0.1% 5 0.3%
9 years 0 0.0% 1 0.1%
10 years or more 36 4.0% 47 2.7%
Unknown 4 0.4% 0 0.0%
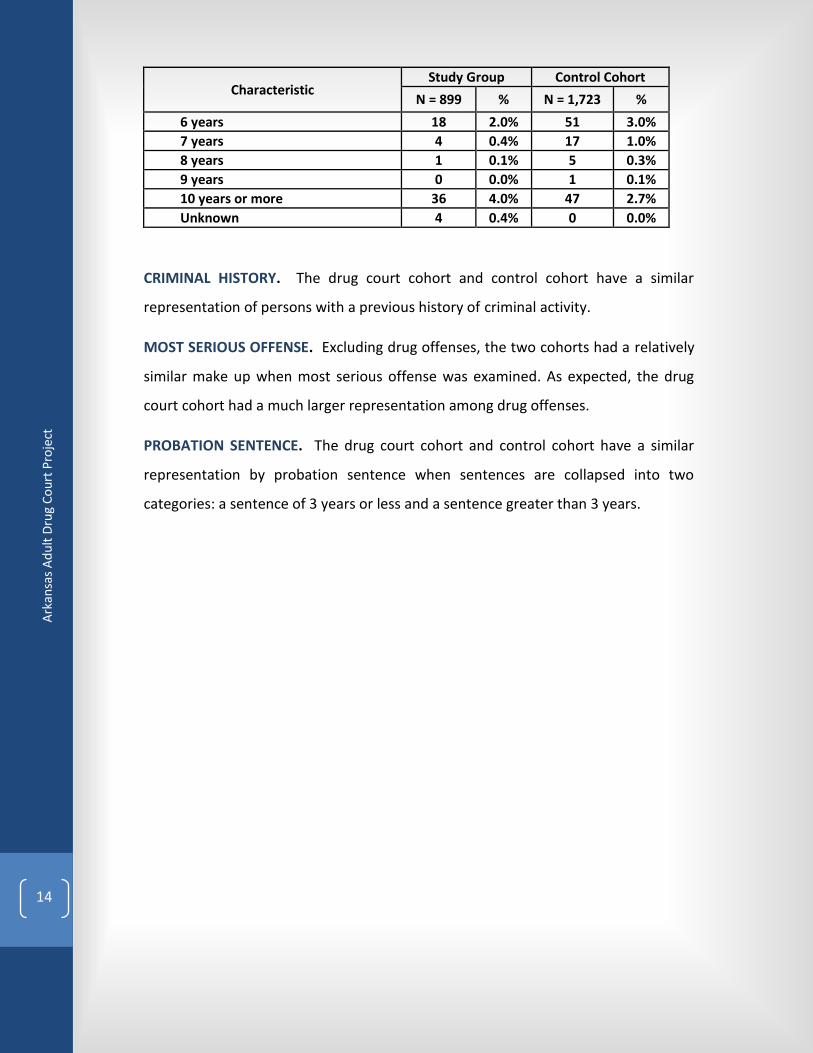
CRIMINAL HISTORY. The drug court cohort and control cohort have a similar
representation of persons with a previous history of criminal activity.
MOST SERIOUS OFFENSE. Excluding drug offenses, the two cohorts had a relatively
similar make up when most serious offense was examined. As expected, the drug
court cohort had a much larger representation among drug offenses.
PROBATION SENTENCE. The drug court cohort and control cohort have a similar
representation by probation sentence when sentences are collapsed into two
categories: a sentence of 3 years or less and a sentence greater than 3 years.
15
Ark
ansa
s A
du
lt D
rug
Co
urt
Pro
ject
III. DRUG COURT PERFORMANCE REVIEW
The role of drug courts is to reduce criminal behavior by reducing drug dependency.
The components of the performance review served to establish if the Arkansas drug
court system is successfully reducing drug dependency and relapse. Typical variables
related to successful reduction of drug use in drug court programs include the
number of judicial status hearings, judicial praise recognition, drug testing,
substance abuse treatment and supervision leverage through sanctions. Because of
limited availability of data and resources, only a few measures of performance were
available for examination. The following section discusses the results of the
measures tested and addresses factors where data was not available.
PERFORMANCE STANDARDS
Performance measurement and data collection were based on requirements from
the Public Safety Improvement Act of 2011, recommendations from the National
Center for State Courts, and Arkansas Statewide Technical Assistance Project:
Development of Statewide Drug Court Performance Measures (March 2008), the
Administrative Office of the Courts.
The selected performance measures were computed from intake to drug court until
exit from the program. These performance measures include recidivism, retention,
sobriety, and treatment units of service.
RECIDIVISM. While the behaviors of drug dependent offenders lend themselves to a
criminal lifestyle, other factors also contribute to recidivism. As discussed before,
these are primarily related to criminal history. Recidivism in this study is an
important performance measure for the overall drug court supervision process. This
study provides two measures of recidivism: re-arrest and incarceration.
Recidivism is defined as a criminal act that results in the re-arrest, re-conviction, or
return to incarceration of a person with or without a new sentence during a three-
year period following the person’s intake to supervision.19 Re-arrest is defined as any
arrest (felony or misdemeanor) occurring after the drug court/probation intake date
19
Arkansas Act 1030 of 2013, pg. 1.
16
Ark
ansa
s A
du
lt D
rug
Co
urt
Pro
ject
and before the three year follow up period. Within the data collected, a re-arrest
event is triggered by the first arrest date within the follow-up period.
Incarceration is defined as any incarceration occurring after the drug court/
probation intake date and before the end of the three year follow up period that
results in incarceration to prison or an ACC community correction center. A
placement in a Community Correction Center for short-term treatment is not the
result of a new conviction or revocation and is not considered an incarceration for
this study.
The recidivism rates for the FY 2009 drug court intakes are compared to the control
group cohort as a measure of the success of drug court supervision versus
“standard” supervision.
RETENTION. Retention was measured by length of stay of program participants who
graduated versus those who did not graduate. Non graduates include persons who
were terminated/unsuccessful, or exited the program by some other means
including transfer, voluntary withdrawal or discharge of sentence. Retention was
calculated as a percentage of the number of people who completed the drug court
program divided by those who enter the program during the study time frame.
SOBRIETY. Sobriety was measured by the percent of drug tests failed during and
after drug court participation. For this study, all drug screenings, both positive and
negative, were documented. Data allowed for the average number of failed tests
that a drug court participant incurred during the drug court program. For the
purpose of this study, a baseline of 30 days after intake was used to allow sufficient
time for drugs to leave the participant’s body before utilizing test results.
TREATMENT SERVICES. Treatment services offered to drug court participants during
their time enrolled in drug court were analyzed for benefits. Units (hours) of service
were used to document all services provided by drug court programs.
The data from these performance measures were used to gauge consistent and
meaningful recidivism impacts across a large number of sites over the three-year
17
Ark
ansa
s A
du
lt D
rug
Co
urt
Pro
ject
tracking period to determine successful graduation from drug courts, continued
sobriety, and reduced criminal activity.
RESULTS OF PERFORMANCE REVIEW
RECIDIVISM RESULTS. One of the major indicators of success of a drug court
program is recidivism. Policing strategies, prosecutor practices, and parole and
probation policies, along with other variations across the criminal justice system,
cause different kinds of drug courts to have varying rates of recidivism. Variations in
recidivism rates for separate drug courts may also be related to the level of
criminality targeted by the court’s admission criteria or the court’s size, location,
intensity of service provision, and planned duration of the program. Because of the
limited data available, detailed analysis of these characteristics and their impact on
recidivism for the various drug courts in Arkansas is not possible.
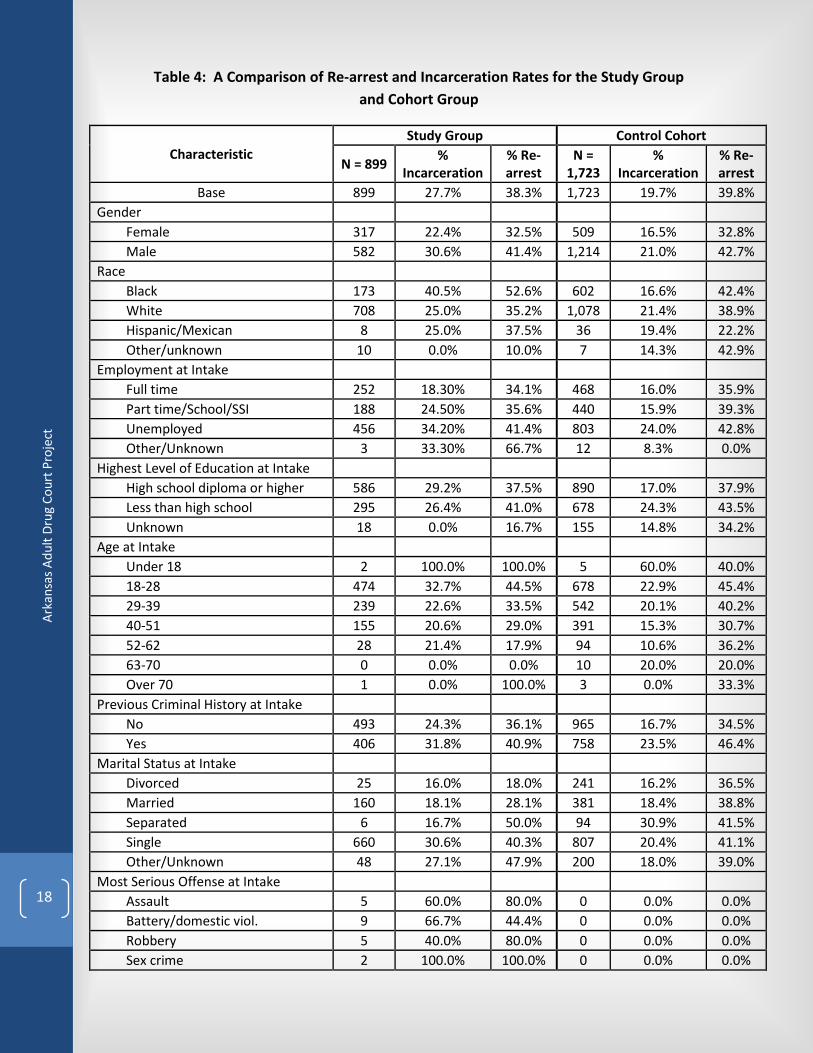
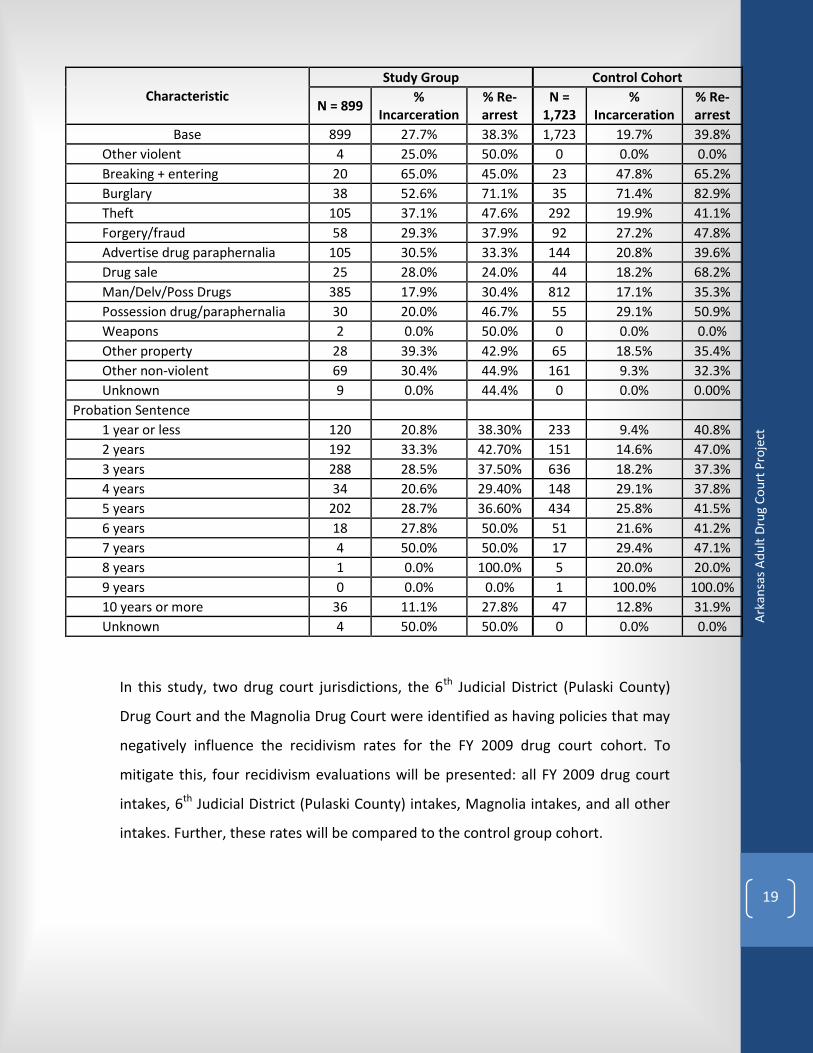
Table 4 below compares the re-arrest and incarceration rates of the study group and
the cohort probation offenders. Incarceration rates for the study group were higher
for the study group (27.7%) than the control cohort (19.7%). In contrast, the re-
arrest rate was lower in the drug cohort (38.3%) than the control cohort (39.8%).
For both groups, females consistently have a lower re-arrest and incarceration rate
than males.
18
Ark
ansa
s A
du
lt D
rug
Co
urt
Pro
ject
Table 4: A Comparison of Re-arrest and Incarceration Rates for the Study Group
and Cohort Group
Characteristic
Study Group Control Cohort
N = 899 %
Incarceration % Re-arrest
N = 1,723
% Incarceration
% Re-arrest
Base 899 27.7% 38.3% 1,723 19.7% 39.8%
Gender
Female 317 22.4% 32.5% 509 16.5% 32.8%
Male 582 30.6% 41.4% 1,214 21.0% 42.7%
Race
Black 173 40.5% 52.6% 602 16.6% 42.4%
White 708 25.0% 35.2% 1,078 21.4% 38.9%
Hispanic/Mexican 8 25.0% 37.5% 36 19.4% 22.2%
Other/unknown 10 0.0% 10.0% 7 14.3% 42.9%
Employment at Intake
Full time 252 18.30% 34.1% 468 16.0% 35.9%
Part time/School/SSI 188 24.50% 35.6% 440 15.9% 39.3%
Unemployed 456 34.20% 41.4% 803 24.0% 42.8%
Other/Unknown 3 33.30% 66.7% 12 8.3% 0.0%
Highest Level of Education at Intake
High school diploma or higher 586 29.2% 37.5% 890 17.0% 37.9%
Less than high school 295 26.4% 41.0% 678 24.3% 43.5%
Unknown 18 0.0% 16.7% 155 14.8% 34.2%
Age at Intake
Under 18 2 100.0% 100.0% 5 60.0% 40.0%
18-28 474 32.7% 44.5% 678 22.9% 45.4%
29-39 239 22.6% 33.5% 542 20.1% 40.2%
40-51 155 20.6% 29.0% 391 15.3% 30.7%
52-62 28 21.4% 17.9% 94 10.6% 36.2%
63-70 0 0.0% 0.0% 10 20.0% 20.0%
Over 70 1 0.0% 100.0% 3 0.0% 33.3%
Previous Criminal History at Intake
No 493 24.3% 36.1% 965 16.7% 34.5%
Yes 406 31.8% 40.9% 758 23.5% 46.4%
Marital Status at Intake
Divorced 25 16.0% 18.0% 241 16.2% 36.5%
Married 160 18.1% 28.1% 381 18.4% 38.8%
Separated 6 16.7% 50.0% 94 30.9% 41.5%
Single 660 30.6% 40.3% 807 20.4% 41.1%
Other/Unknown 48 27.1% 47.9% 200 18.0% 39.0%
Most Serious Offense at Intake
Assault 5 60.0% 80.0% 0 0.0% 0.0%
Battery/domestic viol. 9 66.7% 44.4% 0 0.0% 0.0%
Robbery 5 40.0% 80.0% 0 0.0% 0.0%
Sex crime 2 100.0% 100.0% 0 0.0% 0.0%
19
Ark
ansa
s A
du
lt D
rug
Co
urt
Pro
ject
Characteristic
Study Group Control Cohort
N = 899 %
Incarceration % Re-arrest
N = 1,723
% Incarceration
% Re-arrest
Base 899 27.7% 38.3% 1,723 19.7% 39.8%
Other violent 4 25.0% 50.0% 0 0.0% 0.0%
Breaking + entering 20 65.0% 45.0% 23 47.8% 65.2%
Burglary 38 52.6% 71.1% 35 71.4% 82.9%
Theft 105 37.1% 47.6% 292 19.9% 41.1%
Forgery/fraud 58 29.3% 37.9% 92 27.2% 47.8%
Advertise drug paraphernalia 105 30.5% 33.3% 144 20.8% 39.6%
Drug sale 25 28.0% 24.0% 44 18.2% 68.2%
Man/Delv/Poss Drugs 385 17.9% 30.4% 812 17.1% 35.3%
Possession drug/paraphernalia 30 20.0% 46.7% 55 29.1% 50.9%
Weapons 2 0.0% 50.0% 0 0.0% 0.0%
Other property 28 39.3% 42.9% 65 18.5% 35.4%
Other non-violent 69 30.4% 44.9% 161 9.3% 32.3%
Unknown 9 0.0% 44.4% 0 0.0% 0.00%
Probation Sentence
1 year or less 120 20.8% 38.30% 233 9.4% 40.8%
2 years 192 33.3% 42.70% 151 14.6% 47.0%
3 years 288 28.5% 37.50% 636 18.2% 37.3%
4 years 34 20.6% 29.40% 148 29.1% 37.8%
5 years 202 28.7% 36.60% 434 25.8% 41.5%
6 years 18 27.8% 50.0% 51 21.6% 41.2%
7 years 4 50.0% 50.0% 17 29.4% 47.1%
8 years 1 0.0% 100.0% 5 20.0% 20.0%
9 years 0 0.0% 0.0% 1 100.0% 100.0%
10 years or more 36 11.1% 27.8% 47 12.8% 31.9%
Unknown 4 50.0% 50.0% 0 0.0% 0.0%
In this study, two drug court jurisdictions, the 6th Judicial District (Pulaski County)
Drug Court and the Magnolia Drug Court were identified as having policies that may
negatively influence the recidivism rates for the FY 2009 drug court cohort. To
mitigate this, four recidivism evaluations will be presented: all FY 2009 drug court
intakes, 6th Judicial District (Pulaski County) intakes, Magnolia intakes, and all other
intakes. Further, these rates will be compared to the control group cohort.
20
Ark
ansa
s A
du
lt D
rug
Co
urt
Pro
ject
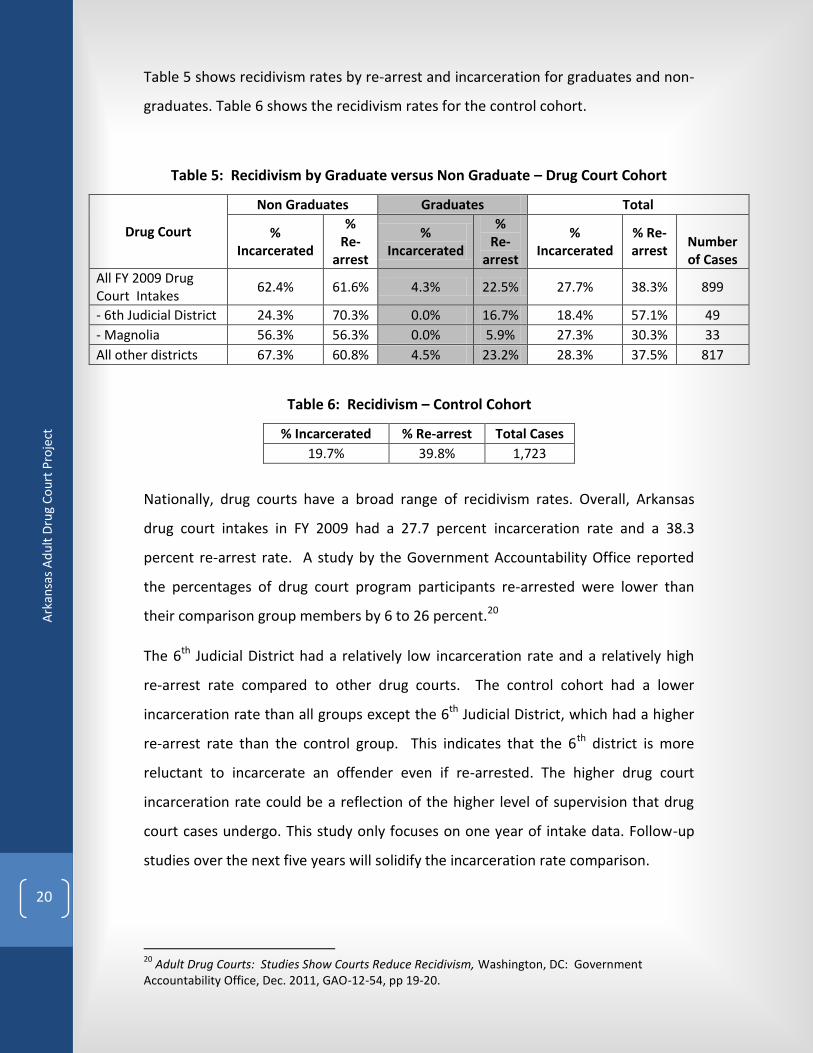
Table 5 shows recidivism rates by re-arrest and incarceration for graduates and non-
graduates. Table 6 shows the recidivism rates for the control cohort.
Table 5: Recidivism by Graduate versus Non Graduate – Drug Court Cohort
Drug Court
Non Graduates Graduates Total
% Incarcerated
% Re-
arrest
% Incarcerated
% Re-
arrest
% Incarcerated
% Re-arrest
Number of Cases
All FY 2009 Drug Court Intakes
62.4% 61.6% 4.3% 22.5% 27.7% 38.3% 899
- 6th Judicial District 24.3% 70.3% 0.0% 16.7% 18.4% 57.1% 49
- Magnolia 56.3% 56.3% 0.0% 5.9% 27.3% 30.3% 33
All other districts 67.3% 60.8% 4.5% 23.2% 28.3% 37.5% 817
Table 6: Recidivism – Control Cohort
% Incarcerated % Re-arrest Total Cases
19.7% 39.8% 1,723
Nationally, drug courts have a broad range of recidivism rates. Overall, Arkansas
drug court intakes in FY 2009 had a 27.7 percent incarceration rate and a 38.3
percent re-arrest rate. A study by the Government Accountability Office reported
the percentages of drug court program participants re-arrested were lower than
their comparison group members by 6 to 26 percent.20
The 6th Judicial District had a relatively low incarceration rate and a relatively high
re-arrest rate compared to other drug courts. The control cohort had a lower
incarceration rate than all groups except the 6th Judicial District, which had a higher
re-arrest rate than the control group. This indicates that the 6th district is more
reluctant to incarcerate an offender even if re-arrested. The higher drug court
incarceration rate could be a reflection of the higher level of supervision that drug
court cases undergo. This study only focuses on one year of intake data. Follow-up
studies over the next five years will solidify the incarceration rate comparison.
20
Adult Drug Courts: Studies Show Courts Reduce Recidivism, Washington, DC: Government Accountability Office, Dec. 2011, GAO-12-54, pp 19-20.
21
Ark
ansa
s A
du
lt D
rug
Co
urt
Pro
ject
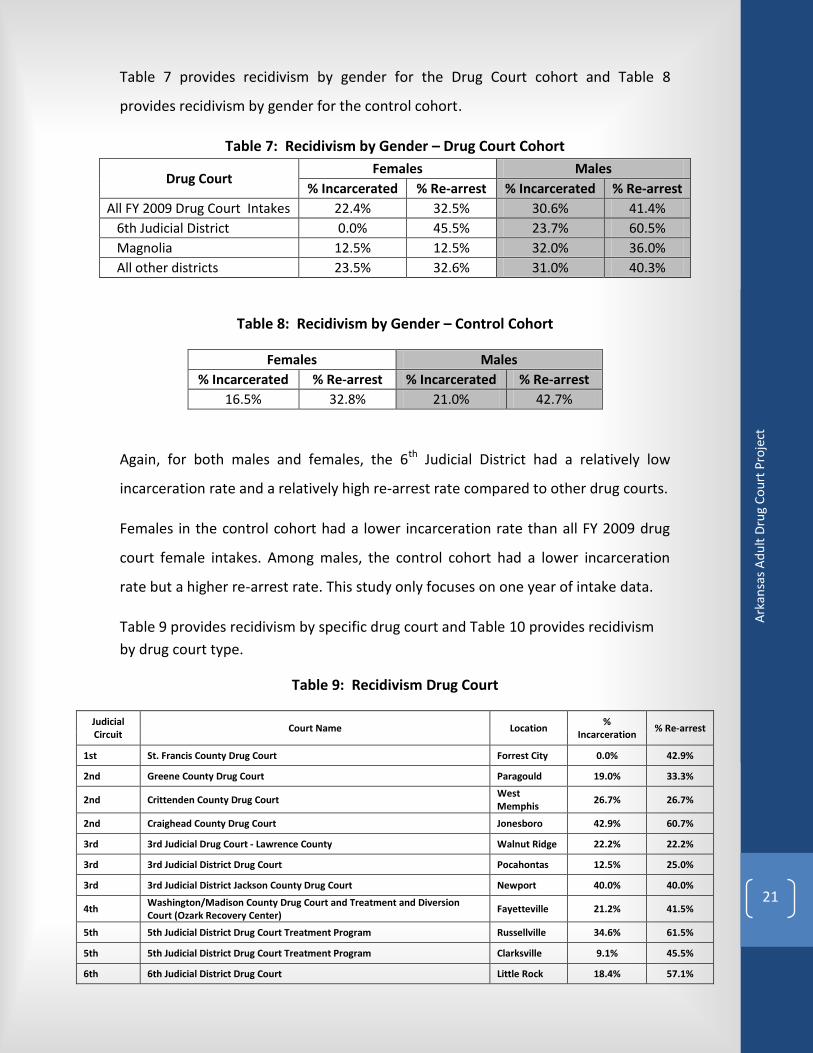
Table 7 provides recidivism by gender for the Drug Court cohort and Table 8
provides recidivism by gender for the control cohort.
Table 7: Recidivism by Gender – Drug Court Cohort
Drug Court Females Males
% Incarcerated % Re-arrest % Incarcerated % Re-arrest
All FY 2009 Drug Court Intakes 22.4% 32.5% 30.6% 41.4%
6th Judicial District 0.0% 45.5% 23.7% 60.5%
Magnolia 12.5% 12.5% 32.0% 36.0%
All other districts 23.5% 32.6% 31.0% 40.3%
Table 8: Recidivism by Gender – Control Cohort
Females Males
% Incarcerated % Re-arrest % Incarcerated % Re-arrest
16.5% 32.8% 21.0% 42.7%
Again, for both males and females, the 6th Judicial District had a relatively low
incarceration rate and a relatively high re-arrest rate compared to other drug courts.
Females in the control cohort had a lower incarceration rate than all FY 2009 drug
court female intakes. Among males, the control cohort had a lower incarceration
rate but a higher re-arrest rate. This study only focuses on one year of intake data.
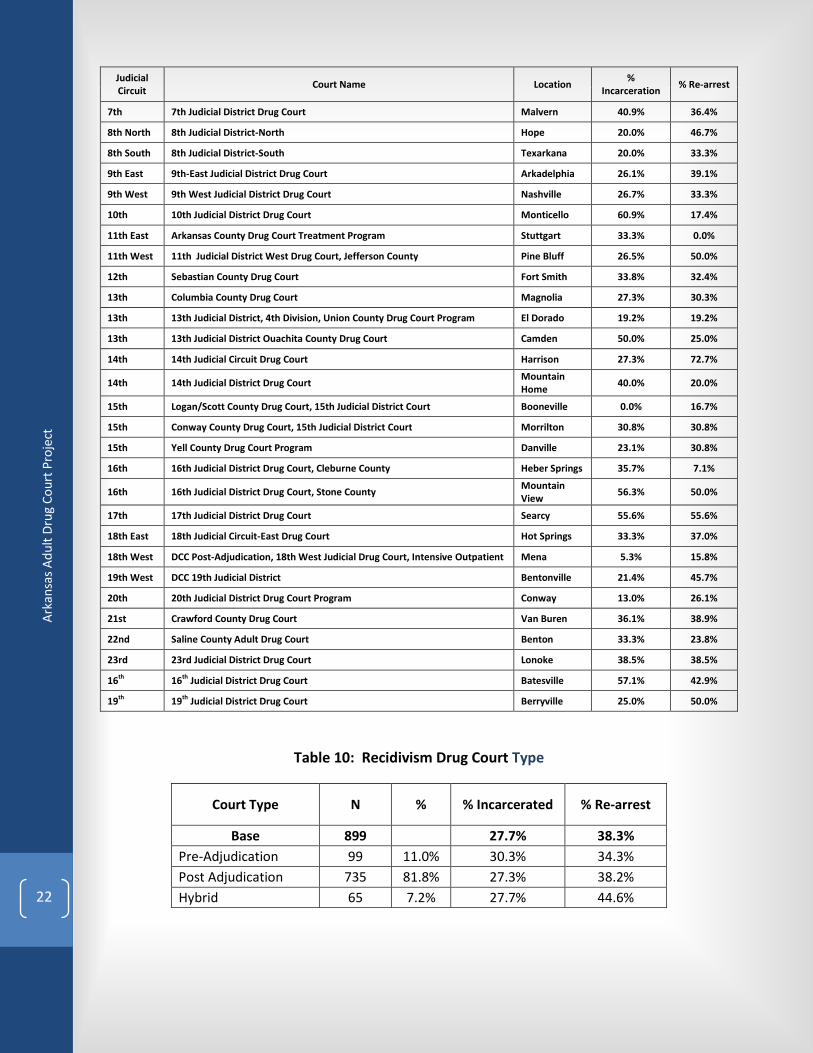
Table 9 provides recidivism by specific drug court and Table 10 provides recidivism
by drug court type.
Table 9: Recidivism Drug Court
Judicial Circuit
Court Name Location %
Incarceration % Re-arrest
1st St. Francis County Drug Court Forrest City 0.0% 42.9%
2nd Greene County Drug Court Paragould 19.0% 33.3%
2nd Crittenden County Drug Court West Memphis
26.7% 26.7%
2nd Craighead County Drug Court Jonesboro 42.9% 60.7%
3rd 3rd Judicial Drug Court - Lawrence County Walnut Ridge 22.2% 22.2%
3rd 3rd Judicial District Drug Court Pocahontas 12.5% 25.0%
3rd 3rd Judicial District Jackson County Drug Court Newport 40.0% 40.0%
4th Washington/Madison County Drug Court and Treatment and Diversion Court (Ozark Recovery Center)
Fayetteville 21.2% 41.5%
5th 5th Judicial District Drug Court Treatment Program Russellville 34.6% 61.5%
5th 5th Judicial District Drug Court Treatment Program Clarksville 9.1% 45.5%
6th 6th Judicial District Drug Court Little Rock 18.4% 57.1%
22
Ark
ansa
s A
du
lt D
rug
Co
urt
Pro
ject
Judicial Circuit
Court Name Location %
Incarceration % Re-arrest
7th 7th Judicial District Drug Court Malvern 40.9% 36.4%
8th North 8th Judicial District-North Hope 20.0% 46.7%
8th South 8th Judicial District-South Texarkana 20.0% 33.3%
9th East 9th-East Judicial District Drug Court Arkadelphia 26.1% 39.1%
9th West 9th West Judicial District Drug Court Nashville 26.7% 33.3%
10th 10th Judicial District Drug Court Monticello 60.9% 17.4%
11th East Arkansas County Drug Court Treatment Program Stuttgart 33.3% 0.0%
11th West 11th Judicial District West Drug Court, Jefferson County Pine Bluff 26.5% 50.0%
12th Sebastian County Drug Court Fort Smith 33.8% 32.4%
13th Columbia County Drug Court Magnolia 27.3% 30.3%
13th 13th Judicial District, 4th Division, Union County Drug Court Program El Dorado 19.2% 19.2%
13th 13th Judicial District Ouachita County Drug Court Camden 50.0% 25.0%
14th 14th Judicial Circuit Drug Court Harrison 27.3% 72.7%
14th 14th Judicial District Drug Court Mountain Home
40.0% 20.0%
15th Logan/Scott County Drug Court, 15th Judicial District Court Booneville 0.0% 16.7%
15th Conway County Drug Court, 15th Judicial District Court Morrilton 30.8% 30.8%
15th Yell County Drug Court Program Danville 23.1% 30.8%
16th 16th Judicial District Drug Court, Cleburne County Heber Springs 35.7% 7.1%
16th 16th Judicial District Drug Court, Stone County Mountain View
56.3% 50.0%
17th 17th Judicial District Drug Court Searcy 55.6% 55.6%
18th East 18th Judicial Circuit-East Drug Court Hot Springs 33.3% 37.0%
18th West DCC Post-Adjudication, 18th West Judicial Drug Court, Intensive Outpatient Mena 5.3% 15.8%
19th West DCC 19th Judicial District Bentonville 21.4% 45.7%
20th 20th Judicial District Drug Court Program Conway 13.0% 26.1%
21st Crawford County Drug Court Van Buren 36.1% 38.9%
22nd Saline County Adult Drug Court Benton 33.3% 23.8%
23rd 23rd Judicial District Drug Court Lonoke 38.5% 38.5%
16th 16th Judicial District Drug Court Batesville 57.1% 42.9%
19th 19th Judicial District Drug Court Berryville 25.0% 50.0%
Table 10: Recidivism Drug Court Type
Court Type N % % Incarcerated % Re-arrest
Base 899
27.7% 38.3%
Pre-Adjudication 99 11.0% 30.3% 34.3%
Post Adjudication 735 81.8% 27.3% 38.2%
Hybrid 65 7.2% 27.7% 44.6%
23
Ark
ansa
s A
du
lt D
rug
Co
urt
Pro
ject
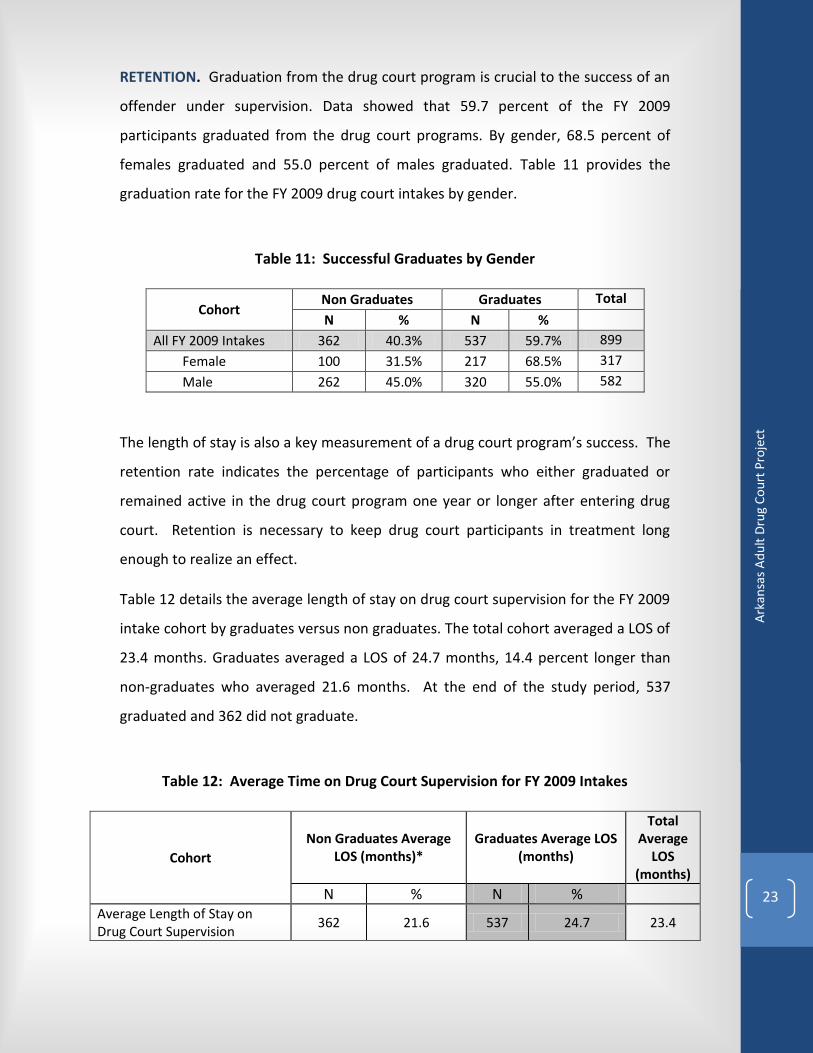
RETENTION. Graduation from the drug court program is crucial to the success of an
offender under supervision. Data showed that 59.7 percent of the FY 2009
participants graduated from the drug court programs. By gender, 68.5 percent of
females graduated and 55.0 percent of males graduated. Table 11 provides the
graduation rate for the FY 2009 drug court intakes by gender.
Table 11: Successful Graduates by Gender
Cohort Non Graduates Graduates Total
N % N %
All FY 2009 Intakes 362 40.3% 537 59.7% 899
Female 100 31.5% 217 68.5% 317
Male 262 45.0% 320 55.0% 582
The length of stay is also a key measurement of a drug court program’s success. The
retention rate indicates the percentage of participants who either graduated or
remained active in the drug court program one year or longer after entering drug
court. Retention is necessary to keep drug court participants in treatment long
enough to realize an effect.
Table 12 details the average length of stay on drug court supervision for the FY 2009
intake cohort by graduates versus non graduates. The total cohort averaged a LOS of
23.4 months. Graduates averaged a LOS of 24.7 months, 14.4 percent longer than
non-graduates who averaged 21.6 months. At the end of the study period, 537
graduated and 362 did not graduate.
Table 12: Average Time on Drug Court Supervision for FY 2009 Intakes
Cohort
Non Graduates Average LOS (months)*
Graduates Average LOS (months)
Total Average
LOS (months)
N % N % Average Length of Stay on Drug Court Supervision
362 21.6 537 24.7 23.4
24
Ark
ansa
s A
du
lt D
rug
Co
urt
Pro
ject
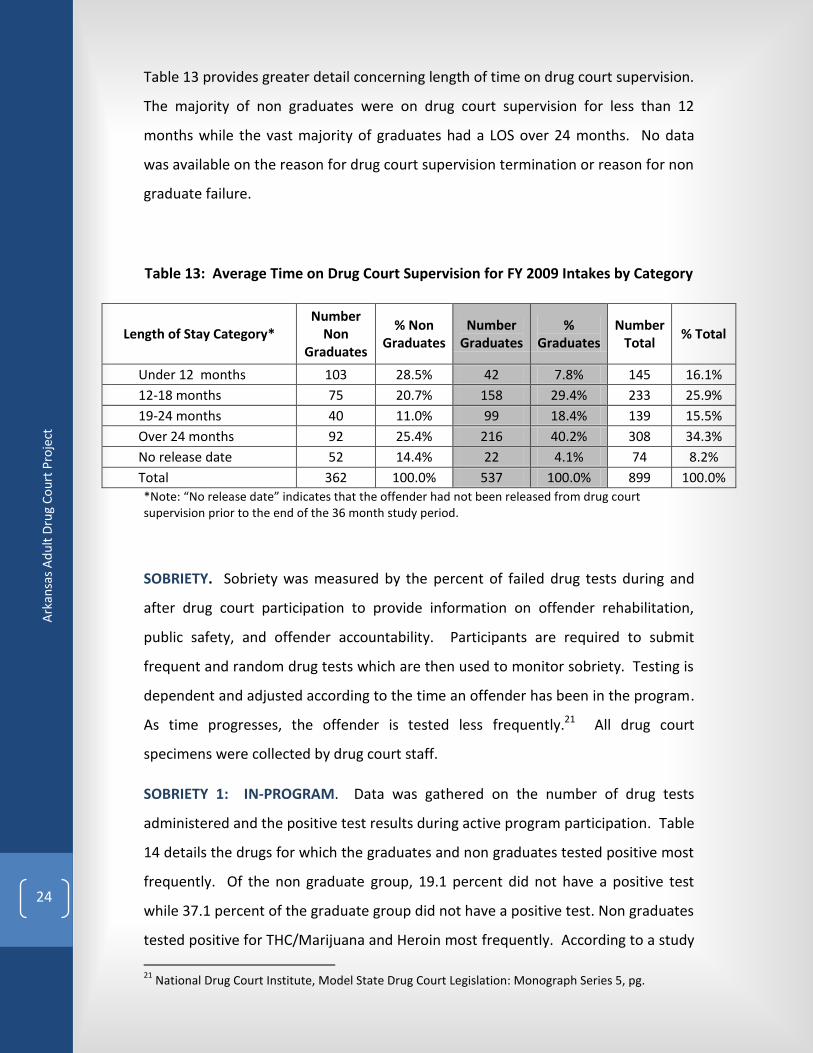
Table 13 provides greater detail concerning length of time on drug court supervision.
The majority of non graduates were on drug court supervision for less than 12
months while the vast majority of graduates had a LOS over 24 months. No data
was available on the reason for drug court supervision termination or reason for non
graduate failure.
Table 13: Average Time on Drug Court Supervision for FY 2009 Intakes by Category
Length of Stay Category* Number
Non Graduates
% Non Graduates
Number Graduates
% Graduates
Number Total
% Total
Under 12 months 103 28.5% 42 7.8% 145 16.1%
12-18 months 75 20.7% 158 29.4% 233 25.9%
19-24 months 40 11.0% 99 18.4% 139 15.5%
Over 24 months 92 25.4% 216 40.2% 308 34.3%
No release date 52 14.4% 22 4.1% 74 8.2%
Total 362 100.0% 537 100.0% 899 100.0%
*Note: “No release date” indicates that the offender had not been released from drug court supervision prior to the end of the 36 month study period.
SOBRIETY. Sobriety was measured by the percent of failed drug tests during and
after drug court participation to provide information on offender rehabilitation,
public safety, and offender accountability. Participants are required to submit
frequent and random drug tests which are then used to monitor sobriety. Testing is
dependent and adjusted according to the time an offender has been in the program.
As time progresses, the offender is tested less frequently.21 All drug court
specimens were collected by drug court staff.
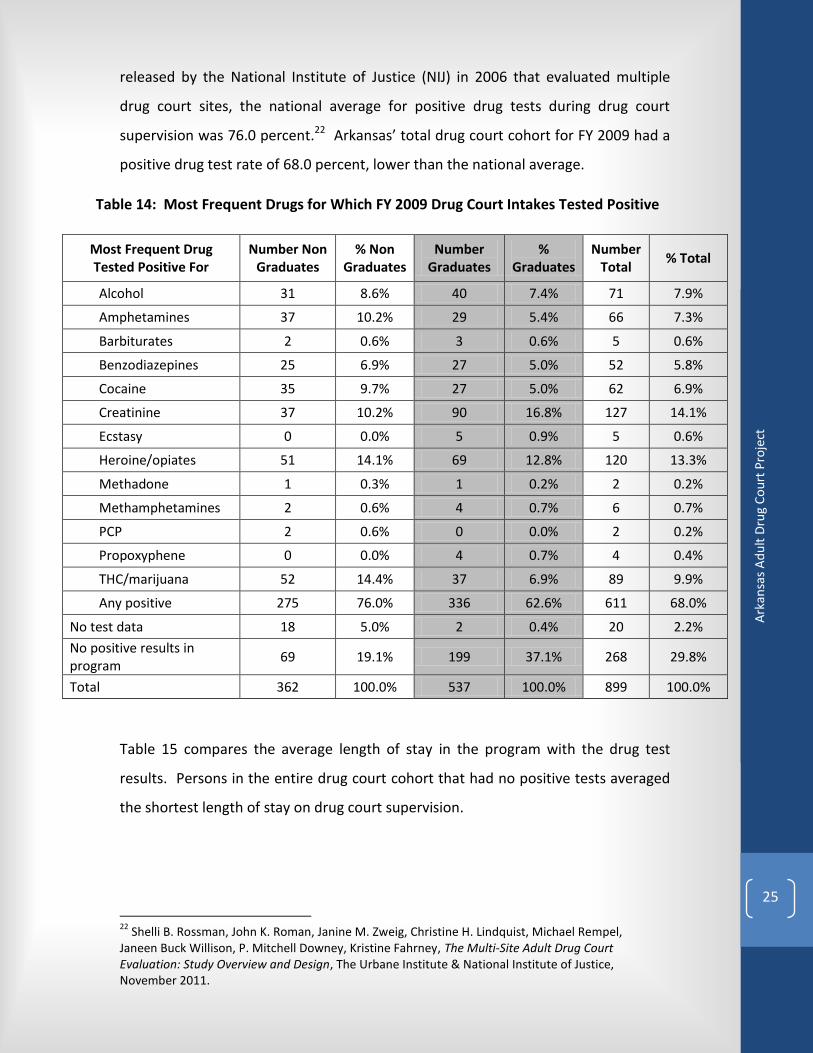
SOBRIETY 1: IN-PROGRAM. Data was gathered on the number of drug tests
administered and the positive test results during active program participation. Table
14 details the drugs for which the graduates and non graduates tested positive most
frequently. Of the non graduate group, 19.1 percent did not have a positive test
while 37.1 percent of the graduate group did not have a positive test. Non graduates
tested positive for THC/Marijuana and Heroin most frequently. According to a study
21
National Drug Court Institute, Model State Drug Court Legislation: Monograph Series 5, pg.
25
Ark
ansa
s A
du
lt D
rug
Co
urt
Pro
ject
released by the National Institute of Justice (NIJ) in 2006 that evaluated multiple
drug court sites, the national average for positive drug tests during drug court
supervision was 76.0 percent.22 Arkansas’ total drug court cohort for FY 2009 had a
positive drug test rate of 68.0 percent, lower than the national average.
Table 14: Most Frequent Drugs for Which FY 2009 Drug Court Intakes Tested Positive
Most Frequent Drug Tested Positive For
Number Non Graduates
% Non Graduates
Number Graduates
% Graduates
Number Total
% Total
Alcohol 31 8.6% 40 7.4% 71 7.9%
Amphetamines 37 10.2% 29 5.4% 66 7.3%
Barbiturates 2 0.6% 3 0.6% 5 0.6%
Benzodiazepines 25 6.9% 27 5.0% 52 5.8%
Cocaine 35 9.7% 27 5.0% 62 6.9%
Creatinine 37 10.2% 90 16.8% 127 14.1%
Ecstasy 0 0.0% 5 0.9% 5 0.6%
Heroine/opiates 51 14.1% 69 12.8% 120 13.3%
Methadone 1 0.3% 1 0.2% 2 0.2%
Methamphetamines 2 0.6% 4 0.7% 6 0.7%
PCP 2 0.6% 0 0.0% 2 0.2%
Propoxyphene 0 0.0% 4 0.7% 4 0.4%
THC/marijuana 52 14.4% 37 6.9% 89 9.9%
Any positive 275 76.0% 336 62.6% 611 68.0%
No test data 18 5.0% 2 0.4% 20 2.2%
No positive results in program
69 19.1% 199 37.1% 268 29.8%
Total 362 100.0% 537 100.0% 899 100.0%
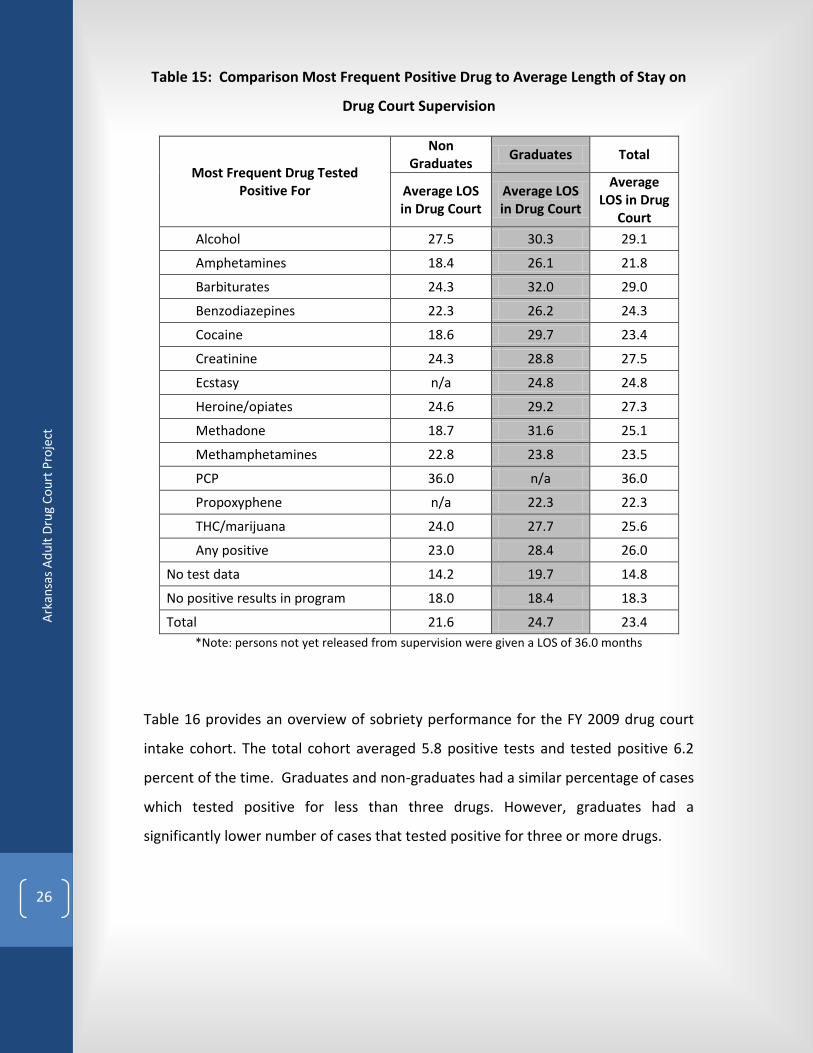
Table 15 compares the average length of stay in the program with the drug test
results. Persons in the entire drug court cohort that had no positive tests averaged
the shortest length of stay on drug court supervision.
22
Shelli B. Rossman, John K. Roman, Janine M. Zweig, Christine H. Lindquist, Michael Rempel, Janeen Buck Willison, P. Mitchell Downey, Kristine Fahrney, The Multi-Site Adult Drug Court Evaluation: Study Overview and Design, The Urbane Institute & National Institute of Justice, November 2011.
26
Ark
ansa
s A
du
lt D
rug
Co
urt
Pro
ject
Table 15: Comparison Most Frequent Positive Drug to Average Length of Stay on
Drug Court Supervision
Most Frequent Drug Tested Positive For
Non Graduates
Graduates Total
Average LOS in Drug Court
Average LOS in Drug Court
Average LOS in Drug
Court
Alcohol 27.5 30.3 29.1
Amphetamines 18.4 26.1 21.8
Barbiturates 24.3 32.0 29.0
Benzodiazepines 22.3 26.2 24.3
Cocaine 18.6 29.7 23.4
Creatinine 24.3 28.8 27.5
Ecstasy n/a 24.8 24.8
Heroine/opiates 24.6 29.2 27.3
Methadone 18.7 31.6 25.1
Methamphetamines 22.8 23.8 23.5
PCP 36.0 n/a 36.0
Propoxyphene n/a 22.3 22.3
THC/marijuana 24.0 27.7 25.6
Any positive 23.0 28.4 26.0
No test data 14.2 19.7 14.8
No positive results in program 18.0 18.4 18.3
Total 21.6 24.7 23.4
*Note: persons not yet released from supervision were given a LOS of 36.0 months
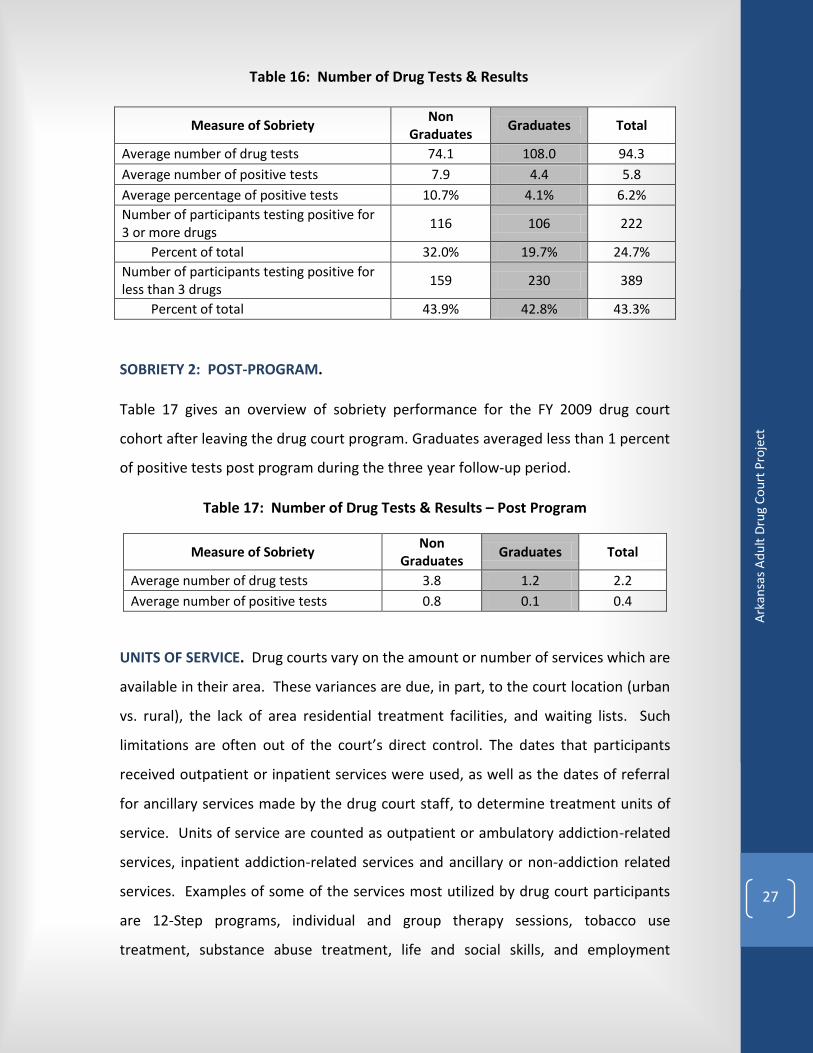
Table 16 provides an overview of sobriety performance for the FY 2009 drug court
intake cohort. The total cohort averaged 5.8 positive tests and tested positive 6.2
percent of the time. Graduates and non-graduates had a similar percentage of cases
which tested positive for less than three drugs. However, graduates had a
significantly lower number of cases that tested positive for three or more drugs.
27
Ark
ansa
s A
du
lt D
rug
Co
urt
Pro
ject
Table 16: Number of Drug Tests & Results
Measure of Sobriety Non
Graduates Graduates Total
Average number of drug tests 74.1 108.0 94.3
Average number of positive tests 7.9 4.4 5.8
Average percentage of positive tests 10.7% 4.1% 6.2%
Number of participants testing positive for 3 or more drugs
116 106 222
Percent of total 32.0% 19.7% 24.7%
Number of participants testing positive for less than 3 drugs
159 230 389
Percent of total 43.9% 42.8% 43.3%
SOBRIETY 2: POST-PROGRAM.
Table 17 gives an overview of sobriety performance for the FY 2009 drug court
cohort after leaving the drug court program. Graduates averaged less than 1 percent
of positive tests post program during the three year follow-up period.
Table 17: Number of Drug Tests & Results – Post Program
Measure of Sobriety Non
Graduates Graduates Total
Average number of drug tests 3.8 1.2 2.2
Average number of positive tests 0.8 0.1 0.4
UNITS OF SERVICE. Drug courts vary on the amount or number of services which are
available in their area. These variances are due, in part, to the court location (urban
vs. rural), the lack of area residential treatment facilities, and waiting lists. Such
limitations are often out of the court’s direct control. The dates that participants
received outpatient or inpatient services were used, as well as the dates of referral
for ancillary services made by the drug court staff, to determine treatment units of
service. Units of service are counted as outpatient or ambulatory addiction-related
services, inpatient addiction-related services and ancillary or non-addiction related
services. Examples of some of the services most utilized by drug court participants
are 12-Step programs, individual and group therapy sessions, tobacco use
treatment, substance abuse treatment, life and social skills, and employment
28
Ark
ansa
s A
du
lt D
rug
Co
urt
Pro
ject
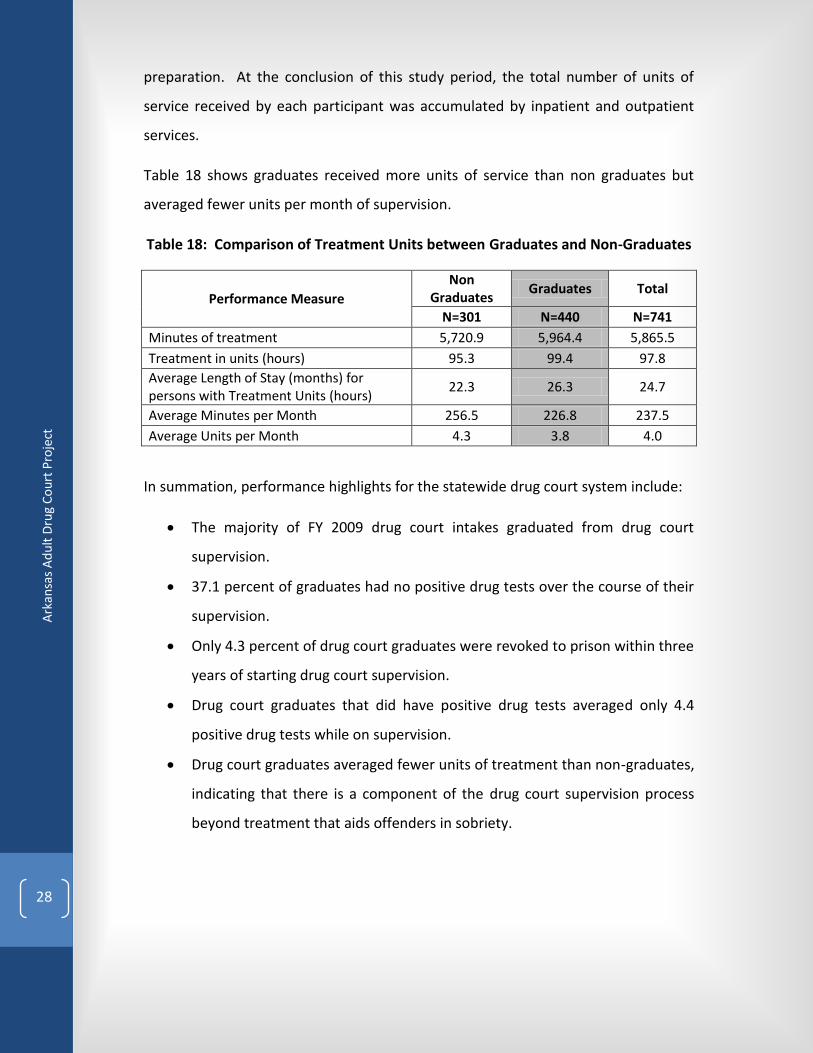
preparation. At the conclusion of this study period, the total number of units of
service received by each participant was accumulated by inpatient and outpatient
services.
Table 18 shows graduates received more units of service than non graduates but
averaged fewer units per month of supervision.
Table 18: Comparison of Treatment Units between Graduates and Non-Graduates
Performance Measure
Non Graduates
Graduates Total
N=301 N=440 N=741
Minutes of treatment 5,720.9 5,964.4 5,865.5
Treatment in units (hours) 95.3 99.4 97.8
Average Length of Stay (months) for persons with Treatment Units (hours)
22.3 26.3 24.7
Average Minutes per Month 256.5 226.8 237.5
Average Units per Month 4.3 3.8 4.0
In summation, performance highlights for the statewide drug court system include:
The majority of FY 2009 drug court intakes graduated from drug court
supervision.
37.1 percent of graduates had no positive drug tests over the course of their
supervision.
Only 4.3 percent of drug court graduates were revoked to prison within three
years of starting drug court supervision.
Drug court graduates that did have positive drug tests averaged only 4.4
positive drug tests while on supervision.
Drug court graduates averaged fewer units of treatment than non-graduates,
indicating that there is a component of the drug court supervision process
beyond treatment that aids offenders in sobriety.
29
Ark
ansa
s A
du
lt D
rug
Co
urt
Pro
ject
IV. COST BENEFIT ANALYSIS
COST BENEFIT ANALYSIS. The bottom line for any program is whether its
investment of additional resources put in the program is worth the added costs of
operating such a program. A comprehensive cost-benefit analysis can help answer
these questions but a simple cost-benefit assessment may only tell part of the story.
A cost-benefit analysis can support whether there is a return on each dollar spent on
the program over the cost of incarceration. A positive outcome indicates that
taxpayers would have spent more on incarceration for offenders processed in a
traditional court setting than they would in the drug court. The cost benefit outcome
for this report utilizes a combination of diversion and recidivism as a measure of
impact. Although a traditional and easily quantifiable measure of cost savings, this
form of analysis fails to factor in more complex and harder to identify measures like
social productivity, medical and mental health public service usage, government
financial support reliance and broader criminal justice system costs like crimes
committed and arrests. Strategies for identifying and quantifying such social
impacts could be considered for future studies. It is recommended, however, that
these be researched further and taken into account before making significant
changes to drug courts in Arkansas.
CALCULATING THE COST OF DRUG COURTS
The primary way that a drug court can save, or more correctly avert, state
expenditures is to divert people who would have been incarcerated, had the drug
court not existed. Additional cost savings can occur if there is evidence that persons
going through the program have lower recidivism rates. To quantify these measures,
two cost analysis estimates were calculated:
1. The diversion costs per day for a drug court participant compared to daily
incarceration rates of the ADC, the daily incarceration rates for an ACC
facility and ACC’s daily probation supervision rate;
2. The recidivism cost impact associated with the difference between re-
arrest and return to incarceration rates of drug court participants
compared with regular probationers.
30
Ark
ansa
s A
du
lt D
rug
Co
urt
Pro
ject
Quality assurance techniques were implemented to verify data integrity and
reporting accuracy.
DIVERSION COSTS. For the purpose of this report, diversion costs were estimated
by comparing the costs of an offender serving in a drug court program with the costs
that offender would have incurred if the drug court program was not available. In
order to calculate these costs, assumptions were made regarding costs of programs
and likelihood of non-drug court placement. Tables 19-21 summarize each step of
this cost estimation.
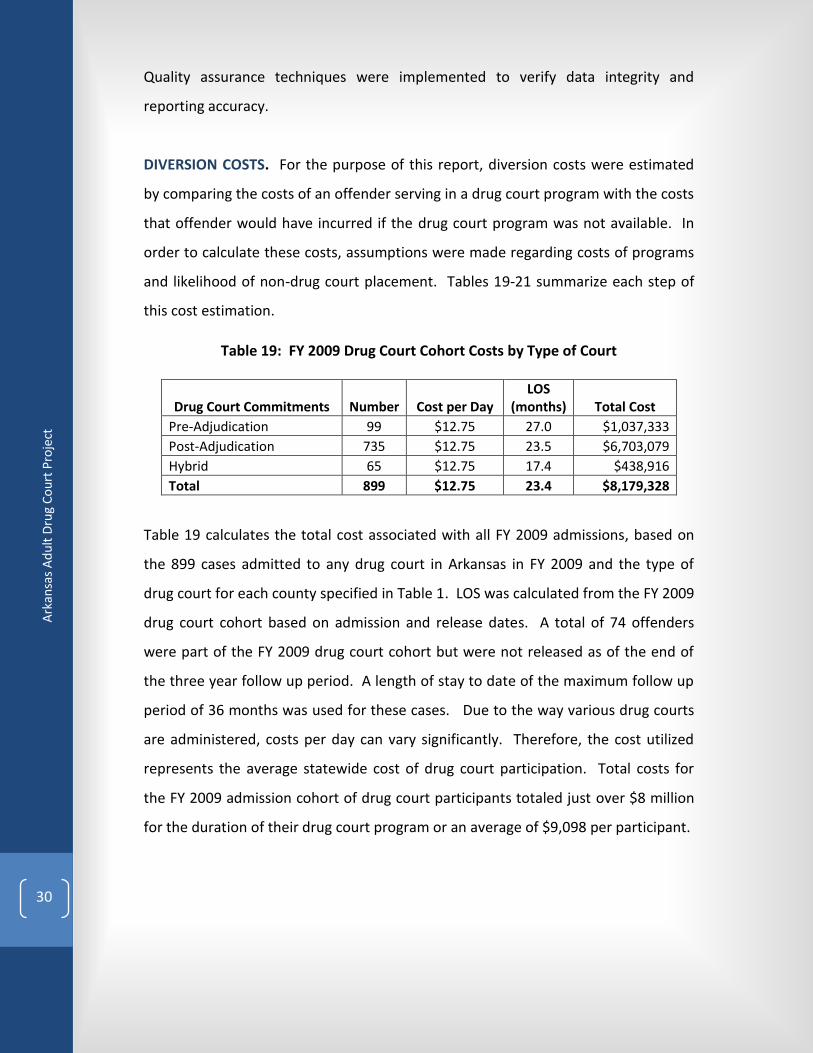
Table 19: FY 2009 Drug Court Cohort Costs by Type of Court
Drug Court Commitments Number Cost per Day LOS
(months) Total Cost
Pre-Adjudication 99 $12.75 27.0 $1,037,333
Post-Adjudication 735 $12.75 23.5 $6,703,079
Hybrid 65 $12.75 17.4 $438,916
Total 899 $12.75 23.4 $8,179,328
Table 19 calculates the total cost associated with all FY 2009 admissions, based on
the 899 cases admitted to any drug court in Arkansas in FY 2009 and the type of
drug court for each county specified in Table 1. LOS was calculated from the FY 2009
drug court cohort based on admission and release dates. A total of 74 offenders
were part of the FY 2009 drug court cohort but were not released as of the end of
the three year follow up period. A length of stay to date of the maximum follow up
period of 36 months was used for these cases. Due to the way various drug courts
are administered, costs per day can vary significantly. Therefore, the cost utilized
represents the average statewide cost of drug court participation. Total costs for
the FY 2009 admission cohort of drug court participants totaled just over $8 million
for the duration of their drug court program or an average of $9,098 per participant.
31
Ark
ansa
s A
du
lt D
rug
Co
urt
Pro
ject
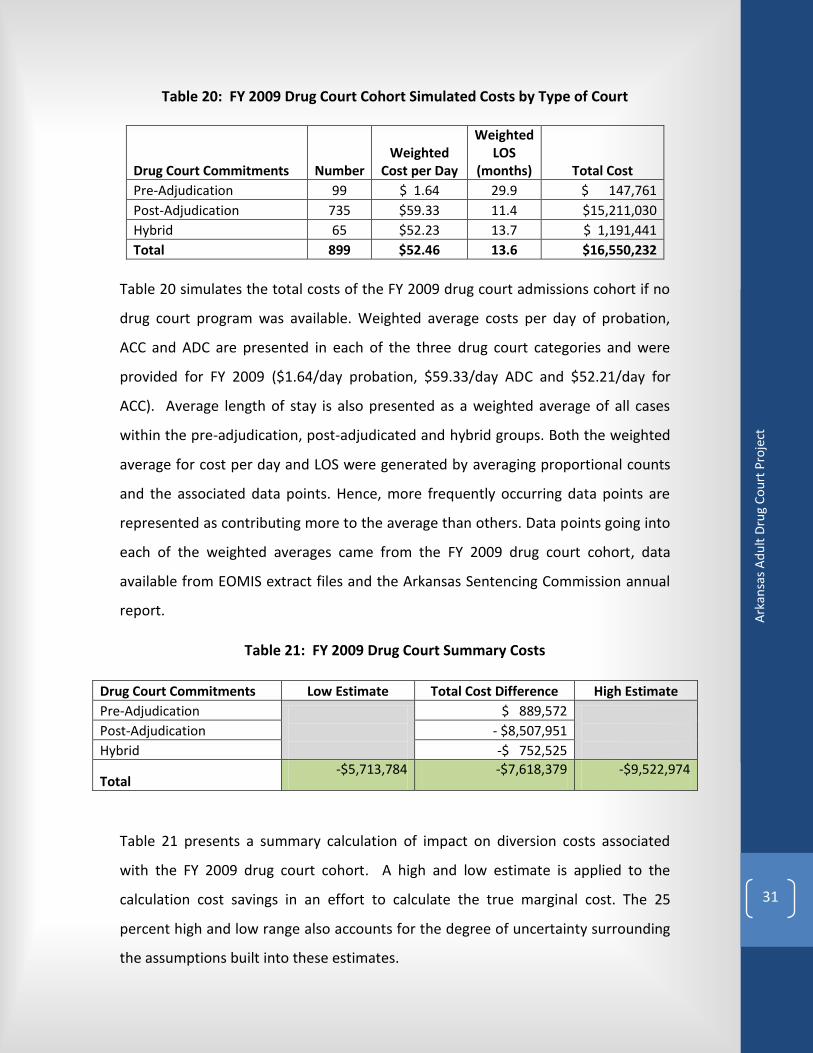
Table 20: FY 2009 Drug Court Cohort Simulated Costs by Type of Court
Drug Court Commitments Number Weighted
Cost per Day
Weighted LOS
(months) Total Cost
Pre-Adjudication 99 $ 1.64 29.9 $ 147,761
Post-Adjudication 735 $59.33 11.4 $15,211,030
Hybrid 65 $52.23 13.7 $ 1,191,441
Total 899 $52.46 13.6 $16,550,232
Table 20 simulates the total costs of the FY 2009 drug court admissions cohort if no
drug court program was available. Weighted average costs per day of probation,
ACC and ADC are presented in each of the three drug court categories and were
provided for FY 2009 ($1.64/day probation, $59.33/day ADC and $52.21/day for
ACC). Average length of stay is also presented as a weighted average of all cases
within the pre-adjudication, post-adjudicated and hybrid groups. Both the weighted
average for cost per day and LOS were generated by averaging proportional counts
and the associated data points. Hence, more frequently occurring data points are
represented as contributing more to the average than others. Data points going into
each of the weighted averages came from the FY 2009 drug court cohort, data
available from EOMIS extract files and the Arkansas Sentencing Commission annual
report.
Table 21: FY 2009 Drug Court Summary Costs
Drug Court Commitments Low Estimate Total Cost Difference High Estimate
Pre-Adjudication
$ 889,572
Post-Adjudication - $8,507,951
Hybrid -$ 752,525
Total -$5,713,784 -$7,618,379 -$9,522,974
Table 21 presents a summary calculation of impact on diversion costs associated
with the FY 2009 drug court cohort. A high and low estimate is applied to the
calculation cost savings in an effort to calculate the true marginal cost. The 25
percent high and low range also accounts for the degree of uncertainty surrounding
the assumptions built into these estimates.
32
Ark
ansa
s A
du
lt D
rug
Co
urt
Pro
ject
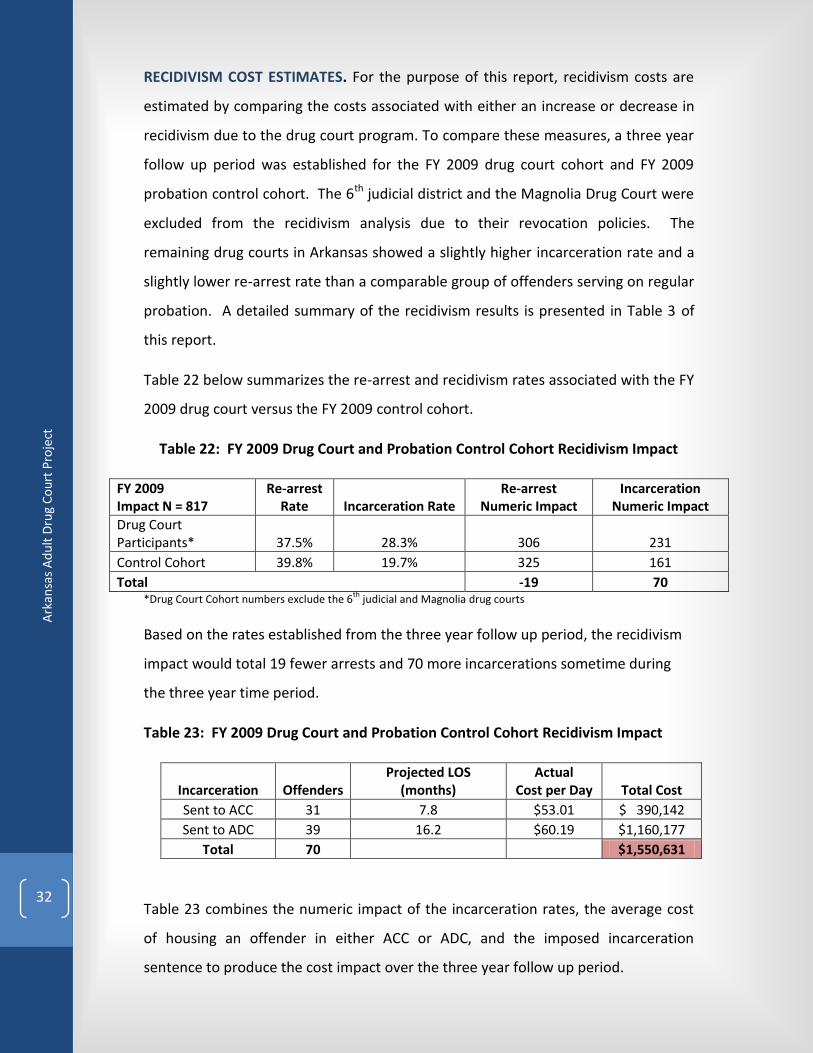
RECIDIVISM COST ESTIMATES. For the purpose of this report, recidivism costs are
estimated by comparing the costs associated with either an increase or decrease in
recidivism due to the drug court program. To compare these measures, a three year
follow up period was established for the FY 2009 drug court cohort and FY 2009
probation control cohort. The 6th judicial district and the Magnolia Drug Court were
excluded from the recidivism analysis due to their revocation policies. The
remaining drug courts in Arkansas showed a slightly higher incarceration rate and a
slightly lower re-arrest rate than a comparable group of offenders serving on regular
probation. A detailed summary of the recidivism results is presented in Table 3 of
this report.
Table 22 below summarizes the re-arrest and recidivism rates associated with the FY
2009 drug court versus the FY 2009 control cohort.
Table 22: FY 2009 Drug Court and Probation Control Cohort Recidivism Impact
FY 2009 Impact N = 817
Re-arrest Rate Incarceration Rate
Re-arrest Numeric Impact
Incarceration Numeric Impact
Drug Court Participants* 37.5% 28.3% 306 231
Control Cohort 39.8% 19.7% 325 161
Total -19 70 *Drug Court Cohort numbers exclude the 6
th judicial and Magnolia drug courts
Based on the rates established from the three year follow up period, the recidivism
impact would total 19 fewer arrests and 70 more incarcerations sometime during
the three year time period.
Table 23: FY 2009 Drug Court and Probation Control Cohort Recidivism Impact
Incarceration Offenders Projected LOS
(months) Actual
Cost per Day Total Cost
Sent to ACC 31 7.8 $53.01 $ 390,142
Sent to ADC 39 16.2 $60.19 $1,160,177
Total 70
$1,550,631
Table 23 combines the numeric impact of the incarceration rates, the average cost
of housing an offender in either ACC or ADC, and the imposed incarceration
sentence to produce the cost impact over the three year follow up period.
33
Ark
ansa
s A
du
lt D
rug
Co
urt
Pro
ject
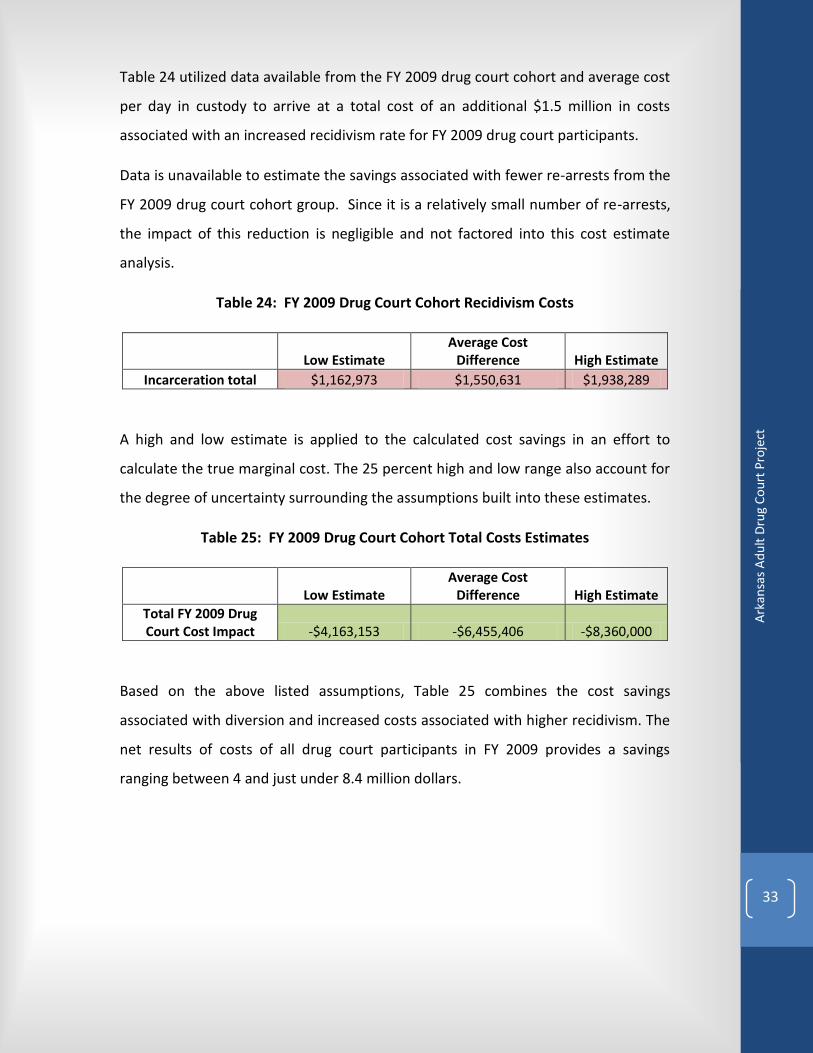
Table 24 utilized data available from the FY 2009 drug court cohort and average cost
per day in custody to arrive at a total cost of an additional $1.5 million in costs
associated with an increased recidivism rate for FY 2009 drug court participants.
Data is unavailable to estimate the savings associated with fewer re-arrests from the
FY 2009 drug court cohort group. Since it is a relatively small number of re-arrests,
the impact of this reduction is negligible and not factored into this cost estimate
analysis.
Table 24: FY 2009 Drug Court Cohort Recidivism Costs
Low Estimate
Average Cost Difference High Estimate
Incarceration total $1,162,973 $1,550,631 $1,938,289
A high and low estimate is applied to the calculated cost savings in an effort to
calculate the true marginal cost. The 25 percent high and low range also account for
the degree of uncertainty surrounding the assumptions built into these estimates.
Table 25: FY 2009 Drug Court Cohort Total Costs Estimates
Low Estimate
Average Cost Difference High Estimate
Total FY 2009 Drug Court Cost Impact -$4,163,153 -$6,455,406 -$8,360,000
Based on the above listed assumptions, Table 25 combines the cost savings
associated with diversion and increased costs associated with higher recidivism. The
net results of costs of all drug court participants in FY 2009 provides a savings
ranging between 4 and just under 8.4 million dollars.
34
Ark
ansa
s A
du
lt D
rug
Co
urt
Pro
ject
IV. CONCLUSIONS AND RECOMMENDATIONS
Arkansas’s drug courts have a high degree of support, credibility, and impact on
recovery and sobriety. They have a high graduation rate, are well-conceived and
reflect practices that meet or exceed national standards. The next generation of
drug courts across the nation is increasing their use of research and other locally
available data to inform decisions about participation, programming and
supervision. In other words, they are fine-tuning their ability to match offenders to
the appropriate court, treatment and supervision strategies. Arkansas is already on
the path for this next level of implementation.
A great deal of differentiation exists among the drug courts in Arkansas from pre and
post adjudication courts to policies on number of failures and revocation rules. With
these varied policies, it is difficult to compile results statewide and even more
challenging to compare these results with other state or national studies. Adding a
cost estimate analysis for statewide comparison is even more challenging, as not
every court operates in the same manner, making costs vary widely from court to
court.
The drug court system within Arkansas is firmly established and as this report
details, shows real benefit in its high graduation rate and increased sobriety of
graduates post program. In order to understand these benefits and provide real
insight into successes and best practices among drug courts in Arkansas, it is
recommended that future iterations of this report attempt to focus on individual
drug courts. By individually measuring results by court over time, patterns may start
to emerge and best practices will be identified that provides the greatest overall
results in criminal justice savings as well as participant sobriety and social
betterment.