Embed Size (px)
Citation preview

Arkansas School Finance
Manual
2016-2017
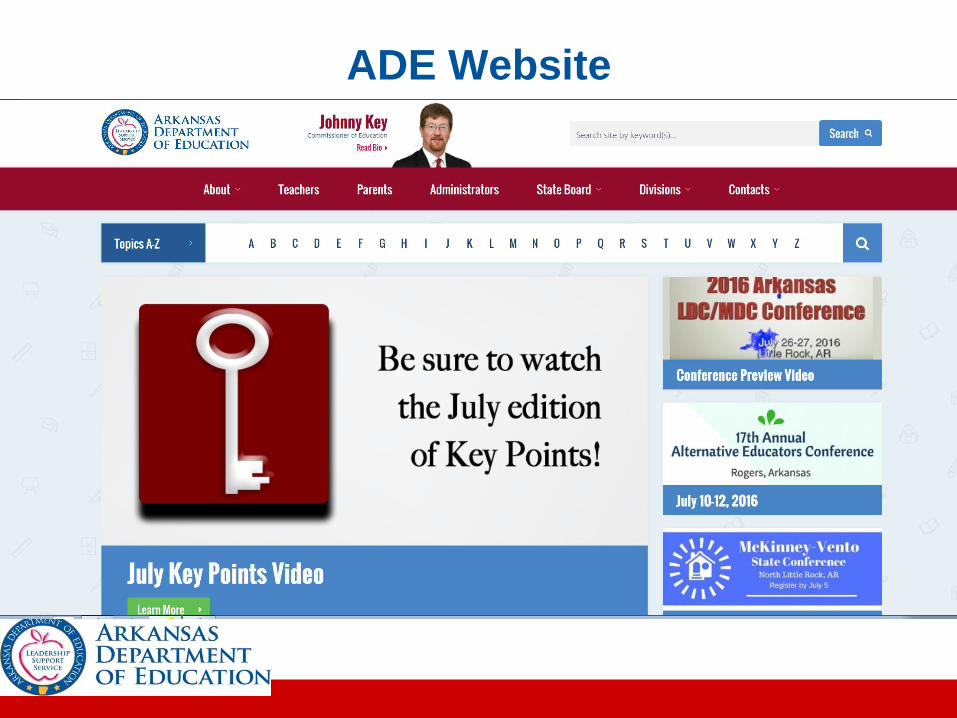
ADE Website


4
5
School Finance Manual
Purpose – The purpose of the manual is to provide guidance and resources for school districts to become better informed and enable fiscally responsible practices. As laws, rules and procedures change, the information contained in this manual will be revised. This manual is not fully comprehensive of the rules, regulations and funding sources available for districts. As a result, this manual should only be used as a reference.
6
Assessment and Local Taxes
Primarily, school districts are funded through a combination of local and state taxes. The Real, Personal and Utility taxes comprise three main categories. Real, Personal and Utility Assessments are added together to create the Total Assessment for a school district.
Real + Personal + Utility = Total Assessment
7
Assessment and Local Taxes
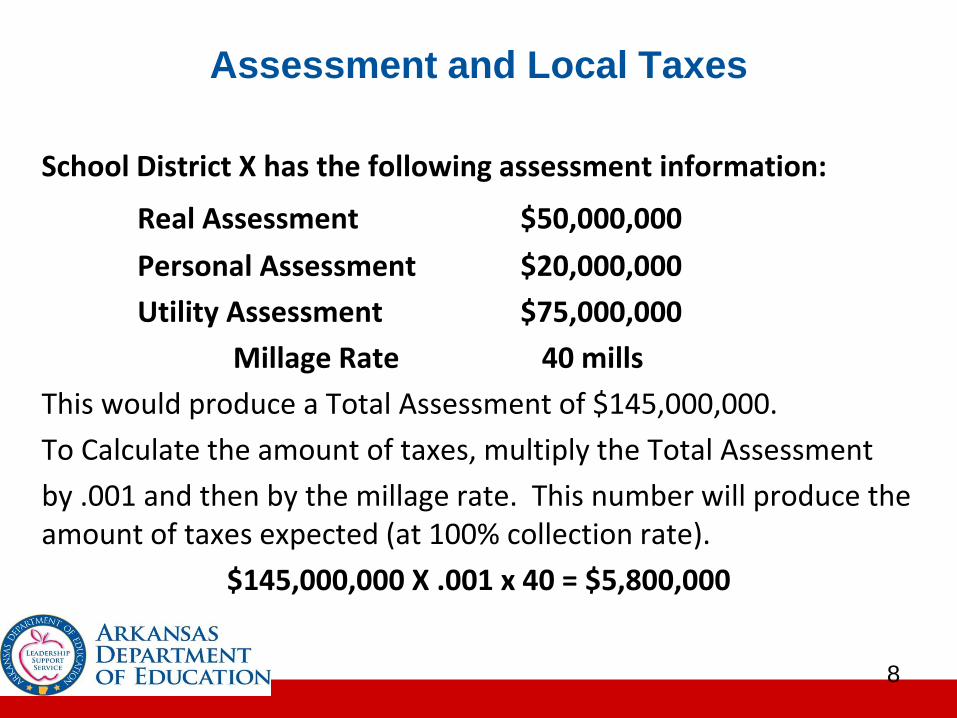
School District X has the following assessment information:
Real Assessment $50,000,000
Personal Assessment $20,000,000
Utility Assessment $75,000,000
Millage Rate 40 mills
This would produce a Total Assessment of $145,000,000.
To Calculate the amount of taxes, multiply the Total Assessment
by .001 and then by the millage rate. This number will produce the amount of taxes expected (at 100% collection rate).
$145,000,000 X .001 x 40 = $5,800,000
8
Assessment and Local Taxes
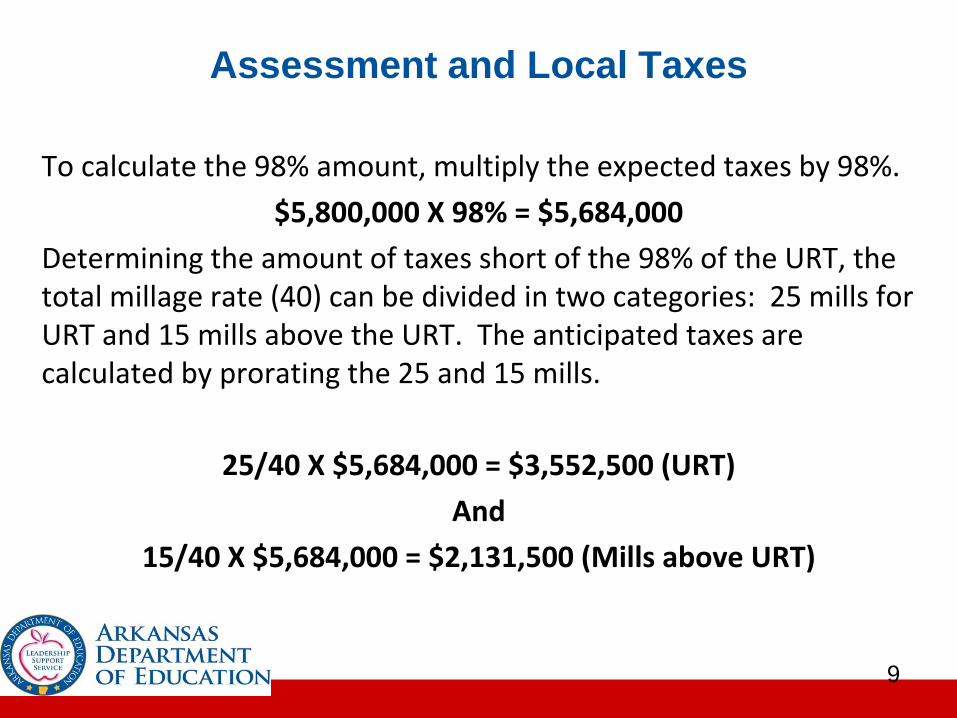
To calculate the 98% amount, multiply the expected taxes by 98%.
$5,800,000 X 98% = $5,684,000
Determining the amount of taxes short of the 98% of the URT, the total millage rate (40) can be divided in two categories: 25 mills for URT and 15 mills above the URT. The anticipated taxes are calculated by prorating the 25 and 15 mills.
25/40 X $5,684,000 = $3,552,500 (URT)
And
15/40 X $5,684,000 = $2,131,500 (Mills above URT)
9

Assessment and Local Taxes
In looking at the local URT ($3,552,500), the district is funded this amount even if local taxes do not produce this amount. This is done through the 98% true-up. Assume, the district had an actual tax collection of $5,300,000, it would produce the following amounts:
URT: 25/40 X $5,300,000 = $3,312,500
And
Above the URT 15/40 X $5,300,000 = $1,987,500
Since the district did not collect 98% of the URT ($3,552,500), the difference between the 98% of URT and actual taxes collected ($3,312,500) is calculated:
$3,552,500 - $3,312,500 = $240,000
10
Assessment and Local Taxes
The actual assessment and collection rate is unique to each individual district. For good financial forecasting, it is recommended to look at historical date (past assessment, past collection rates, etc…), current trends (New building, abandoned homes, new or moving industry and businesses, etc…), collection rates (Obtained by comparing past tax collections to assessments) and other pertinent information to make more informed financial decisions.
11
Assessment and Local Taxes
The amount of local funds collected is divided by the number of students to derive at the amount of local money collected per student. The difference between the local amount per student collected and the foundation funding is then paid by the state to the district. For example, if a district collects $1,500 through local taxes per student and the foundation funding amount is $6,646, the state would pay the district $5,146 per student in foundation funding. The total amount of foundation funding can be calculated by multiplying the amount paid by the state x prior year 3 Quarter Avg. ADM. State foundation funding is provided to districts beginning in August and occurring through June on a monthly basis.
12
Funding Matrix
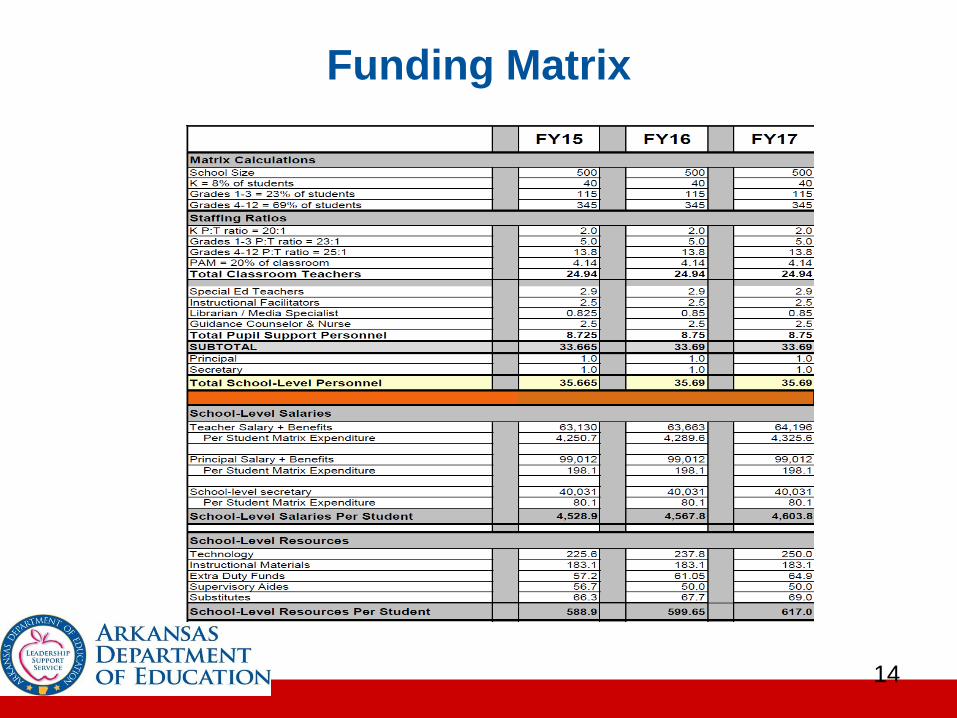
The funding matrix is based upon a 500 student enrollment school. In the matrix, the amount of per pupil funding can be divided in smaller categories thus representing revenue for a school.
13
Funding Matrix
14
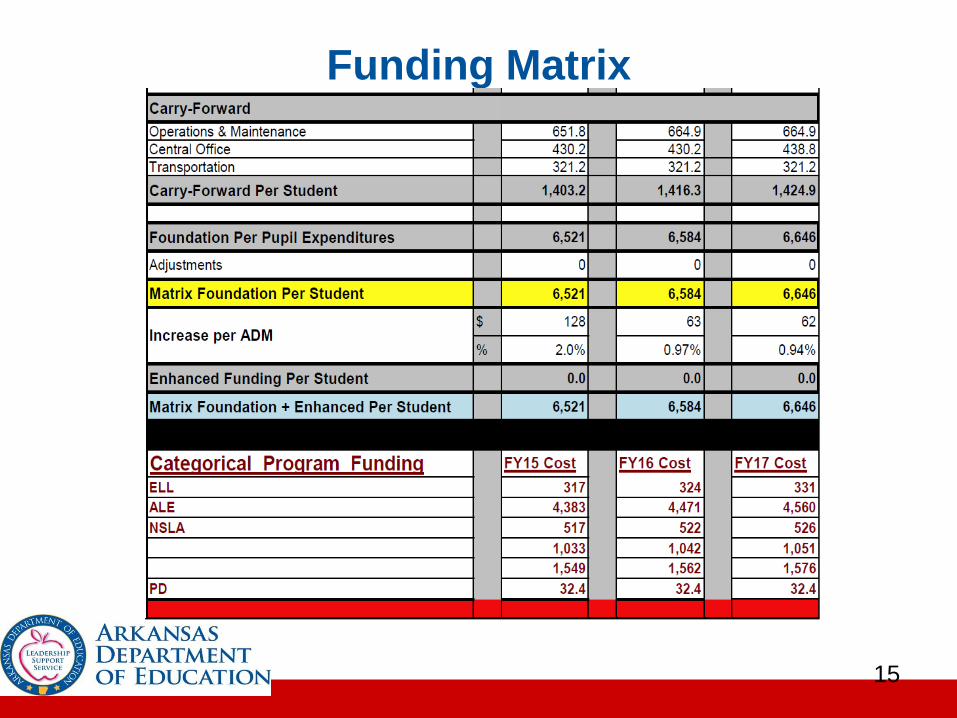
Funding Matrix
15
Categorical Funds
4 Categories: ALE, ELL, NSL, and PD.
This is in addition to foundation funding.
There is a limitation to the amount of carry-over categorical funds a district can have at the end of a fiscal year. Districts that carry over larger than allowed amounts may be required to surrender those unspent excess funds. Districts must expend a minimum of 85% of the current year NSL funding. Concerning all categorical funds, the total aggregate balance shall not exceed 20%.
16
Categorical Funds
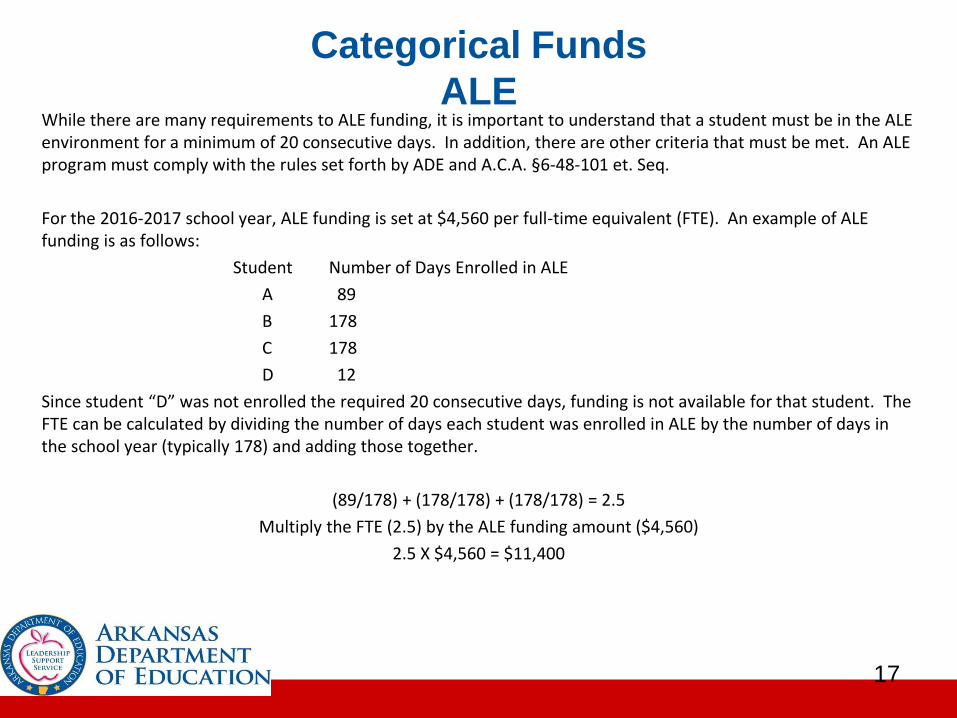
ALEWhile there are many requirements to ALE funding, it is important to understand that a student must be in the ALE environment for a minimum of 20 consecutive days. In addition, there are other criteria that must be met. An ALE program must comply with the rules set forth by ADE and A.C.A. §6-48-101 et. Seq.
For the 2016-2017 school year, ALE funding is set at $4,560 per full-time equivalent (FTE). An example of ALE funding is as follows:
Student Number of Days Enrolled in ALE
A 89
B 178
C 178
D 12
Since student “D” was not enrolled the required 20 consecutive days, funding is not available for that student. The FTE can be calculated by dividing the number of days each student was enrolled in ALE by the number of days in the school year (typically 178) and adding those together.
(89/178) + (178/178) + (178/178) = 2.5
Multiply the FTE (2.5) by the ALE funding amount ($4,560)
2.5 X $4,560 = $11,400
17
Categorical Funds
ELL
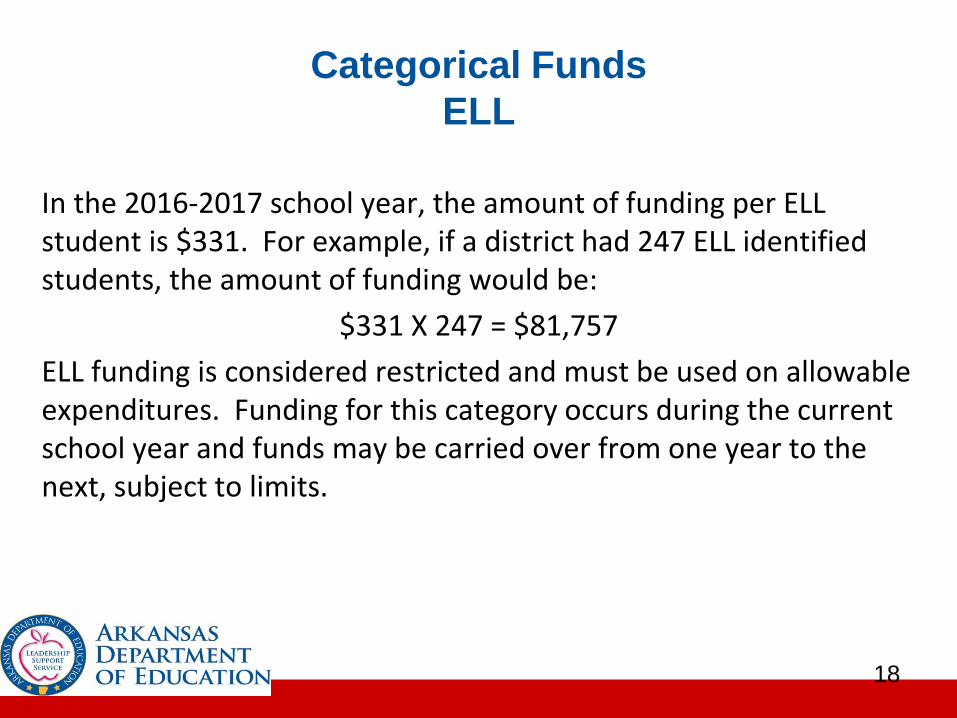
In the 2016-2017 school year, the amount of funding per ELL student is $331. For example, if a district had 247 ELL identified students, the amount of funding would be:
$331 X 247 = $81,757
ELL funding is considered restricted and must be used on allowable expenditures. Funding for this category occurs during the current school year and funds may be carried over from one year to the next, subject to limits.
18
Categorical Funds
NSL
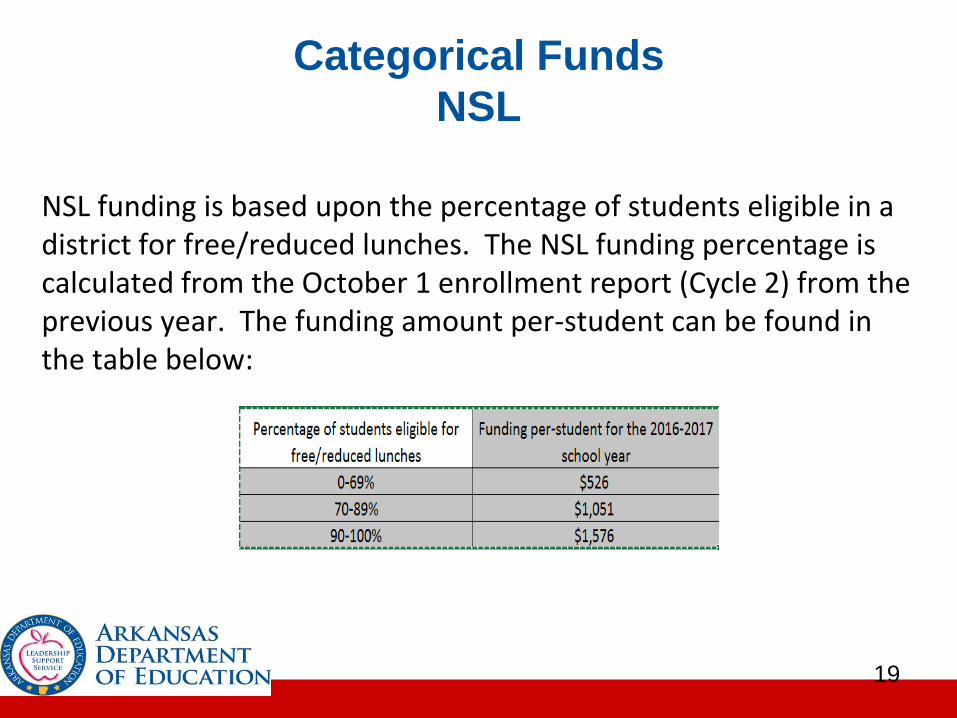
NSL funding is based upon the percentage of students eligible in a district for free/reduced lunches. The NSL funding percentage is calculated from the October 1 enrollment report (Cycle 2) from the previous year. The funding amount per-student can be found in the table below:
19
Categorical Funds
PD
To calculate the total PD funding, the previous year 3 Quarter ADM is multiplied by the PD amount. For example, if a school had a 3 Quarter ADM for 2015-2016 of 629 students, the PD funding would then be multiplied by 629.
$26.05 X 629 = $16,385.45
There are restrictions on PD funds. Rules and laws should always be referenced.
20
Student Growth Funding
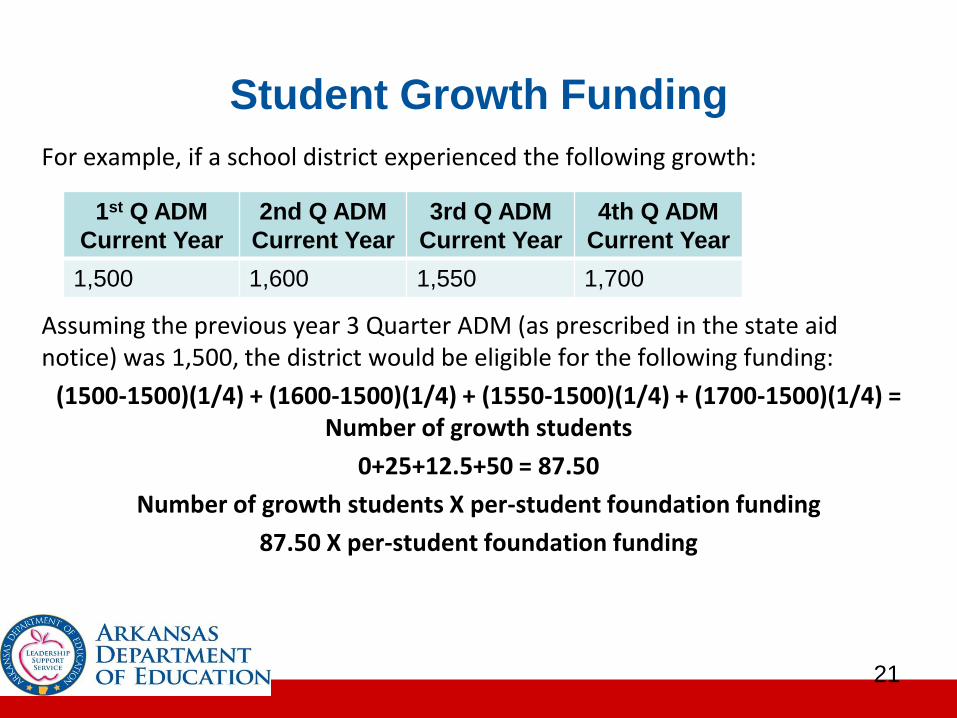
For example, if a school district experienced the following growth:
Assuming the previous year 3 Quarter ADM (as prescribed in the state aid notice) was 1,500, the district would be eligible for the following funding:
(1500-1500)(1/4) + (1600-1500)(1/4) + (1550-1500)(1/4) + (1700-1500)(1/4) = Number of growth students
0+25+12.5+50 = 87.50
Number of growth students X per-student foundation funding
87.50 X per-student foundation funding
21
1st Q ADM
Current Year
2nd Q ADM
Current Year
3rd Q ADM
Current Year
4th Q ADM
Current Year
1,500 1,600 1,550 1,700
Declining Enrollment Funding
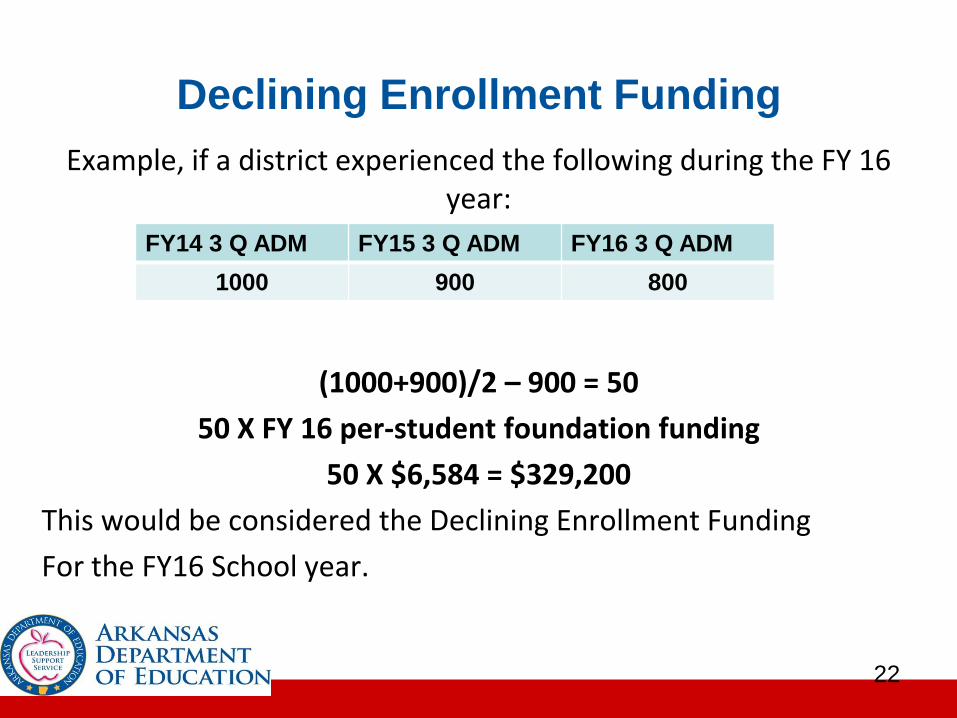
Example, if a district experienced the following during the FY 16 year:
(1000+900)/2 – 900 = 50
50 X FY 16 per-student foundation funding
50 X $6,584 = $329,200
This would be considered the Declining Enrollment Funding
For the FY16 School year.
22
FY14 3 Q ADM FY15 3 Q ADM FY16 3 Q ADM
1000 900 800
Student Growth/Declining Enrollment
Funding
Student Growth Funding is considered unrestricted. No district can receive both declining enrollment and student growth funding. Furthermore, if a district receives Special Needs Isolated funding then the district receives the larger amount of the following two:
Declining Enrollment Funds
The sum of Student Growth Funds and Special Needs Isolated Funding.
23

Federal Title Funds
Title I, part a – Imroving the academic achievement of the disadvantaged. “The purpose of this title is to ensure that all children have a fair, equal, and significant opportunity to obtain a high quality education and reach, at a minimum, proficiency on challenging State academic achievement standards and State academic assessments.”
24
E-Rate
The E-rate program is a discount program designed to help schools (and public libraries) pay for technological infrastructure and services. It is funded by the Universal Service Fee, a small fee added to every phone bill in the U.S., and is administered by the Universal Service Administration Company (USAC) on behalf of the FCC. In order to qualify for the program, applicants must solicit bids from service providers that meet their tech needs through an open and competitive bidding process. Then, upon awarding a bid, applicants must follow up with USAC to show actual costs incurred. There are a number of pieces of paperwork that accompany every step in the process. Successful school applicants will be eligible for a discount on their actual costs that is roughly equal to the NSL percentage within their schools.
25

Other Topics:
Bonded Debt Assistance
EETF
Miscellaneous Funds
26
Other Topics:
Child Nutrition
Better Chance
Medicaid
ARMAC
Isolated Funding
27
Special Education
Catastrophic
Early Childhood
Residential
Title VI Part B
Maintenance of Effort – How to Calculate and How to Reduce
28
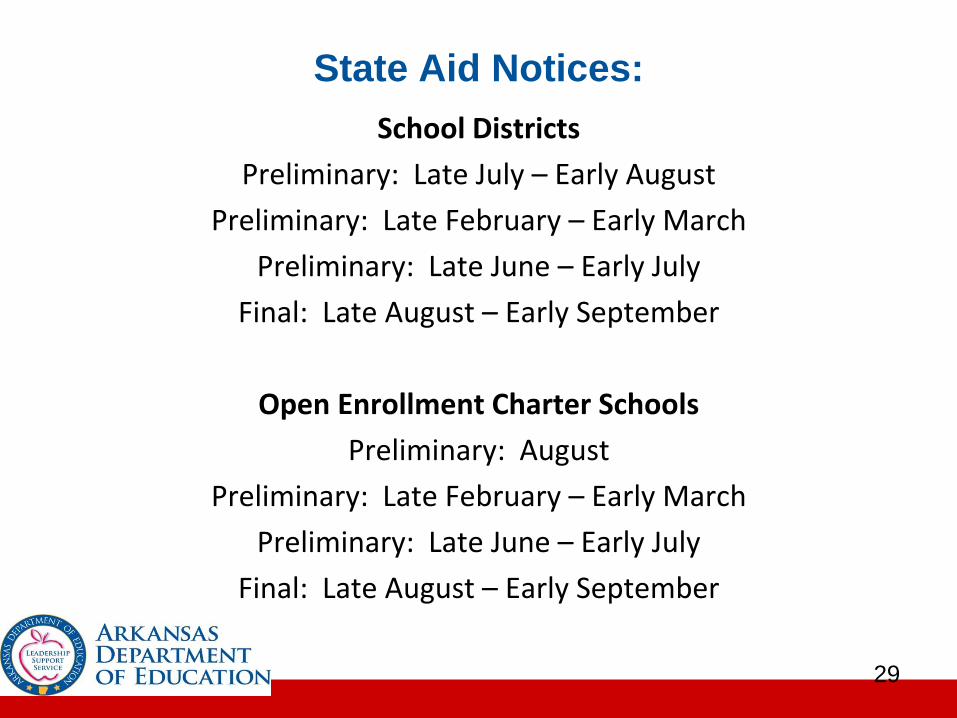
State Aid Notices:
School Districts
Preliminary: Late July – Early August
Preliminary: Late February – Early March
Preliminary: Late June – Early July
Final: Late August – Early September
Open Enrollment Charter Schools
Preliminary: August
Preliminary: Late February – Early March
Preliminary: Late June – Early July
Final: Late August – Early September
29
30
Annual Statistical Report (ASR)
Rankings
Ranked by Per Pupil Expenditures
Ranked by ADA
Ranked by ADM
Ranked by K12 Licensed FTE
Ranked by Average Salary K12 (Classroom) Licensed
Ranked by Licensed FTE
Ranked by Average Salary Licensed FTE
31
Calculating Carryover Amounts
The amount of necessary carryover varies by district. SOME of the factors to consider when evaluating carryover include:
Staff Payment Schedule
Interest Bond Payments
Tax Revenue
Revenue Sources Schedule
32

33
We are here to help!
34