Embed Size (px)
Citation preview
fy02United States Army Annual Financial Statement
Tr a n s f o r m i n g t h e A r m y : I m a g i n a t i o n • I n n o v a t i o n • I n i t i a t i v e

ify02
Table of Contents
i
Secretary of the Army Message iii
Assistant Secretary of the Army Message v (Financial Management and Comptroller)
Assistant Secretary of the Army Message vii(Civil Works)
Army Year in Review ix
General Fund 1
Army Working Capital Fund 43
Civil Works 85
Principal Statements and Related Notes 125
* Unless otherwise indicated, all photographs in the FY 2002 Army Annual Financial Statement arecourtesy of the U.S. Army.
Photos provided by the Association of the U.S. Army and Copyrighted 2002 were reproduced bypermission and noted.

ii
Imagination • Innovation • InitiativeTransforming the Army:

iii
Secretary of the ArmyThere are moments in history when events suddenly allow us to see the challengesahead with a degree of clarity previously unimaginable. September 11, 2001,created one of those rare opportunities. Now we see clearly the challenges facingus — and we are confronting them.
To succeed, the Army must accomplish three critical tasks. First, we must help winthe global war on terrorism; second, we must transform to meet the challenges offuture conflicts; and third, we must secure the resources needed to pursue both thewar on terror and Army Transformation. We must accomplish these three taskswhile sustaining the readiness of the force and caring for soldiers and their families.
The means for achieving these goals begins with the Army's biggest asset — ourpeople. The Army is about people. At 227 years of age, the Army is an enterpriseof 1.2 million individuals, including active and reserve components, civilians andcontractors, serving in 180 different countries — the largest single enterprise on the face of the earth.
The war on terrorism underscored the importance of having well-trained soldiers ready to defend America's interestsanywhere in the world. Our soldiers fought valiantly, in concert with American marines, sailors, airmen andindigenous Afghan forces, to defeat the Taliban, disrupt al Qaeda, liberate the Afghan people and install an interimgovernment in Kabul. All of this was accomplished within a few short months, in the world's toughest terrain and inthe dead of winter. In addition, our soldiers were in Bosnia, Kosovo and the Sinai, keeping the peace, and within ourown borders, guarding airports, seaports and other potential targets.
Concurrent with the war on terrorism, we continued to transform the Army into a more agile fighting force. We testedmany of the concepts of the Objective Force in concert with the Interim Force. Stryker Brigade Combat Teamsparticipated in the joint exercise, Millennium Challenge 2002, demonstrating their capability to fight along side ourjoint partners, using new technologies and concepts.
Finally, obtaining the required resources and applying them prudently are pivotal to winning the war on terrorism andtransforming the Army. We are working hard with the Department of Defense, within the context of the FinancialManagement Modernization Program and the Business Initiatives Council, to put systems and processes in place thatwill enable more relevant and reliable financial information and, thereby, facilitate better management. Receiving anunqualified audit opinion on our financial statements remains a priority and we continue to work toward that importantgoal.
I welcome your interest in the Army and its programs. In these challenging and uncertain times, the American peoplecan be assured that the United States Army is ready to protect and defend the Constitution and our national freedoms.Our continuing stewardship of the resources that you provide will ensure that as we transform the Army into a moreagile and responsive force, we are ready to meet the challenges of the 21st century.
Thomas E. WhiteSecretary of the Army
fy02fy02Message
iii

iv
Imagination • Innovation • InitiativeTransforming the Army:

Assistant Secretary of the Army(Financial Management and Comptroller)One of the most important jobs we have in the financial management community issecuring the resources needed for both the war on terror and Army Transformation.In addition to supporting the Army’s obligation of fighting and winning the nation’swars, the mission of the Office of the Assistant Secretary of the Army for FinancialManagement and Comptroller is twofold: we owe our soldiers the best training andthe best equipment and we owe the American people accountability.
Our job of securing adequate Army resources involves three essentials: (1) planning,programming and budgeting, (2) execution, and (3) financial reporting. Each ofthese three elements is critical in achieving our mission of accountability. Eachrequires the work of many, at all levels.
Given that our Army funds come from the hard-earned dollars of the Americanpeople, it is essential that we make the right decisions about how best to use those dollars. That is where our planning,programming and budgeting work comes in and culminates as a portion of the President’s budget submission and,ultimately, the annual defense appropriation. Finding the right funding balance is a daunting challenge and it requiresthe dedicated efforts of the Army, the Department of Defense, the Office of Management and Budget, the President and,finally, the Congressional authorizers and appropriators. Our collaborative role in resourcing our country’s Army hasnever been more mission critical.
In addition to optimizing and safeguarding the Army’s resources, we owe our leaders reliable and timely financialinformation so that they can make informed business decisions. Providing this information is central to our mission.Receiving an unqualified audit opinion on our financial statements certifies the reliability of our financial informationand, hence, remains an Army priority. Over the past year, we have made major strides in achieving this goal. Forexample, this year’s accomplishments include: completion of milestone 3 of our Single Stock Fund implementation;Army-wide deployment of the Defense Property Accountability System; exceeding our goals for improving ouraccounting processes, including reducing problem disbursements, negative unliquidated obligations and outstandingtravel advances and liquidating obligations in appropriations in advance of their cancellation; partnering on andadvancing the development of a CFO compliant enterprise resource plan for our Logistics Modernization Program; and,positioning the Army National Guard to move simultaneously with the rest of the Army to the Department of DefenseFinancial Management Modernization Program’s approved architecture.
Looking ahead to Fiscal Year 2003, we expect to improve the quality of the information we provide our leaders andstakeholders. Our intent is to integrate functional and financial systems more effectively in support of ArmyTransformation. As the rest of the Army transforms to be more lethal and more agile, we in the financial managementcommunity also must transform to become more agile and more responsive.
We are pleased to present this Fiscal Year 2002 report, the deliverable of the third critical element outlined above. Itincludes all three funds managed by the Army: the General Fund, the Army Working Capital Fund and the Civil WorksFund. The compact disc accompanying this report provides additional information and links to key Army web sites. Webelieve you will find this report useful in understanding our country’s Army, its mission, and its people.
Sandra L. PackAssistant Secretary of the Army
(Financial Management and Comptroller) v
fy02Message

vi
Imagination • Innovation • InitiativeTransforming the Army:

Assistant Secretary of the Army(Civil Works)The Army has been involved in civil works and water resources since 1824, whenthe General Survey Act authorized the President to employ the Corps of Engineers toconduct a survey of nationally important roads and canals from a commercial,military, or mail transportation point of view. Since then, the Corps has been adedicated servant of the American people.
In addition to its water resources mission, the Corps has supported our militaryforces in time of war, dating back to construction of fortifications at Bunker Hill in1775. The Corps provided technical expertise for the Manhattan Project, andoversaw the building of the Panama Canal and the Kennedy Space Center. When adisaster strikes, Corps personnel in red jackets are there to help. Research work bythe Corps resulted in building designs that saved lives in the Pentagon on September11th. Today, 35,000 Corps employees work around the world to help improve thequality of life for people at home and abroad.
The people of America increasingly understand that our nation's water resources are finite. The debate over its useclassically centers on development of water resources for social and economic benefit vs. restoration of these resourcesto their natural state. As science and engineering evolve, we can enhance our opportunity to find more balance betweenthese options and make the right choices for the nation.
In terms of our nation's priorities, the war on terrorism is our main focus. We must prioritize our resources to win thiswar. We must also ensure that we are looking out for our nation's long-term future and ensure that our country'seconomy remains strong and its natural resources are protected. The Corps is continually transforming itself to betterserve the ever-changing needs of the nation in a way that strikes the right balance on its critical priorities.
The Corps professionals' body of knowledge on water resources is unparalleled, and we must exploit that knowledge andassociated skills to ensure that the Federal Government can continue to meet the needs of its citizens. I believe we havean opportunity to shape the nation's future and will continue to work on these important issues to achieve a nationalwater policy that serves the best interest of all our citizens.
R. L. BrownleeActing Assistant Secretary of the Army
(Civil Works)
fy02Message
vii

General Fund xSummary of Performance Results x
Working Capital Fund xiiiSummary of Performance Results xiii
Civil Works Fund xviSummary of Performance Results xvi
Army Systems Controls and Legal Compliance xix
“Im
agin
atio
n •
Inno
vatio
n •
Initi
ativ
e”
FY02
Uni
ted
Sta
tes
Arm
y A
nnua
l Fin
anci
al S
tate
men
t

ix
The Army's primary mission is warfighting, and in this it has no peer. Itscapabilities enable it also to accomplish many other missions in support of thenational objectives. Prepared at all times to fight and win the nation's wars, itssoldiers are ready also for deployment anywhere in the world to save lives,protect property, or keep the peace. In 227 years, the Army never has failedthe nation.
In addition to these responsibilities, the Army has a responsibility to usewisely the public funds entrusted to it. Despite comprising 33 percent of allactive military forces in FY 2002, the Army accomplished its missions andprepared for future missions while consuming only 23 percent of the fundsallocated for the Department of Defense.
The Army comprises three separate funding entities: the General Fund,Working Capital Fund, and Civil Works Fund. This annual financial statementdescribes how these three funding entities operate to support the Army’speople, readiness, and the transformation of its forces. The following is asynopsis of the key performance areas for each of the three funds.
fy02
Year in Review

“Im
agin
atio
n •
Inno
vatio
n •
Initi
ativ
e”
x
FY02
Uni
ted
Sta
tes
Arm
y A
nnua
l Fin
anci
al S
tate
men
t
General FundThe General Fund provides funding for the Army to accomplish the manydifferent tasks required of it by the American people, most importantly, tomaintain at all times the readiness to fight and win the nation's wars.
Summary of Performance ResultsThe Army measures its performance against a four-dimensional riskassessment framework that allows it to evaluate tradeoffs betweenfundamental objectives that have been made unavoidable by resourceconstraints. Using this framework, the Army identified a series of performancemetrics that address each of the risk management dimensions established bythe 2001 Quadrennial Defense Review (QDR). Each measure is supported bya quantifiable output. The following are highlights of our FY 2002performance.
Force Management. The primary mission of Army personnel management isto put the right person with the right skills in the right place at the right time.
As it strives to fulfill this mission, the Army finds itself askingmore of asmaller force, making it imperative that it has the best peopleavailable. Recruiting and training the best soldiers, officers, andcivilians in the proper mix of specialties and grade levelsrequires an adequate compensation package; sufficient medicalcare and retirement programs; and opportunities for careeradvancement. During FY 2002, the Army exceeded its enlistedrecruiting goals for all components. The Army exceeded itsquality benchmarks for active and reserve high school diplomagraduates (HSDG). It also exceeded the DoD target that 67percent of enlistees score in the top half of the Armed Forces
Qualification Test (AFQT), and it exceeded its self-imposed goal of 68 percentby another 0.5 percent in the reserve component. The Army also surpassed itsFY 2002 retention goals for first-term soldiers by 2 percent, experiencing anincrease of 0.07 percent from FY 2001. It also saw a slight increase in theretention of second-term soldiers, exceeding the performance goal by almost 2percent
Operational. The Army needs to manage its forces such that they areappropriately sized to accomplish both near-term war fighting tasks and small-
Today’s soldiers are ready for any challenge.

scale contingencies. In FY 2002, Army force levels were in line with the goalsestablished in the QDR for the Active Army Corps, Active and National GuardDivisions (including heavy and light divisions), ArmoredCavalry Regiments, and Enhanced Brigades. The Army hasmaintained its forces at the levels established by forcereductions conducted from FY 1989 through FY 1996. TheArmy also met its FY 2002 performance target for overseaspresence by maintaining one mechanized division in the PacificRegion and two divisions with selected command, combat, andsupport elements in Europe. In addition, during FY 2002 theArmy conducted 78 of the 80-scheduled overseas joint andcombined exercises. The number of exercises scheduled andconducted each year is affected by various political andoperational factors. No major exercises were cancelled in FY2002.
Overall, Army ground training continued to exhibit a positive trend during FY2002. The active Army exceeded its home-station training target of 931 tankmiles, and the Army National Guard forces recorded an increase in tank milesfrom FY 2001 performance levels. In response to Congressional concerns, FY2002 is the first year in which virtual miles are reported alongwith actual miles.
While the Army exceeded its goal for tank miles, the Army fellshort of the established flying hours goals for all components.This shortfall was the result of numerous deployments,transfers of aircraft due to Aviation Transformation, and Safetyof Flight (SOF) compliance messages. There were 32 SOFmessages in FY 2002, a 14 percent decrease from FY 2001.
Future Challenges. The attacks of September 2001 showedthat we cannot predict always with confidence whichadversaries will pose threats. The types of military capabilitiesthat will be used to challenge U.S. interests can, however, beidentified and understood. The Army must shift from a threat-based to a capabilities-based paradigm. When assessing therisks of future challenges, it no longer can focus purely on theextant threats of military engagement, but must also address its
fy02Year in Review
xi
Soldiers from the 101st Airborne Division (Air Assault)load onto a plane destined for Afghanistan. Photocourtesy of AUSA.
Land warrior integrates small arms with high-techequipment, enabling ground forces to deploy, fight,and win in the 21st century.

“Im
agin
atio
n •
Inno
vatio
n •
Initi
ativ
e”
xii
FY02
Uni
ted
Sta
tes
Arm
y A
nnua
l Fin
anci
al S
tate
men
t
capability to meet potential new challenges. The absence of a current,immediate threat is not justification to disregard technology that couldovercome that threat. On the contrary, introducing technology early furnishesa military advantage and may dissuade a potential adversary from pursuing asimilar capability. As a result of the increased complexity of modern warfarethe Army established and met its goal by successfully completing 49 of ascheduled 49 Operational Test and Evaluation Events. The purpose of theseassessments is to ascertain as quickly as possible how a new system ortechnology will perform from an operational perspective. Likewise,Congressional funding for procurement spending for FY 2002 increased by 13percent from the previous year. Since FY 2000 there has been a 26 percentincrease in procurement funding.
Institutional. Effecting changes in the way the Army conducts its supportoperations will require that business processes also be transformed, in order toachieve the most efficient support operations possible. It is the Army's goal toproduce an increasingly responsive support structure much like the combatforces, which are becoming more agile and capable. During FY 2002, theArmy conducted 17 public-private sector competitions, resulting in 11decisions to keep the function in-house and six contract decisions to outsourcefor an annual savings of $87.1 million. The Army also disposed of 81.3percent of the excess Base Realignment and Closure (BRAC) acres scheduled
for disposal in FY 2002. As a result of the disposal of excessreal property through the BRAC process, the Army will avoidreal caretaking and related sustainment costs of $7 million inFY 2003 and beyond.
Financial Resources. The Army's budget authority for FY2002 was $76.1 billion, a 5 percent increase from the previousyear. The level of funding affects every aspect of Armyoperations, including its ability to attract high-quality people, toprovide training, and to maintain equipment and infrastructure.It also governs the pace at which the Army is able to modernizeits forces.
0
10
20
30
40
50
60
70
80
Total Obligation AuthorityBudget Authority
FY 2000 FY 2001 FY 2002
$69.1 $68.6$71.0 $72.1
$77.6 $76.1
$ Billion
Working Capital FundThe Army Working Capital Fund (AWCF) is part of the Defense WorkingCapital Fund and is divided into four activity groups: Supply Management,Army (SMA); Depot Maintenance; Ordnance; and Information Services.These businesses help the Army to maintain constant readiness by providingthe supplies, equipment, ordnance, and information services necessary tosupport the deployment and projection of lethal force when required by thenation.
Summary of Performance ResultsThe following are highlights relating to the operation of the Army WorkingCapital Fund's four business units in FY 2002:
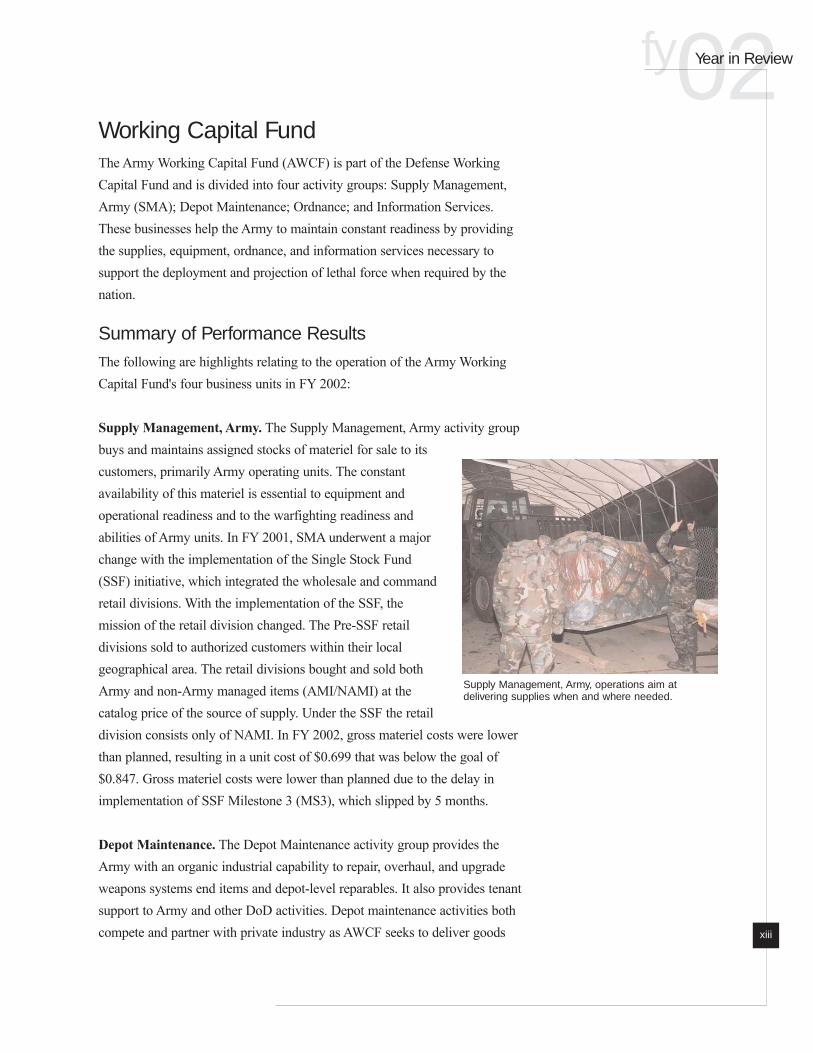
Supply Management, Army. The Supply Management, Army activity groupbuys and maintains assigned stocks of materiel for sale to itscustomers, primarily Army operating units. The constantavailability of this materiel is essential to equipment andoperational readiness and to the warfighting readiness andabilities of Army units. In FY 2001, SMA underwent a majorchange with the implementation of the Single Stock Fund(SSF) initiative, which integrated the wholesale and commandretail divisions. With the implementation of the SSF, themission of the retail division changed. The Pre-SSF retaildivisions sold to authorized customers within their localgeographical area. The retail divisions bought and sold bothArmy and non-Army managed items (AMI/NAMI) at thecatalog price of the source of supply. Under the SSF the retaildivision consists only of NAMI. In FY 2002, gross materiel costs were lowerthan planned, resulting in a unit cost of $0.699 that was below the goal of$0.847. Gross materiel costs were lower than planned due to the delay inimplementation of SSF Milestone 3 (MS3), which slipped by 5 months.
Depot Maintenance. The Depot Maintenance activity group provides theArmy with an organic industrial capability to repair, overhaul, and upgradeweapons systems end items and depot-level reparables. It also provides tenantsupport to Army and other DoD activities. Depot maintenance activities bothcompete and partner with private industry as AWCF seeks to deliver goods
fy02Year in Review
xiii
Supply Management, Army, operations aim atdelivering supplies when and where needed.

“Im
agin
atio
n •
Inno
vatio
n •
Initi
ativ
e”
xiv
FY02
Uni
ted
Sta
tes
Arm
y A
nnua
l Fin
anci
al S
tate
men
t
and services as efficiently and effectively as possible. There arefive major depots in this activity group: Anniston, CorpusChristi, Letterkenny, Red River, and Tobyhanna.
Customer requirements govern the size and type of DepotMaintenance workload. Following several years of decline, FY2002 workload increased significantly above planned levels.Depots received $183.5 million more in orders than wasforecasted, or roughly 12 percent more work than planned. Inresponse, the depots aggressively recruited to increase theworkforce, employed contract support, and used high levels ofovertime to respond to the increased customer demands.
Ordnance. The Ordnance activity group provides the Army with an organicindustrial capability to produce high-quality munitions and large caliber
weapons. It also provides the full range of ammunitionmaintenance for all services within the DoD and for foreignmilitary customers. It manufactures, renovates, stores, anddemilitarizes ordnance materiel and manufactures 155-millimeter howitzers, 120-millimeter gun tubes, 120-millimetermortars, gun mounts for the M1A1 Abrams tank, grenades andsmoke rounds, rebuilt protective masks, and tool sets and kits.
The Army manages Army Working Capital Fund cash at thecorporate level. The performance of individual activity groupsis measured against planned collections, disbursements, andoutlays, not against cash balances. The Ordnance FY 2002 planprojected a drain on cash of $26.5 million, but the actual result
was an increase in cash of $275.9 million. Collections were above plan as aresult of advance billing of customer orders in the amount of $146 million andincreased collection of valid previous year bills.
Information Services. The Information Services activity group is responsiblefor the development and sustainment of automated information andcommunications systems. It provides a multitude of services in support of theDepartment of Defense and foreign military sales customers includingrequirements analysis and definition, system design, development testing,integration, implementation support, and documentation of services.
Depot Maintenance employees at Anniston and RedRiver Army Depots keep the Army's tracked vehiclesready for combat.
The Ordnance activity group manufactures and links7.62mm ammunition for Army machine guns.

The activity experienced a net operating results gain of $3.7 million. This wasdue to the increased revenue at Army's Small Computer Program (ASCP).Ordering on two contracts (Dell Army Desktop & Mobile Computing-1contract and Oracle Enterprise Initiative Software Agreement) was heavierthan anticipated. The Army continues to provide the largest source of revenue,accounting for 89 percent of total revenue in FY 2002. The Defense Financeand Accounting Service (DFAS) is also an important customer because of itsneeds for design, maintenance, and testing services for its financial systems.
fy02Year in Review
xv

“Im
agin
atio
n •
Inno
vatio
n •
Initi
ativ
e”
xvi
FY02
Uni
ted
Sta
tes
Arm
y A
nnua
l Fin
anci
al S
tate
men
t
Civil Works FundSince 1824, the Corps of Engineers Civil Works Program has been involved inthe development, management, protection, and enhancement of America'swater and related land resources. Today it is responsible for commercialnavigation, flood damage reduction, environmental restoration, and relatedpurposes. The program provides stewardship of America's water resourcesinfrastructure and associated natural resources, and also provides emergencyservices for disaster relief. The Civil Works Program supports the Army inpeacetime pursuits, during national emergencies, and in times of war.
Summary of Performance ResultsThe Civil Works Program is divided into eight distinct business programs. Allprograms contribute to the military power of the United States, but moreimportant, they contribute to the economic well-being and quality of life of thenation's citizens. The following are selected highlights of FY 2002performance.
Navigation. The Civil Works navigation program is responsible for providingsafe, reliable, and efficient waterborne transportation systems for the
movement of commercial goods, for national security needs,and for recreation. Civil Works operates and maintains 12,000miles of inland waterways, 235 locks, and 300 commercialharbors. Inland waterways provide a highly fuel-efficient modeof transportation, able to move freight at more than 500 ton-miles per gallon of fuel compared to the less than 400 ton-milesper gallon that rail transportation achieves. This translates to anannual savings of $7 billion in transportation costs. Every dollarinvested in improving our navigation infrastructure results in abetter than $3 increase in GDP.
In FY 2002, work continued to improve the future viability ofmany of America's ports and harbors. In New York City, workto dredge the access channel to 41 feet is vital to ensuring that
future container ships will be able to load fully in New York. This $113million project, of which Civil Works will pay $84 million, is expected toprovide $32 million in average annual benefits to the nation.
Construction is underway on the channel leading toVictoria, TX, from the Gulf Intercoastal Waterway. Thesize of the channel will become the same as that ofthe waterway, 12 feet deep by 150 feet wide.

Flood and Coastal Storm Damage Reduction. There are two generalapproaches to reducing flood damage. The first calls for the use of large-scaleengineering projects to prevent floodwaters from inundating property; thesecond calls for the modification of property susceptible to flooding, tominimize the risk of damage. Civil Works projects usually use a combinationof approaches.
Most Corps flood and coastal storm damage reduction projects are constructedas joint ventures between the Federal Government and non-Federal sponsors,and are subsequently owned, operated, and maintained by thenon-Federal sponsor. A few projects, mostly reservoirs, areoperated and maintained by the Corps. The Flood and CoastalStorm Damage Reduction business program has compiled animpressive record of performance. In the period 1991-2000,floods in unprotected areas caused the United States an annualaverage of $4.5 billion in property damage. In the same period,Corps projects in protected areas prevented $20.8 billion inaverage annual damages. Through FY 2000, the nation hadinvested $43.6 billion ($122 billion, adjusted for inflation) inflood damage reduction projects, preventing an estimated $419billion ($709 billion, adjusted for inflation) of flood damage.Adjusted for inflation, these figures show a return oninvestment of more than $6 in damage prevented for eachdollar spent. The program also has helped reduce the number of lives lostannually due to floods from an average of 179 in the decade 1972-1981 to 89in the period 1991-2000.
Environmental. There are three program objectives in support of the strategicgoals of the Civil Works Environmental Program. These are 1) to invest inmitigation and restoration projects or features to make a positive contributionto the nation's environmental resources; 2) to invest in mitigation andrestoration projects and in the operation of program facilities to assist in therecovery of federally listed threatened and endangered species; and 3) toensure that the operation of all Civil Works facilities and management ofassociated lands, including out-granted areas, complies with the environmentalrequirements of the relevant federal, state, and local laws and regulations.
fy02Year in Review
xvii
J. Strom Thurmond Dam and Lake, Flood Gates,Clarks Hill, SC.

“Im
agin
atio
n •
Inno
vatio
n •
Initi
ativ
e”
xviii
FY02
Uni
ted
Sta
tes
Arm
y A
nnua
l Fin
anci
al S
tate
men
t
During FY 2002, Civil Works administered 713,909 mitigationacres, representing a slight increase of less than 0.5 percent overthe acreage administered in FY 2001. The Civil WorksEnvironmental Program also participated in recovery programsfor 80 federally listed species, engaging in 496 separateopportunities to benefit these species. Finally, during FY 2002,preliminary results indicate that 100 percent of the significantfindings and 62 percent of major findings were corrected. TheCorps corrected four significant findings identified during FY2002, and corrected the one remaining significant findingcarried over from FY 2001.
Regulatory. Civil Works operates a comprehensive regulatory program toprotect from overdevelopment the aquatic environment, primarily, but also thenavigability of waterways. Management of this program has a relatedobjective of minimizing the time taken to process decisions on requests forpermits to work in the waters of the United States. There are threeperformance measures to support the pursuit of the strategic goals of the CivilWorks mission: 1) realize no net loss of wetlands; 2) complete 85 to 95
percent of all permit actions within 60 days; and 3) complete 70to 80 percent of decisions on standard permits within 120 days.
During FY 2002, 57,821 acres of wetlands were restored,created, enhanced, or preserved, offsetting the 24,651 acres thatwere lost to permitted development. The Civil Works programalso completed 88 percent of all permit actions in 60 days orless. However, the performance target for standard permits wasnot met. During FY 2002, 61 percent of all standard permitactions were completed in less than 120 days. Performance hasremained relatively steady over the last three years at between60 percent and 62 percent.
Ducks, geese, and herons are protected on morethan 85,200 acres of Army Corps of Engineers landdevoted to wildlife management.
Inspector from Wilmington District Regulatory Officeon permit site with applicants.

Army Systems Controls and LegalComplianceThe Army continues to place a high priority on improving its financialmanagement processes and associated systems. To that end, we workedaggressively through FY 2002 toward our goal of ensuring that our criticalfeeder systems are compliant with the Chief Financial Officers (CFO) Act andthat they, therefore, will produce the requisite reliable and relevantinformation. The ongoing replacement or incorporation of Army feedersystems into new or evolving systems means that the number of noncompliantsystems continues to diminish. Those critical feeder systems not scheduled forreplacement are being evaluated for modification to achieve compliance, witheach system being monitored through periodic review of the Army CFOStrategic Plan. This plan fixes responsibility and establishes a timeline foraddressing and resolving problems of noncompliance, with periodic statusreports going to Army leadership.
The CFO Strategic Plan is one of many initiatives designed to improve businessprocesses throughout the Army. As these business processes improve, so too willthe quality of the information that is vital to the Army's decision-makers.
fy02Year in Review
xix

General Fund—Overview 1Profile of the Army 1
Mission 1
How the Army Accomplished Its Missions 2
Vision for the Future 9
Organizational Structure 13
General Fund Performance Results: Mitigating DoD Risk Dimensions 17DoD Risk Management Dimensions 17
Risk Area: Force Management 19
Risk Area: Operational 21
Risk Area: Future Challenges 26
Risk Area: Institutional 28
Management Integrity 30Corrected Weakness 30
Uncorrected Weaknesses 30
Future Effects of Existing Conditions 33Operational Risk 33
Institutional Risk 33
Human Capital 34
Advancing the President's Management Agenda 36Strategic Management of Human Capital 36
Competitive Sourcing 37
Improved Financial Performance 38
Expanded Electronic Government 40
“Im
agin
atio
n •
Inno
vatio
n •
Initi
ativ
e”
FY02
Con
solid
ated
Arm
y A
nnua
l Fin
anci
al S
tate
men
ts

1
General Fund—Overview
Profile of the ArmyMissionAmerica has the finest Army in the world. As specified in Title 10, U.S. Code,Section 3062, the Army's mission is to defend the landmass of the UnitedStates and its territories, commonwealths, and possessions. The Army is alsorequired to act as directed by Congress to support national policies, implementnational objectives, and overcome any nations responsible for aggressive actsthat imperil the peace and security of the United States.
The Army works with the other branches of the military, providing forcescapable of sustained combat on land. Ensuring during peacetime that Armyforces are organized, trained, equipped, and ready to act when called uponrequires enormous work. As such, the Army never stands still: always drawingon the lessons of the past, its leaders constantly seek new and imaginativeways to prepare for the future.
General Fund

“Im
agin
atio
n •
Inno
vatio
n •
Initi
ativ
e”
2
FY02
Uni
ted
Sta
tes
Arm
y A
nnua
l Fin
anci
al S
tate
men
t
The Army's primary mission is warfighting, and in this it has no equal, but itscapabilities enable it also to accomplish many other missions in support of the
national objectives. Prepared at all times to fight and win thenation's wars, its soldiers also are ready to be dispatchedanywhere in the world to save lives, protect property, or keepthe peace. In 227 years, the Army never has failed the nation.
In addition to these responsibilities, the Army has aresponsibility to use wisely the public funds entrusted to it.Despite comprising 33 percent of all active military forces inFY 2002, the Army accomplished its missions and prepared for
future missions while consuming only 23 percent of the funds allocated to theDepartment of Defense.
How the Army Accomplished Its MissionsThe events of September 11, 2001, thrust America into a war on terrorism thathas engaged the Army in operations around the globe. America's position asthe world's sole superpower means that it has at the same time other uniqueresponsibilities in what is an increasingly complex post-Cold War world. TheArmy helped America fulfill those responsibilities in FY 2002.
War FightingThe Army was involved deeply in the war on terrorism throughout FY 2002.In Afghanistan, Army Special Operations Forces, followed rapidly by
conventional forces, contributed greatly to the overthrow of theTaliban. Working with Afghan militia and in partnership withthe forces of the other U.S. services and of America's allies, theArmy significantly disrupted the Al Qaeda terrorist network,liberated the people of Afghanistan from Taliban rule, andhelped install an interim government in Kabul. This wasaccomplished in a few short months, over inhospitable terrainduring the dead of winter, 7,000 miles from American shores.The 14,000 soldiers deployed in and around the theater ofoperations in support of Operation Enduring Freedom,positioned from Egypt to Pakistan and from Kenya toKazakhstan, clearly demonstrated the necessity of maintaining atrained and ready force.
What We DoWarfighting
Peacekeeping
Humanitarian Aid
Homeland Security
A Special Operations soldier, prepared to call in closeair support, watches an assault on anti-Talibanforces. Photo courtesy of AUSA.

In all aspects of this new war, the Army has demonstrated imagination andinitiative in accomplishing a wide range of missions. In Afghanistan, Americaemployed indigenous forces in a way that may serve as a model for futureconflicts, relying on them to do much of the early fighting on the ground. The5th Special Forces Group overcame differences in language, culture, tactics,and weapons to organize the disparate Afghan militia into an effective fightingforce. Operating in a joint environment, the Afghan militiaultimately took maximum advantage of American air power tosweep rapidly the Taliban from power.
The Special Forces mission did not end with the liberation ofthe Afghan people. Afghanistan needs a stable government,supported by a trained and disciplined army, to ensure it doesnot revert to being a haven for terrorists. Engagement in foreigninternal defense is fundamental to America's efforts to promoteregional stability, and the 3rd Special Forces Group contributedsignificantly to this task in Afghanistan by training localrecruits, as many as 2,400 at a time, in soldier skills. Drawnfrom all elements of Afghan culture, these enlistees are thenucleus of a national Afghan army that ultimately will becapable of providing security for the Afghan people within thecountry's borders and of sustaining an environment able tofoster economic development and the establishment of civilianinstitutions and infrastructure.
The Army's conventional forces also have played an importantrole in the war on terrorism. As the Taliban regime collapsed,hundreds of Taliban and Al Qaeda fighters took refuge in themountains of Afghanistan. Operation Anaconda, led byelements of the 101st Airborne Division (Air Assault) and the10th Mountain Division, operating in concert with SpecialForces and indigenous groups, was mounted to root out andneutralize these forces.
fy02General Fund
3
New recruits of the Afghan National Army practicesaluting in their new uniforms at the Afghan NationalArmy training site in Kabul, Afghanistan.
Soldiers from the 10th Mountain Division negotiate anarrow trail in the Afghan mountains. Photo courtesyof AUSA.

“Im
agin
atio
n •
Inno
vatio
n •
Initi
ativ
e”
4
FY02
Uni
ted
Sta
tes
Arm
y A
nnua
l Fin
anci
al S
tate
men
t
Subsequent to the fall of the Taliban, America transferredhundreds of high-risk detainees from the theater of operationsto Guantanamo, Cuba. The Army has provided five militarypolice companies from the active Army, the National Guard,and the Army Reserves to secure these detainees and to ensurethey are provided properly with food, water, shelter, cleanclothes, blankets, and medical treatment. In Afghanistan, theArmy continues to perform an important role in maintaining anAmerican presence there, guarding key airfields, andcoordinating with government and humanitarian agencies.
The Army's role in the war on terrorism is not confined toAfghanistan. When America recognized the threat of terrorist activityemanating from the Republic of Georgia, it again turned to Army SpecialForces soldiers to help that nation's government deal with the threat. Under theGeorgia Train and Equip Program, the Army is training the Georgian Armystaff in the principles of devising standardized procedures, training plans, andoperational plans. This will be followed by tactical training up to platoonlevel. The program also calls for the provision to Georgia of uniforms,communications equipment, medical equipment, small arms, ammunition,fuel, and other military gear.
These examples illustrate just a few of the diverse tasks and challenges thatthe first war of the 21st century has placed before the Army. America's pastinvestment in its Army has ensured that it has a force flexible enough to meetthese challenges. Today the efforts in support of Operation Enduring Freedom
cost approximately $365 million a month. This is an investmentAmerica must make to preserve its freedom.
PeacekeepingThe requirement to fight terrorism has not reduced the Army'sresponsibilities elsewhere as peacekeeper. Throughout FY 2002the Army continued in this role in Bosnia, Kosovo, and theSinai.
In Bosnia the Army is engaged in a battle of ideas as it supportsefforts to move the culturally diverse and strife-torn Bosnianpeople toward democracy. Working within the international
Military police from Fort Hood, TX, conduct training atGuantanamo, Cuba, prior to arrival of first detainees.
Under Secretary of the Army Les Brownlee preparesto ride on night patrol.

Stabilization Force (SFOR), Army units act as enablers in this effort byhelping maintain an environment in which democratic ideals can flourish.SFOR, which works in cooperation with nongovernmental agencies, themedia, and others, provides a vivid demonstration of howAmerican soldiers in a diverse international force can act inharmony in the pursuit of peace.
Policy calls for Army units to rotate through SFOR on a six-month basis. At the start of FY 2002, SFOR was led by the29th Infantry Division of the Virginia and Maryland ArmyNational Guard; early in the fiscal year, the mission passed tothe active component's 25th Infantry Division from Hawaii,which in turn passed it on to the 28th Infantry Division of thePennsylvania Army National Guard. Regardless of who leadsSFOR, it is always made up of a mixture of active and reservecomponent forces.
SFOR was assigned a variety of missions in FY 2002. For example, soldiersprovided medical assistance to the 175 villagers of Srednja Trnova, who hadnot seen a doctor in several years. The villagers were in dire financial straightsand had no transportation to the nearest medical facility 12 miles away. SFORdoctors treated patients from the village for pneumonia, cataracts, andglaucoma; they also extracted 57 teeth. In another mission,Joint Military Affairs soldiers trained by the HumanitarianDemining Training Center at Fort Leonard Wood, Missouri,trained and monitored Bosnian forces in the clearing of minesthat threatened the civilian population and others.
The Army has accomplished a great deal in this troubled part ofthe world. Its achievements can be measured readily in thenumber of families returned to their homes, the area of landcleared of mines, and the reduction of ammunition storagesites. In another vital area the Army's achievement is measuredless easily: that of the contribution made to American security.The events of September 11, 2001, raised concerns that Bosnia,because of its disorder and turbulence, might emerge as a haven for those whowish to do harm to the United States. The success of SFOR as a stabilizingforce has prevented this from happening.
fy02General Fund
5
SFOR Accomplishmentsin FY 2002
Returned more than 2,400displaced families to pre-warhomes
Cleared mines from morethan 300 square kilometersof land
Eliminated 17 weaponsstorage sites
SGT Patrick Lum of Company B 54th EngineerBattalion checks authorization documents of farmerstransporting a load of wood. Photo courtesy of AUSA.

“Im
agin
atio
n •
Inno
vatio
n •
Initi
ativ
e”
6
FY02
Uni
ted
Sta
tes
Arm
y A
nnua
l Fin
anci
al S
tate
men
t
Working within the framework of the Kosovo Force (KFOR), the Army also ishelping to keep the peace in Kosovo, an area formerly of Yugoslavia that istroubled with ethnic rivalries. In FY 2002, soldiers from the 10th MountainDivision relieved a combined force from the 101st Airborne Division (AirAssault) and the 3rd Infantry Division. Their leaders charged the soldiers ofKFOR to leave Kosovo a better place than they found it. In addition toundertaking operations similar to those performed in Bosnia, KFOR soldiersare sharing management techniques with indigenous Kosovar and UnitedNations forces. One American senior noncommissioned officer recognizedthat the Kosovo Protection Corps (KPC) had no operational managementsystems in place, and as a consequence was continuing to pay individuals whowere no longer part of the KPC. Because of the initiative of this Americansoldier, 1.3 million deutsche marks (about $650,000) was recovered and put to
better use.
Peacekeeping also continues in the Sinai. As part of the 1979Camp David Accords, the Army, since 1981, has providedforces to act as a buffer between Israel and Egypt. In FY 2002the Oregon National Guard replaced the 172nd SeparateInfantry Brigade, an active component unit that had beenscheduled to assume this mission. This is only the second timea reserve component force has been called upon in this capacity,the late substitution releasing the 172nd for possible duty in thewar on terrorism. The move exemplifies the flexibility oftoday's Army.
Humanitarian EffortsAmerica is a caring nation and its Army reflects that in itsoperations. In FY 2002, even as it was involved heavily in a
war in Afghanistan, the Army exercised its capacity to care for people in need.
Across Afghanistan, the Army has deployed civil affairs teams to provide foodand technical assistance to local people and to assist in rebuilding theinfrastructure of the country. Many humanitarian agencies had been forced bythe Taliban to maintain a low profile. In the early days of Operation EnduringFreedom, Army civil affairs teams sought out humanitarian workers andencouraged them to resume their work. When aid workers expressed theirconcerns that many refugees were armed, the civil affairs teams worked withSpecial Forces who, in turn, coordinated with Afghan forces to removeweapons from the camps. This allowed the aid workers to resume safely theiroperations.
"We have fed 7,000families in fourweeks. The civilaffairs teams havereally helped us…"
Simon BrooksChief, Red Cross Sub-Delegation
Mazar E Sharif
U.S. Army Lieutenant. Laurie Green, a platoon leaderwith Company B, 92nd Engineer Battalion, helps anAfghan child try on her new coat. The coats weredonated by school children in Green's hometown ofMorehead City, NC (Photo by Pfc. J. Wilson Guthrie,314th Press Camp Headquarters.)
"The Army is trulyintegrated. I cannottell the differencebetween active duty,Guard, and Reservesoldiers when I meetwith them all overthe world."
Thomas E. WhiteSecretary of the Army

The Army also worked with coalition forces in Afghanistan to bring healthcare to those most in need. For example, American Special Forces soldierstrained Jordanian Special Forces soldiers to secure properly a hospitallocation; soldiers from the 10th Mountain Division then combined withJordanian soldiers to build a tent hospital. Sited in Mazer E Sharif, the hospitalwas completed in just 10 days. The U.S. Army Medical Care Center (Europe)provided more than 7,500 medical supply items to the 200 Jordanians runningthe hospital, which with two operating rooms, 15 surgeons, and experts in 20specialties is one of the most modern hospitals in the country.
The Army also maintained and demonstrated its capability to respondelsewhere. When an ammunition depot located near housing areas and twoschools in Nigeria exploded, the Army responded at the request of the U.S.embassy. Medical teams, explosives experts, and others deployed from Europeto dispose of unexploded ammunition and to instruct the local population inhow to recognize and deal with unexploded ordnance. This team enabledhundreds of Nigerians to return to their homes and resume their lives in safety.
As the year drew to a close, the Army demonstrated also its capacity to reactat home. About 1,000 National Guard soldiers responded to the floods causedby Tropical Storm Isidore, staffing emergency relief shelters, transportingpeople and equipment through the flood waters, and serving on securitydetails.
Homeland SecurityIn addition to its operations abroad, post-September 11, 2001, the Army hasdevoted significant resources to defense of the homeland. In ways clearlyvisible to the public at large and in other ways not so visible, the Army hasresponded to the new threat at home.
In the immediate wake of the terrorist attacks, more than 5,000 NationalGuard soldiers were deployed to 442 airports nationwide to help secure airtravel. Trained by the Federal Aviation Administration to work with the U.S.Marshals and the Border Patrol, these soldiers monitored the alertness ofairport security personnel and helped operate security checkpoints.
Another 1,500 National Guard soldiers were deployed along America'sborders with Canada and Mexico. Working with the Immigration and
fy02General Fund
7
"To make sure weimprove security
right now, the federalgovernment will pay
…to…placeGuardsmen…inairports…so the
traveling public willknow that we are
serious about airlinesafety in America."
President George W. Bush

“Im
agin
atio
n •
Inno
vatio
n •
Initi
ativ
e”
8
FY02
Uni
ted
Sta
tes
Arm
y A
nnua
l Fin
anci
al S
tate
men
t
Naturalization Service and the Customs Service, these soldiers eased thepressure on a work force that had been working 12 to 15-hour shifts in theaftermath of the terrorist attacks. Inspecting vehicles and luggage, they helped
realize a 50 percent increase over the previous year in arrestsand seizures of illegal drugs.
In FY 2002, assuring the security of the Olympics in Utah alsobecame a significant concern. With 70,000 spectators a day,15,000 accredited media personnel, and a worldwide televisionaudience, the games potentially were a prime terrorist target.About 3,100 National Guard soldiers assisted in searchingvehicles and buildings and performing X-ray searches. Othersoldiers were present to provide reaction teams in the event ofan attack involving weapons of mass destruction. The gameswere a great success, passing without incident.
The Army also worked behind the scenes in ways not sovisible. In the aftermath of the anthrax attacks, Army doctors atWalter Reed Army Medical Center began studying how theinfection develops and began testing antibiotics to determinewhich is most effective against it. They also are using nuclearmedicine to track the infection, with the goal of drasticallyreducing diagnostic times. Early diagnosis is essential inprotecting the public from these types of terrorist attacks.
The Army additionally is taking an active role in studying howto improve America's response to terrorism. For example, theArmy War College included homeland security as part of itsannual Strategic Crisis Exercise, with the goal of developingand sharing with government leaders new ideas for respondingto potential threats and attacks. Representatives of the FBI,
Justice Department, and the Federal Emergency Management Agency joinedin the exercise to gain a better understanding of the challenges of maintaininghomeland security and to clarify the different areas of responsibility.
Dr. David Norwood of the Army Medical ResearchInstitute of Infectious Diseases wears a protectivesuit to process samples that could pose a hazard.Photo courtesy of AUSA.
An Army National Guard soldier checks a vehicle inSalt Lake City. Photo courtesy of AUSA.

Vision for the FutureThe Army must balance at all times the twin imperatives ofmaintaining readiness today and assuring preparedness fortomorrow. Even while engaged in its many diverse missions ofFY 2002, the Army continued to plan for the future. In doingso, it is guided by a clear vision: People, Readiness, andTransformation.
PeoplePeople—soldiers, civilians, retirees, and families—are theArmy. They make the sacrifices and take the risks necessary todefend this nation; they must therefore be of the highest quality.A new recruiting campaign —"An Army of One" — waslaunched to raise public awareness of and interest in thepotential of an Army career, and in FY 2002 the Army met itsrecruiting goals early. It also succeeded in improving thequality of its recruits over FY 2001.
It is not sufficient merely to recruit soldiers of the right caliber.Having done so, the Army must retain them. Ensuring theirwell-being is vital to this effort. America can never compensate adequately itssoldiers for the sacrifices they make, but the Army at least must ensure that itssoldiers can provide for themselves and their families. In FY 2002, soldiersreceived a 4.6 percent pay raise, with additional pay raises granted accordingto grade and years of service. This is a key component of the President'sinitiative to improve quality of life for military personnel. The Army alsoadjusted housing allowances to reduce average out-of-pocket expenses from15 percent in FY 2001 to 11.3 percent in FY 2002.
Another factor critical to well-being is education. To most Americans, soldiersincluded, education is the springboard to a better life. The Army offers itssoldiers abundant opportunities to further their education. More than 23,000soldiers are enrolled in the innovative eArmyU program, an unprecedentedcollaboration with 23 colleges and universities and with hardware andsoftware providers. The Army provides soldiers with full tuition assistance,books and fees, and the technology—a laptop computer, printer, and Internetaccount—to access the more than 4,000 courses that are available online.More than 90 different on-line degrees and certificates are available; already,more than 50 soldiers have completed degrees.
9
The Army VisionPeople
Readiness
Transformation
"So long as theirfamilies are safe
[soldiers] will defendtheir country,
believing that by theirsacrifice they are
safeguarding theirfamilies. But even the
bonds of patriotism… are loosened when
the family … isthreatened."
William TecumsehSherman
General, United States Army1864
fy02General Fund
SMA Tilley takes the reenlistment oath with three 1stInfantry Division (Mechanized) soldiers. Photocourtesy of AUSA.
“Im
agin
atio
n •
Inno
vatio
n •
Initi
ativ
e”
10
FY02
Uni
ted
Sta
tes
Arm
y A
nnua
l Fin
anci
al S
tate
men
t
As warfare evolves and technology advances, the Army of the future will needa new kind of leader. These leaders will be drawn from today's recruits.Through Training and Leader Development Panels, the Army is exploringinnovative ways to develop the officers, warrant officers, noncommissionedofficers, and civilians who will lead it successfully into the future.
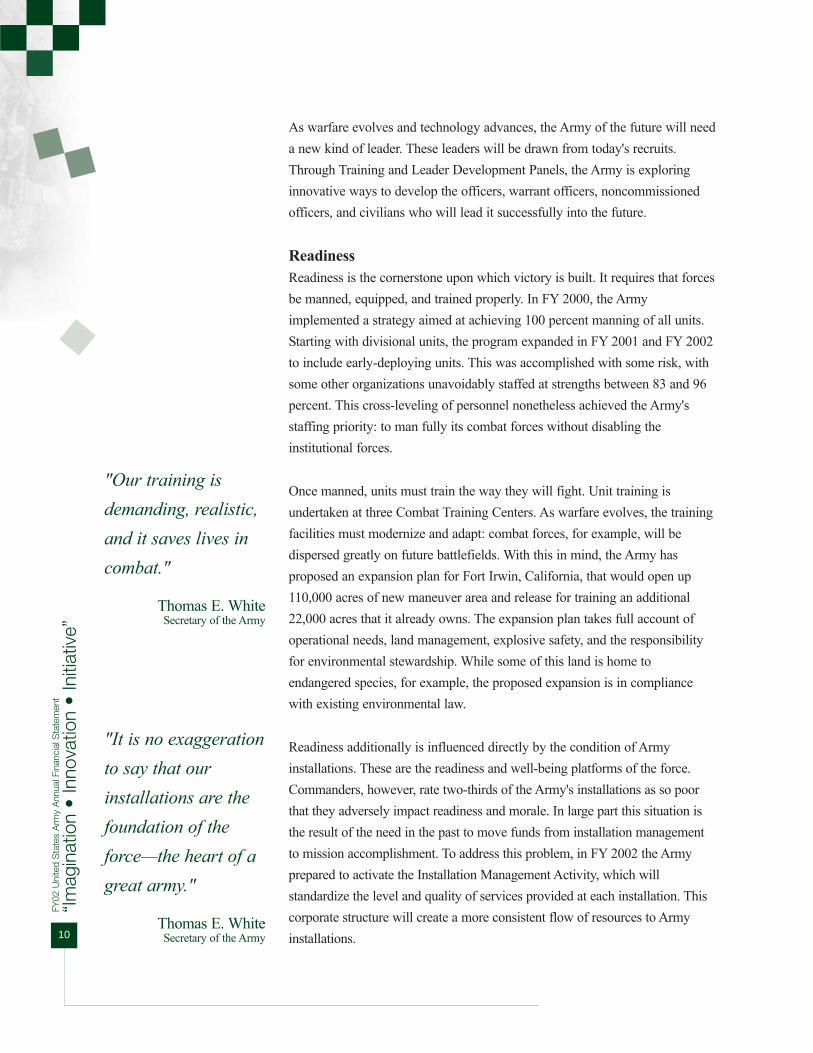
ReadinessReadiness is the cornerstone upon which victory is built. It requires that forcesbe manned, equipped, and trained properly. In FY 2000, the Armyimplemented a strategy aimed at achieving 100 percent manning of all units.Starting with divisional units, the program expanded in FY 2001 and FY 2002to include early-deploying units. This was accomplished with some risk, withsome other organizations unavoidably staffed at strengths between 83 and 96percent. This cross-leveling of personnel nonetheless achieved the Army'sstaffing priority: to man fully its combat forces without disabling theinstitutional forces.
Once manned, units must train the way they will fight. Unit training isundertaken at three Combat Training Centers. As warfare evolves, the trainingfacilities must modernize and adapt: combat forces, for example, will bedispersed greatly on future battlefields. With this in mind, the Army hasproposed an expansion plan for Fort Irwin, California, that would open up110,000 acres of new maneuver area and release for training an additional22,000 acres that it already owns. The expansion plan takes full account ofoperational needs, land management, explosive safety, and the responsibilityfor environmental stewardship. While some of this land is home toendangered species, for example, the proposed expansion is in compliancewith existing environmental law.
Readiness additionally is influenced directly by the condition of Armyinstallations. These are the readiness and well-being platforms of the force.Commanders, however, rate two-thirds of the Army's installations as so poorthat they adversely impact readiness and morale. In large part this situation isthe result of the need in the past to move funds from installation managementto mission accomplishment. To address this problem, in FY 2002 the Armyprepared to activate the Installation Management Activity, which willstandardize the level and quality of services provided at each installation. Thiscorporate structure will create a more consistent flow of resources to Armyinstallations.
"Our training isdemanding, realistic,and it saves lives incombat."
Thomas E. WhiteSecretary of the Army
"It is no exaggerationto say that ourinstallations are thefoundation of theforce—the heart of agreat army."
Thomas E. WhiteSecretary of the Army

Finally, the Army must be able to gauge the net effect of allfactors that impact readiness. Reliable assessment of thecondition of the force and its ability to accomplish its missionrequires reporting that is accurate, objective, and uniform. TheArmy therefore is adopting the Strategic Readiness System(SRS) to measure and manage readiness. SRS is a predictivetool capable of linking costs to readiness, and will enable theArmy to apply effectively its resources to near and far-termrequirements. A prototype SRS is being tested at severalinstallations to ensure that it meets all congressionallymandated reporting requirements and the management needs ofArmy leaders—i.e., the capability to produce a real-timerepresentation of the entire Army, operating forces, institutionalforces, and installations.
TransformationThe Army began Transformation in 1999. The ultimate goal of Transformationis an Objective Force that can dominate across the full spectrum of conflict.While today's heavy forces have unmatched lethality on the battlefield, theylack the strategic mobility to get there quickly; conversely, today's light forcesare strategically mobile, but lack lethality. Transformation to the fullcapabilities envisioned for the Objective Force will be by way of an InterimForce that will combine the best aspects of today's forces and that will act as atesting vehicle for new ways to fight.
The terrorist attacks on America underlined the validity of this strategy and theurgency of creating a more strategically responsive, deployable, lethal, agile,survivable, and sustainable force. Technology will play an important part forthis force, delivering information that will enable leaders and soldiers to assessrapidly a situation and take appropriate action, to seize the initiative, and toattack the enemy at the time of their choosing. Technology is only an enabler,however. Transformation is first and foremost about instituting a culture ofinnovation within the Army, about developing leaders with imagination andinitiative, and about developing highly adaptable, multi-skilled soldierscapable of rapid decisions in a fast-paced, complex environment.
During FY 2002, the Army took several important steps on its road to theObjective Force. It continued with the fielding at Fort Lewis of the first twoStryker brigades and identified the next four brigades that will be transformed,
fy02General Fund
11
Readiness is bolstered by new facilities that improvequality of life, like these new barracks at SchofieldBarracks, HI. Photo courtesy of AUSA.
"Tentativeness andfaintheartedness are
not acceptable."
General Eric K. ShinsekiChief of Staff

“Im
agin
atio
n •
Inno
vatio
n •
Initi
ativ
e”
12
FY02
Uni
ted
Sta
tes
Arm
y A
nnua
l Fin
anci
al S
tate
men
t
including one National Guard brigade, at the cost of about $1 billion perbrigade. The Army also contracted with a Boeing/Scientific ApplicationsInternational Corporation team to act as the integrator for the Future CombatSystem. This team will help integrate a variety of technologies, combining the
best elements of manned systems and robotics, to produce aground combat system of unparalleled power and mobility. TheArmy is scheduled to field the Future Combat System to thefirst Objective Force unit in 2008.
Exercise Millennium Challenge 2002, undertaken by the U.S.Joint Forces Command, provided a vehicle for testing thecapabilities of the Interim Force. Elements of a Stryker brigadecombat team conducted an assault landing at the NationalTraining Center in California, linking up with elements of the82nd Airborne Division that had parachuted in earlier. TheStryker force then moved to 29 Palms and conducted an urbanwarfare exercise with the U.S. Marines before deployingsuccessfully back to Fort Lewis by U.S. Navy experimental
sealift.
The exercise also provided the Army with an opportunity to test emergingconcepts, providing a preview of the new ways of fighting. The Army's III
Corps was designated as the Joint Task Force headquarters justtwo weeks prior to the exercise. The corps quickly integrated a55-person cell from Joint Forces Command along with anoperational command and control architecture to enableoperations across a 3,000-mile battle space. The command andcontrol architecture allowed the commander to communicatehis intent simultaneously to multiple echelons, thereby allowingconcurrent rather than sequential planning, increasing the tempoof operations, and complicating the enemy's efforts to respond.
Through the Interim Force, the Army is developing leaders andsoldiers adept at operating in this environment. Stryker brigadecombat teams are being equipped with the latest availablecommand, control, communications, computers, intelligence,surveillance, and reconnaissance technologies, and leaders and
soldiers in both the current force and the Interim Force are building theexperiential base needed for the initial Objective Force units. Their experience
Using the Force XXI Battle Command Brigade andBelow Frequency Modulation System for tacticalupdates gives the Stryker brigade enhancedsituational awareness. Photo courtesy of AUSA.
Air Force load masters direct Stryker aboard a C-130at the National Training Center, Fort Irwin, CA, duringMillennium Challenge 2002. Photo courtesy of AUSA.

is essential in helping to refine the technology that will underlie the ObjectiveForce, and demonstrates the critical role of people in Army Transformation.
Organizational StructureThe Army is an organization of headquarters, staffs, commands, and unitsintegrated into a single system with a common mission. Because of its sizeand complexity, the Army requires an approach that permits independentaction by its separate parts while ensuring that its leadership retains overallcommand and control. The Army has three distinct subsystems—production,combat, and integrating—each of which operates within its own environment.
The Production SubsystemThe Army is charged with organizing people and machines into theconfiguration best able to perform its mission. The production subsystem,often referred to as the institutional Army, primarily supports the combatsubsystem. Through a number of diverse organizations, the productionsubsystem obtains the raw materials that the Army needs, recruiting people,searching for new technologies, and dealing with the producers of requiredmateriel.
Other elements of this subsystem then convert these raw materials into"intermediate goods;" for example, training centers and schools turn untrainedpeople into tank crewmen, infantrymen, and mechanics. Schools additionallyconvert ideas and knowledge into doctrine, tactics, and training methods toenhance the capability of the combat subsystem. Also, laboratories, arsenals,and procurement and test organizations convert technology and contractoreffort into weapons and equipment for combat.
The two major components of the production subsystem are the Training andDoctrine Command and the Army Materiel Command. The former producesthe training, doctrine, and tactics needed to fight and win America's wars. Thelatter provides the materiel solutions needed by the warfighting units of thecombat subsystem.
The Combat SubsystemThe combat subsystem converts the intermediate goods of the productionsubsystem into mission-ready units. It melds together individual soldiers,pieces of equipment, and doctrine to produce combat readiness. It staysabreast of potential threats and the needs of the unified combatantcommanders to whom it provides ready forces.
fy02General Fund
13
The Army is anorganization of
headquarters, staffs,commands, and units
integrated into asingle system with a
common mission.
“Im
agin
atio
n •
Inno
vatio
n •
Initi
ativ
e”
14
FY02
Uni
ted
Sta
tes
Arm
y A
nnua
l Fin
anci
al S
tate
men
t
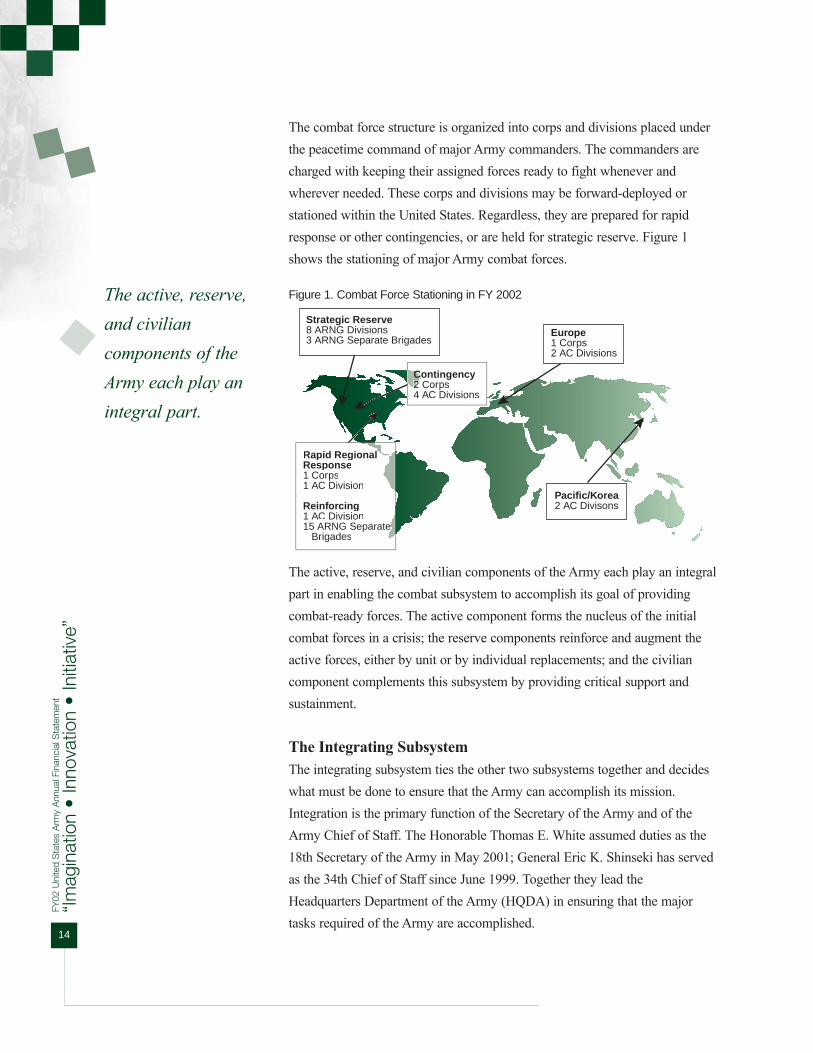
The combat force structure is organized into corps and divisions placed underthe peacetime command of major Army commanders. The commanders arecharged with keeping their assigned forces ready to fight whenever andwherever needed. These corps and divisions may be forward-deployed orstationed within the United States. Regardless, they are prepared for rapidresponse or other contingencies, or are held for strategic reserve. Figure 1shows the stationing of major Army combat forces.
Figure 1. Combat Force Stationing in FY 2002
The active, reserve, and civilian components of the Army each play an integralpart in enabling the combat subsystem to accomplish its goal of providingcombat-ready forces. The active component forms the nucleus of the initialcombat forces in a crisis; the reserve components reinforce and augment theactive forces, either by unit or by individual replacements; and the civiliancomponent complements this subsystem by providing critical support andsustainment.
The Integrating SubsystemThe integrating subsystem ties the other two subsystems together and decideswhat must be done to ensure that the Army can accomplish its mission.Integration is the primary function of the Secretary of the Army and of theArmy Chief of Staff. The Honorable Thomas E. White assumed duties as the18th Secretary of the Army in May 2001; General Eric K. Shinseki has servedas the 34th Chief of Staff since June 1999. Together they lead theHeadquarters Department of the Army (HQDA) in ensuring that the majortasks required of the Army are accomplished.
Strategic Reserve8 ARNG Divisions3 ARNG Separate Brigades
ContingencyCo2 Corps24 AC Divisions
Europe1 Corps2 AC Divisions
Pacific/Korea2 AC Divisons
Rapid RegionalResponse1 Corps1 AC Division
Reinforcing1 AC Division15 ARNG Separatee Brigades
The active, reserve,and civiliancomponents of theArmy each play anintegral part.

HQDA is comprised of two elements: the Army Secretariat (the civilianleadership) focuses on managing the business of the Army, and the Army Staff(military leadership) is responsible for planning, developing, executing,reviewing, and analyzing Army programs.
In performing its integrating function, HQDA determines the nature of theArmy's mission requirements in conjunction with Congress, the Department ofDefense, and the other military services, and by assessing the nature of thethreats faced by the nation. HQDA then charts a course for the Army, securingthe necessary resources and allocating them to best accomplish the mission.HQDA continually monitors the performance of the other subsystems andeffects change when performance does not meet requirements.
In FY 2002 HQDA underwent significant change. Recognizing that it has notkept pace with the changing business environment, the Army is transformingits business practices both to enhance the capabilities and creativity of itspeople and to free up resources to support warfighting and transformation.Starting at the top, the Army began by merging the Secretariat and the ArmyStaff into a single headquarters structure to improve decision-making, toreduce redundancy, to focus better on core competencies, and to redirectpeople and resources thus released from other duties to its war fighting forces.The reorganization of HQDA has had significant impact. Decision-makingauthority is now unified in the Executive Office of HQDA. The Armyeliminated redundancy by defining the responsibility of the Secretariat aspolicy, direction, and oversight and by realigning operational missions to theArmy Staff. Additionally, it returned requirements generation approval to theChief of Staff, putting more discipline in the process. The new HQDAorganization is shown in Figure 2.
fy02General Fund
15
"Boundaries must bebroken to accelerate
change across theentire Army."
Thomas E. WhiteSecretary of the Army

“Im
agin
atio
n •
Inno
vatio
n •
Initi
ativ
e”
16
FY02
Uni
ted
Sta
tes
Arm
y A
nnua
l Fin
anci
al S
tate
men
t
Figure 2. New HQDA Organization
The reduction of headquarters layers will enable much more effective use ofthe Army's financial resources. For example, the Army has unified itsacquisition effort under a single acquisition executive, with the result thatfunding now flows directly from the acquisition executive to programmanagers. The reorganization of HQDA has eliminated thus far more than 700headquarters management account spaces, which now are available to thecombat and production subsystems. HQDA reduction will continue as furthernon-core functions are identified and eliminated.
}ASA Manpower & Reserve
Affairs
ASA Install's and Environ
ASA Civil Works
ASA Acquis, Log. & Tech [Mil
Dep, Acquis]
ASA Financial Mgmt. & Comptroller [Mil Dep
Budget]
Chief Info Officer/G6
Admin. Assistant
Chief of Legislative
Liaison
The Inspector General
The Army Auditor General
Chief of Public Affairs
General Counsel
Small & Disadvantaged
Business Utilization
Chief of Chaplains
Executive Office the
HQDA (EOH)
The Surgeon General
Chief Army Reserve
Chief, NGB
The Judge Advocate General
MACOMs
G-1 G-4 G-8 G-3 G-2ACS Install.'n Mgmt.
Chief of Engrs
SECARMYUSA
CSAVCSA
DirectoryArmy Staff
Clearly defined responsibilities to ASAOversightResponsible to ASA for advice and assistance in functional areaMACOM Commanders

General Fund Performance Results:Mitigating DoD Risk DimensionsThe Government Performance and Results Act (GPRA) of 1993 seeks toimprove government-wide program effectiveness, government accountability,and, ultimately, public confidence by requiring federal agencies to identifymeasurable annual performance goals against which actual achievements canbe compared. Each agency additionally is required to submit a comprehensivestrategic plan that identifies its major goals and objectives. The DoD StrategicPlan is defined in the Quadrennial Defense Review (QDR) of September2001, which established a four-dimensional risk framework designed to ensurethat DoD is sized, shaped, postured, and committed appropriately. In supportof the risk management framework, the Army has identified a series ofperformance measures to enable the assessment of progress in keyperformance areas toward the accomplishment of DoD policy goals. Theseperformance measures, which are described in the following section, willguide Army leaders in making the decisions that will assure its futurereadiness.
DoD Risk Management DimensionsFollowing the September 2001 QDR, DoD developed a four-dimensional riskassessment framework to enable it to evaluate tradeoffs between fundamentalobjectives that have been made unavoidable by resource constraints. Usingthis framework, DoD addresses the issues associated with developing andevaluating the operational force, its infrastructure, and key enablingcapabilities. In turn, the Army has identified a series of performance metricsthat address each of the risk management dimensions established by the QDR.Each measure is supported by a quantifiable output. The four risk dimensionsand the corresponding Army performance measures are defined as follows:
1) Force Management — "the ability to recruit, retain, train, and equipsufficient numbers of quality personnel and sustain the readiness of theforce while accomplishing its many operational tasks."
The Army measures force management risk by reporting and evaluating thefollowing metrics:
Enlisted Recruiting
Recruit Quality Benchmarks
fy02General Fund
17
Performancemeasures will guide
Army leaders inmaking the decisions
that will assure theArmy’s future
readiness.

“Im
agin
atio
n •
Inno
vatio
n •
Initi
ativ
e”
18
FY02
Uni
ted
Sta
tes
Arm
y A
nnua
l Fin
anci
al S
tate
men
t
Enlisted Component Retention Rates
Select Reserve Attrition Rates
2) Operational — "the ability to achieve military objectives in a near-termconflict or other contingency."
The Army measures operational risks by reporting and evaluating thefollowing metrics:
Army Overseas Presence
Number of Overseas Exercises
Force Levels
Number of Flying Hours per Month
Number of Tank Miles per Year
Forces Supported by Land- and Sea-Based Prepositioning
3) Future Challenges — "the ability to invest in new capabilities and developnew operational concepts needed to dissuade or defeat mid- to long-termmilitary challenges."
The Army measures risks posed by future challenges by reporting andevaluating the following metrics:
Annual Procurement Spending
Successful Completion of Operational Test and Evaluation Events
4) Institutional —"the ability to develop management practices and controlsthat use resources efficiently and promote the effective operation of theDefense establishment."
The Army measures institutional risks by reporting and evaluating thefollowing metrics:
Public/Private Sector Competitions
Disposal of Excess Property
Percentage of Paperless Transactions

The Army's ability to respond quickly anywhere in the world is a direct resultof its commitment to maintaining readiness. The readiness we enjoy today is,in turn, a direct result of many years of investment in high-quality people,training, doctrine, force mix, modernization, and leader development. Thefollowing performance measures ensure that the Army maintains ready forces,properly supplied, with the ability to respond to any crisis, to shape theinternational environment, and to protect America's citizens, interests, andfriends whenever and wherever needed.
Risk Area: Force ManagementThe primary mission of Army personnel management is to put the right personwith the right skills in the right place at the right time. As it strives to fulfillthis mission it finds itself asking more of a smaller force, making it imperativethat it have the best people available to perform its duties. No amount oftechnical superiority will enable the Army to respond to its future challenges ifit fails to maintain the quality of its personnel by not making the investmentsnecessary to develop them to their full potential. Recruiting and training thebest soldiers, officers, and civilians in the proper mix of specialties and gradelevels requires an adequate compensation package, sufficient medical care andretirement programs, and opportunities for career advancement. The Armyaccordingly is committed to providing adequate funding to recruit, train, andretain our personnel to Congressionally mandated strength and qualitystandards. The following performance measures assist us in tracking ourprogress toward ensuring that it meets the needs of soldiers.
Performance Measure: Enlisted RecruitingMetric: Enlisted recruiting represents the projected number of new personnelneeded each year to maintain statutorily defined military end-strengths and theproper distribution by rank.
Output: During FY 2002, the Army exceeded its enlisted recruiting goals forall components.
Table 1. Enlisted Recruiting
FY 2000 FY 2001 FY 2002 Actual Actual Goal Actual
Active Army 80,113 75,855 79,500 79,585
National Guard 62,015 61,956 60,545 63,251
Army Reserve 48,596 42,097 38,857 41,697
fy02General Fund
19
The Army strives toput the right
person with the rightskills in the rightplace at the right
time.

“Im
agin
atio
n •
Inno
vatio
n •
Initi
ativ
e”
20
FY02
Uni
ted
Sta
tes
Arm
y A
nnua
l Fin
anci
al S
tate
men
t
Performance Measure: Recruit Quality BenchmarksMetric: The quality benchmarks for recruiting were established in 1992,based upon a study conducted by DoD and the National Academy of Sciences.The results produced a model linking recruit quality and recruiting resourcesto the job performance of enlistees. The Army has adopted the DoD recruitingtargets that were derived from the model—90 percent high school diplomagraduates and 60 percent top-half aptitude personnel (AFQT categories I-III)—as its minimum acceptable quality thresholds. Adhering to thesebenchmarks will reduce personnel and training costs while ensuring that theArmy meets its high performance standards.
Output: During FY 2002, the Army exceeded its quality benchmarks foractive and reserve high school diploma graduates (HSDGs). Enlistment inboth the active and reserve components exceeded the DoD target that aminimum of 67 percent of enlistees score in the top half of the Armed ForcesQualification Test (AFQT), and enlistment in the reserve componentfurthermore exceeded the Army's self-imposed goal of 68 percent top-halfapplicants.
Table 2. Quality Benchmarks for Enlisted Recruits (percentage)
NOTE: AFQT = Armed Forces Qualification Test. The AFQT is a subset of the standard aptitude testadministered to all applicants for enlistment. It measures math and verbal aptitude and has proven tocorrelate closely with trainability and job performance.
Performance Measure: Enlisted Component Retention RatesMetric: Army retention goals have been in flux for almost a decade, as theArmy has moved toward the force reduction targets made at the end of theCold War. The draw-down is now effectively over, and personnel levels arestabilizing. Retention rates are based on required staffing in each pay grade;unlike the other services, the Army has historically managed retention bysetting firm numeric targets for the number of personnel expected to reenlist.
FY 2000 FY 2001 FY 2002 Actual Actual Goal Actual (Active/Reserve) (Active/Reserve) (Active/Reserve)
Recruits Holding High School Diplomas 90.3/90.1 90.2/92.7 90 91/93.8
Recruits in AFQT Categories I-IIIA 63.5/61.9 63.2/64.6 67 68/68.5
Recruits in AFQT Category IV 2.0/2.0 1.9/1.6 2 1.4/0.5

Output: The Army exceeded its FY 2002 retention goal for first-term soldiersby 2 percent. It also saw a slight increase in the retention of second-termsoldiers, exceeding the performance goal for second-term soldiers by almost 2percent.
Table 3. Active Component Enlisted Retention Rates
Performance Measure: Selected Reserve AttritionRatesMetric: The Army employs attrition rates rather thanreenlistment rates to assess retention trends in the ArmyNational Guard and Army Reserves. Attrition is computed bydividing total losses for a fiscal year by the average personnelstrength for that year. This metric is preferable because only asmall portion of the entire reserve population is eligible forreenlistment during a given year.
Output: During FY 2002, the Army National Guard SelectedReserve had an attrition rate of 20.3 percent, which exceededthe ceiling of 19.5 percent and which marked also a 0.5 percentdegradation from the FY 2001 rate for the National Guard. TheArmy Reserve, in contrast, had a Selected Reserve attrition rate of 23.4percent, which was below the ceiling rate of 25.2 percent.
Table 4. Selected Reserve Enlisted Attrition Rates (percentage)
Risk Area: OperationalThe Army needs to manage its forces such that they are appropriately sized toaccomplish both near-term war fighting tasks and small-scale contingencies.The metrics used in the past to assess readiness were designed and evaluated
FY 2000 FY 2001 FY 2002 Goal Actual (Ceiling)
Army National Guard 20.9 19.8 19.5 20.3Army Reserve 27.8 26.2 25.2 23.4
FY 2000 FY 2001 FY 2002 Actual Actual Goal Actual
First-Term Soldiers 21,409 20,000 19,000 19,433
Second-Term Soldiers 24,118 23,727 22,700 23,074
fy02General Fund
21
CPT Rebecca Leggieri reenlists MSG Troy Falardeau.Both are assigned to the Office of the Chief, ArmyReserve. Photo courtesy of AUSA.
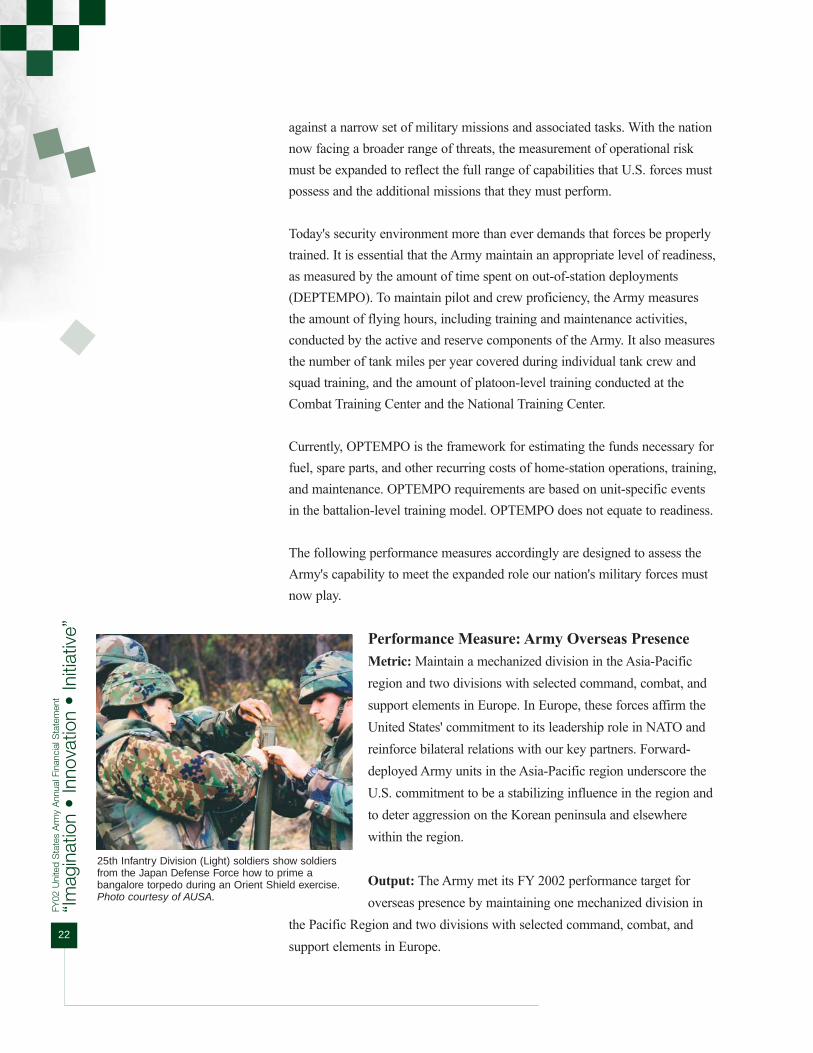
“Im
agin
atio
n •
Inno
vatio
n •
Initi
ativ
e”
22
FY02
Uni
ted
Sta
tes
Arm
y A
nnua
l Fin
anci
al S
tate
men
t
against a narrow set of military missions and associated tasks. With the nationnow facing a broader range of threats, the measurement of operational riskmust be expanded to reflect the full range of capabilities that U.S. forces mustpossess and the additional missions that they must perform.
Today's security environment more than ever demands that forces be properlytrained. It is essential that the Army maintain an appropriate level of readiness,as measured by the amount of time spent on out-of-station deployments(DEPTEMPO). To maintain pilot and crew proficiency, the Army measuresthe amount of flying hours, including training and maintenance activities,conducted by the active and reserve components of the Army. It also measuresthe number of tank miles per year covered during individual tank crew andsquad training, and the amount of platoon-level training conducted at theCombat Training Center and the National Training Center.
Currently, OPTEMPO is the framework for estimating the funds necessary forfuel, spare parts, and other recurring costs of home-station operations, training,and maintenance. OPTEMPO requirements are based on unit-specific eventsin the battalion-level training model. OPTEMPO does not equate to readiness.
The following performance measures accordingly are designed to assess theArmy's capability to meet the expanded role our nation's military forces mustnow play.
Performance Measure: Army Overseas Presence Metric: Maintain a mechanized division in the Asia-Pacificregion and two divisions with selected command, combat, andsupport elements in Europe. In Europe, these forces affirm theUnited States' commitment to its leadership role in NATO andreinforce bilateral relations with our key partners. Forward-deployed Army units in the Asia-Pacific region underscore theU.S. commitment to be a stabilizing influence in the region andto deter aggression on the Korean peninsula and elsewherewithin the region.
Output: The Army met its FY 2002 performance target foroverseas presence by maintaining one mechanized division in
the Pacific Region and two divisions with selected command, combat, andsupport elements in Europe.
25th Infantry Division (Light) soldiers show soldiersfrom the Japan Defense Force how to prime abangalore torpedo during an Orient Shield exercise.Photo courtesy of AUSA.

Table 5. Army Overseas Presence
Performance Measure: Number of Overseas ExercisesMetric: The overseas exercise program demonstrates U.S. resolve and ourability to project forces to locations abroad in support of our national interestsand our commitments to our allies. The program provides joint force trainingthat emphasizes interoperability, joint warfighting doctrine, and rapiddeployment. Such training provides opportunities to test and evaluate U.S. andhost nation systems, lines of communication, and support agreements. Eachyear the Army establishes a goal (schedule of exercises) for the number ofJoint and Combined Exercises.
Output: During FY 2002, the Army conducted 78 of the 80 scheduledoverseas joint and combined exercises. The number of exercises scheduledeach year is affected by various political and operational reasons. No majorexercises were cancelled in FY 2002.
Table 6. Number of Overseas Exercises
Performance Measure: Army Force LevelsMetric: The force structure requirements for the Active Army Corps, Activeand National Guard Divisions (including heavy and light divisions), ArmoredCavalry Regiments, and Enhanced Brigades were established to meet theintent of the QDR by reflecting the needs for existing forces and adequatepreparation for the future.
Output: During FY 2002, Army force levels were in line with the goalsestablished in the QDR for the Active Army Corps, Active and National GuardDivisions (including heavy and light divisions), Armored Cavalry Regiments,
FY 2000 FY 2001 FY 2002 Actual Actual Goal Actual
Number of Joint and Combined Exercises 71 77 80 78
FY 2000 FY 2001 FY 2002 Actual Actual Goal Actual
Mechanized Divisions in Pacific Region 1 1 1 1
Divisions with Elements in Europe 2 2 2 2
fy02General Fund
23
Today's securityenvironment more
than ever demandsthat forces be
properly trained.

“Im
agin
atio
n •
Inno
vatio
n •
Initi
ativ
e”
24
FY02
Uni
ted
Sta
tes
Arm
y A
nnua
l Fin
anci
al S
tate
men
t
and Enhanced Brigades. The Army has maintained its forces at the levelsestablished by force reductions conducted from FY 1989 through FY 1996.
Table 7. Army Force Levels
* The 278th Armored Cavalry Regiment was previously classified as both an Enhanced Brigade and anArmored Cavalry Regiment. This resulted in double counting. It is now classified as an Enhanced Brigade only.
Performance Measure: Number of Flying Hours perMonthMetric: Number of aircraft flying hours per month, includingtraining and maintenance activities, required for active, ArmyReserve, and Army National Guard components to maintainpilot and crew proficiency.
Output: During FY 2002, the Army fell short of the establishedflying hours goals for the active, Army Reserve, and ArmyNational Guard forces. This shortfall was the result of numerousdeployments, transfers of aircraft due to AviationTransformation, and Safety of Flight (SOF) compliancemessages. There were 32 SOF messages in FY 2002, a 14percent decrease from FY 2001.
Table 8. Number of Flying Hours per Month
Note: The active Army converted to Crew OPTEMPO in FY 2000 to meet the requirements of the AviationRestructure Initiative (ARI), which increased the number of aviators in combat units from a 1-to-1 aircraft-to-crew ratio to 1-to-1.23.
Performance Measure: Number of Tank Miles per YearMetric: Tank miles represents the average level of peacetime activity—including in-field training, combat simulations, and equipment maintenance—
FY 2000 FY 2001 FY 2002 Actual Actual Goal Actual
Active 12.8 13.1 14.5 13.1
Army Reserve 8.5 8.9 9.0 8.9
National Guard 6.3 5.9 9.0 6.6
FY 2000 FY 2001 FY 2002 Actual Actual Goal Actual
Active Corps 4 4 4 4
Divisions (Active/National Guard) 10/8 10/8 10/8 10/8
Active/National Guard Armored Cavalry Regiments* 2/0 2/0 2/0 2/0
Enhanced Brigades 15 15 15 15
A flight of Apaches takes off from a Polish airfieldduring V Corps' Victory Strike II exercise, whichhoned deep-attack skills. Photo courtesy of AUSA.

needed to achieve wartime proficiency standards, as defined by Army doctrine.
Output: Overall, Army ground training continued to exhibit a positive trendduring FY 2002. The active Army exceeded its home-station training target of931 tank miles, and the Army National Guard (ARNG) forces recorded anincrease in tank miles from FY 2001 performance levels. In response toCongressional concerns, virtual miles were reported this year along withactual miles.
Table 9. Number of Tank Miles per Year
a FY 2002 is first year of new reporting methodology reflecting both live and virtual miles.b Composite average of all National Guard units, including annual mileage for ARNG Divisions and Enhanced
Brigades.
Prepositioning of military equipment and supplies near regionswhere conflicts potentially may arise shortens the Army'sresponse time in contingencies and assures its capability toproject power from the continental United States, Alaska, andHawaii to trouble spots anywhere in the world. Prepositionedstocks are maintained both afloat and on land, and aremaintained at levels necessary to equip and sustain theoperating forces for the lengths of time and levels of conflictoutlined in the National Military Strategy and The Army Plan.At the center of this program are seven armor-heavy brigadeequipment sets, the prepositioning of which enables U.S.-basedsoldiers to fly accompanied by minimal amounts of personaland small equipment, draw a brigade set, and deploy to battlepositions in just days. Prepositioning objectives are based onthe size and structure of the forces calculated as necessary to halt an enemy'sprogress in the very early stages of conflict.
Performance Measure: Forces Supported by Land- and Sea-Based PrepositioningMetric: Land-based prepositioning programs are maintained in Europe,Southwest Asia, and the Pacific region. Sea-based prepositioningcomplements these programs, providing the flexibility to move equipment
FY 2000 FY 2001 FY 2002a
Actual Actual Goal Actual
Active 702 787 931 944
National Guardb 150 113 184 123
fy02General Fund
25
1st Infantry Division tank from the 1st Battalion, 63rdArmor Regiment screams across the Bahna trainingsite in the Czech Republic.

“Im
agin
atio
n •
Inno
vatio
n •
Initi
ativ
e”
26
FY02
Uni
ted
Sta
tes
Arm
y A
nnua
l Fin
anci
al S
tate
men
t
within and between theaters of operation. Additional prepositioning programsprovide base, fuel, and medical support.
Output: During FY 2002, the Army achieved its goal of maintaining fiveland-based and one sea-based prepositioned programs.
Table 10. Forces Supported by Land- and Sea-Based Prepositioning
Risk Area: Future ChallengesThe U.S. military, despite the upheavals of the past decade, has conducted allof its operations successfully. Nonetheless, America cannot take future successfor granted or assume that no other nation or group will attempt to challenge itin the future. The attacks of September 2001 made that clear. Nor can Americapredict with confidence which adversaries will pose threats. The types ofmilitary capabilities that will be used to challenge U.S. interests and militaryforces can, however, be identified and understood. As in the September terrorattacks in New York and Washington, any future adversaries will seek toattack America where it is vulnerable, using asymmetric approaches such aselectronic terrorism and attacks against domestic infrastructure.
It is clear that the Army must shift from a threat-based to a capabilities-basedparadigm. When assessing the risk of future challenges, it can no longer focuson extant threats of military engagement, but must address its capability tomeet potential new challenges. The absence of a current, immediate threat isnot justification to disregard a technology that could overcome that; on thecontrary, introducing technology early both furnishes a military advantage,and may dissuade a potential adversary from pursuing a similar capability.
Performance Measure: Annual Procurement SpendingMetric: To achieve the appropriate balance between modernizationinvestments and Operations and Maintenance (O&M) expenditures, the QDRcalls for a substantial increase in funding for modernization. The Armyaccordingly tracks and reports on its Annual Procurement funding.
FY 2000 FY 2001 FY 2002 Actual Actual Goal Actual
Land-based 6 5 5 5
Afloat 1 1 1 1
America cannot takefuture success forgranted.

Output: Congressional funding for procurement spending for FY 2002increased by nearly 14 percent from the previous year. Since FY 2000 therehas been more than a 26.2 percent increase in procurement funding.
Table 11. Annual Procurement Spending ($ in millions)
*Appropriated dollars are available for spending over a three-year period.
Performance Measure: Successful Completion of OperationalTest and Evaluation EventsMetric: The Army's test and evaluation programs aim to ensurethat all forces are provided with weapons systems andequipment that are effective and suitable for the missions theyare designed to accomplish. In the future, combat systems willbe increasingly interoperable and interdependent. New systemsentering service will have to function effectively not only withother systems in the U.S. inventory but also with weaponry andequipment operated by allied and coalition forces. Theincreased complexity of modern warfare will demand rigorousoperational assessments and testing throughout the acquisitioncycle. The purpose of these assessments is to ascertain, asquickly as possible, how a new system or technology willperform from an operational perspective.
Output: The Army established a goal to complete successfully 49 OperationalTest and Evaluation Events for FY 2002. During FY 2002, the Army met itsgoal by completing 49 of the 49 scheduled tests.
Table 12. Successful Completion of Operational Test and Evaluation Events
FY 2000 FY 2001 FY 2002 Actual Actual Goal Actual
Percentage of OT&E 100% 100% 100% 100%events successfully completed
FY 2000 FY 2001 FY 2002 Actual Actual Goal Actual
President's Budget - Army $8,569 $9,738 $10,424 $12,371
Total Appropriated* $9,241 $10,265 $11,985 $11,666
fy02General Fund
27
The Ronald Reagan Ballistic Missile Defense TestSite on Kwajalein Atoll offers extensive flexibility formissile testing. Photo courtesy of AUSA.

“Im
agin
atio
n •
Inno
vatio
n •
Initi
ativ
e”
28
FY02
Uni
ted
Sta
tes
Arm
y A
nnua
l Fin
anci
al S
tate
men
t
Risk Area: InstitutionalThe Army, along with all U.S. military forces and operations, is changingdramatically in response to resource constraints and advances in technology.Effecting changes in the way the Army conducts its support operations willrequire that business processes also be transformed in order to achieve themost efficient support operations possible. Much like the combat forces,which are becoming more agile and capable, the Army's goal is to produce anincreasingly responsive support structure. Some of the specific types and areasof infrastructure change are financial management, public-private sectorcompetitions, and the disposal of excess property.
Performance Measure: Public/Private Sector CompetitionsMetric: As part of its efforts to reduce infrastructure, the Army conductsregular reviews of various functions and their associated billets. As a result ofthese reviews, some functions are retained in-house, others are outsourced,and others are reengineered.
Output: During FY 2002, the Army conducted 17 public-private sectorcompetitions, resulting in 11 decisions to keep the function in-house and sixcontract decisions to outsource for an annual savings of $87 million.
Table 13. Public Private Sector Competitions
Performance Measure: Disposal of Excess Property.Metric: The maintenance of excess property is wasteful of scarce militaryresources. Disposal of such property frees up funds that can be applied toforce modernization and readiness.
Output: During FY 2002 the Army disposed of 81.3 percent of the excessBase Realignment and Closure (BRAC) acres scheduled for disposal in FY2002. As a result of the disposal of excess real property for FY 2002, theArmy's real property maintenance sustainment costs were $ 331.5 million,based on $4.89 per square foot. In FY 2002, $1.51 million was saved based on$.40 per square foot for 3.8 million square feet.
FY 2000 FY 2001 FY 2002 Actual Actual Goal Actual
Number of positions 2,624 5,115 3,576 2,646subject to A-76 competitions or strategic sourcing reviews

Table 14 - Disposal of Excess Real Property
Performance Measure: Percentage of Paperless TransactionsMetric: The Army is committed to employing contemporary informationtechnology and commercial best practices to reinvent its contracting processes.Contracting, and particularly contracting related to high-cost weapon systems,consumes a large portion of the defense budget and employs a significantportion of the Army workforce. Over time, paperless contracting willcontribute to a reduction in acquisition cycle times and to the streamlining ofthe acquisition workforce.
The Defense Reform Initiative (DRI) set the goal that 90 percent of selectedtransactions be performed electronically by FY 2000, and The NationalPartnership for Reinventing Government (NPR) additionally set the goal ofreducing by 50 percent the number of paper-based transactions performed inFY 2000 from the FY 1997 baseline.
Output: During FY 2002 the Army exceeded all goals for the percentage ofpaperless transactions and exceeded the NPR goal for total electroniccontracting and payment transactions.
Table 15. Percentage of Paperless Transactions
FY 2000 FY 2001 FY 2002 Actual Actual Goal Actual
DRI Goals
Purchase requests 81% 93% 90% 94%
Funding documents 81% 93% 90% 94%
Solicitations 97% 98% 90% 98%
Awards/Modifications 94% 95% 90% 94%
NPR Goal
Total electronic contracting and payment transactions 50% 95% 90% 95%
FY 2000 FY 2001 FY 2002 Actual Actual Goal Actual
BRAC Excess Acreage Remaining for Disposal 201,268 135,310 125,854 127,180
BRAC Acres Disposed of During the Fiscal Year 10,454 65,959 10,000 8,130
BRAC dollars spent during FY ($000) $133,711 $265,100 $167,900 $158,176
fy02General Fund
29

“Im
agin
atio
n •
Inno
vatio
n •
Initi
ativ
e”
30
FY02
Uni
ted
Sta
tes
Arm
y A
nnua
l Fin
anci
al S
tate
men
t
Management IntegrityThe Army's approach to assuring management control and integrity isanchored in the fundamental philosophy that all commanders and managershave an inherent management control responsibility. The HeadquartersDepartment of the Army (HQDA) (the Integrating Subsystem) functionalproponents are responsible for establishing sound management controls intheir policy directives and for exercising oversight to ensure compliance withthese policies. Commanders and managers throughout the Army areresponsible for establishing and maintaining the control and integrity of theiroperations.
Corrected WeaknessPollution PreventionIn 1998 the Army identified that it did not integrate adequately pollutionprevention into all of its programs. It since has identified the criticalrequirements for achieving this integration and has linked all "must fund"environmental management policies to the Army Planning, Programming,Budgeting, and Execution System to ensure that they receive adequateresources. The Army furthermore now integrates environmental qualityconsiderations into its weapons acquisition system and system engineeringprocesses and has developed a pollution prevention training program for usein Army Acquisition Corps training. In FY 2002, the U.S. Army Audit Agencycompleted its review of this weakness and concluded that the Army haseffectively dealt with the issue.
Uncorrected WeaknessesPaperless Contract Writing SystemThe Standard Procurement System (SPS) was intended to be fielded as apaperless contract writing system using electronic data feeds to createelectronic images of contracts viewable by paying offices and to populate theContract Accounts Payable System (CAPS) data fields to effect payments.Army contracting offices currently use SPS to write contracts for vendors atArmy posts, camps and stations with the Defense Finance and AccountingService (DFAS) using CAPS to process payment information for most ofthese contracts. The Army is experiencing numerous problems getting thesesystems to work together effectively. Reliable electronic data feeds fromcontracting offices to CAPS paying offices have not been established tosupport timely and accurate payments of contractors in accordance with Title5, Code of Federal Regulations, Part 1315 (Prompt Payment).
... all commandersand managers havean inherentmanagement controlresponsibility.

The use of contract images posted in the Electronic Document Access for useby DFAS paying offices has not proven reliable yet, requiring the contractingoffices to forward printed copies of the contracts to the paying office.Furthermore, the electronic data file of contract information created by theSPS interface program has been successful only sporadically, requiringmanual entry of vendor payment data upon receipt of the paper contract whenthe electronic data feed fails. This problem has contributed directly to the latepayment interest penalties of about $470,000 in FY 2001 by the Army. Inmany of these cases where the SPS interface failed, the paper contract isreceived well after goods and services are provided to and accepted by thegovernment. If not corrected, Army contracting offices will be required toforward paper contracts to paying offices increasing the likelihood oferroneous contractor payments and unnecessary interest payments. In addition,contracting and paying personnel will not meet the goal of paperlesscontracting, resulting in other inefficiencies in processing these payments.
To correct this problem, the Office of the Assistant Secretary of the Army(Acquisition, Logistics and Technology) (OASA (AL&T)) and DFAS enteredinto a Memorandum of Agreement to address data migration and interfacerequirements for information traveling from SPS to CAPS.
Financial Reporting of General EquipmentThe Army does not meet yet the financial reporting requirements for generalequipment because it cannot present yet the historical cost and depreciationof those assets in its financial statements. While the Army has physicalcontrol over these assets, the absence of any requirement that its originalproperty accountability systems provide for proprietary accounting meansthat historical costs and depreciation expenses were not maintained by thosesystems.
In FY 2002, the Army completed fielding of the Defense PropertyAccountability System (DPAS), resolving the issue of recording historicalcosts and calculating depreciation expenses. The Army Audit Agency willvalidate the effectiveness of this action, and the Army expects to close thisweakness in FY 2003.
Army Purchase Card ProgramThe General Accounting Office (GAO) identified a lack of adherence by fieldactivities to established purchase card internal controls. Although no
fy02General Fund
31

“Im
agin
atio
n •
Inno
vatio
n •
Initi
ativ
e”
32
FY02
Uni
ted
Sta
tes
Arm
y A
nnua
l Fin
anci
al S
tate
men
t
substantial instances of fraud, waste and abuse were identified, anenvironment existed that easily could have fostered fraud. As a result, GAOhas expanded the audit to include a review of the Army and other DefenseComponents.
The Army has addressed positively every GAO finding regarding the ArmyPurchase Card Program. To correct this problem, the OASA (AL&T) hassought aggressively to establish positive controls in the areas whereweaknesses were found.
Previously Reported WeaknessesThe Army reported two weaknesses last year that it had expected to close.Various circumstances prevented this from happening.
Manpower Requirements Determination. The Army is seeking to establisheffective manpower programs for managing and controlling Tables ofDistribution and Allowances (TDA) workload, organizations, and manpowerstaffing. The current system for manpower requirements determination lacksthe ability to link workload, manpower requirements, and dollars. This makesit difficult for managers to support staffing needs, manpower budgets, andpersonnel reductions.
The Army has been pursuing corrective actions since 1997 and expected toeliminate this weakness in FY 2002. However, Army leaders were uncertainthat the adopted path would yield an adequate requirements determinationmethod to allow for rational decision-making. As a result, the Army adjustedits approach to provide the analytic support, validation, and prioritization ofmissions and requirements necessary to provide leaders and managers at alllevels with the information needed to make near-term and out-year manpowerdecisions. The Army expects to complete its efforts in FY 2005.
Financial Reporting of Equipment-in-Transit: The Army does not havereliable data on the value of equipment in-transit. The Army believed it hadaddressed all required issues, but AAA review found that additional work stillis required. The target date for closure of this weakness is FY 2005.

Future Effects of Existing ConditionsOperational RiskThe Army's current force is very similar to that of the Army that 11 years agofought so decisively in Desert Storm. In the intervening years the nature of thethreat facing America has evolved. The force that deployed in the Gulf Warwas developed under a strategy that envisioned a scenario of two simultaneousmajor regional conflicts. The 2001 terrorist attacks on America introduced anenemy instead that would employ asymmetrical warfare to avoid our strengthsand attack our vulnerabilities. It is difficult to assess exactly what form futurethreats will take. As a consequence, the Army has moved away from a threat-based force and is intent on building a capabilities-based force equipped tofunction across the full spectrum of military operations.
Identified as the Objective Force, this new force will fight in a noncontiguousmanner, and will be capable of rapid deployment in a crisis to either fight or,ideally, to deter conflict. It will have the capability of being projectedanywhere in the world—not just to easily accessible areas with multiple airand seaports, but also to remote, landlocked, and infrastructure-poor areas.The importance of this capability was demonstrated in Afghanistan, where therapid engagement of U.S. forces contrasted dramatically with the long build-up that preceded Desert Storm. Failure at this point to develop this capabilityto project sustainable combat power anywhere in the world (i.e., failure torealize the Objective Force) could leave the nation's worldwide interestsvulnerable to attack.
Institutional RiskThe Army must make the best use of its resources in its day-to-day operations.This requires that it transform its business practices to improve its financialmanagement and that it streamline its infrastructure.
Business practices have, in the last decade, changed fundamentally, leading tosignificantly increased productivity, lower costs, and higher-quality outputs.The Army has not kept pace and must transform how it does business so thatit might free up resources that can be applied to the fielding of the ObjectiveForce. Many functional activities need to be examined and improved,streamlined, or eliminated. This requires imagination and innovation.
fy02General Fund
33
The Army has movedaway from a threat-
based force and isintent on building a
capabilities-basedforce.

“Im
agin
atio
n •
Inno
vatio
n •
Initi
ativ
e”
34
FY02
Uni
ted
Sta
tes
Arm
y A
nnua
l Fin
anci
al S
tate
men
t
It is essential to the effort to reduce costs and increase productivity that Armyleaders and managers be supplied with reliable information. The Army'sinability thus far to achieve an unqualified audit opinion on its financialstatements indicates that the information it is given is not reliable, with theresult that resources are not being used to their best effect. The Armyestimates that 80 percent of the data found in its financial systems comes fromfunctional area systems such as logistics, personnel, acquisition, and othersystems. The Army realizes that the capability to deliver reliable informationwill require the integration of these functional management systems withfinancial management systems. Until this is done the Army will continue to beat risk of sub-optimizing its use of resources.
Another way to lower costs is to eliminate unnecessary infrastructure: as muchas 25 percent of the Army's infrastructure is surplus to its needs. However, thedecision to delay for two years the base closure program has obligated theArmy to apply resources to maintenance of this excess infrastructure, andincreased force protection requirements have exacerbated this problem. TheArmy, furthermore, has been forced to delay its investments in infrastructurerevitalization until it becomes clear which installations will be closed andwhich will be kept open. Commanders already rate two-thirds of Armyinfrastructure as so poor that it is damaging to readiness and morale; thesematters can serve only to make the situation worse.
Human CapitalA critical element of Transformation is determining the proper mix of civilian,military, and contractor personnel to assure the Army's success. This includesan assessment of core competencies across the full spectrum of militaryoperations. As the Army seeks to increase its "tooth-to-tail" ratio, it mustcarefully weigh the important roles played by combat support and combatservice support personnel. There is a temptation to reduce the number ofpersonnel that perform these roles in order to convert their positions to combatroles, but there are some essential support positions that must be retained andfilled by military personnel. Logistical support to the troops in combat inparticular must not be compromised.
While many support tasks can be outsourced, the Army must ensure that it canmeet the demands of "the last logistical mile." In many instances, it would notbe appropriate to rely on contractors or civilian employees to perform these

tasks. The Army must, therefore, balance the economic gains of outsourcingagainst the need to ensure that the military force structure can deliver thenecessary logistics on the battlefield. Selecting the right structure for a force of480,000 is a complex task involving many tradeoffs. The challenge facing theArmy is to determine precisely the core competencies it requires to sustaincombat operations and to ensure that it retains the right mix of combat andsupport troops.
fy02General Fund
35

“Im
agin
atio
n •
Inno
vatio
n •
Initi
ativ
e”
36
FY02
Uni
ted
Sta
tes
Arm
y A
nnua
l Fin
anci
al S
tate
men
t
Advancing the President's ManagementAgendaThe President's Management Agenda provides a route to greater efficiency andthe means whereby the Army can identify the actions it must take to improvemanagement performance at all levels. Just as the Army is reinventing itself asa fighting force, it is changing the way that it conducts the business ofsupporting that force.
Strategic Management of Human CapitalA key element of successful personnel management is providing people withinformation and trusting them to use it to the benefit of the organization as awhole. The Army is taking steps to empower its soldiers and civilianemployees with greater knowledge.
Army Knowledge ManagementThe Army, at its core, is people who, by doing their jobs well every day,contribute to the accomplishment of the Army mission. Putting knowledge inthe hands of its people makes the Army stronger. Army KnowledgeManagement is an innovative strategy to transform the Army into aknowledge-based force that will improve performance at every level.
Under the umbrella of Army Knowledge Management, the Army hasintroduced the new tactical Warrior Knowledge Network, which relies heavilyon communities of practice. Akin to guilds, these are voluntary associations ofpeople bound together by common professional interests. The network usesthe Internet to enable soldiers to share knowledge and learn from their peers,mentors, experts, and other resources. By leveraging emerging methods ofknowledge creation and transfer, it supports the Army's drive towardbecoming a "learning organization" that shares knowledge and informationthat is relevant to its mission.
eArmyUTrained soldiers are difficult to replace, and investment in retaining them canrepresent money well spent. One major retention incentive is education, andthe Army has taken an innovative approach to leveraging this incentivethrough the creation of eArmyU. Initially offered at three installations, theArmy expanded the program in FY 2002 to a total of five installations. Once
"Being at war is noexcuse for notimplementingbusiness reform."
Thomas E. WhiteSecretary of the Army

enrolled, soldiers can continue their studies wherever they are assigned, whichincludes today Australia, Honduras, Kosovo, Bosnia, Belgium, Japan, Egypt,Kuwait, Singapore, Germany, Korea, Macedonia, Italy, and Jordan. In FY2002, 16 percent of the soldiers in the program extended in order to meeteArmyU's eligibility requirements.
In addition to contributing to a soldier's education, eArmyU functions insupport of Army Transformation. Through its intensive use of informationtechnology, the program is aiding in the development of technology-savvysoldiers who can succeed on the digitized battlefield.
Competitive SourcingMany of the tasks performed by government employees can be contracted outto the commercial marketplace, often at savings in a range of 20 to 50 percent.The Army continues to seek savings by outsourcing non-core functions.Successful outsourcing will also contribute to the efforts to man fully combatunits while preserving the institutional Army.
Residential Communities Initiative The Army is partnering with private sector firms to manage its residentialcommunities. Family housing facilities are conveyed to a developer with along-term land lease in return for an agreement to renovate or replace existingquarters and build new units as needed. The developer also is responsible foroperating and maintaining the housing units. In return the developer collectsservice member tenants' Basic Allowance for Housing.
The Residential Communities Initiative (RCI) was authorized in 1996 and hasseen four successful pilot installations. Eight more were initiated in FY 2002,with an additional 15 planned by FY 2005. This will result in the privatizationof more than 71,000 family housing units. RCI is an innovative andfinancially prudent way for the Army to cope with a requirement of $6 billionfor the 70 percent of its inventory that is in need of renovation.
RecruitingThe Army's vision for readiness requires that all combat units be staffed fullyand that this be achieved without breaking the institutional Army. Armyrecruiters are a key part of the institutional Army and skillednoncommissioned officers traditionally have filled the recruiter position.
fy02General Fund
37

“Im
agin
atio
n •
Inno
vatio
n •
Initi
ativ
e”
38
FY02
Uni
ted
Sta
tes
Arm
y A
nnua
l Fin
anci
al S
tate
men
t
Seeking a way to release skilled soldiers from the institutional Army, theArmy has awarded contracts to two civilian firms to perform the recruitingmission. This is a test program that will run through FY 2006 at 10 locations.The contractors will replace more than 350 non-commissioned officers whocan be released for other duties.
The contractors will put a premium on hiring veterans who are smart,energetic, and who have a recruiting background. They will be trained inenlistment eligibility, enlistment incentives, and U.S. Army RecruitingCommand policies and procedures. The Army National Guard has been usingcivilian contractors to successfully augment its recruiting efforts since 1999. Ifthis test is successful, it could be expanded to return an even greater numberof non-commissioned officers to the force.
Improved Financial PerformanceIn FY 2002, Secretary White approved a number of initiatives that will enablethe Army to make better use of its funds. The Army also is pursuing otherlong-term initiatives aimed at putting more useful and more reliable financialinformation in the hands of managers, with the aim of enabling them to makemore efficient use of resources.
Better Use of Training FundsWhen soldiers leave their home station for training, the costs incurred arefunded by the sending installation—despite the fact that those costs arecontrolled by the training installation. The Army will initiate a test to examinewhether costs for lodging, food, and local transportation can be reduced if thefunding is controlled by the training installation. The Army believes this willresult in lower funding requirements, reduced accounting transactions anddelinquent accounts, and reduced out-of-pocket expenses for soldiers.
In an initiative that will require Congressional support, the Army will seek tofund reserve component new equipment training with procurement funds,rather than with reserve component operations and maintenance (O&M) andpersonnel funds. Because these latter funds are only available for one year, if aprogram is accelerated or delayed the funds may not be available for the newequipment training when it actually occurs. The Army will seek approval toallow program managers to reimburse the reserve component accounts out ofmulti-year procurement funds under their control. Authorized to use multi-year funds, program managers would have more flexibility to absorb schedulechanges without affecting adversely reserve component training.
"This is not justabout money. It’sabout responsibilityto the men andwomen in uniformwho put their lives atrisk. We owe themthe best training andbest equipment, andwe need theresources to providethat."
Donald H. RumsfeldSecretary of Defense

CFO Strategic PlanTo successfully achieve its vision, the Army must have sufficient resourceswith which to take care of its soldiers, ensure near-term readiness, andtransform itself into the force of the 21st century. The delivery of high-qualityfinancial information upon which resource decisions can be based isimperative for improved financial performance.
Delivery of this information requiresintegrating with the financial managementprocesses and systems the manystovepipe processes and systems thataffect the consumption of financialresources. The Army has developed andis executing a strategic plan thatsynchronizes efforts across the Army tointegrate processes and systems, whileimproving upon the quality ofmanagement information.
The Army is implementing modern technology in the development of flexible,streamlined procedures and processes that will provide the type of informationupon which sound decisions can be based. Within the context of this plan, thefinancial management and functional communities are working together toeliminate unnecessary systems. Financial managers and functional leaders areworking to ensure that the systems brought forward comply with all statutory,regulatory, and audit requirements. The Army's plan is designed tocomplement the DoD Financial Management Modernization Program, whichis working to identify systems, to map processes, and to determine the optimalarchitecture for the future.
By integrating effectively the financial processes and systems with the manyother functional processes and systems that impact on commanders' resources,the Army can provide commanders with relevant and reliable information onthe availability of funds. This information will enable commanders to betterassess their ability to train and maintain and will help them to articulate betterthe financial costs and benefits of different options.
fy02General Fund
39

“Im
agin
atio
n •
Inno
vatio
n •
Initi
ativ
e”
40
FY02
Uni
ted
Sta
tes
Arm
y A
nnua
l Fin
anci
al S
tate
men
t
Expanded Electronic GovernmentThe President's Management Agenda asserts that, through electronic means,government can both reduce costs and provide better service. The Army,accordingly, is pursuing a number of electronic initiatives aimed at providingbetter service to its soldiers and civilian employees.
Eagle CashEagle Cash is a Financial Stored Value Card (SVC) developed by apartnership of the Department of Treasury, the Defense Finance and
Accounting Service, the Army and AirForce Exchange Service (AAFES), andthe Army. The card is the size of astandard credit card and has an embeddedmicroprocessor chip that holdsinformation in electronic form.
Local finance officials in Bosnia, Honduras, Hungary, Kosovo, andMacedonia issue the cards to deployed soldiers and civilians in lieu of cash.This has the dual effect of reducing the amount of cash required in a theater ofoperations, thereby reducing cash handling costs, and reducing thevulnerability of soldiers to loss or theft. It also reduces AFFES's vulnerabilityto bad checks. The result has been a 58 percent reduction in cash disbursed tosoldiers and a 49 percent reduction in cash and administrative paper workturned in to overseas finance offices by AAFES and military postal offices.
The card has the added benefit of improving cash flow in AAFES businessesin a theater of operations. Prior to Eagle Cash, it took up to 15 days to processa cash deposit through a finance office for deposit at an AAFES bank account.This has been reduced to as little as two days with Eagle Cash, which enablesfinance offices to settle deposits by postal offices and AAFES through secureInternet. This technology provides a viable alternative to military paycertificates and U.S. currency in deployed environments.
Military Paper Check ConversionMost overseas finance offices process check deposits through a manual, labor-intensive process, with returned checks taking up to three months to debit thefinance officer's account. Through Military Paper Check Conversion, affectedvia secure Internet, the Army converts paper checks into an electronic debit of
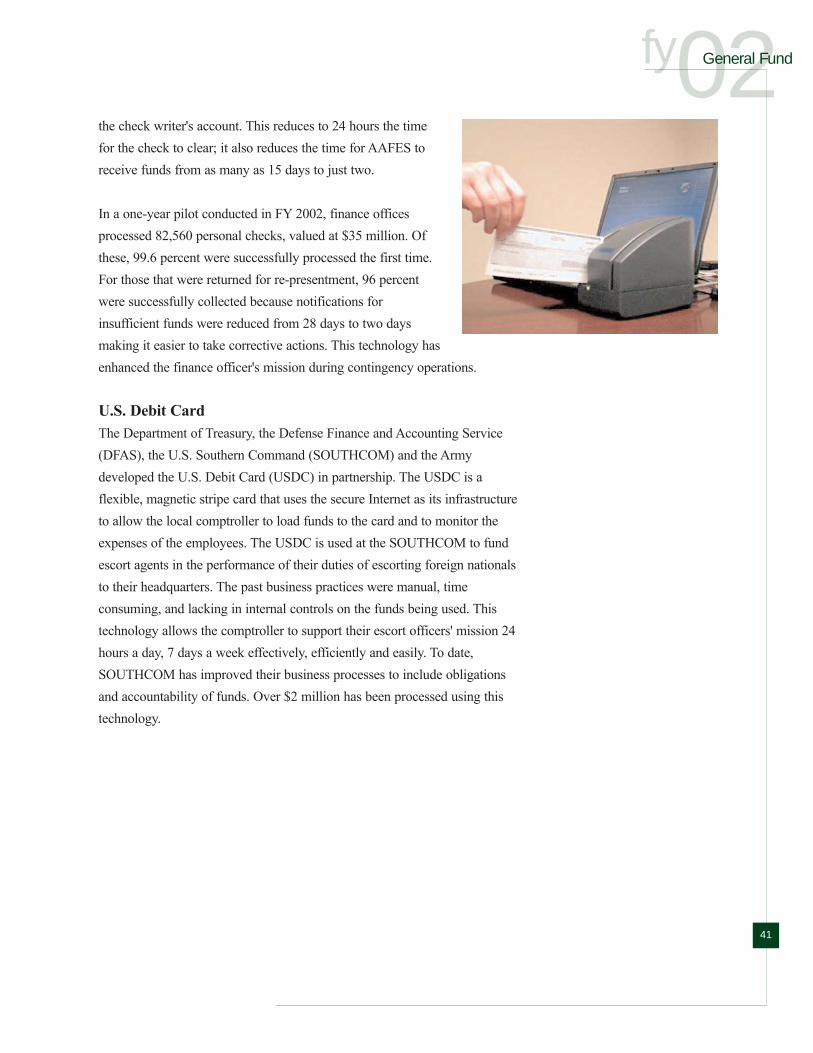
the check writer's account. This reduces to 24 hours the timefor the check to clear; it also reduces the time for AAFES toreceive funds from as many as 15 days to just two.
In a one-year pilot conducted in FY 2002, finance officesprocessed 82,560 personal checks, valued at $35 million. Ofthese, 99.6 percent were successfully processed the first time.For those that were returned for re-presentment, 96 percentwere successfully collected because notifications forinsufficient funds were reduced from 28 days to two daysmaking it easier to take corrective actions. This technology hasenhanced the finance officer's mission during contingency operations.
U.S. Debit CardThe Department of Treasury, the Defense Finance and Accounting Service(DFAS), the U.S. Southern Command (SOUTHCOM) and the Armydeveloped the U.S. Debit Card (USDC) in partnership. The USDC is aflexible, magnetic stripe card that uses the secure Internet as its infrastructureto allow the local comptroller to load funds to the card and to monitor theexpenses of the employees. The USDC is used at the SOUTHCOM to fundescort agents in the performance of their duties of escorting foreign nationalsto their headquarters. The past business practices were manual, timeconsuming, and lacking in internal controls on the funds being used. Thistechnology allows the comptroller to support their escort officers' mission 24hours a day, 7 days a week effectively, efficiently and easily. To date,SOUTHCOM has improved their business processes to include obligationsand accountability of funds. Over $2 million has been processed using thistechnology.
fy02General Fund
41

Profile of Working Capital Fund 43Overview 43
The Activity Groups 46
Working Capital Fund - Performance Measures 51
Corporate Performance 51Performance Measures 51
Supply Management, Army 54Program Scope 54
Performance Measures 55
Depot Maintenance 60Program Scope 60
Performance Measures 61
Ordnance 67Program Scope 67
Performance Measures 68
Information Services 74Program Scope 74
Performance Measures 75
Management Integrity 78Continuing Challenges 78
Future Effects of Existing Conditions 78Logistics Transformation 78
Facilities Recapitalization 79
Advancing the President's Management Agenda 80Strategic Management of Human Capital 80
Improved Financial Performance 81
“Im
agin
atio
n •
Inno
vatio
n •
Initi
ativ
e”
FY02
Uni
ted
Sta
tes
Arm
y A
nnua
l Fin
anci
al S
tate
men
t

43
Profile of Working Capital Fund—OverviewThe Army Working Capital Fund (AWCF) is part of the Defense WorkingCapital Fund, established by the Secretary of Defense under the authority ofTitle 10, U.S Code, Section 2208. Section 2208 allows for the establishmentof working capital funds to finance inventories and provide working capitalfor industrial-type activities that provide common services within or amongthe departments and agencies of the Department of Defense (DoD).
The AWCF is divided into four activity groups: Supply Management, Army;Depot Maintenance; Ordnance; and Information Services (see Figure 3). TheArmy Materiel Command (AMC) exercises command and control over theactivity groups through one or more of its six major subordinate commands.AMC in turn reports activities to the Deputy Chief of Staff, G-4 and to theAssistant Secretary of the Army (Financial Management and Comptroller)(ASA(FM&C)). A DoD corporate board additionally maintains oversight ofAWCF functions.
fy02
Working Capital Fund

“Im
agin
atio
n •
Inno
vatio
n •
Initi
ativ
e”
44
FY02
Uni
ted
Sta
tes
Arm
y A
nnua
l Fin
anci
al S
tate
men
t
Figure 3. AWCF Organizational ChartMissionThe overarching goal of theAWCF is to promote Armyreadiness by assuring theagility and sustainability ofArmy support systems. Inessence, the relationshipbetween the operating forcesand the supportorganizations is that ofcustomer and provider. As aprovider, the AWCF activityabove all must serve theneeds of its most importantcustomers, the operatingforces; it must do so,
however, while observing also an obligation to control or reduce costs. AWCFmanagers, accordingly, are charged with satisfying their customerrequirements within cost goals established in their budgets. In part, and whereappropriate, managers are seeking to do this through the application andadaptation to Army support functions of private sector best practices.
The public and private sector are not perfectly analogous,however. It is not acceptable that critical Army operations besusceptible to short-term price fluctuations, for example. TheAWCF activities therefore provide mission-critical support atrates that remain stable during the year of execution, regardlessof price changes. This protects the operating forces from havingto reduce their readiness programs should prices rise aboveanticipated levels. The AWCF activities also maintain a surgecapability to provide extraordinary supply or other support
should mobilization conditions require. Finally, and regardless of whether it isperformed internally or contracted out, all AWCF work is undertaken tostandard specifications, without compromise.
How the AWCF WorksThe AWCF uses a revolving fund structure, named for the cyclical nature ofthe cash flow in and out of the fund. Activities price their goods and services
AWCF ReadinessEnhancers
Stable Rates
Surge Capability
Quality Maintained
DoD Corporate Board
ASA (FM&C)G-4
Army Materiel Command
Ordnance
SupplyManagement
Army
DepotMaintenance
InformationServices
CECOM
TACOM-W
SBCCOM
AMCOMTACOM-RII

such that the sale of those goods and services recovers the total cost incurredin providing them; the income from sales, in turn, is used to buy or replaceinventory and to finance the delivery of future goods and services.
The AWCF operates through a four-step process (see Figure 4). First,Congress reviews the budget submissions of the AWCF customers, approves abudget for those customers, and appropriates to them the approved funds. Thecustomer next sends to an AWCF activity a funded order—essentially a fixed-price contract based on the work required and the AWCF rate for the goodsand services. Third, the AWCF activity performs the work necessary toproduce the goods and services required, incurring costs as it does so. Finally,the activity invoices the customer per the funded order, thus recovering itscosts and completing the funding cycle.
Figure 4. How the AWCF Operates
The revolving fund concept enables AWCF managers to be flexible whenacquiring the resources that they need, but it also gives AWCF customers thefreedom to evaluate prices and performance when deciding on the level ofservice that they will acquire. Taken together, these two factors serve as anincentive to AWCF managers to provide the highest quality services at thelowest possible price.
AWCF Activity:• Incurs Costs• Produces Goods or Services• Buys Parts or Services
Bill
Congress approves the annual budget for the customers
AWCF Activity supplies goodsand services. The provider billsthe customer and is paid.
Customer sends funded order to AWCF activity.
$
ProjectOrder
fy02Working Capital Fund
45
The revolving fundconcept enables
AWCF managers tobe flexible when
acquiring theresources that they
need, but it alsogives AWCF
customers thefreedom to evaluate
prices andperformance.

“Im
agin
atio
n •
Inno
vatio
n •
Initi
ativ
e”
46
FY02
Uni
ted
Sta
tes
Arm
y A
nnua
l Fin
anci
al S
tate
men
t
The Activity GroupsSupply Management, ArmyThe Supply Management, Army (SMA) activity group buys and maintainsassigned stocks of materiel for sale to its customers, primarily Army operatingunits. The constant availability of this materiel is essential to equipment andoperational readiness and to the warfighting readiness and abilities of Armyunits. In FY 2001, SMA underwent a major change with the implementationof the Single Stock Fund (SSF) initiative, which integrated the wholesale andcommand retail divisions. Under SSF the wholesale division remainssubdivided by commodity, and is managed by major subordinate commandsunder AMC. The command retail divisions no longer exist. Table 16 providesthe breakdown of the wholesale subdivisions.
Table 16. Supply Management, Army Activities
SMA recoups all costs related to the supply of goods and services through astabilized price system within which the price includes a surcharge to coversuch costs as inventory loss, transportation, obsolescence, and the cost ofinventory management supply operations. The latter includes the cost ofcivilian labor and military personnel at supply activities, a portion ofheadquarters costs related to inventory management, costs incurred throughthe receipt and issue of Army-managed material at distribution points, and thedepreciation of capital assets.
Wholesale Subdivisions
U.S. Army Aviation and Missile Command, Huntsville, AL
U.S. Army Communications-Electronics Command, Fort Monmouth, NJ
U.S. Army Tank-automotive and Armaments Command, Warren, MI
U.S. Army Tank-automotive and Armaments Command Acquisition and Logistics Activity, Rock Island, IL
U.S. Army Soldier and Biological Chemical Command, Natick, MA
Materiel Managed
Aircraft and aviation ground support items; missile system items
Communication and electronics items
Combat, automotive, and construction items
Weapons, special weapons, and fire control systems
Ground support items and chemical weapons
AMCOM
CECOM
TACOM-W
TACOM-RI
SBCCOM
Major SubordinateCommand

Depot MaintenanceThe Depot Maintenance activity group provides the Army with an organicindustrial capability to repair, overhaul, and upgrade weapons systems enditems and depot-level reparables. It also provides tenant support to Army andother DoD activities. Depot maintenance activities both compete and partnerwith private industry as the AWCF seeks to deliver goods and services asefficiently and effectively as possible. There are five major depots in thisactivity group: Anniston, Corpus Christi, Letterkenny, Red River, andTobyhanna. The depots are managed by major subordinate commands underAMC (see Table 17).
Table 17. Army Depots
OrdnanceThe Ordnance activity group provides the Army with an organic industrialcapability to produce high-quality munitions and large-caliber weapons. It alsoprovides the full range of ammunition maintenance for all services within theDoD and for foreign military customers. It manufactures, renovates, stores,and demilitarizes ordnance materiel and manufactures 155-millimeterhowitzers, 120-millimeter gun tubes, 120-millimeter mortars, gun mounts forthe M1A1 Abrams tank, grenades and smoke rounds, rebuilt protective masks,and tool sets and kits.
Location
Anniston Army Depot, Anniston, AL
Corpus Christi Army Depot, Corpus Christi, TX
Letterkenny Army Depot, Chambersburg, PA
Red River Army Depot, Texarkana, TX
Tobyhanna Army Depot, Tobyhanna, PA
Activity Performed
Maintenance, overhaul, and repair of heavy tracked combat vehicles and artillery; provision of base support to tenants
Maintenance, repair, overhaul, and upgrade of rotary wing aircraft, engines, and components
Maintenance, repair, and overhaul of tactical missile systems; provision of base support to tenants
Maintenance and repair of light armored vehicles and select missile systems; provision of base support to tenants
Manufacture, maintenance, testing, and fielding of communications-electronics systems and equipment and missile guidance and control systems and equipment; provision of base support to tenants
TACOM
AMCOM
AMCOM
TACOM
CECOM
Major SubordinateCommand
fy02Working Capital Fund
47

“Im
agin
atio
n •
Inno
vatio
n •
Initi
ativ
e”
48
FY02
Uni
ted
Sta
tes
Arm
y A
nnua
l Fin
anci
al S
tate
men
t
Ordnance activities provide logistics support including management, follow-on procurement, production, maintenance, and engineering. They also providestorage, maintenance, and demilitarization of conventional ammunition.
The activity group consists of three arsenals, two ammunition plants, threeammunition storage depots, and three munitions centers. The SoldierBiological and Chemical Command, located at Aberdeen Proving Ground,MD, manages Pine Bluff Arsenal. The Operations Support Command (OSC)located at Rock Island, IL, manages the remaining arsenals, ammunitionplants, and ammunition logistics activities. The arsenals and plants providedepot operations, set assembly, tenant support and national procurementservices for thin- and thick-walled cannon. They additionally are responsiblefor ammunition logistics management including follow-on procurement,production, maintenance, engineering, and integrated logistics supportmanagement.
Table 18. Army Ordnance Activities
Location
Pine Bluff, AR
Rock Island, IL
Watervliet, NY
Mission
– Primary manufacturing capabilities include the production of conventional ammunition and chemical and biological defense items including white phosphorous and red phosphorous munitions, signaling and obscuring smokes, incendiaries, irritants, and the production and rebuild of decontaminating kits, large filters, masks and defensive chemical test equipment
– Provides base support to tenants
– Primary materiel and industrial capabilities include the production of aircraft weapons, infantry weapons, air defense weapons and artillery; armament for tanks, artillery, personnel and cargo-carriers; and special tools and tool sets
– Major in-house programs include: maintenance truck, heavy; spare parts for M119 and M198 towed howitzers; explosive ordnance disposal vehicles; and 120mm gun mount for Abrams main battle tank
– Provides base support to approximately 40 tenants
– Primary materiel and industrial responsibilities include production of mortars, recoilless rifles, cannon for tanks and towed and self-propelled artillery, special tool sets, and training devices and simulators
– Major in-house programs include: the M256 gun tube, M284/M109A6 howitzer, and XM297 howitzer
– Provides base support to tenants
Activity
Pine Bluff Arsenal
Rock Island Arsenal
Watervliet Arsenal

Information ServicesThe Information Services activity group is responsible for the development andsustainment of automated information and communications systems. Itprovides a multitude of services in support of the Department of Defense andforeign military sales customers including requirements analysis and definition,system design, development testing, integration, implementation support, anddocumentation of services. The group, which comprises two Central DesignActivities (CDAs), the Integrated Logistics Systems Office, and the ArmySmall Computer Program is managed by the U.S. Army Communications andElectronics Command (CECOM) at Fort Monmouth, NJ.
Location
Crane, IN
McAlester, OK
Herlong, CA
Tooele, UT
Richmond, KY
Texarkana, TX
Chambersburg, PA
Anniston, AL
Mission
– Primary materiel and industrial responsibilities include manufacturing, load and assembly, supply depot operations, and renovation, maintenance, and demilitarization of conventional ammunition and ammunition-related components
– Primary materiel and industrial responsibilities include ammunition manufacturing and the rapid outload, maintenance, and demilitarization of conventional ammunition and missiles. The premier bomb loading facility for DoD
– Provides base support to tenants
– Primary materiel and industrial responsibilities include the receipt, storage, care of supplies in storage (COSIS), repair, assembly, disassembly, and shipment of major and secondary items for operational project stocks
– Provides base support to tenants
– Responsible for design and development of ammunition peculiar equipment; stores, maintains, distributes, and demilitarizes conventional ammunition
– Provides base support to tenants
– Primary materiel and industrial responsibilities include the receipt, issue, storage, testing, and minor repair of chemical defense equipment. Stores, maintains, distributes, and demilitarizes conventional ammunition
– Provides base support to tenants
– Stores, maintains, distributes, and demilitarizes conventional ammunition
– Stores, maintains, distributes, and demilitarizes conventional ammunition
– Stores, maintains, distributes, and demilitarizes conventional ammunition
Activity
Crane Army Ammunition Activity
McAlester Army Ammunition Activity
Sierra Army Depot
Tooele Army Depot
Blue Grass Army Depot
Red River Munitions Center Letterkenny Munitions Center Anniston Munitions Center
fy02Working Capital Fund
49

“Im
agin
atio
n •
Inno
vatio
n •
Initi
ativ
e”
50
FY02
Uni
ted
Sta
tes
Arm
y A
nnua
l Fin
anci
al S
tate
men
t
The two CDAs, Software Development Centers (SDCs) Lee and Washington,provide support for eight personnel and retail logistics systems. Significantamong these are the Inspector General Network, the Housing OperationsManagement System, and the Financial Management Information System.
The Integrated Logistics Systems Offices (ILSO), located in Chambersburg,PA, and St. Louis, MO, provide subject matter expertise and governmentoversight of the Logistics Modernization Program (LMP). Implementation ofthe LMP has seen the outsourcing of the activity group's software maintenanceand sustainment mission to the Computer Science Corporation, which nowperforms all the mission-related work of ILSO.
The Army Small Computer Program (ASCP) provides customers with fullycompeted commercial sources of small and medium-sized computers,software, networking infrastructure, and support services.
Effective FY 2002 the Information Services activity group eliminated the useof stabilized rates. All customers now pay for services on a reimbursable basisas the Army prepares to decapitalize this activity group at the end of FY 2003.Charging its customers at the actual costs for FY 2002 and 2003 will ensurethat it will not incur losses before it is decapitalized.

Working Capital Fund — PerformanceMeasures
Corporate PerformanceThe mission of the AWCF is to provide support services to the operatingforces in the most efficient and cost-effective manner possible. Assessing theperformance of the AWCF through the use of financial and programperformance measures indicates how well the AWCF is accomplishing itsmission.
Performance MeasuresCash ManagementThe ability to generate cash is dependent on setting rates to recover full costs,including any prior year losses; on accurately projecting workload; and onmeeting established operational goals. The Army must maintain sufficient cashon hand in the AWCF account at the U.S. Treasury to pay liabilities when due.Unlike the private sector, the Army does not have the ability to take advantageof lines of credit. To minimize the cash balance required for operating andcapital disbursements, the Army manages cash at the corporate level. Ratherthan having to maintain a positive cash balance, the AWCF activity groupsand installations project collections and disbursements on a monthly basis,working within a 10 percent margin of error.
Projecting cash flows has proven challenging in prior years. While the Armyhas the capability to estimate collections and disbursements, current revenuerecognition and expensing policies sometimes prevent us from establishing adirect correlation between monthly revenue and collections or betweenmonthly expenses and disbursements, making the development of forecastingmodels difficult.
The Army's ability to predict the effects of transactions made by others on thecash balance also has been difficult, with undistributed collections anddisbursements fluctuating dramatically throughout the year. The DefenseFinance and Accounting Service (DFAS), the Army's accounting servicesprovider, currently is implementing systems improvements that we expect willenable the Army to make more accurate projections in the future.
To ensure solvency during periods of diminished cash flow, the Army canexercise the options of conducting advance billing, curtailing new obligations,imposing cash surcharges on new orders, or increasing its collection efforts for
fy02Working Capital Fund
51
The mission of theAWCF is to providesupport services to
the operating forcesin the most efficient
and cost-effectivemanner possible.

“Im
agin
atio
n •
Inno
vatio
n •
Initi
ativ
e”
52
FY02
Uni
ted
Sta
tes
Arm
y A
nnua
l Fin
anci
al S
tate
men
t
prior-year accounts receivable. In FY 2002, to remain solvent,the Army was required to advance bill $200 million in theDepot Maintenance and Ordnance activity groups. At the endof the year it still had $200 million in advanced billings. It alsoincreased the collection of valid prior-year bills.
In the last two years the Army has struggled to maintain theminimum cash balance required to meet operationalrequirements. At the end of FY 2002, the Army had a $30million shortfall in its cash corpus, due in part to the reducedrates set by the Supply Management, Army activity in order toreturn excess cash held in the AWCF at the end of FY 2000. A$92 million settlement for Asbestos Environment DifferentialPay at Corpus Christi Army Depot also contributed to the cashshortfall.
Figure 5 shows the planned and actual collections,disbursements, and outlays at Army corporate level for the lastthree fiscal years, and the consequent cash balance. The AWCFended FY 2002 with a cash balance of $251 million, $83.5million below plan, but within a 25 percent variance ofprojected balance. This represents a substantive improvementover the previous year, in which the Army missed year-endprojections by more than $339 million.
Total RevenueTotal Revenue is an indicator of the volume of work completedby the AWCF activity groups. The total projected revenue forFY 2002 was $7.6 billion. Actual revenue was $8.3 billion, 9.5percent greater than projected. This was due primarily tooperations in support of the war on terrorism.
Table 19 displays total revenue by customer. The largestcustomer for the AWCF is Operations and Maintenance, Army(OMA), which accounted for revenues of $5.4 billion.
Table 20 displays total revenue by activity group. SupplyManagement, Army (SMA) is the largest, accounting for more
than $5.8 billion in revenue, or 70 percent of all AWCF revenue. In addition tothe revenue shown in Table 19 and Table 20, the AWCF received $18.1million in FY 2001 and $167.4 million in FY 2002 in direct appropriations.
FY 2000 FY 2001 FY 2002
Variance ($92.30) ($730.1) $62.1
Variance (%) (1.6) (10.9) 1.0
PlanActual
Collections ($ millions)
0
5000
10000
FY 2000 FY 2001 FY 2002
Variance $8.50 ($377.9) $313.0
Variance (%) 0.10 (5.6) 5.0
PlanActual
Disbursements ($ millions)
0
5000
10000
FY 2000 FY 2001 FY 2002
Variance $16.30 $278.9 $83.4
Variance (%) 7.54 411.9 947.7
PlanActual
Outlays ($ millions)
-250
-50
150
350
FY 2000 FY 2001 FY 2002
Variance ($16.20) ($339.4) ($83.5)
Variance (%) (2.16) (51.0) (24.9)
PlanActual
Cash Balance ($ millions)
0
400
800
$8,719.3
$6,680.8 $6,212.4
8,627.0
5,950.7 6,274.5
$8,503.0 8,511.5
$6,748.5 6,370.6 $6,203.5 6,516.5
($216.3) (200.0)$67.7
346.6
($8.8)74.6
$749.1 732.9$665.1
325.7 $334.5251.0
Figure 5. Cash Management ($ millions)

Table 19. Total Revenues by Customer ($ millions)
Table 20. Total Revenue by Activity Group ($ millions)
Personnel ResourcesTo achieve maximum efficiency of performance, the AWCFactivity groups need to achieve the optimum configuration ofskilled workforce appropriate to the workload. Skill mismatchessometimes occur as a result of deviations between planned andactual workload; they also can be caused by workforce reductionsrealized through voluntary separation and hiring freezes. Suchmismatches can lead to unplanned operating losses.
As Figure 6 shows, there was a 0.4 percent increase over the lastthree fiscal years in the number of civilian full-time equivalentsemployed by the AWCF activity groups. In FY 2002, the AWCFdid not meet its planned reduction in civilian full-time equivalentsby 2.0 percent.
Appropriation FY 2000 FY 2001 FY 2002
Supply Management, Army $10,003.8 $6,068.4 $5,837.4
Depot Maintenance 1,291.8 1,434.1 1,668.4
Ordnance 658.1 667.8 669.8
Information Services 134.9 97.8 104.8
Total Revenue $12,088.6 $8,268.1 $8,280.4
Customer FY 2000 FY 2001 FY 2002
Operations and Maintenance, Army $5,488.7 $5,384.5 $5,417.4
Army Procurement 400.1 469.5 609.3
AWCF 3,030.6 1,444.0 1,044.0
Other Army 1491.1 117.7 178.7
Other Services 398.4 376.9 460.2
Other DoD 919.1 150.8 135.7
Foreign Military Sales 316.5 172.6 201.9
Non-DoD 44.1 152.1 233.2
Total Revenue $12,088.6 $8,268.1 $8,280.1
fy02Working Capital Fund
53
FY 2000 FY 2001 FY 2002
Variance (518) (503) 381
Variance (%) (2.6) (2.6) 2.0
PlanActual
Civilian Full-Time Equivalents
0
12500
25000
FY 2000 FY 2001 FY 2002
Variance (11) (2) (1)
Variance (%) (14.3) (2.6) (1.4)
PlanActual
Military End Strength
0
50
100
20,172 19,614 19,35519,654 19,111 19,736
77 76 7266
74 71
Figure 6. Personnel Indicators

“Im
agin
atio
n •
Inno
vatio
n •
Initi
ativ
e”
54
FY02
Uni
ted
Sta
tes
Arm
y A
nnua
l Fin
anci
al S
tate
men
t
Supply Management, ArmyProgram ScopeCustomer Revenue (Program Size)SMA revenue from customer sales in FY 2002 was $5.8 billion. Thisexceeded plan, with the excess revenue a direct result of unforeseen operationsconducted in support of the war on terrorism. As shown in Table 21, totalSMA revenues decreased significantly between FY 2000 and FY 2002; this isdue to elimination of the retail stock fund, a second point of sale. In additionto the revenue shown in the table, SMA received $7.8 million in FY 2001 and$163.6 million in FY 2002 in direct appropriations.
Table 21. Total Revenue by Customer ($ millions)
PersonnelA key objective of the SMA activity group is ensuring that theappropriate number of skilled workers are employed in the rightplaces to fulfill the group's workload obligations. Over the lastthree fiscal years, actual civilian full-time equivalents haveincreased by 1 percent.
The Army achieved reductions in military personnel through acombination of Voluntary Separation Incentive Programs andattrition. Over the last three fiscal years personnel levels trendeddownward consistent with the requirements of the QuadrennialDefense Review. The AMC Integrated Materiel ManagementCenters continue to develop more efficient and more effectiveways of doing business.
Appropriation FY 2000 FY 2001 FY 2002
Operations and Maintenance, Army $4,742.4 $4,513.2 $4,473.6
Army Procurement 103.1 170.5 208.4
AWCF 2,468.8 705.5 405.2
Other Army 1,422.1 76.9 121.7
Other Services 308.5 281.8 366.5
Other DoD 667.2 90.1 58.6
Foreign Military Sales 271.9 115.8 114.0
Non-DoD 19.8 114.6 89.4
Total Revenue $10,003.8 $6,068.4 $5,837.4
FY 2000 FY 2001 FY 2002
Variance (122) 24 (96)
Variance (%) (4.0) 0.8 (3.1)
PlanActual
Civilian Full-Time Equivalents
0
2000
4000
FY 2000 FY 2001 FY 2002
Variance 0 0 0
Variance (%) 0.0 0.0 0.0
PlanActual
Military End Strength
0
10
20
3,082 2,991 3,0952,960 3,015 2,999
14 14 1314 1413
Figure 7. Personnel Indicators

fy02Performance MeasuresFinancial PerformanceThe financial performance of the SMA activity group is evaluated on a varietyof fiscal measures. The primary measure, unit cost, is defined as cost perdollar of sales. Other measures include total gross sales; revenue; cost; netoperating results; capital investment; cash collections, disbursements, andoutlays; stock availability and stock turn.
Wholesale Unit Costs. The wholesale division sells principally to federalgovernment customers and, through the Foreign Military Sales Program, toforeign governments. Wholesale costs include the costs of logistics operationsand of materiel obligations for repair or procurement, and credit issued tocustomers for materiel returns. Unit cost is measured by dividing these costsby gross wholesale sales.
In FY 2002, the wholesale division achieved a unit cost of $1.07. The unit costgoal (UCG) was $1.076. The division's under-execution in pursuit of the UCGwas due to the unpredictability of credit, which offsets available obligationauthority.
Table 22. Actual Cost per Dollar of Sales
NAMI/Retail Unit Costs. Implementation of the Single Stock Fund (SSF)has altered the mission of the retail division. Prior to the SSF, the retaildivisions sold to authorized customers within their local geographical area.The retail divisions bought and sold both Army managed items (AMI) andnon-Army managed items (NAMI) at the catalog price of the source of supply.Under the SSF, the retail division consists only of NAMI.
In FY 2002, gross materiel costs were lower than planned, producing a unitcost of $0.699 that was below the UCG of $0.847. Gross materiel costs werelower than planned due to a five-month delay in implementation of SSFMilestone 3 (MS3).
FY 2000 FY 2001 FY 2002
Wholesale ($) $1.020 $1.195 $1.07
NAMI/Retail ($) $0.982 $0.496 $0.699
Working Capital Fund
55

“Im
agin
atio
n •
Inno
vatio
n •
Initi
ativ
e”
56
FY02
Uni
ted
Sta
tes
Arm
y A
nnua
l Fin
anci
al S
tate
men
t
Gross Sales. Attaining projected sales levels is key to achieving goals ininventory management and operations management, as well as to recoupingoperations costs.
Sales for the wholesale division were below plan for FY 2001and above plan for FY 2002.
NAMI/Retail sales were lower than expected in FY 2001 as aresult of the uncertainty related to transition to the SSF. NAMIsales in FY 2002 were above plan because of sales associatedwith operations in Afghanistan and the war on terrorism.
Financial Operating Measures. Budgetary guidelines requirethe activity group to recover its operating costs and fees whileachieving zero accumulated operating results at the end of thebudget period. To achieve this goal, AWCF activities setstabilized rates eight or more months prior to the beginning ofeach fiscal year. These rates use forecasting methods todetermine the potential workload and the cost of meetingworkload requirements. This projection then is used to set astandard price for AWCF goods and services. Since revenue isdefined as gross sales at standard price, revenue, cost, and net
operating results are the logical financial measures of AWCF operations. InFY 2002, the rates were set to achieve a net operating result (NOR) of($242.4) million. The actual NOR was a loss of $354.6 million. Results ofoperations, computed according to budget guidance, are presented in the Table23.
Results of operations, when computed according to financial accountingstandards, can vary with inventory valuations, the timing of cost recognition,transfer fees, and the inclusion of non-recoverables such as planned inventoryreductions.
FY 2000 FY 2001 FY 2002
Variance $52 ($75) $8
Variance (%) 1.2 (1.6) 0.1
PlanActual
Wholesale Sales ($ millions)
0
3000
6000
FY 2000 FY 2001 FY 2002
Variance ($58) ($314) ($10)
Variance (%) (1.0) (17.0) (7.5)
PlanActual
NAMI/Retail Sales ($ millions)
0
3000
6000
$4,142$4,607
$5,105
4,1944,532
5,113
$5,868
$1,848
$134
5,810
1,534
124
Figure 8. Gross Sales

Table 23. Results of Operations ($ millions)
Capital Investment. The SMA activity group's capital investment program isfocused primarily on the development of computer software to assistmanagerial decision-making, to enable the sharing of databases, and to supportthe development of more efficient business practices.
Table 24. Capital Budget Obligations ($ millions)
FY 2002 Capital Investment Program (CIP) projects include the purchase ofthe following:
Logistics Modernization Program (LMP) ($21.7 million). The goal of LMPis to reengineer current wholesale logistics business processes to provideintegrated, seamless, real-time asset visibility of the entire logistics supplychain. The service being contracted will employ Enterprise ResourcePlanning (ERP) to integrate business processes across the supply chain, and
Category FY 2000 FY 2001 FY 2002
Equipment $0.0 $0.0 $0.0
ADPE and Telecom 0.0 0.0 0.0
Software 65.7 62.3 61.2
Total $65.7 $62.3 $61.2
FY 2000 Plan Actual Variance (%)
Revenue $9,595.4 $10,003.8 4.3
Cost of Goods Sold 9,598.7 10,005.2 4.2
Net Operating Results (3.3) (1.4) 57.6
Accumulated Operating Results 27.7 (0.9) (103.2)
FY 2001 Plan Actual Variance (%)
Revenue $7,173.2 $6,068.4 (15.4)
Cost of Goods Sold 7,252.1 6,188.2 (14.6)
Net Operating Results (78.9) (119.8) (55.1)
Accumulated Operating Results $131.9 $90.1 (31.6)
FY 2002 Plan Actual Variance (%)
Revenue $5,239.2 $5,837.4 (9.0)
Cost of Goods Sold 5,645.2 6,192.0 (9.7)
Net Operating Results (242.4) (354.6) 73.6
Accumulated Operating Results ($38.3) $197.8 616.4
fy02Working Capital Fund
57
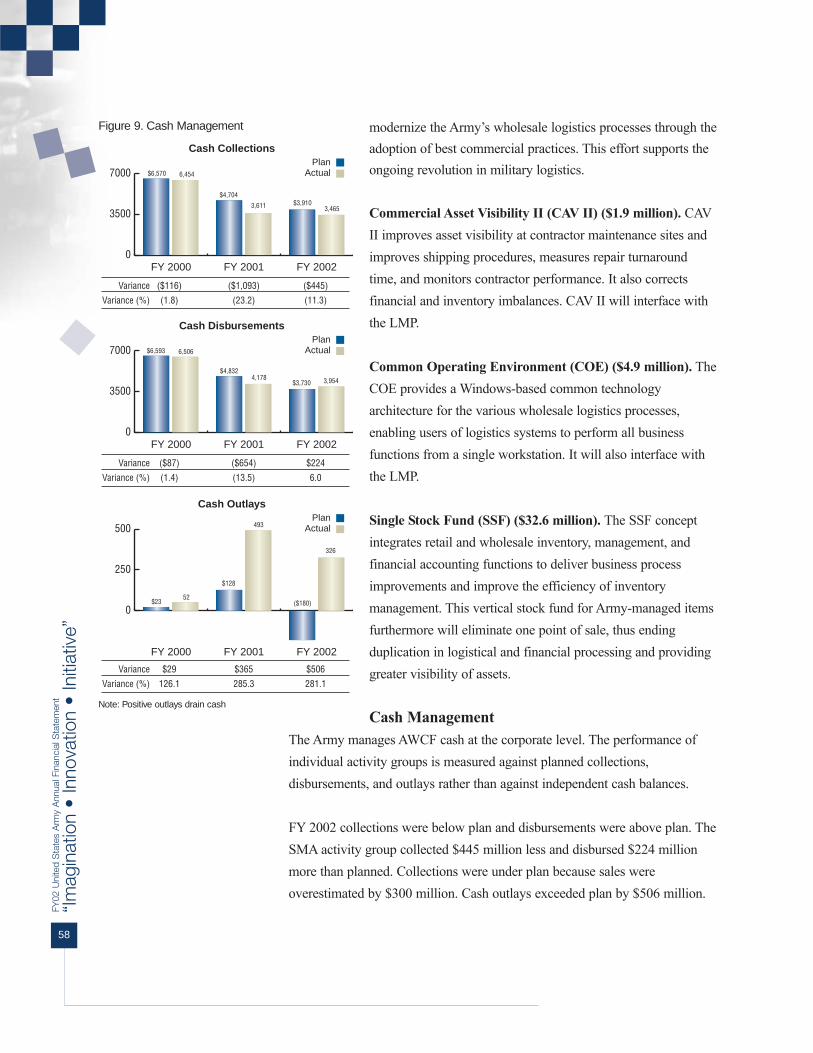
“Im
agin
atio
n •
Inno
vatio
n •
Initi
ativ
e”
58
FY02
Uni
ted
Sta
tes
Arm
y A
nnua
l Fin
anci
al S
tate
men
t
modernize the Army’s wholesale logistics processes through theadoption of best commercial practices. This effort supports theongoing revolution in military logistics.
Commercial Asset Visibility II (CAV II) ($1.9 million). CAVII improves asset visibility at contractor maintenance sites andimproves shipping procedures, measures repair turnaroundtime, and monitors contractor performance. It also correctsfinancial and inventory imbalances. CAV II will interface withthe LMP.
Common Operating Environment (COE) ($4.9 million). TheCOE provides a Windows-based common technologyarchitecture for the various wholesale logistics processes,enabling users of logistics systems to perform all businessfunctions from a single workstation. It will also interface withthe LMP.
Single Stock Fund (SSF) ($32.6 million). The SSF conceptintegrates retail and wholesale inventory, management, andfinancial accounting functions to deliver business processimprovements and improve the efficiency of inventorymanagement. This vertical stock fund for Army-managed itemsfurthermore will eliminate one point of sale, thus endingduplication in logistical and financial processing and providinggreater visibility of assets.
Cash ManagementThe Army manages AWCF cash at the corporate level. The performance ofindividual activity groups is measured against planned collections,disbursements, and outlays rather than against independent cash balances.
FY 2002 collections were below plan and disbursements were above plan. TheSMA activity group collected $445 million less and disbursed $224 millionmore than planned. Collections were under plan because sales wereoverestimated by $300 million. Cash outlays exceeded plan by $506 million.
FY 2000 FY 2001 FY 2002
Variance ($116) ($1,093) ($445)
Variance (%) (1.8) (23.2) (11.3)
PlanActual
Cash Collections
0
3500
7000
FY 2000 FY 2001 FY 2002
Variance ($87) ($654) $224
Variance (%) (1.4) (13.5) 6.0
PlanActual
Cash Disbursements
0
3500
7000
FY 2000 FY 2001 FY 2002
Variance $29 $365 $506
Variance (%) 126.1 285.3 281.1
PlanActual
Cash Outlays
0
250
500
$6,570
$4,704$3,910
6,454
3,611 3,465
$6,593
$4,832
$3,730
6,506
4,178 3,954
$23
$128
($180)52
493
326
Figure 9. Cash Management
Note: Positive outlays drain cash

Program PerformanceThe SMA activity group measures program performance using stockavailability.
Stock Availability (Fill Rate). Stock availability measures the percentage ofSMA requisitions for stocked items completely filled within Uniform MaterielMovement and Issue Priority System (UMMIPS) timeframes. DoD and theArmy have set a target of 85 percent stock availability. Increased demands andunderstated procurement lead times in FY 2000 contributed to a decrease instock availability that SMA has been working to correct. A Spares PartsShortage Integrated Process Team has been established to conduct a thoroughanalysis of the health of the Army Materiel Command's spare parts program,to identify deficiencies within the requirements determination and executionprocess, and to recommend corrective measures. The SMA met or exceededits stock availability goal for each quarter during FY 2002.
Table 25. Stock Availability (percentage)
1st Quarter 2nd Quarter 3rd Quarter 4th Quarter
FY 2000 84.4 82.9 83.2 83.9
FY 2001 83.0 85.9 87.1 86.5
FY 2002 85.0 86.3 87.0 86.0
fy02Working Capital Fund
59

“Im
agin
atio
n •
Inno
vatio
n •
Initi
ativ
e”
60
FY02
Uni
ted
Sta
tes
Arm
y A
nnua
l Fin
anci
al S
tate
men
t
Depot MaintenanceProgram ScopeCustomer Revenue (Program Size)Customer requirements govern the size and type of the Depot Maintenanceworkload. The revenue from customer sales in FY 2002 was $1.7 billion.Table 26 displays customer revenue for the past three fiscal years.
Table 26. Total Revenue by Customer ($ millions)
Total revenue increased by $232.0 million, or 13.9 percent,between FY 2001 and FY 2002. This was despite a rateincrease of only 7.4 percent. In addition to the revenue shownin Table 26, Depot Maintenance received $6.2 million in FY2001 and $2.3 million in FY 2002 in direct appropriations.
PersonnelA key objective of the Army is to have the correct number ofappropriately skilled people in the right places to meet thedemands of the workload.
Following several years of decline, workload increased in FY2002 significantly above planned levels. Depots received$183.5 million more in orders than was forecasted; roughly 12percent more work than planned. The depots expanded theirworkforce, employed contract support, and used high levels ofovertime in an effort to meet the increased customer demand.As a consequence, the depots over-executed civilian full-timeequivalent staffing by 474, or 4.5 percent.
Appropriation FY 2000 FY 2001 FY 2002
Operations and Maintenance, Army $427.5 $538.2 $627.0
Army Procurement 115.5 145.6 253.3
AWCF 447.2 618.1 506.9
Other Army 37.1 11.0 30.1
Other Services 65.1 63.1 79.6
Other DoD 163.0 10.3 7.2
Foreign Military Sales 27.7 41.6 67.0
Non-DoD 8.7 6.2 113.0
Total Revenue $1,291.8 $1,434.1 $1,666.1
0
6000
12000
0
25
50
FY 2000 FY 2001 FY 2002
Variance (197) (235) 474
Variance (%) (1.9) (2.2) 4.5
PlanActual
Civilian Full-Time Equivalents
FY 2000 FY 2001 FY 2002
Variance 1 0 0
Variance (%) 4.5 0 0
PlanActual
Military End Strength
10,267 10,450 10,41310,070 10,21510,887
22 21
32
23 21
32
Figure 10. Personnel Indicators

Performance MeasuresFinancial PerformanceThere are five fiscal performance measures for Depot Maintenance: cost perdirect labor hour, financial operating measures, customer revenue rate, capitalinvestment, and cash management.
Cost per Direct Labor Hour. The cost per direct labor hour (DLH) iscomputed by taking the sum of all labor and non-labor expenses (direct,indirect, and general and administrative (G&A)), plus the change in work inprocess, and dividing that sum by the total number of DLHs worked during thefiscal year.
Table 27. Cost per Direct Labor Hour
Table 28 breaks down DLH costs into their component parts. Direct costsinclude civilian labor, materiel, supplies, equipment, and other costs that aredirectly related to a funded order (travel, training, and purchased services).The indirect/G&A elements comprise all costs not directly related to an orderand that are recovered as overhead expenses. These include administrativepersonnel costs, base support costs, support personnel costs, and facility repairand maintenance costs.
Table 28. FY 2000 Costs ($ millions)
Category FY 2000 FY 2001 FY 2002
Direct Labor $296.9 $311.4 $418.4
Indirect Labor 233.3 250.8 293.5
General and Administrative Labor 10.7 20.1 14.5
Direct Materiel 382.1 455.2 635.9
Indirect Materiel 48.4 52.2 71.3
Indirect Other 263.6 304.0 299.8
Total $1235.0 $1,393.7 $1,733.4
Direct Labor Hours 10,598 10,277 11,381
Cost per Hour ($) $116.53 $135.61 $152.29
Change in Work in Process ($1.2) ($3.9) ($32.7)
Cost of Goods Sold ($ millions) $1,236.2 $1,397.6 $1,766.2
Cost per Hour (unit cost, $) $116.64 $135.99 $155.17
FY 2000 FY 2001 FY 2002Category Actual Actual Actual
Cost per Direct Labor Hour $116.64 $135.99 $155.17
Change from Prior Year (%) (3.0) 16.6 14.1
Direct Labor Hours (000s) 10,598 10,277 11,381
fy02Working Capital Fund
61

“Im
agin
atio
n •
Inno
vatio
n •
Initi
ativ
e”
62
FY02
Uni
ted
Sta
tes
Arm
y A
nnua
l Fin
anci
al S
tate
men
t
Financial Operating Measures. Under the full-cost recovery concept,stabilized rates are set such that they should cover all costs and produce a zeroaccumulated operating result (AOR) at the end of the budget year. Duringexecution, the activity group may experience either a positive or negative netoperating result (NOR). The gain or loss shown in the NOR is added to theAOR from prior years. Stabilized rates are included in the President's Budget,published approximately eight months in advance of the year of execution.The rates are stabilized so that customers' programs will not be affected duringexecution, even though the actual costs of the AWCF activity may be higheror lower than planned.
Deviations from the plan impact the activity group to the extent that anunplanned gain or loss must be included in the following year's rates to bringthe AOR to zero. Any change in rates may in turn result in an increase ordecrease in the customer's buying power.
Table 29 shows the operating measures for the past three fiscal years. FY 2002revenue and costs were both above plan. Acceptable deviation from the plan isplus or minus 10 percent. FY 2002 expenses, NOR, and AOR were adverselyaffected by the asbestos settlement at Corpus Christi Army Depot. Thisresulted in an unplanned/unbudgeted expense of $92.3 million (comprising a$90.7 million award to employees and $1.6 million processing costs).Independent of this action, the Depot Maintenance Activity performed betterthan planned.

Table 29. Results of Operations ($ millions)
Customer Revenue Rate. In Depot Maintenance, customer revenue rates areset per direct labor hour. These rates are stabilized so that the customer'sbuying power is protected in the year of execution. Table 30 shows thestabilized revenue rates per DLH.
Table 30. Stabilized Rates
The FY 2002 rate of $124.57 per DLH cash was 4 percent higher than that ofFY 2001.
Capital Investment. The Depot Maintenance activity group seeks to maintainand develop its capabilities through the acquisition of new equipment and theexecution of minor construction projects. The capital budget provides forequipment acquisitions to replace obsolete and unserviceable equipment, to
Direct Labor Rate FY 2000 FY 2001 FY 2002
Customer Revenue Rate ($) $111.87 $119.81 $124.57
Customer Rate Change (%) 5.9 7.1 4.0
FY 2000 FY 2001 Plan Actual Plan Actual
Revenue $1,216.3 $1,291.8 $1,389.3 $1,434.1
Cost of Goods Sold 1,190.5 1,236.2 1,357.9 1,390.1
Operating Results 25.8 55.6 31.4 44.0 (less Capital Surcharge) 52.5 45.4 15.7 12.5 (less Extraordinary Items) 0.0 0.0 0.0 0.0
Net Operating Results (26.7) 10.2 15.7 31.5
Beginning AOR 85.1 26.7 55.2 55.2 (less Prior-Year Adjustment) (58.4) 18.4 0.1 (3.5)
Beginning AOR Adjusted 26.7 45.1 55.3 51.7
AOR (NOR plus Adjusted AOR) $0.0 $55.2 $71.0 $83.2
FY 2002 Plan Actual Revenue $1,580.0 $1,668.4
Cost of Goods Sold 1,599.0 1,766.2
Operating Results (19.0) (97.8) (less Capital Surcharge) 0.2 0.6 (less Extraordinary Items) 0.0 0.0
Net Operating Results (19.2) (98.4)
Beginning AOR 64.6 83.2 (less Prior-Year Adjustment) 0 (23.8)
Beginning AOR Adjusted 64.6 59.4
AOR (NOR plus Adjusted AOR) $45.4 ($39.0)
fy02Working Capital Fund
63

“Im
agin
atio
n •
Inno
vatio
n •
Initi
ativ
e”
64
FY02
Uni
ted
Sta
tes
Arm
y A
nnua
l Fin
anci
al S
tate
men
t
eliminate environmental hazards, and to decrease costs through improvementsin productivity. Table 31 represents the obligation authority of the capitalbudget.
Table 31. Capital Budget ($ millions)
Note: ADPE is automated data processing equipment
FY 2002 Capital Investment Program (CIP) projects include the purchase ofthe following:
Various Capital Equipment - Replacement (>$500K) ($2.4 million). Thisprogram seeks to replace depot equipment items costing more than $500thousand that have outlived their useful lives, become uneconomical to repairor become unsafe to operate.
Various Capital Equipment - Productivity (>$500K) ($0.6 million). Thisprogram seeks to modernize equipment costing more than $500 thousand toimprove depot productivity and efficiency and reduce operating costs.
Electron Beam Welder ($0.9 million). The electron beam welder is used toreclaim critical parts for the Advanced Gas Turbine 1500 Engine that supportsthe M1 Tank Family of Vehicles.
Engine Test Cell Capacity Upgrade ($3.1 million). Enables one of the CH47engine test cells to test any engine or engine component configuration. Thetest cell upgrade enables fast data sampling, fast configuration conversion, andfaster, more robust data display to assure the operator that the test is notdamaged and that the final product is of high quality.
Various Minor Construction ($1 million). This program corrects variousworkload and production shortcomings and health, safety, environmental, andsecurity conditions.
Category FY 2000 FY 2001 FY 2002
Equipment $4.4 $3.6 $7.1
Minor Construction 1.9 1.9 1.1
ADPE and Telecom 0.8 0.0 0.0
Software 10.2 13.8 16.7
Total $17.3 $19.3 $24.9

Army Workload and Performance System (AWPS) ($2.9 million). TheAWPS is a personal computer-based, network software solution designed tointegrate existing production and financial data into a singlegraphic program. This will assist the Tank, Automotive andArmament Command (TACOM), Communications andElectronics Command (CECOM), and Aviation and MissileCommand (AMCOM), in managing complex workload andemployment strategies. This is a Congressional mandate.
Logistics Modernization Program (LMP) ($7.4 million). TheLMP seeks to reengineer existing logistics processes to provideflexibility in support of CONUS-based power projectionscenarios to leverage modern information technology enablersto provide real-time visibility of the entire logistics supplychain, and thereby to support the Revolution in MilitaryLogistics.
SDS Data Collection/Shop Floor/AIT ($6.3 million). Thisprogram provides a Windows-based common technologyarchitecture for the various wholesale logistics processes thatwill enable users of logistics systems to perform all businessfunctions from a single workstation. It will interface with theLMP.
Cash ManagementThe Army manages AWCF cash at the corporate level. Theperformance of individual activity groups is measured againstplanned collections, disbursements, and outlays rather than interms of cash balances. Depot Maintenance collections anddisbursements in FY 2002 were $1.73 billion and $1.76 billion,respectively. Both collections and disbursements were over planand reflect the revenue and expense positions of the DepotMaintenance activity group.
Program PerformanceThe Depot Maintenance activity group uses two program performancemeasures: production output and schedule conformance.
Production Output. Table 32 lists the quantity and customer price for five
fy02Working Capital Fund
65
FY 2000 FY 2001 FY 2002
Variance $93 $263.7 $184.0
Variance (%) 7.3 21.7 11.9
PlanActual
Cash Collections
0
1000
2000
FY 2000 FY 2001 FY 2002
Variance $25.5 $255.3 $70.4
Variance (%) 2.0 21.9 4.2
PlanActual
Cash Disbursements
0
1000
2000
FY 2000 FY 2001 FY 2002
Variance ($69.5) ($7.5) ($115.8)
Variance (%) (168.3) 15.7 (82.5)
PlanActual
Cash Outlays
0
100
200
$1,280.61,373.6
$1,214.61,478.3 $1,550.6
1,734.6
$1,239.3 1,262.8$1,166.8
1,422.1
$1,690.9 1,761.3
($41.3) (110.8) ($47.8) (55.3)
140.3
24.5
Figure 11. Cash Management ($ millions)

“Im
agin
atio
n •
Inno
vatio
n •
Initi
ativ
e”
66
FY02
Uni
ted
Sta
tes
Arm
y A
nnua
l Fin
anci
al S
tate
men
t
representative end items for the last three fiscal years. The table highlights onespecific item at each of the major repair depots that is receiving A1 (cyclic,normal overhaul, rebuild) work. The prices indicated are the unit prices byyear for this type of work; price fluctuations are due to changes in materieland labor costs, distribution of overhead costs, AOR recovery, and the cashsurcharge.
Table 32. Production Output
**The quantities and unit prices reflected for RRAD are for 26x6 roadwheels only.
Schedule Conformance. This performance measure records the number ofunits completed on schedule as a percentage of the number of units scheduled.Units completed are defined as major end items plus reparables.
Table 33. Schedule Conformance (percentage)
The difference between planned and actual performance in FY 2002 wasbecause both Anniston and Red River executed greater unplanned workload inresponse to increased customer demands.
FY 2000 FY 2001 FY 2002
Plan 90 89 90
Actual 86 90.9 93.9
Variance (percentage) (4) 1.9 3.9
Actual Unit Actual Unit Quantity Price ($) Quantity Price ($) Rear Module, M1A1 (ANAD) 419 51,308 378 63,107
Engine, Turbine, T700-GE (CCAD) 40 150,278 120 250,100
Paladin Chassis (LEAD) 56 180,000 51 382,024
Wheel, Solid Rubber (RRAD)** 5721 246.00 2851 250.46
Visual Display Unit, AH64 (TYAD) 60 10,188 70 8,576
FY 2000 FY 2001
Proposed Actual Deviation Unit Quantity Quantity (%) Price ($) Rear Module, M1A1 (ANAD) 334 334 0 68,613
Engine, Turbine, T700-GE (CCAD) 120 120 0 256,083
Paladin Chassis (LEAD) 28 28 0 440,615
Wheel, Solid Rubber (RRAD)** 2800 2800 0 248.75
Visual Display Unit, AH64 (TYAD) 60 60 0 8,263
FY 2002

OrdnanceProgram ScopeCustomer Revenue (Program Size)Customer requirements dictate the size of the Ordnance workload. Table 34displays customer revenue for the past three fiscal years.
Revenue from customer orders in FY 2002 was slightly above that of FY2001. The increase in revenue is due to increased shipments in support ofoverseas military operations, troop support/force protection, and receipt ofunplanned orders and miscellaneous spares.
Table 34. Total Revenue by Customer ($ millions)
PersonnelA key objective of the Army is to have the correct number ofappropriately skilled people in the right places to meetworkload requirements. As workload has declined, staffinglevels also have been reduced, through a combination ofinvoluntary separations, voluntary separation incentiveprograms, and hiring freezes. Figures for the last three fiscalyears show an overall decline in personnel levels consistentwith the activity's falling workload. There were no changes inmilitary end strength between FY 2001 and FY 2002.
Appropriation FY 2000 FY 2001 FY 2002
Operations and Maintenance, Army $265.4 $299.4 $282.4
Procurement, Army 177.2 151.1 165.5
AWCF 52.4 75.4 75.8
Other Army 29.9 25.6 22.8
Other Services 24.8 32.0 14.1
Other DoD 80.1 42.3 62.0
Foreign Military Sales 16.9 15.2 20.9
Non-DoD 11.4 26.8 26.3
Total Revenue $658.0 $667.8 $669.8
fy02Working Capital Fund
67
FY 2000 FY 2001 FY 2002
Variance (173) (302) 2
Variance (%) (2.8) (5.1) 0.04
PlanActual
Civilian Full-Time Equivalents
0
3500
7000
FY 2000 FY 2001 FY 2002
Variance (2) (2) (3)
Variance (%) (8.7) (10.0) (14.3)
PlanActual
Military End Strength
0.0
12.5
25.0
6,2225,878 5,572
6,0495,576 5,574
2320 2121
18 18
Figure 12. Personnel Indicators

“Im
agin
atio
n •
Inno
vatio
n •
Initi
ativ
e”
68
FY02
Uni
ted
Sta
tes
Arm
y A
nnua
l Fin
anci
al S
tate
men
t
Performance MeasuresFinancial PerformanceThere are four financial performance measures for Ordnance. These are costper direct labor hour, customer revenue rate, capital investment, and cashmanagement.
Financial Operating Measures. Under the full-cost recoveryconcept, stabilized rates are set to cover all costs and produce azero accumulated operating result (AOR) at the end of thebudget year. During execution, the activity group mayexperience either a positive or negative net operating result(NOR). The gain or loss shown in the NOR is added to theAOR from prior years. Stabilized rates are included in thePresident's Budget, published approximately eight months inadvance of the year of execution. The rates are stabilized so thatcustomers' programs will not be affected during execution, eventhough the actual costs of the AWCF activity may be higher orlower than planned.
Deviations from the plan impact the activity group to the extent that anunplanned gain or loss must be included in the following year's rates to bringthe AOR to zero. Any change in rates may, in turn, result in an increase ordecrease in the customer's buying power.
Table 35 shows the results of operations for Ordnance for the past three fiscalyears. FY 2002 revenue and costs were both above plan but were within theacceptable deviation from plan of plus or minus 10 percent.
Civilian technicians move ordnance out of a storagefacility. Photo courtesy of AUSA.
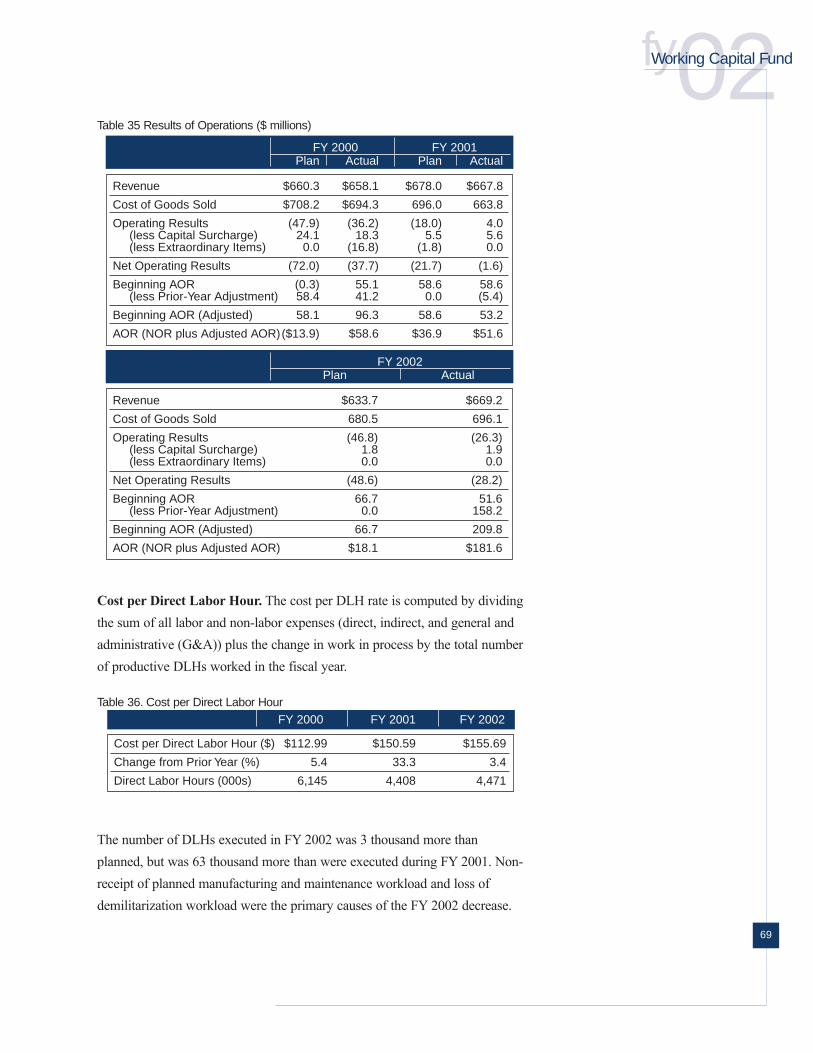
fy02Table 35 Results of Operations ($ millions)
Cost per Direct Labor Hour. The cost per DLH rate is computed by dividingthe sum of all labor and non-labor expenses (direct, indirect, and general andadministrative (G&A)) plus the change in work in process by the total numberof productive DLHs worked in the fiscal year.
Table 36. Cost per Direct Labor Hour
The number of DLHs executed in FY 2002 was 3 thousand more thanplanned, but was 63 thousand more than were executed during FY 2001. Non-receipt of planned manufacturing and maintenance workload and loss ofdemilitarization workload were the primary causes of the FY 2002 decrease.
FY 2000 FY 2001 FY 2002
Cost per Direct Labor Hour ($) $112.99 $150.59 $155.69
Change from Prior Year (%) 5.4 33.3 3.4
Direct Labor Hours (000s) 6,145 4,408 4,471
FY 2000 FY 2001 Plan Actual Plan Actual
Revenue $660.3 $658.1 $678.0 $667.8
Cost of Goods Sold $708.2 $694.3 696.0 663.8
Operating Results (47.9) (36.2) (18.0) 4.0 (less Capital Surcharge) 24.1 18.3 5.5 5.6 (less Extraordinary Items) 0.0 (16.8) (1.8) 0.0
Net Operating Results (72.0) (37.7) (21.7) (1.6)
Beginning AOR (0.3) 55.1 58.6 58.6 (less Prior-Year Adjustment) 58.4 41.2 0.0 (5.4)
Beginning AOR (Adjusted) 58.1 96.3 58.6 53.2
AOR (NOR plus Adjusted AOR) ($13.9) $58.6 $36.9 $51.6
FY 2002 Plan Actual Revenue $633.7 $669.2
Cost of Goods Sold 680.5 696.1
Operating Results (46.8) (26.3) (less Capital Surcharge) 1.8 1.9 (less Extraordinary Items) 0.0 0.0
Net Operating Results (48.6) (28.2)
Beginning AOR 66.7 51.6 (less Prior-Year Adjustment) 0.0 158.2
Beginning AOR (Adjusted) 66.7 209.8
AOR (NOR plus Adjusted AOR) $18.1 $181.6
Working Capital Fund
69

“Im
agin
atio
n •
Inno
vatio
n •
Initi
ativ
e”
70
FY02
Uni
ted
Sta
tes
Arm
y A
nnua
l Fin
anci
al S
tate
men
t
Table 37 beaks down the overall costs for FY 2002. Direct costs are the costsof civilian labor, materiel, supplies, equipment, and others that are directlyrelated to a funded order. Indirect costs are those not directly related to anorder, such as administrative personnel costs, base support costs, supportpersonnel costs, and facility repair and maintenance costs.
Table 37. FY 2000 Cost Estimates ($ millions)
Customer Revenue Rate. The Ordnance activity group sets customer revenuerates per direct labor hour. These rates are stabilized so that the customer'sbuying power is protected in the year of execution. Table 38 shows therevenue rate per DLH, and indicates a 7.9 percent rate reduction between FY2001 and FY 2002.
Table 38. Stabilized Direct Labor Hours
Capital Investment Program. The Ordnance group seeks to maintain anddevelop its capabilities through the acquisition of equipment and the executionof minor construction projects. The capital budget provides for equipmentacquisition to replace obsolete and unserviceable equipment, to eliminateenvironmental hazards, and to decrease repair costs by improving productivity.Table 39 represents the obligation authority of the capital budget.
Direct Labor Hourly Rate FY 2000 FY 2001 FY 2002
Customer Revenue Rate $99.10 $102.70 $94.59
Customer Rate Change (%) (5.73) 3.6 (7.9)
Category FY 2000 FY 2001 FY 2002
Direct Labor $173.1 $167.6 $168.8
Indirect Labor 121.5 104.8 139.5
General and Administrative Labor 53.0 59.6 46.2
Direct Materiel 100.1 93.9 82.4
Indirect Materiel 20.2 16.6 25.5
Indirect Other 89.3 214.3 231.9
Total $557.2 $656.8 $694.3
Direct Labor Hours 6,145 4,408 4,471
Cost per Hour (unit cost, $) $90.68 $149.00 $155.29
Change in Work in Process (2.6) (7.0) (1.8)
Cost of Goods Sold $694.3 663.8 696.1
Cost per Hour (unit cost, $) $112.99 $150.59 $155.69

Table 39. Capital Budget ($ millions)
FY 2002 capital investment program (CIP) projects include purchase of thefollowing:
Various Capital Equipment - Replacement ($2.1 million). This programfunds the replacement of items of equipment costing more than $500 thousandthat have outlived their useful lives, are uneconomical to repair, or are unsafeto operate.
Laser Punch ($0.7 million). The laser punch provides state-of-the-art lasertechnology to support the manufacture of critical parts for the ContactMaintenance Truck, Heavy (CMTH), the Forward Repair System, and theBMP-3 (Soviet Bronevaya Maschina Piekhota) Surrogate Target Tank. Thisprogram improves the state of readiness for combat-essential weapon systems.
Minor Construction (<$500K) ($1.3 million). This program addresses andcorrects various problems at Ordnance installation facilities that give rise topoor working conditions, reduce productivity, lack energy conservationfeatures, compromise security, fail to comply with fire and safety codes, orpresent health hazards.
Miscellaneous Automated Data Processing Equipment (ADPE) (morethan $500K) ($1.9 million). The ADPE program replaces old, obsolete, andirreparable equipment with state-of-the-art equipment to bring Ordnance sitesup to Army standards and to improve communications with other Army sites.New technology also will improve security and reduce the threat of intrusionby unauthorized sources.
Army Workload and Performance System (AWPS) ($4.7 million). TheAWPS is a personal computer-based, network software solution designed tointegrate existing production and financial data into a single graphic program.
Category FY 2000 FY 2001 FY 2002
Equipment $6.7 $11.8 $2.8
Minor Construction 3.4 7.8 1.3
ADPE and Telecom 2.7 4.9 1.9
Software 8.7 4.8 4.7
Total $21.5 29.3 10.7
fy02Working Capital Fund
71

“Im
agin
atio
n •
Inno
vatio
n •
Initi
ativ
e”
72
FY02
Uni
ted
Sta
tes
Arm
y A
nnua
l Fin
anci
al S
tate
men
t
It will enable production and resource managers to isolatescheduling and cost problems at the product level and toestimate the workforce needed to accomplish various levels ofworkload. This is a congressional mandate.
Cash ManagementThe Army manages AWCF cash at the corporate level. Theperformance of individual activity groups is measured againstplanned collections, disbursements, and outlays, not againstcash balances. The FY 2002 plan for Ordnance projected a$26.5 million drain on cash, but the actual result was a cashincrease of $275.9 million. Collections were above plan by$315 million, partly as a result of the advance billing ofcustomers in the amount of $146 million. The Ordnancebusiness activity also increased collection of valid prior-yearbills. Outlays exceeded the plan by $302 million.
Program PerformanceThe Ordnance activity group uses three program performancemeasures: production output, schedule conformance, andammunition short tons.
Production Output. Shows the quantities and unit prices forthree ordnance items produced by the group during the last twofiscal years. For FY 2002, plan amounts are also listed.
Table 40. Production Output
Actual Unit Actual Unit Quantity Price ($) Quantity Price ($) 155MM M804A1 Practice (Crane) 35,512 244.48 0 0
Bomb, 500lb, BDU 45 (McAlester) 10,914 77.48 11,517 1,017.4
G982 M83 Training Grenade (Pine Bluff) 330,234 19.98 158,912 19.98
FY 2000 FY 2001
FY 2000 FY 2001 FY 2002
Variance ($9.2) $82.2 $315.3
Variance (%) (1.4) 12.5 47.8
PlanActual
Collections ($ millions)
0
500
1000
FY 2000 FY 2001 FY 2002
Variance ($45.5) $12.9 $14.3
Variance (%) (6.5) 1.9 2.1
PlanActual
Disbursements ($ millions)
0
400
800
FY 2000 FY 2001 FY 2002
Variance ($36.3) ($69.3) ($302.4)
Variance (%) (114.0) (1,307.5) (1,141.1)
PlanActual
Outlays ($ millions)
-250
-150
-50
50
$671.0 $658.4 $659.1661.8740.6
974.4
$702.9$653.1 $685.6657.4 666.0 699.9
$31.8($5.3)
$26.5(4.5) (74.6) (275.9)
Figure 13. Cash Management ($ millions)

Schedule Conformance. This performance measure shows the number ofunits completed on schedule against the number of units scheduled. Unitscompleted are defined as major end items plus reparable items.
Table 41. Schedule Conformance
For FY 2002, the positive deviation from plan was primarily due to increasedefforts to produce units on time.
Ammunition Short Tons. This measures the amount of short tons ofordnance received, issued, or demilitarized. (A short ton is 2,000 pounds ofammunition.) Based on standards at the installations, this figure has a directcorrelation to personnel, funding, and rates.
Table 42. Ammunition Short Tons
Receipts, issues, and demilitarization workload were higher than planned due to the response to the terroristattacks of September 11, 2001.
FY 2000 FY 2001 FY 2002 Actual Actual Plan Actual Variance (%) Receipts 142,544 125,100 128,500 131,700 2.5
Issues 140,445 162,400 157,800 165,800 5.1
Demilitarized 42,446 36,799 25,707 27,759 8.0
FY 2000 FY 2001 FY 2002
Plan 150.0 295.3 286.3
Actual 121.0 287.5 297.6
Variance (percentage) (19.3) (2.6) 3.9
Proposed Actual Deviation Unit Quantity Quantity (%) Price ($) 155MM M804A1 Practice (Crane) 0 0 0 0
Bomb, 500lb, BDU 45 (McAlester) 13,998 15,882 13.5 1,000.78
G982 M83 Training Grenade (Pine Bluff) 111,856 111,856 0 20.31
FY 2002
fy02Working Capital Fund
73

“Im
agin
atio
n •
Inno
vatio
n •
Initi
ativ
e”
74
FY02
Uni
ted
Sta
tes
Arm
y A
nnua
l Fin
anci
al S
tate
men
t
Information ServicesProgram ScopeCustomer Revenue (Program Size)Customer requirements dictate the workload of the Information Servicesactivity group. Customers of the group's four Central Design Activities(CDAs) sign letters of intent, followed by support agreements that estimate thenumber of work-years required by each project and the project's anticipatedcosts. Revenue from customer orders in FY 2002 totaled $104.8 million. Table43 provides a breakdown of orders by customer for FY 2000 through FY2002.
Table 43. Total Revenue by Customer ($ millions)
The Army continues to be the largest source of revenue, accounting for 89percent of total revenue in FY 2002. The Defense Finance and AccountingService (DFAS) also is an important customer because of its needs for design,maintenance, and testing services for its financial systems.
The Information Services activity group also includes the Army SmallComputer Program (ASCP), the primary objective of which is to providecustomers with the latest technology at the best price. The program negotiatesdirectly with commercial information technology vendors for hardware,software, and support services, and in so doing is able to eliminate theduplicated costs associated with individual procurements. In addition, theASCP is in a position to ensure that all products purchased adhere to Armyand DoD interoperability and compliance standards. The program collects afee of 1 percent of the total order cost for providing this service. In FY 2002,revenue was $6.6 million.
Appropriation FY 2000 FY 2001 FY 2002
Operations and Maintenance, Army $52.3 $33.7 $34.4
Procurement, Army 3.4 2.3 0.1
AWCF 57.3 45.0 53.8
Other Army 5.4 4.2 4.1
Other DoD 10.4 8.1 7.9
Foreign Military Sales 0.0 0.0 0.0
Non-DoD 5.9 4.5 4.5
Total Revenue $134.7 $97.8 $104.8

PersonnelCivilian end strength and work-years were on plan in FY 2002,as was military end strength.
Performance MeasuresFinancial PerformanceThe Information Services activity group uses three financialperformance measures: cost per direct labor hour (DLH),financial operating measures (revenue, costs, and net operatingresults), and cash management.
Cost per Direct Labor Hour. The DLH rate is computed bydividing the sum of all activity labor and non-labor expenses(direct, indirect, and general and administrative (G&A))incurred during the fiscal year by the total number of directlabor hours executed. Excluded from this computation arecontractor support costs, ASCP expenses, and direct laborhours, which are treated as direct reimbursable costs. For FY2001 and FY 2002 this activity group is working on a cost-reimbursable basis in anticipation of decapitalization at the end of FY 2003;cost per direct labor hour therefore is not applicable.
Table 44. Cost per Direct Labor Hour
*Note: These amounts exclude ASCP direct labor hours.
Net Operating Results. The activity experienced NOR of $3.7 million inexcess of plan. This was due primarily to increased revenue at the Army'sSmall Computer Program (ASCP). Ordering on two contracts (Dell ArmyDesktop and Mobile Computing-1 contract and Oracle Enterprise InitiativeSoftware Agreement) in particular was heavier than anticipated.
FY 2000 FY 2001 FY 2002
Cost per Direct Labor Hour $115.12 $449.77 $268.85
Change from Prior Year (%) 52.4 290.6 40.3
Direct Labor Hours* (000s) 596 219 260
fy02Working Capital Fund
75
FY 2000 FY 2001 FY 2002
Variance (26) 10 12
Variance (%) (4.3) 3.3 4.3
PlanActual
Civilian Full-Time Equivalents
0
400
800
FY 2000 FY 2001 FY 2002
Variance (10) 0 (2)
Variance (%) (55.6) 0 (25)
PlanActual
Military End Strength
0
13
26
601
295 282
575
305 294
1821
68
21
8
Figure 14. Cash Management ($ millions)

“Im
agin
atio
n •
Inno
vatio
n •
Initi
ativ
e”
76
FY02
Uni
ted
Sta
tes
Arm
y A
nnua
l Fin
anci
al S
tate
men
t
Table 45 Results of Operations ($ millions)
Cash Management. The Army manages AWCF cash at thecorporate level. The performance of individual activity groupsis measured against planned collections, disbursements, andoutlays, not against cash balances. A positive outlay means theactivity group is losing cash; a negative outlay means theactivity group is generating cash. The actuals in Figure 15reflect the cash transactions reported to Treasury for the activitygroup. These include residual transactions from Fort Huachuca,which moved out of the AWCF several years ago. TheInformation Services activity group ended the year with $1.6million of outlays versus planned outlays of $4.4 million. Theprimary cause of the low outlay was the group's increasedemphasis on collecting accounts receivable.
Program PerformanceThe Information Services activity group is still relatively new tothe AWCF, and only one program performance measure (directlabor hours executed versus planned) has been developed. Weare seeking better measures that would be applicable across allof the four Central Design Activities.
Direct Labor Hours. The number of DLHs achieved in FY2002 was 27,000 over plan.
FY 2000 FY 2001 Plan Actual Plan Actual
Revenue $159.6 $134.9 $129.3 $97.8
Expense 159.7 136.2 135.0 101.5
Operating Results ($0.1) ($1.3) ($5.7) ($3.7) (less Non-Recoverable) 0.0 0.3 0.0 0.0
Net Operating Results ($0.1) ($1.6) ($5.7) ($3.7)
FY 2002 Plan Actual Revenue $105.3 $103.8
Expense 105.3 100.2
Operating Results 0.0 3.7 (less Non-Recoverable) 0.0 0.0
Net Operating Results 0.0 3.7
FY 2000 FY 2001 FY 2002
Variance $2.3 $9.4 $8.4
Variance (%) 1.7 9.1 9.1
PlanActual
Collections ($ millions)
0
75
150
FY 2000 FY 2001 FY 2002
Variance ($18.8) $9.6 $5.7
Variance (%) (13.2) 9.9 5.9
PlanActual
Disbursements ($ millions)
0
75
150
FY 2000 FY 2001 FY 2002
Variance ($21.1) $0.3 ($2.8)
Variance (%) (479.5) 4.2 (63.6)
PlanActual
Outlays ($ millions)
-20
0
20
$137.8
$103.4$92.5
140.1
112.8100.9
$142.2
$96.3 $96.9
123.4105.9 102.6
$4.4($7.2)
$4.4(16.7) (6.9) 1.6
Figure 15. Personnel Indicators

Table 46. Direct Labor Hours (000s)
Category FY 2000 FY 2001 FY 2002
Plan 659 254 250
Actual 609 236 277
Variance (50) (18) 27
Variance (percentage) (7.5) 7.1 10.8
fy02Working Capital Fund
77

“Im
agin
atio
n •
Inno
vatio
n •
Initi
ativ
e”
78
FY02
Uni
ted
Sta
tes
Arm
y A
nnua
l Fin
anci
al S
tate
men
t
Management IntegrityContinuing ChallengeLack of Spare PartsThe AWCF is struggling with a critical shortage of spare parts. Sustaining theArmy requires a level of inventory that is sufficient to meet OPTEMPO andsurge requirements; however, the Army has identified a $1.3 billion spareparts inventory shortfall. The AWCF's difficulty in meeting these requirementsis due to fragmented pricing and credit policies, and to inconsistentmanagement information.
The Army was able to ensure that this shortfall did not impact readiness in FY2002, but good management demands that requirements for spare parts beidentified and funded during the normal budget process rather than during theyear of execution. The Army therefore has established a work group to reviewthe underlying causes of this problem. The group will examine logistics andfinancial systems to identify those business rules and processes that must bechanged such that the total requirement for parts can be established accuratelyand funding aligned accordingly within the normal budget process. TheAWCF goal is to ensure that the spare parts inventory maintains 85 percentstock availability.
The Army is working now to identify the FY 2003 shortfall. It plans by FY2004 to have in place the policies and procedures that will enable it to identifythe requirements for spare parts during the normal budget process.
Future Effects of Existing ConditionsLogistics TransformationAs part of Army Transformation, several financial reform initiatives have beenrecommended by the Logistics Transformation Task Force (LTTF) that mayresult in a change to the pricing and recording of products and/or services soldby the AWCF. The proposed changes will be reviewed by the task force and, ifapproved, will be implemented during FY 2004-FY 2007. The goal of thesereform initiatives is to promote cost visibility while streamlining pricedevelopment. If this is achieved as required, the buyer/seller relationships willbenefit.
Sustaining the Armyrequires a level ofinventory that issufficient to meetOPTEMPO andsurge requirements.

Facilities RecapitalizationThe Army has identified a need for a facilities framework capable of properlysupporting its future worldwide missions. This will require programs andbudgets that ensure a day-to-day readiness of modern facilities relevant tofuture operations and services. The Army will use standard tools and metricsto determine the appropriate investment levels for this facilitiesrecapitalization.
The recapitalization rate metric is one element of a larger paradigm that hasbeen under development in DoD since 1999. This paradigm is composed ofrestructured programs and new performance metrics for facilities sustainment,restoration, and modernization (S/RM). The new S/RM paradigm is expectedto solve long-standing problems that the Army has faced in determiningfunding requirements for facilities. It supports the Government Performanceand Results Act and the Chief Financial Officer's Act.
The Defense Planning Guidance for FY 2004-FY 2009 provides a revisedinvestment strategy based on S/RM principles. However, the challenge of howto implement the strategy remains. Successful implementation will require amajor transformation of existing practices and a long-term commitment toresolve the problem.
Using the S/RM-based strategy, the Army plans to first forecast its requiredinventory and then:
fully sustain its assets and stop the loss of service life;
restore by 2010, where appropriate and affordable, C2 readiness tofacilities rated C-3 or C-4 in the bear term buying back lost service life;and
modernize for the future, establishing by 2007 a recapitalizationinvestment stream tied to average expected service life (67 years).
For mainstream recapitalization programs — and for recapitalization typicallyfunded by traditional military construction, O&M, and working capital fundresources — the recapitalization rate metric is ready and usable for the FY2004-FY 2009 program and budget cycle. Additional research and analysis isrequired before the metric can be applied successfully to selected specialtyareas, such as family housing programs, foreign or internationally fundedprograms, and non-appropriated fund programs.
fy02Working Capital Fund
79
The new sustainment,restoration, and
modernizationparadigm is expected
to solve long-standing problemsthat the Army has
faced in determiningfunding requirements
for facilities.

“Im
agin
atio
n •
Inno
vatio
n •
Initi
ativ
e”
80
FY02
Uni
ted
Sta
tes
Arm
y A
nnua
l Fin
anci
al S
tate
men
t
Advancing the President's ManagementAgendaThe President's Management Agenda has great relevance in the logistics arena.By improving their management efficiency, all AWCF activities should beable to lower the rates they charge to customers.
Strategic Management of Human CapitalWorkforce RevitalizationThe AWCF has a critical role in helping to ensure the success of ArmyTransformation, but the ability of the AWCF workforce to perform its missionis in peril. The AWCF is afflicted by a growing number of retirement-drivenshortages in critical areas, and after more than a decade of cutbacks is facingserious skill imbalances. The limited intake of new personnel furthermoremeans that employees now average more than 20 years of service; unlesssomeone is in place to inherit their legacy, as staff members leave, thatknowledge and experience will be lost with them.
The Army Materiel Command (AMC) is seeking to put in place a WorkforceRevitalization Program that will institute hiring programs for apprentices,interns, and multidisciplinary fellows. Using innovative recruiting techniques,AMC will assess the abilities of new employees and determine and addresstheir development needs. The desired result is a viable and skilled workforceable to share the knowledge of experienced employees.
Graduate Studies for Logistics OfficersAWCF managers routinely are expected to apply and modify the best practicesof the private sector to AWCF businesses. But while AWCF businesses are ascomplex and challenging as any in the private sector, the Army's logisticsofficers typically are not trained in the professional business skills necessary torun AWCF businesses in accordance with best business practices.
AWCF logisticians receive a variety of military service school training, butthis does not approach the level of education found in civilian graduatebusiness schools, nor are they offered the opportunity to undertake fullyfunded studies at civilian graduate business schools. The lack of suchopportunities has contributed, in the past, to the decision of some logisticiansto leave the Army rather than pursue assignments for which they are not
The President'sManagement Agendahas great relevancein the logisticsarena.

prepared adequately. Seeking to address this weakness, the Army is evaluatingthe feasibility of making business graduate programs available for up to 5percent of eligible captains. In FY 2002, 885 captains would have beeneligible; had such a program been in place, up to 40 officers, therefore, wouldhave been given the opportunity to genuinely prepare themselves to runAWCF businesses.
Improved Financial PerformanceSingle Stock FundThe Single Stock Fund (SSF) initiative was begun in FY 1998. The SSF isdesigned to reengineer business processes to improve logistics and financialprocesses in the AWCF.
As force structure and technology changed, the need arose for a speed ofsystem processing and a supply chain agility that the previous environmentcould not support. The SSF combined the wholesale stocks previouslymanaged by the Army Materiel Command with the retail stock previouslymanaged by Army major commands. By integrating the asset requirements atboth levels, the Army thus gained a corporate visibility of its assets that itpreviously lacked. This lack of corporate visibility had contributed greatly toan accumulation of excess stock and a duplication of workload.
The SSF is streamlining operations by eliminating multiple points of sales,multiple ledger and billing accounts, duplicative automated systems, and otherinefficiencies. With the implementation of SSF Milestones 1 and 2, the Armycapitalized $489 million of retail stocks to the SSF.
Milestone 3 implementation began on July 1, 2002, with the commencementof the Verification of Initial Operating Capability (VIOC) at III Corps, theTexas Army National Guard, and selected U.S. Army Reserve units. Army-wide implementation began in November 2002, with completion scheduledfor May 2003. This will round out the program by capitalizing to the SSF anadditional 395 customer accounts with an approximate value of $900 million.The benefits of the SSF are exceeding expectations. The redistribution ofArmy-owned materiel that previously was inaccessible has improved greatlyAWCF customer responsiveness and has lowered costs significantly. A cost-benefit analysis conducted in 1999 projected a benefit-to-investment ratio of6.3 to 1; actual implementation evidence indicates that the SSF is well ontrack to exceed that estimate.
fy02Working Capital Fund
81

“Im
agin
atio
n •
Inno
vatio
n •
Initi
ativ
e”
82
FY02
Uni
ted
Sta
tes
Arm
y A
nnua
l Fin
anci
al S
tate
men
t
Logistics Modernization ProgramLMP has been an ongoing modernization process to allow the Army theflexibility to support today's CONUS-based power projection scenarios andutilize modern information technology enablers that provide real timevisibility of the entire logistics supply chain. In addition, LMP ensuresintegrated logistical and financial system processes that will maximizeresources to ensure all efforts toward total asset visibility are maintained andaccurate requirements determination is derived to support near and long-termreadiness objectives.
When fully implemented, LMP will provide a single point of entry for therecording, reporting, and analysis of inventory and related financial data,directly addressing an identified internal control weakness cited in the Army'sFY 2000 financial statements. The modernization program will provide afinancial information management system while simultaneously providing thelogistics community with easy access to online, real-time information at adetail level low enough to enable data to be summarized and sorted.Managers will be able to use these data to perform such functions as Activity-Based Costing and will bring financial data for the AWCF under generalledger control.
Dollar Cost BandingUnder the current system, an item is added to Authorized Stock Lists (ASLs)when nine requests are made for that item. Three demands are needed to retainthe item on the ASL. This system operates regardless of cost, with the resultthat inexpensive, but often critical, components are not held in stock. DollarCost Banding (DCB) seeks to ease this situation by reducing the add/retaincriteria for items costing less than $1,000; as the unit price of an itemdecreases, the criteria by which it is on the ASL are incrementally lowered.There would be no change to the current system for items priced more than$1,000 per unit. DCB allows units to add to the ASL many critical smallitems, at very little cost. Most units that have tried DCB have experiencedorder fill rates between 10 and 20 percent better than under the previoussystem with no increase in the total cost of the ASL. The benefits to readinessare obvious. While DCB has been optional, its success has led to it beingadopted broadly across the Army.

fy02Working Capital Fund
83

Civil Works Fund-Overview 85
Profile of Civil Works Program 85Mission 85
The Business Programs 87
Organizational Structure 94
Civil Works — Performance Results 97Strategic Goals 98
Analysis of Financial Statements 112Balance Sheet 112
Statement of Net Cost 113
Statement of Changes in Net Position 113
Statement of Budgetary Resources 113
Statement of Financing 114
Management Integrity 115Computer System Controls 115
Information Technology Capital Planning and Investment Decision Process 115
Future Effects of Existing Conditions 116The Marine Transportation System 116
Aging Infrastructure 116
Responding to Terrorist Threats 117
Advancing the President's Management Agenda 118Strategic Management of Human Capital 118
Competitive Sourcing 119
Improved Financial Performance 120
Expand Electronic Government 120
Budget and Performance Integration 123
“Im
agin
atio
n •
Inno
vatio
n •
Initi
ativ
e”
FY02
Uni
ted
Sta
tes
Arm
y A
nnua
l Fin
anci
al S
tate
men
t

85
Civil Works Fund—Overview
Profile of Civil Works ProgramMissionThe Civil Works mission is evolving constantly to keep pace with thechanging needs of the nation.
Developing and Managing Water ResourcesThe original Civil Works mission, as it related to developing and managingwater resources, was to support navigation by maintaining and improvingwater channels. In 1824, a series of laws authorized the Corps of Engineersalso to improve safety on the Ohio and Mississippi Rivers, and in 1909 theRivers and Harbors Act authorized the consideration of various water uses,including hydroelectric power generation, in the planning, design, andconstruction of water resource development projects. The Flood Control Actof 1917 established for Civil Works a role in flood damage reduction, and in1936 the Flood Control Act gave Civil Works the responsibility for providingflood protection for the entire country.
fy02
Civil Works Fund

“Im
agin
atio
n •
Inno
vatio
n •
Initi
ativ
e”
86
FY02
Uni
ted
Sta
tes
Arm
y A
nnua
l Fin
anci
al S
tate
men
t
Recreation was added to the Civil Works portfolio by the FloodControl Act of 1944, which authorized the provision ofrecreational facilities at reservoirs. The River and Harbor FloodControl Act expanded this authority in 1962, providingauthority to build, where feasible, recreational facilities as partof all water resource development projects.
Another aspect of water resources management is that of watersupply. The changing role of the Civil Works Program in watersupply has been directed by a series of Water ResourcesDevelopment Acts. The Water Supply Act of 1958 gave CivilWorks the authority to include water storage in both new andexisting reservoir projects for municipal and industrial uses at100 percent non-Federal cost.
Protecting, Restoring, and Managing theEnvironmentThe Rivers and Harbors Act of 1899 required the Corps ofEngineers to prevent the obstruction of navigable waterways,making the Corps an early tool used to protect the environment.As concerns over the environment grew in the late 20th century,the Clean Water Act of 1972 greatly broadened the Corps'sresponsibility by providing authority over dredging and fillingin "the waters of the United States," including the filling in ordestruction of wetlands. The program's environmentalresponsibilities were broadened further by new legislation,introduced in 1986, that expanded our traditional environmentalmitigation activities at new and existing projects to include the
enhancement and restoration of natural resources at our projects and in areasnot directly tied to our projects. This new legislation made providingenvironmental protection one of the primary missions of our water resourcedevelopment activities.
Responding and Assisting in Disaster ReliefThroughout its history, America has relied upon Civil Works for help in timesof national disaster. This help is provided now under two basic authorities: theFlood Control and Coastal Emergency Act (P.L. 84-99. as amended), and theStafford Disaster and Emergency Assistance Act. Under P.L. 84-99, CivilWorks has direct authority to provide emergency assistance during orfollowing flooding events to protect lives, public facilities, and infrastructure.
The Civil Works MissionThe Civil Works mission is to contributeto the national welfare and serve thepublic by providing the nation withquality and responsive
Development and management ofthe nation's water resourcesProtection, restoration, andmanagement of the environmentDisaster response and recoveryEngineering and technical servicesin an environmentally sustainable,economically and technically soundmanner through partnerships andthe project management businessprocess
A park ranger emphasizes safety at the John DayDam, OR.

Under the Stafford Act, the program supports the FederalEmergency Management Agency (FEMA) in carrying out theFederal Response Plan, which calls upon 26 Federaldepartments and agencies to provide coordinated disaster reliefand recovery operations. The primary role for Civil Works inemergency relief and recovery operations is to provide publicworks and engineering support.
Providing Engineering Support and TechnicalServicesIn Titles 10 and 33 of the U.S. Code, Congress expresses itsintent that the U.S. Army Corps of Engineers provide serviceson a reimbursable basis to other Federal entities, state, local and tribalgovernments, private firms and international organizations. Additionalauthorities to provide services that are applicable to all Federal agencies areprovided in Titles 15, 22 and 31. These authorities include providing servicesto friendly foreign governments.
The Business ProgramsThe Civil Works Program has established nine business programs throughwhich to accomplish the four components of its mission. Figure 16 defineseight of the nine business programs that receive direct appropriations. Theninth program, Support for Others, is conducted on a reimbursable basis. Eachbusiness program specifically addresses a single mission component, but allprograms also contribute to one or more of the other mission components.
Figure 16. FY 2002 Civil Works Appropriation by Business Program
$1.9 billion
$1.4 billion$193 milion
$132 million$705 million
$6 million$287 million
$15 million
Navigation EnvironmentFlood and Coastal Damage Prevention Emergency ManagementHydropower RecreationRegulatory Water Supply
87
Fighting the flood in Fort Wayne, IN.
fy02Civil Works Fund

“Im
agin
atio
n •
Inno
vatio
n •
Initi
ativ
e”
88
FY02
Uni
ted
Sta
tes
Arm
y A
nnua
l Fin
anci
al S
tate
men
t
NavigationThe Navigation business program is responsible for providing safe, reliable,
efficient, and environmentally sustainable waterbornetransportation systems for the movement of commercial goods,for national security needs, and for recreation. The programseeks to meet this responsibility through a combination ofcapital improvements and the operation and maintenance ofexisting infrastructure projects. The Navigation program is vitalto the nation's economic prosperity: 99 percent of America'sinternational trade moves through our ports, and 20 percent ofAmerican jobs depend to some extent on this trade.
In FY 2002, work continued to improve the future viability ofmany of America's ports and harbors. In New York City, workto dredge the access channel to 41 feet is vital to ensuring thatfuture containerships will be able to load fully in New York.
This $113 million project, of which Civil Works will pay $84 million, isexpected to provide $32 million in average annual benefits to the nation.
Civil Works operates and maintains 12,000 miles of inland waterways, nearly13,000 miles of deep draft and coastal inlet channels, 238 lockchambers, 300 major commercial harbors, and over 600 smallerrecreational and commercial harbors. Inland waterways providea highly fuel-efficient mode of transportation, able to movefreight at more than 500 ton-miles per gallon of fuel comparedto the less than 400 ton-miles per gallon that rail transportationachieves. This translates to an annual savings of $7 billion intransportation costs. Every dollar invested in improving ournavigation infrastructure results in a better than $3 increase inGDP.
In FY 2002, this $1.9 billion program accounted for 41 percentof the Civil Works budget.
Flood and Coastal Storm Damage ReductionThis business program is aimed at saving lives in the event offloods and storms and of reducing the property damage thatthey cause. Civil Works provides 8,500 miles of emplaced
Major CommoditiesHandled by Civil WorksPorts and Waterways inCY 2001Crude Oil 574 million tons
Petroleum Products 475 million tons
Coal 295 million tons
Food/Farm Products 282 million tons
NOTE: Statistics are compiled on acalendar year basis. CY 2002 statisticsnot available at time of printing.
A container vessel navigates the Kill Van Kull channelas it passes under the Bayonne Bridge, NJ. TheCorps has deepened this channel to accommodatemodern shipping vessels.
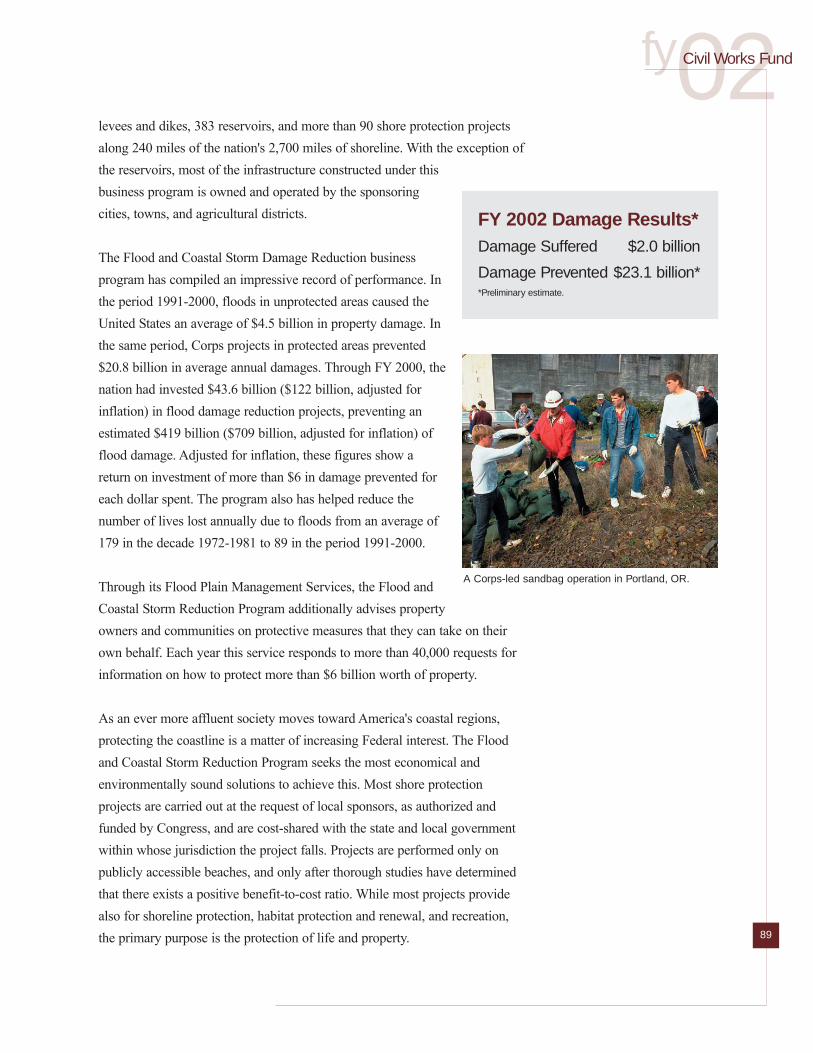
levees and dikes, 383 reservoirs, and more than 90 shore protection projectsalong 240 miles of the nation's 2,700 miles of shoreline. With the exception ofthe reservoirs, most of the infrastructure constructed under thisbusiness program is owned and operated by the sponsoringcities, towns, and agricultural districts.
The Flood and Coastal Storm Damage Reduction businessprogram has compiled an impressive record of performance. Inthe period 1991-2000, floods in unprotected areas caused theUnited States an average of $4.5 billion in property damage. Inthe same period, Corps projects in protected areas prevented$20.8 billion in average annual damages. Through FY 2000, thenation had invested $43.6 billion ($122 billion, adjusted forinflation) in flood damage reduction projects, preventing anestimated $419 billion ($709 billion, adjusted for inflation) offlood damage. Adjusted for inflation, these figures show areturn on investment of more than $6 in damage prevented foreach dollar spent. The program also has helped reduce thenumber of lives lost annually due to floods from an average of179 in the decade 1972-1981 to 89 in the period 1991-2000.
Through its Flood Plain Management Services, the Flood andCoastal Storm Reduction Program additionally advises propertyowners and communities on protective measures that they can take on theirown behalf. Each year this service responds to more than 40,000 requests forinformation on how to protect more than $6 billion worth of property.
As an ever more affluent society moves toward America's coastal regions,protecting the coastline is a matter of increasing Federal interest. The Floodand Coastal Storm Reduction Program seeks the most economical andenvironmentally sound solutions to achieve this. Most shore protectionprojects are carried out at the request of local sponsors, as authorized andfunded by Congress, and are cost-shared with the state and local governmentwithin whose jurisdiction the project falls. Projects are performed only onpublicly accessible beaches, and only after thorough studies have determinedthat there exists a positive benefit-to-cost ratio. While most projects providealso for shoreline protection, habitat protection and renewal, and recreation,the primary purpose is the protection of life and property.
fy02Civil Works Fund
89
FY 2002 Damage Results*Damage Suffered $2.0 billion
Damage Prevented $23.1 billion**Preliminary estimate.
A Corps-led sandbag operation in Portland, OR.

“Im
agin
atio
n •
Inno
vatio
n •
Initi
ativ
e”
90
FY02
Uni
ted
Sta
tes
Arm
y A
nnua
l Fin
anci
al S
tate
men
t
In FY 2002 the Civil Works Flood and Coastal Storm Reduction Programcompleted a project that will protect millions of Americans. In the early 1990s,the Los Angeles County Drainage Area, covering an area of 2,000 squaremiles, was protected only partially from floods. Enormous population growthin the area rendered the existing flood control system inadequate, to the extentthat the Federal Emergency Management Agency (FEMA) required residentsto hold mandatory flood insurance. Initiated in 1996 at an estimated cost ofmore than $450 million, the Los Angeles County Drainage Area project wascompleted for roughly $200 million, of which Civil Works paid $150 million.The project saw the building of 21 miles of parapet walls, armored the backslopes of levees, and modified or raised 26 bridges. As a result of theseimprovements, FEMA eliminated the obligation for flood insurance.
In FY 2002, this $1.4 billion program accounted for 30 percent of the CivilWorks budget.
Environmental Protection, Restoration, andManagementThis evolving and growing business program emphasizesenvironmental stewardship, ecosystem restoration, mitigation,environmental compliance, and research and development.Responding to the growing national demand for restoration andprotection, the program's work takes many forms, ranging frommonitoring water quality at dam sites to operating fishhatcheries with the states to restoring the environment at thesites of earlier projects. Since 1998, we have added more than120,000 acres of aquatic, wetland, and floodplain ecosystems toAmerica's natural habitats.
One example where work proceeded in FY 2002 was on the Kissimmee Riverin Florida. In the 1960s this 103-mile river was reduced to a 52-mile canal inorder to control flooding and resulted in a degradation of the naturalecosystem. The current project is aimed at restoring 52 miles of the river and27,000 acres of wetlands; improving water quality; and restoring theconditions for over 300 fish and wildlife species.
The Corps of Engineers and the Nature Conservancy have agreed to acollaborative effort to improve the management of dams on various rivers.The Sustainable Rivers Project will seek to improve dam operations, helping
"The optimalsolution will notalways be obvious oreasy, but [it] is whatwe will worktogether to find."
Steven McCormickPresident, Nature Conservancy
Kissimmee River C-38 Restoration Project, FL.

to restore and protect the health of rivers and surrounding natural areas whilecontinuing to meet human needs for services such as flood control and powergeneration. The collaborative effort will initially examine the potential toimprove operations at 13 dams on nine rivers in nine states.
In 1997, the Civil Works Program took over from theDepartment of Energy the Formerly Utilized Sites RemedialAction Program, which mandates the clean-up of formerManhattan Project and Atomic Energy Commission sites. Thetransfer of this program to Civil Works capitalizes on ourexperience gained in cleaning up former military sites andhazardous waste sites under the Environmental ProtectionAgency's "Superfund" program. Work under the program isongoing at 46 locations in Missouri, Illinois, Ohio, Maryland,New Jersey, New York, Connecticut, Pennsylvania, andMassachusetts.
In FY 2002, this $705 million program accounted for 15percent of the Civil Works budget.
Regulation of Waterways and WetlandsThe Civil Works Regulatory Program is responsible for the issue of permitsfor construction and dredging in the nation's navigable waters, includingwetlands. In doing so it must take into account the requirements to protectAmerica's aquatic resources while allowing reasonable use of private propertyand infrastructure development. The staff that performs this mission evaluatespermit applications for most construction activities that occur in the nation'swaters and for all work that would take place in the nation's navigable waters.
The Corps considers the views of other Federal, state and local agencies,interest groups, and the general public in rendering its final permit decisions.The program seeks to balance the reasonably foreseeable benefits anddetriments of proposed projects with the goal of making permit decisions thatrecognize the essential values of aquatic ecosystems to the general public. Anyunavoidable adverse impacts to the aquatic environment of a proposed projectare offset by mitigation requirements, which may include the requirement torestore, enhance, establish, or protect and maintain aquatic functions andvalues.
fy02Civil Works Fund
91
Formerly Utilized Sites Remedial Action Program.Groundwater sampling for radioactive materials,Wayne, NJ.

“Im
agin
atio
n •
Inno
vatio
n •
Initi
ativ
e”
92
FY02
Uni
ted
Sta
tes
Arm
y A
nnua
l Fin
anci
al S
tate
men
t
Great effort is made to make permit decisions in a timely manner to minimizethe inconvenience caused to the regulated public. In FY 2002, 88 percent ofall permit actions were completed in 60 days.
In FY 2002, this $132 million program accounted for 3 percent of the CivilWorks budget.
Emergency Management In a typical year, there are 30 presidential disaster declarations demanding aresponse from the Civil Works Program. It is often difficult to know more thana few days in advance when a hurricane or other natural disaster will strike,and in the case of a man-made disaster, as the events of September 11, 2001,showed, there may be no notice at all. To prepare for such events, the Corpshas implemented Readiness 2000, a unified and integrated corporate planningproject, to raise responsiveness to the highest possible level. Predictingimpending disasters can be difficult, but the returns on investment inemergency preparedness can be dramatic.
In FY 2002 the Emergency Management Program continued the work itstarted in late FY 2001 at the World Trade Center site in New York City.Structural engineers monitored unstable buildings, and other Civil Worksemployees supported search and rescue work. The program also provided amobile command center to support the New York Fire Department. Perhapsthe biggest mission, however, was debris removal. Civil Works experts helpedto set up management processes and develop a plan for debris removal; theyalso set up and conducted dredging operations to allow barges to access thesite. Dredging 75,000 cubic yards in just nine days, this solution eliminatedthe need for trucks to traverse the 20-mile land route from the site to thelandfill. With each barge carrying 30 truckloads of debris, it also greatlyreduced traffic and road wear.
Besides the ongoing World Trade Center response activities, there werenumerous flood events throughout the United States involving nearly everyCorps District throughout the year. Emergency Management Personnelresponded to 10 Presidential Disaster Declarations at the request of the FederalEmergency Management Agency and to other flood events under Public Law84-99, Flood Control and Coastal Emergencies. The response to TyphoonChaatan in the Federated States of Micronesia, Guam, and the Island of Chuk

in the Commonwealth of Northern Mariana Islands and the risk of imminentfailure of the Rapidan Dam on the Blue Earth River upstream of the City ofMankato, MN, are examples of the diverse emergency events responded to byEmergency Management personnel. The response to Typhoon Chaatan, at therequest of FEMA, included providing emergency power, debris removal andemergency water supply. The Rapidan Dam response was initiated underPublic Law 84-99 and involved providing emergency repairs to stabilize thedam.
In FY 2002, this program received new budget authority of $6 million thataccounted for less than 1 percent of the Civil Works new budget authority. Theprogram is actually larger than indicated by the new budgetary view. The $6million is augmented by reimbursable work performed for FEMA and byprior-year disaster recovery appropriations carried over into FY 2002.
HydropowerSome of the Civil Works projects built for navigation and flood control havethe additional benefit of providing hydroelectric power. This is in keepingwith Civil Works policy and with the Congressional direction to maximizepublic benefits in all projects for all desirable purposes, including powergeneration. The Civil Works Program operates and maintains 75 power plants,mostly in the Pacific Northwest, generating about 24 percent of America'shydroelectric power. The program is the country's largest producer ofhydroelectricity. Hydropower is a low-cost, renewable power source thatproduces none of the airborne emissions that contribute to acid rain or thegreenhouse effect, leading many to view it as the least environmentallydisruptive source of electric power.
In FY 2002, this $193 million program accounted for 4 percent of the CivilWorks budget. In FY 2002 the Federal Power Marketing Agencies returned$700 million to the U.S. Treasury from power sales.
Water SupplyCivil Works has 167 projects with municipal and industrial water supply as anauthorized purpose. It supplies water to 10 million people in 115 cities,including some of America's largest metropolitan areas, such as Washington,D.C., Atlanta, and Dallas-Fort Worth. In arid parts of the country there are 62projects that have irrigation as an authorized purpose. Many of these projects
fy02Civil Works Fund
93
“Im
agin
atio
n •
Inno
vatio
n •
Initi
ativ
e”
94
FY02
Uni
ted
Sta
tes
Arm
y A
nnua
l Fin
anci
al S
tate
men
t
serve flood control, navigation, and hydroelectric purposes as well as irrigation.
In FY 2002, this $15 million business program accounted for less than 1percent of the Civil Works budget.
RecreationThe Civil Works Recreation Program is an important provider of outdoorrecreation opportunities. The program operates more than 44,000 recreationsites at 456 projects, mostly lakes, hosting more than 396 million visits a yearat its facilities. One in 10 Americans visit a Civil Works recreation site at leastonce a year. These projects have significant economic impact supporting500,000 jobs and generating $15 billion in visitor spending annually. Inaddition, there are approximately 500 concessionaires on Civil Worksrecreation sites, representing more than a billion dollars in fixed assets. Corpslands are also leased to nearly 600 state parks, 600 local government parks,and 420 boy or girl scout camps, church camps, boating clubs, and other suchorganizations that are open to public membership and that have defined goalsthat are consistent with the Corps' public recreation stewardshipresponsibilities.
In FY 2002, this $287 million business program accounted for 6 percent of theCivil Works budget.
Organizational StructureThe WorkforceCivil Works employs more than 25,000 people. Funded through the Energyand Water Development Appropriation, it executes programs through eightregional divisions and 38 of the 41 districts of the Corps of Engineers. Figure 17 shows the division boundaries. Rather than being demarcated bystate boundaries, these are defined by watersheds and drainage basins,reflecting the water-oriented nature of the Civil Works Program.

Figure 17. Civil Works Boundaries
The distribution of Civil Works employees similarly highlights the customerfocus of the program: 95 percent of the employees work at the district level,reflecting the fact that project management is performed at the district level.
The Civil Works mission contracts out to civilian companies all of itsconstruction and most of its design work. While Civil Works employs only25,000 people, as many as 150,000 people thus are employed indirectly insupport of its projects. The close working relationships established with theseprivate firms have served the nation well in times of emergency.
The LeadershipOversight of Civil Works is provided through four levels of authority. TheAssistant Secretary of the Army for Civil Works (ASA (CW)) is appointed bythe President and establishes Civil Works policy. The Chief of Engineersreports to the ASA (CW) for Civil Works mission accomplishment and in turndelegates most of his responsibilities for managing the various programs to theDirector of Civil Works. The Chief of Engineers, through the Director of CivilWorks, is responsible for the leadership and management of the program andfor ensuring that policies established by the ASA (CW) are applied to allphases of project development.
Legend:Div./Regional HQ locationDistrict HQ locationDivision boundaryDistrict boundaryState boundary
Galveston NewOrleans
Jacksonville
SavannahCharleston
Wilmington
Norfolk
PhiladelphiaNew York
Buffalo
Tulsa
Ft. Worth Mobile
Detroit
Baltimore
PittsburghChicago
Memphis
NashvilleLouisville
Atlanta
Dallas
Alaska
SanFrancisco
LosAngeles
Honolulu
Pacific Ocean
Portland
Seattle
WallaWalla
Omaha
Albuquerque
South Pacific
Northwestern
Southwestern
MississippiValley
SouthAtlantic
NorthAtlantic
Great Lakes& Ohio River
Sacramento
Kansas City
KeyFollows Watershed Boundaries
LittleRock
NewEngland
RockIsland
St.Paul
HungtingtonCincinnati
fy02Civil Works Fund
95
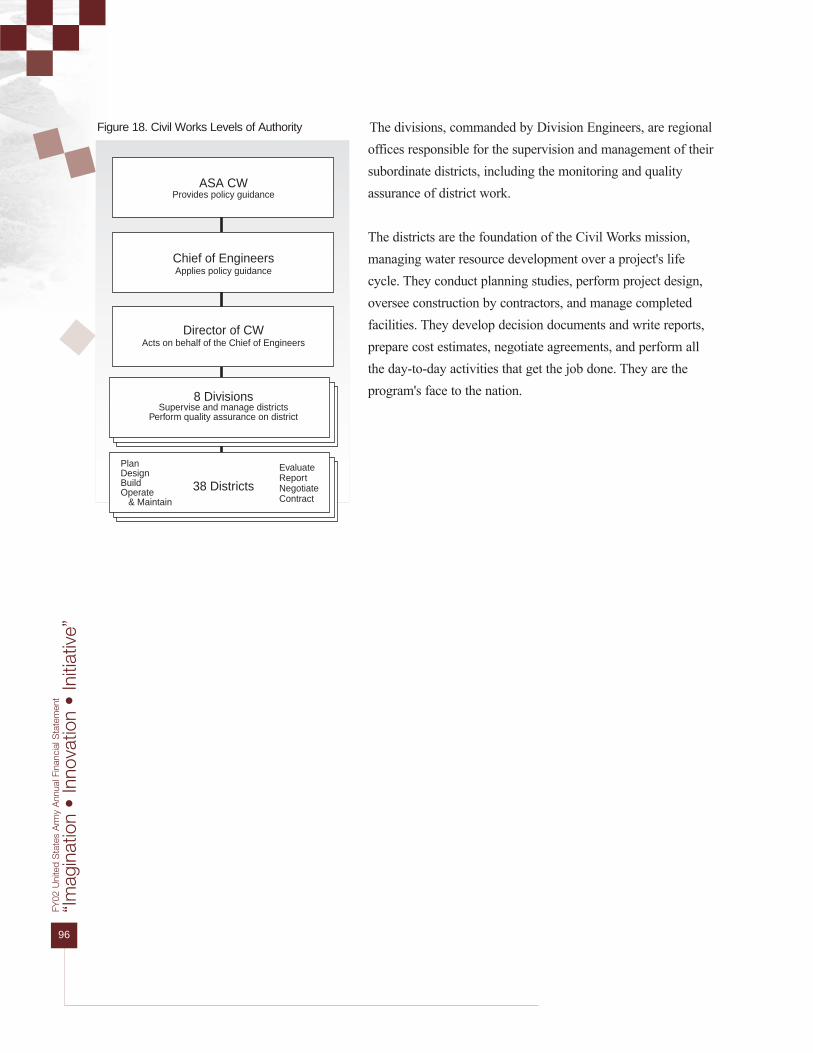
“Im
agin
atio
n •
Inno
vatio
n •
Initi
ativ
e”
96
FY02
Uni
ted
Sta
tes
Arm
y A
nnua
l Fin
anci
al S
tate
men
t
The divisions, commanded by Division Engineers, are regionaloffices responsible for the supervision and management of theirsubordinate districts, including the monitoring and qualityassurance of district work.
The districts are the foundation of the Civil Works mission,managing water resource development over a project's lifecycle. They conduct planning studies, perform project design,oversee construction by contractors, and manage completedfacilities. They develop decision documents and write reports,prepare cost estimates, negotiate agreements, and perform allthe day-to-day activities that get the job done. They are theprogram's face to the nation.
ASA CWProvides policy guidance
Chief of EngineersApplies policy guidance
38 Districts
8 DivisionsSupervise and manage districts
Perform quality assurance on district
Director of CWActs on behalf of the Chief of Engineers
PlanDesignBuildOperate & Maintain
EvaluateReportNegotiateContract
Figure 18. Civil Works Levels of Authority

Civil Works — Performance ResultsCivil Works directly impacts America's prosperity, competitiveness, quality oflife, and environmental stability. Civil Works leaders accordingly havedeveloped a draft strategic plan to identify and answer the nation's waterresources needs. Research findings and input from the public, gained throughpublic listening sessions, have led us to identify the following five issues asthe main national water resource challenges facing the nation:
Balancing demands for water resource development in terms of access toand use of those resources and of the preservation of environmental quality
Repairing damage to our environment from past development
Addressing the performance and safety implications of an aging waterresources infrastructure
Ensuring the capability to respond to natural disasters
Minimizing the impact of institutional inhibitors on water resourcesdecision-making and management
To address these challenges, we have developed the following five strategicgoals. Specific objectives associated with each goal enable the measurementof our annual performance toward achievement of the strategic goal:
Provide sustainable water resources development and integratedmanagement of the nation's water resources
Repair past environmental degradation and prevent future environmentallosses
Ensure that projects perform in a manner that meets authorized purposesand evolving conditions
Reduce vulnerabilities and losses to the nation and the Army from naturaland man-made disasters, including terrorism
Be a world-class public engineering organization
fy02Civil Works Fund
97
Civil Works directlyimpacts America's
prosperity,competitiveness,
quality of life,and environmental
stability.

“Im
agin
atio
n •
Inno
vatio
n •
Initi
ativ
e”
98
FY02
Uni
ted
Sta
tes
Arm
y A
nnua
l Fin
anci
al S
tate
men
t
Strategic Goals Strategic Goal 1: Provide Sustainable Development andIntegrated Management of the Nation's Water ResourcesThrough anticipating, identifying, and addressing water resourcesinfrastructure problems and needs the Army Corps of Engineers Civil Worksmission is able to enhance the nation's economic well-being. By maintainingcoastal harbors and intercoastal waterways, Civil Works strengthens America'sability to export its products to the world and to move those products aroundthe nation. To continue to manage our water resources effectively and to maintainwaterway infrastructure, the Civil Works mission applies a consistent programinvestment objective to the development and management of water resourcesinfrastructure. At the core of this objective are two guiding principles:
Invest in the navigation program infrastructure when project benefitsexceed their costs.
Invest in the flood and coastal storm damage reduction programinfrastructure when project benefits exceed their costs.
Performance Measure 1: For investments in navigation projects, the benefit-to-cost ratio at the completion of project construction should at least equal thebenefit-to-cost ratio at the time of initial project funding. The performancetarget for FY 2002 was to achieve a benefit-to-cost ratio at completion within10 percent of the initial benefit-to-cost ratio.
Performance Result 1: In FY 2002, two navigation construction projectswere completed. Both of the projects were completed with a benefit-to-costratio exceeding the benefit-to-cost estimate used to justify initial projectconstruction funding.
Performance Measure 2: For investments in flood and coastal storm damagereduction projects, the benefit-to-cost ratio at the completion of projectconstruction should at least equal the estimated benefit-to-cost ratio at the timeof initial project funding.
Performance Result 2: In FY 2002, seven flood damage reduction projectswere completed. Five of the seven projects were completed with a benefit-to-cost ratio that exceeded the estimate used to justify the initial project
Civil Works’ missionis able to enhancethe nation'seconomic well-being.

construction funding. A sixth project was completed within 10 percent of theestimate used to justify initial project construction funding. The seventhproject was completed with a benefit-to-cost ratio that fell short of theperformance target; the ratio achieved nonetheless was positive, therebyvalidating the initial investment.
Strategic Goal 2: Repair Past Environmental Degradation andPrevent Future Environmental LossesTo accomplish the second strategic goal Civil Works must anticipate, identify,and address the nation's needs for the environmental restoration andenhancement of its water resources. Civil Works will work with its partners,including other Federal and state agencies, nongovernmental organizations,and Native American tribes, to develop creative solutions that are botheffective and efficient, employing, where appropriate, leading-edgetechnologies and methodologies.
Civil Works is pursuing the restoration of environmental damages and lossesthat resulted from past actions where it did not anticipate adequately or takeinto account the environmental consequences of those actions. It plans toexercise its authority to the fullest extent in support of the ecosystemrestoration portion of the Civil Works Program. In addition, it will support thenational commitment to wetlands embodied in the Clean Water Action Plan,by adding to the nation's environmental resource base through restoration andenhancement projects. It is working to ensure that there is no further net lossof wetlands due to unwise development activity.
In addition, the Corps of Engineers has been given responsibility to execute anenvironmental clean-up program of contaminated sites under the FormerlyUtilized Sites Remedial Action Program (FUSRAP). Accomplishment of theclean-up program will result in the elimination of potential risks to health andthe environment at these high-priority sites.
Success in pursuit of this strategic goal is demonstrated through theperformance measures that have been developed for the Environmental andRegulatory business programs.
EnvironmentalThe Environmental business program emphasizes environmental stewardship,ecosystem restoration, mitigation, environmental compliance, and research
fy02Civil Works Fund
99
Civil Works mustanticipate, identify,
and address thenation's needs for the
environmentalrestoration and
enhancement of itswater resources.

“Im
agin
atio
n •
Inno
vatio
n •
Initi
ativ
e”
100
FY02
Uni
ted
Sta
tes
Arm
y A
nnua
l Fin
anci
al S
tate
men
t
and development. The work undertaken by this program takes many forms,reflecting the growing national demand for restoration and protection.
There are three program objectives in support of the strategic goals of theCivil Works Environmental Program. These are as follows:
Invest in mitigation and restoration projects or features to make a positivecontribution to the nation's environmental resources.
Invest in mitigation and restoration projects and in the operation ofprogram facilities to assist in the recovery of federally listed threatened andendangered species.
Ensure that the operation of all Civil Works facilities and management ofassociated lands, including out-granted areas, complies with theenvironmental requirements of the relevant Federal, state, and local lawsand regulations.
Performance Measure 1: The percentage of Civil Works EnvironmentalProgram-administered mitigation land meeting the requirements of theauthorizing legislation or of the relevant Corps of Engineers decisiondocument. The target for FY 2002 was to meet requirements for 80 percent ofmitigation lands. This measure is calculated as a percentage of all designatedprogram-administered mitigation land that meets mitigation requirements.
Performance Result 1: During FY 2002, Civil Works administered 713,909mitigation acres, representing a slight increase of less than 0.5 percent over theacreage administered in FY 2001 that is statistically insignificant. Thismeasure applies only to project lands that remain in Corps of Engineersownership; it therefore reflects retained stewardship responsibility. CivilWorks is achieving mitigation requirements on 79 percent of lands designatedfor mitigation, falling just short of the performance target of 80 percent. The80 percent target was based on the experience gained with baselinemeasurement and in linking performance levels to resourcing levels. For FY2003, the performance target is being raised to 85 percent as a stretch goal. Itis a stretch goal because of the level of funding proposed for FY 2003 relativeto FY 2001 and 2002 appropriated funds.

Table 47. Civil Works-Administered Mitigation Land
Performance Measure 2: The percentage in which Civil Works Stewardshipshould be engaged in opportunities to participate in Recovery Plan efforts forfederally listed species. The performance target was raised in FY 2002 to notless than 95 percent, based upon experience gained with baseline performancemeasurement and the level of funding appropriated between FY 2001 and FY2002.
Performance Result 2: The performance target was exceeded. During FY2002, the Corps participated in recovery programs for 80 federally listedspecies, engaging in 496 separate opportunities to benefit these species or theirhabitat. A total of 288 Corps projects were involved.
Table 48. Recovery Plan Projects
Performance Measure 3: To correct 100 percent of all significant findingsand 70 percent of all major findings annually. A significant finding is adetermination that we are not meeting an environmental requirement and thatthe concern poses, or has a high likelihood of posing, a direct and immediatethreat to human health, safety, the environment, or the Civil Works mission.The success rate of correcting significant and major findings is calculatedannually.
FY 2000 FY 2001 FY 2002
Number of opportunities to participate in recovery of federally listed species 503 505 509
Number of opportunities taken 470 491 496
Percentage of opportunities taken to assist in the recovery of federally listed species 93% 97% 97%
FY 2000 FY 2001 FY 2002
Total acreage designated as Civil Works-administered mitigation land 712,933 713,374 713,909
Mitigation land for which requirements were met (acres) 552,441 554,880 564,025
Percentage of Civil Works-administered mitigation lands for which mitigation requirements were met 77% 78% 79%
fy02Civil Works Fund
101

“Im
agin
atio
n •
Inno
vatio
n •
Initi
ativ
e”
102
FY02
Uni
ted
Sta
tes
Arm
y A
nnua
l Fin
anci
al S
tate
men
t
Performance Result 3: During FY 2002, we corrected 7 of 10, or 70 percent,of the significant findings, and 57 percent of major findings. The threeremaining significant findings have been corrected partially to eliminate theimmediate threat to the environment. The Corps anticipates total correction ofthe three open significant finding in FY 2003 subject to funding availability.The correction rate for major findings was lower than in the prior fiscal year.The actual number of major findings increased because several large-scaleCorps facilities were inspected during FY 2002. The Corps continues to placea high priority on achieving both performance goals in FY 2003.
Table 49. Correction of Significant and Major Environmental Findings
RegulatoryCivil Works operates a comprehensive regulatory program to protect theaquatic environment, primarily, but also the navigability of waterways fromoverdevelopment. Management of this program has a related objective ofminimizing the time taken to process decisions on requests for permits to workin the waters of the United States. The following program objectives have beenestablished to support the pursuit of the strategic goals of the Civil Worksmission:
Administer the regulatory program in a manner that protects the aquaticenvironment.
Administer the regulatory program in a manner that renders fair andreasonable decisions for applicants.
Administer the regulatory program in a manner that enables efficientdecision-making.
Performance Measure 1: Administer the regulatory program in a manner thatprotects the aquatic environment. The performance target of Civil Works is torealize no net loss of wetlands.
Performance Result 1: The performance target was met. During FY 2002,57,821 acres of wetlands were restored, created, enhanced, or preserved,offsetting the 24,651 acres that were lost to permitted development.
FY 2000 FY 2001 FY 2002
Number of significant findings 5 3 10
Percentage corrected 80% 67% 70%
Number of major findings 555 400 502
Percentage corrected 70% 62% 57%
Civil Works operatesa comprehensiveregulatory programto protect thenavigability ofwaterways and theaquatic environment.

Table 50. Development and Mitigation of Wetlands
Performance Measure 2: The number of all permit decisions completedwithin 60 days, expressed as a percentage of all permit decisions. The target isto complete 85 to 95 percent of all actions within 60 days.
Performance Result 2: During FY 2002, 71,652 permit actions, or 88 percentof all permit actions, were completed in 60 days or less. While this figureexceeds the performance target of 85 percent, it remains unchanged from lastyear's performance and is below that of FY 2000, when 90 percent of allpermit actions were completed in 60 days. The districts are concentrating ongetting the Nationwide and General Permits authorized; this has helped tostabilize overall processing times but is the cause of the downward trend inenforcement and compliance efforts seen since FY 2000.
Table 51. Permit Actions Completed within 60 Days
Performance Measure 3: The number of standard permit decisionscompleted within 120 days, expressed as a percentage of all standard permitdecisions. Standard permits are those for larger projects that require extensivereview. The performance target is to complete 70 to 80 percent of decisions onstandard permits within 120 days.
Performance Result 3: The performance target was not met. During FY2002, 61 percent of all standard permit actions were completed in less than120 days. Performance has remained relatively steady over the last three yearsat between 60 percent and 62 percent. The districts are contending with permitapplications that are significantly more complex than in past years and thatinvolve lengthy analysis of their potential environmental impacts. Issuesrelated to endangered species, historic properties, water quality, and coastal
FY 2000 FY 2001 FY 2002
Number of permit actions completed within 60 days 80,035 73,415 71,652
Percentage of actions completed within 60 days 90% 88% 88%
FY 2000 FY 2001 FY 2002
Wetland acres permitted for development 18,900 24,073 24,651
Wetland acres mitigated 44,757 43,832 57,821
fy02Civil Works Fund
103

“Im
agin
atio
n •
Inno
vatio
n •
Initi
ativ
e”
104
FY02
Uni
ted
Sta
tes
Arm
y A
nnua
l Fin
anci
al S
tate
men
t
resources also are adding to permit delays. Furthermore, the general publicand the environmental community are becoming much more aware of andinvolved with the permit process, leading to increased numbers of commentsraised in response to every Public Notice and to a rising trend in legalchallenges.
Table 52. Standard Permit Actions Completed within 120 Days
Strategic Goal 3: Ensure that Projects Perform in a Manner toMeet Authorized Purposes and Evolving Conditions Civil Works customers, partners, and stakeholders expect delivery of the levelof service that is designed into a project, and expect that high quality ofservice to continue even with changing demands on the project. This thirdstrategic goal was developed to ensure that the Civil Works Program continuesto meet or exceed customer expectations. This requires particular attention tothe quality and performance of our projects, early recognition and analysis ofproblems, and identification of cost-effective ways to prevent, lessen, orcorrect any deficiencies.
In addition, Civil Works recognizes that it must continue to provide facilitiesthat meet the needs of diverse and changing user groups. For projects todeliver the requisite performance and service levels, they must serve the needsof their users. Projects typically are designed to accomplish a particularpurpose for a specified life span. In order that they continue to meet thechanging needs of users, they may have to undergo design changes or mayneed even to be rehabilitated or reconstructed in order to modernize theirfunctions.
The performances of the Navigation, Flood and Coastal Storm DamagePrevention, Hydropower, Recreation, and Water Supply business programsreflect the overall success of the Civil Works Program in achieving thisstrategic goal. The performance of each business program is outlined in thefollowing sections.
FY 2000 FY 2001 FY 2002
Number of standard permit actions completed within 120 days 2,521 2,600 2,536
Percentage of actions completed within 120 days 62% 60% 61%
The Civil WorksProgram goal is tomeet or exceedcustomerexpectations.

NavigationThe responsibilities of the Navigation program include the improvement andmaintenance of port and harbor channels and of the inland waterways thathandle the nation's maritime commerce. The objective of the program is tooperate and manage the navigation infrastructure as to maintain consistent,acceptable levels of service. One performance measure and two performanceindicators are used to gauge the successful pursuit of this objective. These areas follows:
The availability to commercial traffic of high use of navigationinfrastructure (waterways, harbors, and channels).
The volume of commerce and the operational cost of the fuel-taxedwaterways component of the navigation system.
The maintenance, through dredging, of safe and reliable harbors andchannels.
Performance Measure: Percentage of time program facilities are open tocommercial traffic. The performance target is 90 percent availability.
Performance Result: During FY 2001, the availability of inland navigationalinfrastructure decreased slightly by 2.5 percent to 93.5 percent. Theavailability of the nations navigational infrastructure continues to exceed therequired availability of 90 percent.
Table 53. Availability of Navigational Infrastructure
1Data not available at time of printing.
Performance Indicator 1: Monitor the volume of commerce and theoperational cost of the fuel-taxed waterways component of the navigationsystem.
Performance Result 1: Data for calendar years 2000 and 2001 were notavailable at the time of printing.
Performance Achieved FY 2000 FY 2001 FY 20021
Actual availability 96.0% 93.5% N/A
fy02Civil Works Fund
105

“Im
agin
atio
n •
Inno
vatio
n •
Initi
ativ
e”
106
FY02
Uni
ted
Sta
tes
Arm
y A
nnua
l Fin
anci
al S
tate
men
t
Table 54. Volume of Commerce and Operational Cost
1 Ton-mile data are reported on a calendar basis. Costs are on a fiscal year basis.2 Data was not available at time of printing.
Performance Indicator 2: The need for dredging of harbors and channels isdependent largely upon acts of nature and factors beyond the control of man.Therefore, no performance target for the volume of material to be dredged hasbeen established. The depth of material to be dredged and the disposal ofdredged material are the two main factors influencing the cost of dredging.
Performance Result 2: Based upon preliminary information, 218 millioncubic yards of dredged material were removed for maintenance dredgingduring FY 2001 at a cost of $ 2.56 per cubic yard.
Table 55. Volume and Cost of Material Dredged
1Data not available at time of printing.
Flood and Coastal Storm Damage ReductionThere are two ways to reduce flood damage. The first calls for the use of
large-scale engineering projects to prevent floodwaters frominundating property, and the second for the modification ofproperty susceptible to flooding, to minimize the risk ofdamage. Civil Works projects usually use a combination ofapproaches. The program objective is to operate and maintainexisting Federal infrastructure to ensure that designed levels ofprotection are realized. A single measure is used to gaugeperformance in this respect.
Performance Indicator: The performance of Civil Worksfacilities in reducing damage where flooding otherwise wouldhave been experienced.
FY 2000 FY 2001 FY 20021
Cubic yards removed (millions) 243 218 N/A
Cost per cubic yard $2.42 $2.56 N/A
FY 2000 FY 20012 FY 20022
Ton-miles of commerce carried (billions)1 276 N/A N/A
Cost per ton-mile $0.0018 N/A N/A
Arial view of the Dworshak Dam on the North Fork ofthe Clearwater River in northern Idaho.

Performance Result: During FY 2002, the Corps prevented $23.1 billion inflood damage (preliminary estimate). This can be compared to the 10-yearrolling average of $22.8 billion that is used to smooth out the significantfluctuations in year-to-year flood damage prevented that are associated withvariations in meteorological events.
Table 56. Flood Damages Prevented
1 Preliminary estimate.
HydropowerThe Civil Works Program operates 345 hydroelectric power-generating unitsat 75 multipurpose reservoirs, providing nearly a quarter of the nation's totalhydropower needs, enough energy to serve about ten million households.Hydropower units can start quickly and adjust rapidly allowing them to servea primary role in meeting peak energy demands and energy reserve needs toprotect the national power system's reliability and stability. The electricity isdistributed by Federal power marketing agencies. To ensure that the Corps ofEngineers continues to serve this role, it has established an overall programobjective.
Maintain reliable hydroelectric generation availability at Corpsmultipurpose reservoir projects.
Performance Measure: Maintain a high availability of hydroelectric powergenerated at multipurpose reservoir projects. Our goal is to keep the forced(unplanned) outage rate at less than 4.5 percent. The lower the forced outagerate, the more reliable and the less expensive is the electricity service weprovide to our customers.
Performance Result: Data by calendar year is provided in Table 57.
Table 57. Hydroelectric Power Availability
FY 2000 FY 2001 FY 2002
Performance Target (% outage) 4.5 4.5 4.5
Actual availability (% outage) 3.7 2.3 3.7
(Dollars in billions) FY 2000 FY 2001 FY 20021
Flood damage prevented $2.8 $21 $23.1
10-year rolling average $20.8 $21.3 $22.8
fy02Civil Works Fund
107

“Im
agin
atio
n •
Inno
vatio
n •
Initi
ativ
e”
108
FY02
Uni
ted
Sta
tes
Arm
y A
nnua
l Fin
anci
al S
tate
men
t
Value to the Nation Performance Indicators: In addition to measuringsystem reliability, we also track operation system indicators that providevaluable information and trends on system performance. The followingindicators are monitored: (1) kilowatt-hours generated to measure total powergeneration and (2) cost per kilowatt-hour to measure generating efficiency.Annual goals are not set for these indicators because power production isdependent largely upon hydrologic conditions that cannot be managed.
Performance Result: During FY 2002, the Civil Works Program generated68.1 billion kilowatt-hours, representing an increase of 17 percent from FY2001 (within normal annual variations).
Table 58. Kilowatt Hours Generated
RecreationMost Federal lakes were built with a single primary purpose, and benefitedmainly the local population. Public needs and values have changed, however,Civil Works has sought to serve the evolving public interest by adaptingreservoirs for multiple uses, provided there is sufficient legislative authority todo so. To support the broader strategic goals of the Civil Works Program andto achieve maximum cost effectiveness in the provision of outdoor recreationservices, we have established the following program objectives:
Provide outdoor recreation opportunities in an effective and efficientmanner at Civil Works-operated water resource projects
Provide outdoor recreation opportunities to meet the needs of present andfuture generations
Performance Indicator: Cost per visitor-day of providing outdoor recreationfacilities. The cost per visitor-day is determined by a number of variables.While Civil Works is able to manage the cost of providing recreation facilities,the number of visitors who use these facilities is governed in large part byexternal factors, such as the weather and prevailing economic conditions.Therefore, historically, no management performance target has been specified.
FY 2000 FY 2001 FY 2002
Kilowatt-hours generated (billions) 74.1 57.9 68.1
Cost per kilowatt-hour $0.0030 $0.0038 $0.0034
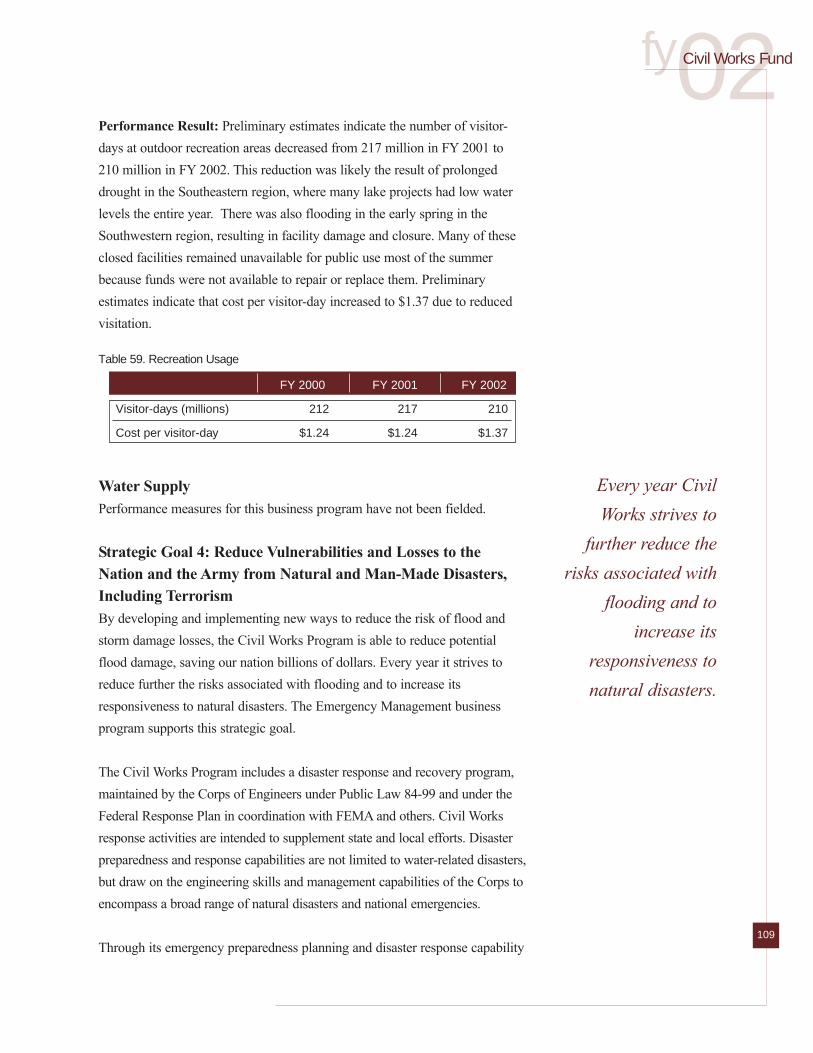
Performance Result: Preliminary estimates indicate the number of visitor-days at outdoor recreation areas decreased from 217 million in FY 2001 to210 million in FY 2002. This reduction was likely the result of prolongeddrought in the Southeastern region, where many lake projects had low waterlevels the entire year. There was also flooding in the early spring in theSouthwestern region, resulting in facility damage and closure. Many of theseclosed facilities remained unavailable for public use most of the summerbecause funds were not available to repair or replace them. Preliminaryestimates indicate that cost per visitor-day increased to $1.37 due to reducedvisitation.
Table 59. Recreation Usage
Water SupplyPerformance measures for this business program have not been fielded.
Strategic Goal 4: Reduce Vulnerabilities and Losses to theNation and the Army from Natural and Man-Made Disasters,Including TerrorismBy developing and implementing new ways to reduce the risk of flood andstorm damage losses, the Civil Works Program is able to reduce potentialflood damage, saving our nation billions of dollars. Every year it strives toreduce further the risks associated with flooding and to increase itsresponsiveness to natural disasters. The Emergency Management businessprogram supports this strategic goal.
The Civil Works Program includes a disaster response and recovery program,maintained by the Corps of Engineers under Public Law 84-99 and under theFederal Response Plan in coordination with FEMA and others. Civil Worksresponse activities are intended to supplement state and local efforts. Disasterpreparedness and response capabilities are not limited to water-related disasters,but draw on the engineering skills and management capabilities of the Corps toencompass a broad range of natural disasters and national emergencies.
Through its emergency preparedness planning and disaster response capability
FY 2000 FY 2001 FY 2002
Visitor-days (millions) 212 217 210
Cost per visitor-day $1.24 $1.24 $1.37
fy02Civil Works Fund
109
Every year CivilWorks strives to
further reduce therisks associated with
flooding and toincrease its
responsiveness tonatural disasters.

“Im
agin
atio
n •
Inno
vatio
n •
Initi
ativ
e”
110
FY02
Uni
ted
Sta
tes
Arm
y A
nnua
l Fin
anci
al S
tate
men
t
Civil Works can make a significant and direct contribution to national securityobjectives. Four program strategies support this fourth strategic goal. They areas follows:
Attain and maintain a high and consistent state of preparedness
Provide a rapid, effective, and efficient all-hazards response capability,prepared for deployment anywhere worldwide
Provide the leadership to ensure effective and efficient long-term crisisrecovery, emphasizing recovery of the nation's water resourcesinfrastructure
Provide professional emergency management program services tointernational customers
Strategic Goal 5: Be a World-Class Public EngineeringOrganizationA priority of the Corps of Engineers is to maintain a leading-edge technicalcapability today and into the future. Ensuring the delivery of high-quality andresponsive engineering services to America and others requires a solidfoundation in a core set of technical skills. To that end, and in anticipation offuture requirements, Civil Works has begun to identify the range of expertisewithin the Corps; it has begun also to identify those critical functions wherereserves of talent may be depleted through retirement and attrition. CivilWorks maintains the world-class capabilities inherent in its laboratoriesthrough capital investment, and it is engaging in research and development toimprove operational processes in order to better address the nation's waterresource problems and opportunities.
Civil Works will leverage core technical capabilities as appropriate byproviding engineering-related services to the Department of Defense agencies,other federal agencies, and to other authorized entities through the Support forOthers business program. Overseas, it helps countries enhance their publicsector capacities, especially in the management of water to assist economicdevelopment and protect their environments and ecosystems. By assistinglegitimate authorities to improve their infrastructure and environments and toease conditions that potentially can lead to conflict, Civil Works serves topromote democracy, peace, and stability.

To be a world-class technical leader, it is imperative to seek continuousimprovement in the processes used to meet the customer, partner, andstakeholder needs. The feedback provided by customers and project sponsorsis the best indication of how effective Civil Works is in meeting theexpectations for the quality, timeliness, and cost-effectiveness of its services.Civil Works will continue to seek that feedback in order to strengthen overallperformance and to raise customers' satisfaction.
fy02Civil Works Fund
111

“Im
agin
atio
n •
Inno
vatio
n •
Initi
ativ
e”
112
FY02
Uni
ted
Sta
tes
Arm
y A
nnua
l Fin
anci
al S
tate
men
t
Analysis of Financial StatementsFiscal year (FY) 2002 witnessed another year of progress for the United StatesArmy Corps of Engineers (USACE) Civil Works Fund, as the Corpscontinued to improve upon the myriad processes linked to producing auditablefinancial statements in compliance with the Chief Financial Officers Act of1990. Within the Department of Defense, the USACE Civil Works Fund hasbeen at the forefront in implementing Federal financial management reform.
The financial statements were compiled in accordance with guidance issuedby the Office of Management and Budget and supplementary guidanceprovided by DoD. The DoD Office of the Inspector General audited the FY2002 Consolidated Balance Sheet. The Civil Works Fund received adisclaimer of opinion on the Balance Sheet, Statement of Net Cost, Statementof Changes in Net Position, Statement of Budgetary Resources, and Statementof Financing. In his letter to the Chief Financial Officer, the DoD InspectorGeneral made recommendations for improving internal controls andpromoting operating efficiencies. USACE management has initiated actions toimplement these recommendations.
The financial statements for the Civil Works Fund are presented in acomparative format, providing financial information for FY 2001 and FY2002. While comparative statements are not required until the agencyreceives an unqualified audit opinion on its financial statements, we opted forearly implementation of the requirement as is encouraged by the Office ofManagement and Budget.
Below are the financial highlights of each statement. These highlights focuson significant balances or conditions to help clarify the Civil Works Fund'soperations. Additional explanatory information may be found also in thenotes that accompany these statements.
Balance SheetThis statement presents the assets, liabilities, and net position of the CivilWorks Fund as of September 30, 2001 and 2002. Civil Works assetsamounted to $43.2 billion at FY 2002 year-end, nearly a 5 percent increaseover the previous year. Of the total assets, 85 percent of the dollar valueresides in the property, plant, and equipment accounts. Relative to its total

assets, the Civil Works liabilities are quite low and amounted to$2.4 billion. The liabilities are related primarily to $882 million innon-current liabilities, $680 million in accounts payable, and $388million in accrued payroll. The $882 million in non-currentliabilities is part of $895.6 that was reclassified from deferredcredits to other liabilities for long-term water storage contracts inaccordance with DoD regulations.
The third major component of the balance sheet is net position. Inaggregate, the various elements of the net position section on thebalance sheet also are referred to as "equity." Equity is theresidual interest in the assets of the entity that remains afterdeducting its liabilities. For FY 2002, the Civil Works Fund netposition amounted to $40.8 billion, representing almost a $2billion, or 5 percent, increase over FY 2001.
Statement of Net CostThis statement presents the annual cost of operating the various Civil Worksprograms. To the extent a program generates revenues, these amounts offsetgross costs to arrive at the net cost of operations. For FY 2002, program costsamounted to $4.4 billion, representing a 9 percent reduction from the previousyear. Conversely, program revenues increased 26 percent from FY 2001,climbing to $738 million. Overall for FY 2002, the Civil Works Fundachieved a 14 percent decrease in the net cost of operations, reducing net coststo $3.7 billion — a $595 million reduction from the previous year.
Statement of Changes in Net PositionThis statement presents those accounting items that caused the net positionsection of the balance sheet to change from the beginning to the end of thereporting period. The Civil Works Fund enjoyed a positive $2.1 billion netresult of operations. Contributing to this positive result was the $595 millionreduction in costs noted above. The Net Position at year-end was $39.7billion, nearly a 6 percent increase from the previous year.
Statement of Budgetary ResourcesThis statement provides information on the Civil Works Fund's budgetaryfinancing accounts and the status or remaining balances of those accounts atyear-end. This includes information on obligation and outlays or actual cashdisbursements for the year.
fy02Civil Works Fund
113
Total Net PositionTotal Liabilities
Total Assets
FY 2001 FY 20020
30000000
60000000
90000000
$ in thousands
$38,819,130$40,759,956
$2,372,408 $2,442,153
$43,202,109$41,191,538

“Im
agin
atio
n •
Inno
vatio
n •
Initi
ativ
e”
114
FY02
Uni
ted
Sta
tes
Arm
y A
nnua
l Fin
anci
al S
tate
men
t
Total budgetary resources increased by nearly 3 percent for FY 2002 to $11.9billion. This increase was due primarily to a $351 million, or 9 percent,increase in appropriations received. The Civil Works Fund incurred $10.2billion in obligations during the year. Net outlays, actual cash disbursementsless any collections or offsetting receipts, amounted to $4.5 billion for theyear.
Statement of FinancingThis is a reconciling statement that tracks the relationship between theproprietary accounts and the budgetary accounts of the Civil Works Fund.The Statement of Financing provides data on the total resources provided tothe Civil Works Fund during the fiscal year and how those resources wereused.
The first section of the statement, Resources Used to Finance Activities,shows a total of $4.7 billion. This is the amount for which the Civil WorksFund may have a future liability that eventually would require cash payments. The second section, Resources Used to Finance Items Not Part of the NetCosts of Operations, identifies and adjusts budgetary transactions recorded bythe Civil Works Fund for changes in the amount of goods, services andbenefits ordered but not received, the costs capitalized on the balance sheet,and financing sources that fund costs of prior periods. For FY 2002, the fundhad a negative $1.5 billion in adjustments.
The first two sections are netted together to yield the total resources used tofinance the net cost of operations. For FY 2002, total resources usedincreased 3 percent over the previous year and amounted to approximately$3.2 billion.
Finally, the third section, Components of the Net Cost of Operations that willnot Require or Generate Resources in the Current Period, is used to adjust thetotal resources used to finance the net cost of operations (the net amount of thefirst and second sections) in order to determine the net cost of operations.Thus, sections one and two are reconciled with section three to yield a net costof operations of $3.7 billion. This amount ties back to the Statement of NetCost.

Management IntegrityThe Civil Works Program has instituted the use of controls to assure theintegrity of its management systems. Two areas in which Civil Works leaderscontinue to seek greater assurance of management integrity are:
Computer System ControlsIn October 2000, the General Accounting Office identified a number ofsystems control weaknesses at the data processing centers. These weaknessescould allow either hackers or authorized users to modify, disclose, or destroyfinancial data improperly. Corrective actions to support the assurance of datasecurity, including the reorganization of the Corps of Engineers and fundingincreases, have been taken to correct these deficiencies. The corrections arepending validation by the DoD Inspector General before this weakness can becleared.
Information Technology Capital Planning andInvestment Decision ProcessThe Clinger-Cohen Act of 1996 requires the institutionalization of aninformation technology (IT) capital planning and investment process. Thisprocess should integrate the methods for selecting, controlling, and evaluatingIT investments. The current process is fragmented, but the cornerstone policywas put into effect on August 1, 2002, to establish a more integrated ITinvestment management business process. During FY 2002, the Corps alsoincreased from 3 to 11 the number of its major IT business cases that arevisible to the Office of Management and Budget.
fy02Civil Works Fund
115

“Im
agin
atio
n •
Inno
vatio
n •
Initi
ativ
e”
116
FY02
Uni
ted
Sta
tes
Arm
y A
nnua
l Fin
anci
al S
tate
men
t
Future Effects of Existing ConditionsThe Marine Transportation SystemThe Marine Transportation System (MTS) consists of 1,000 harbor channels,25,000 miles of inland, intra-coastal, and coastal waterways, and 235 lockchambers. Work done to improve the inland waterways is estimated to yield$5.5 billion in cost savings per year, and improvements to the deep-draftnavigation system are estimated to save a further $1.5 billion in transportationcosts annually.
The MTS is nearing capacity, however, and demands on it will growsubstantially with the projected growth of international and domestic trade(trade is expected to double by 2020 to more than 4 billion tons of cargoannually). This will put great pressure on the system. It also should be notedthat few American ports provide the 50-55 feet of depth needed by the latestcontainerships. Many international ports, including Halifax and Vancouver inCanada and Freeport in the Bahamas, already can accommodate such ships,and it is essential that America match them. In preparing the necessary deep-draft channels, Civil Works over the past decade has dredged an average of275 million cubic yards of material per year. This work creates the additionalchallenge of how to dispose of the dredged material in an economically andenvironmentally acceptable manner.
Aging InfrastructureMore than 44 percent of America's locks and dams are at least 50 years oldand many locks are now too small to accommodate comfortably moderncommercial barges. They already are carrying more tonnage than they weredesigned to handle, and traffic is forecast to increase 30 percent by 2020.Delays attributable to aged locks already amount to 550,000 hours per annum,representing $385 million in increased operating costs. This is erodingAmerica's share of international markets— American farmers already havelost 30 percent of their share of the European market for soybeans to Braziland Argentina, both of which have invested heavily in inland waterways toreduce costs.
A lock modernization program has been underway since 1986, with $1.7billion invested to date and an additional $3.4 billion programmed forconstruction. This, however, is insufficient to support optimum construction

schedules, and completion dates for these projects have been set back bybetween one and five years, considerably increasing costs.
These increasing costs come at a time when investment in water resources isin sharp decline. In 1960, investments in all public infrastructure was 3.9percent of the Federal budget. Today, that figure is 2.6 percent. Furthermore,in 1960 water resources received 1.1 percent of all public infrastructureinvestment; today, they receive 0.2 percent. This failure to adequately invest inwater infrastructure could pose a serious constraint to America's economicdevelopment and competitive advantage in international trade.
Responding to Terrorist ThreatsThe events of September 11, 2001, changed the thinking about threatmanagement. Everything from drinking water sources to reservoirs and damsnow is viewed as a potential target for terrorists. Since the attacks on NewYork and Washington, D.C., Civil Works has maintained a heightened state ofalertness as we seek to protect the nation's critical infrastructure of watersupply, waterborne commerce, and electric power generation.
Ensuring the security of this infrastructure will require investment in warningand alert systems, in systems to detect and respond to chemical and biologicalagents, in intelligence gathering and counter-terrorism measures, and inemergency management systems. This requires investment in both technologyand people. It is essential to institute a program that will protectcomprehensively our water supply systems. Current estimates are that this willcost $267 million for immediate improvements in the first year and $65million annually thereafter.
fy02Civil Works Fund
117

“Im
agin
atio
n •
Inno
vatio
n •
Initi
ativ
e”
118
FY02
Uni
ted
Sta
tes
Arm
y A
nnua
l Fin
anci
al S
tate
men
t
Advancing the President's ManagementAgendaStrategic Management of Human Capital It is essential that Civil Works develop world-class technical expertise andmake the best possible use of its human resources. The Corps of Engineerslong has recognized the importance to its mission of its people, and as a resultthe Civil Works Program always, through training and sustaining itsworkforce, has sought to ensure that all mission-essential occupations arestaffed appropriately with skilled people.
Aligning the Workforce and MissionAll Civil Works employees must understand the mission of the program andmust understand how their work contributes to that mission. Each employee,as part of the larger Corps of Engineers, receives a CD-ROM called theCorpsPath. This provides an overview of the history, mission, and strategicgoals of the Corps and provides detailed information on Civil Works businessprocesses and on its strategy of knowledge management.
A Mission Essential Task List (METL) links the Civil Works mission toperformance measurement and enables identification of skill gaps in theworkforce. The Corps of Engineers is automating this process and isproducing a list of individual and organizational training requirements that,through training, will align the workforce and mission. One Engineer Divisionhas developed an Automated Training Management Program that is beingtested by two divisions to determine its feasibility for use as a corporatesystem.
The Civil Works Program has a customer focus and has allocated its personnelaccordingly. As the program is in contact with its customers primarily at theEngineer District level, 95 percent of the workforce is concentrated at district,field office and resident offices. As part of an effort to improve service to thepublic, 50 percent of supervisory positions have been eliminated since 1994 inan effort to flatten the organization and increase the percentage of employeesdirectly engaging the customer.
RecruitingThe Corps of Engineers has more than 600 college students enrolled invarious intern programs, representing an increase from 1989 to 2001 of 400

percent. The Corps recognizes the need to develop a source of skilled youngpeople to replace an aging workforce. By exposing college students to thework done by the Corps, it is believed that such a source can be developedand thus address anticipated shortages in the workforce as baby boomers reachretirement.
Training and LearningTo fill and also to limit the occurrence of future skill gaps, the Civil WorksProgram must be a learning organization. Technology and business practicesare evolving continuously; the Corps of Engineers therefore has decided toestablish a learning network addressing the three areas of technical excellence,business and communications, and leadership. This program will create avibrant knowledge management platform that will bring together discussion oflessons learned, best practices, and knowledge management with training; thatwill enable students to meet with subject matter experts; and that will enablethe development of communities of practice.
Competitive SourcingIn concordance with the President's Management Agenda, Civil Worksrecognizes that some of its employees likely are performing tasks that can beoutsourced readily to the commercial marketplace. Civil Works accordinglyhas a plan to study 5,700 positions for possible outsourcing between FY 2003and FY 2008. While this represents 37 percent of authorized Civil Workscommercial positions, it falls short of the President's goal of 50 percent. Thisshortfall is explained partially by the fact that 58 percent of the Civil Worksworkload already is accomplished by its industry partners.
A number of factors need to be considered when identifying the positions thatwill be opened up for competition. Realization of the full value of outsourcingrequires that there be a large number of positions for conversion, that they beof a notably commercial nature, and that they be geographically concentrated.In addition, there is a need to keep a minimum number of Federal positionsfor each staff function in order that oversight be retained in areas such asfinancial management, public affairs, and others.
The cost of these studies is not insignificant. As such, some studies have beenpostponed to the out-years to ensure that they can be funded properly and togain experience before conducting the more problematic studies. The plan andestimated costs are shown in Table 60.
fy02Civil Works Fund
119

“Im
agin
atio
n •
Inno
vatio
n •
Initi
ativ
e”
120
FY02
Uni
ted
Sta
tes
Arm
y A
nnua
l Fin
anci
al S
tate
men
t
Table 60. Competitive Sourcing Plan
Improved Financial Performance The U.S. Army Corps of Engineers is recognized as a leader in theDepartment of Defense in the area of financial management, and continues toupgrade its financial management systems and tools. For example, the Corpshas developed a proprietary financial tool known as the Corps of EngineersFinancial Management System (CEFMS). Designed and built by the Corpswith the aid of external contractors, the system delivers a broad range offunctionality. It integrates financial management processes with internalprogram and project management processes and provides automated linkageto the Department of the Army, DoD, and the Office of Management andBudget.
The Corps invested approximately $76 million in the development of CEFMS.The process of implementing the system and gaining its acceptance among theCorps family required a major cultural adjustment, but efforts in this regardhave proven extremely successful and CEFMS is a key component ofsuccessful program execution and customer care. The system now serves as ameasuring stick for new DoD financial management systems, and providedthe basis for development of the Defense Joint Accounting System.
In addition to implementing CEFMS, the Corps has undertaken the challengeof complying with the full requirements of the Chief Financial Officers Act of1990. With a fully integrated CEFMS and sound business practices, the Corpsis positioning itself to be one the first Army components to receive anunqualified audit opinion.
Expanded Electronic Government Rapidly advancing information technology has brought major changes to theCivil Works Program's business processes, and in particular, has improvedvastly the program's internal and external communications.
FY03 FY04 FY05 FY06 FY07 FY08 Total
Authorizations to be studied 1,022 356 1,137 1,790 1,035 371 5,711
Cost (in millions) $2.6 $0.9 $2.8 $4.5 $2.6 $0.9 $14.3

Government to CitizenCivil Works is an active proponent of the government's drive to reach out tothe public through the Internet. Using initiatives such as Recreation One-Stopand Geospatial Information One-Stop, it is making access to informationabout Civil Works services and programs easier for more Americans. Inpartnership with the U.S. Forest Service, Civil Works also supports theNational Recreation Reservation System for the use of public lands andfacilities. To simplify access to the rules governing use of Civil Works lands andwaterways, it has eliminated all hard-copy directives and publications(approximately 1,000), placing them instead online in formats suitable forviewing, downloading, and printing. Civil Works is responsible also for ninepublic reports: an Internet capability for all public reporting transactions willbe in place by October 2003.
Under the Operations and Maintenance Business Information Link (OMBIL),the regulatory permit process is being streamlined and integrated into atransaction-based Web environment. Civil Works also is evaluating othermeans for integrating various types of authorizations and licenses, with theview to improving public access to them and reducing waiting times.
Government to BusinessCivil Works is working to make it easier to do business with the federalgovernment. In partnership with the National Institute of Standards andTechnology and the General Accounting Office, it is working to define therequirements for a public key-based electronic signature capability to replacethe proprietary electronic signature capability that currently is used.
As a long-time promoter of electronic bid set capability, Civil Works is a fullparticipant in the Web-based Tri-Service Solicitation Network, which links thepublic to a full array of bid solicitations. Civil Works is DoD's ExecutiveAgent for the Architect-Engineer (A-E) Contractor Administrative SupportSystem and the Construction Contractor Appraisal Support System. Thesesystems manage A-E and construction contractor performance evaluations.
Government to Government (G2G) The sharing of information among Federal, state, local, and tribal governmentsand the full integration of that information will contribute to bettergovernment for all Americans. The Comprehensive Everglades Restoration
fy02Civil Works Fund
121

“Im
agin
atio
n •
Inno
vatio
n •
Initi
ativ
e”
122
FY02
Uni
ted
Sta
tes
Arm
y A
nnua
l Fin
anci
al S
tate
men
t
Program, a partnership of the Civil Works Program with the South FloridaWater Management District, is a prime example of interagency and specialinterest group electronic data sharing through a significant Internet presence(www.evergladesplan.org). Another example, the ENGLink automated system,is the primary integrator of multi-jurisdictional (local, state, and Federal) datafor the support of emergency operations. ENGLink provides real-time,accurate information in the event of a disaster, helping to support collaborativeresponse planning among what may be widely dispersed assets.
OMBIL and the Corps Water Management System aggregate, integrate, anddisseminate multiple sources of data in support of hydropower, navigation,environmental stewardship, and flood reduction missions that impact local,regional, state, and national interests. The Project Management BusinessProcess (PMBP) Program, which will see the development of a one-stopportal enabling customers and stakeholders to access project statusinformation, additionally is significant in terms of advancing the Corps' G2Gservices.
Internal Efficiency and Effectiveness The PMBP program is a significant initiative to streamline the businessprocesses associated with program and project management. It also willsupport the adoption of best business practices in the delivery of projects tolocal, state, regional, Federal, and international customers and will facilitateagency budget and performance integration. At the heart of this businessreengineering effort are the adoption of commercial-off-the-shelf software, theintegration and streamlining of legacy automated systems, and the terminationof several stand-alone applications.
The PMBP program also will impact the restructuring of CorpsWeb, theCorps' Internet and intranet presence. The objective of this restructuring is toimprove usability and access to information; to develop further functionallydriven, electronic data marts and information repositories; to enhanceelectronic document and records management capabilities; to establishcommon scientific and research technology development and deliverystrategies, based on product lines and supported by a Web-based deliveryframework; and to enhance a common electronic workplace environment thatpromotes Regional Business Centers, virtual teaming, personalization, and thestrategic management of human capital.

Budget and Performance IntegrationThe President's objective to link performance and budget builds on theGovernment Performance and Results Act of 1993 and earlier efforts toidentify program goals and performance measures and to link them to thebudget. The FY 2003 President's Budget was the first to include explicitassessments of program performance and a performance-linked budgetassessment of three Civil Works business programs: Navigation, Flood andCoastal Storm Damage Reduction, and Environmental Restoration. For the FY2004 budget, Civil Works is working to link more of its budget developmentto performance measures and is developing new performance measures tofurther this linkage. Progress in implementing this initiative will be reported inthe FY 2003 and FY 2004 financial statements.
fy02Civil Works Fund
123

“Im
agin
atio
n •
Inno
vatio
n •
Initi
ativ
e”
FY02
Uni
ted
Sta
tes
Arm
y A
nnua
l Fin
anci
al S
tate
men
t
Limitations of the Financial Statements 125
Limitations Concerning National Defense PP&E Stewardship 126
General Fund 127Principal Statements 127
Notes to the Principal Financial Statements 135
Supporting Consolidating/Combining Statements 201
Required Supplementary Stewardship Information 208
Required Supplementary Information 220
Audit Opinion 229
Army Working Capital Fund 237Principal Statements 237
Notes to the Principal Financial Statements 243
Supporting Consolidating/Combining Statements 278
Required Supplementary Information 298
Audit Opinion 303
Civil Works Fund 311Principal Statements 311
Notes to the Principal Financial Statements 317
Supporting Consolidating/Combining Statements 349
Required Supplementary Stewardship Information 373
Required Supplementary Information 375
Audit Opinion 381

125
LimitationsLimitations of the Financial StatementsThe financial statements have been prepared to report the financial positionand results of operations for the entity, pursuant to the requirements of Title31, United States Code, section 3515(b).
While the statements have been prepared from the books and records of theentity, in accordance with the formats prescribed by the Office of Managementand Budget, the statements are in addition to the financial reports used tomonitor and control budgetary resources which are prepared from the samebooks and records.
To the extent possible, the financial statements have been prepared inaccordance with federal accounting standards. At times, the Department isunable to implement all elements of the standards due to financialmanagement systems’ limitations. The Department continues to implementsystem improvements to address these limitations. There are other instances
fy02
Principal Statements and Notes

Gen
eral
Fun
d
126
FY02
Uni
ted
Sta
tes
Arm
y A
nnua
l Fin
anci
al S
tate
men
t
when the Department's application of the accounting standards is different from the auditor's application of thestandards. In those situations, the Department has reviewed the intent of the standard and applied it in a mannerthat management believes fulfills that intent.
The statements should be read with the realization that they are for a component of the United StatesGovernment, a sovereign entity. One implication of this is that the liabilities cannot be liquidated withoutlegislation that provides resources to do so.
Limitations Concerning National Defense PP&E StewardshipAs of the date these statements were prepared, the Federal Accounting Standards Advisory Board (FASAB) hadnot determined the final reporting requirements for ND PP&E. The Department cannot comply fully with existingreporting requirements, because many of the Department's accountability and logistics systems do not contain thecost of the ND PP&E assets. These systems were designed for the purpose of maintaining accountability andmeeting other logistics requirements and not for capturing the cost of ND PP&E.
Given the complexity of the existing temporary reporting requirements, the enormous cost of implementing thetemporary requirements and their temporary nature, the Department is suspending the reporting of ND PP&Einformation until such time as the FASAB adopts permanent reporting requirements.

1. ASSETS (Note 2)A. Intragovernmental:
1. Fund Balance with Treasury (Note 3)2. Investments (Note 4)3. Accounts Receivable (Note 5)4. Other Assets (Note 6)5. Total Intragovernmental Assets
B. Cash and Other Monetary Assets (Note 7)C. Accounts Receivable (Note 5)D. Loans Receivable (Note 8)E. Inventory and Related Property (Note 9)F. General Property, Plant and Equipment (Note 10)G. Other Assets (Note 6)
2. TOTAL ASSETS
3. LIABILITIES (Note 11)A. Intragovernmental:
1. Accounts Payable (Note 12)2. Debt (Note 13)3. Environmental Liabilities (Note 14)4. Other Liabilities (Notes 15 and 16)5. Total Intragovernmental Liabilities
B. Accounts Payable (Note 12)C. Military Retirement Benefits and Other Employment-
Related Actuarial Liabilities (Note 17)D. Environmental Liabilities (Note 14)E. Loan Guarantee Liability (Note 8)F. Other Liabilities (Notes 15 and 16)
4. TOTAL LIABILITIES
5. NET POSITIONA. Unexpended Appropriations (Note 18)B. Cumulative Results of Operations
6. TOTAL NET POSITION
7. TOTAL LIABILITIES AND NET POSITION
See Note 1 and Note 2.
Consolidated Balance Sheet
The accompanying notes are an integral part of these statements.
127
fy02
Department of Defense • Department of the Army As of September 30, 2002 and 2001 ($ in thousands)
FY 2002
$39,510,523 5,240
452,597 209,114
$40,177,474 $301,747 568,088
0 27,259,422 18,700,626 3,582,796
$90,590,153
$774,545 157
0 876,404
$1,651,106 $5,967,178
1,624,557 35,078,280
730 9,008,744
$53,330,595
$31,468,721 5,790,837
$37,259,558
$90,590,153
FY 2001
$37,351,036 3,193
727,509 61,560
$38,143,298 $168,401 362,702
0 34,543,535 17,621,538 3,726,647
$94,566,121
$874,432 108
0 658,664
$1,533,204 $6,698,778
1,646,526 40,071,084
0 6,944,358
$56,893,950
$28,895,571 8,776,600
$37,672,171
$94,566,121
Restated FY 2001
$37,351,036 3,193
727,509 61,560
$38,143,298 168,401 362,702
0 27,429,322 17,621,538 3,726,647
$87,451,908
$874,432 108
0 658,664
$1,533,204 $6,698,778
1,646,526 40,071,084
0 6,944,358
$56,893,950
$28,895,571 1,662,387
$30,557,958
$87,451,908

1. Program CostsA. Intragovernmental Gross CostsB. (Less: Intragovernmental Earned Revenue)C. Intragovernmental Net CostsD. Gross Costs With the PublicE. (Less: Earned Revenue From the Public)F. Net Costs With the PublicG. Total Net Cost
2. Cost Not Assigned to Programs
3. (Less:Earned Revenue Not Attributable to Programs)
4. Net Cost of Operations
See Note 1 and Note 19.
Gen
eral
Fun
dFY
02 U
nite
d S
tate
s A
rmy
Ann
ual F
inan
cial
Sta
tem
ent
128
Consolidated Statement of Net CostT
he a
ccom
pany
ing
note
s ar
e an
inte
gral
par
t of t
hese
sta
tem
ents
.
Department of Defense • Department of the Army For the years ended September 30, 2002 and 2001 ($ in thousands)
FY 2001
$13,453,124 (5,310,110)$8,143,014
$70,311,934 (1,028,865)
$69,283,069 $77,426,083
0
0
$77,426,083
FY 2002
$19,042,297 (5,531,194)$13,511,103 $67,293,314
(784,708)$66,508,606 $80,019,709
0
0
$80,019,709
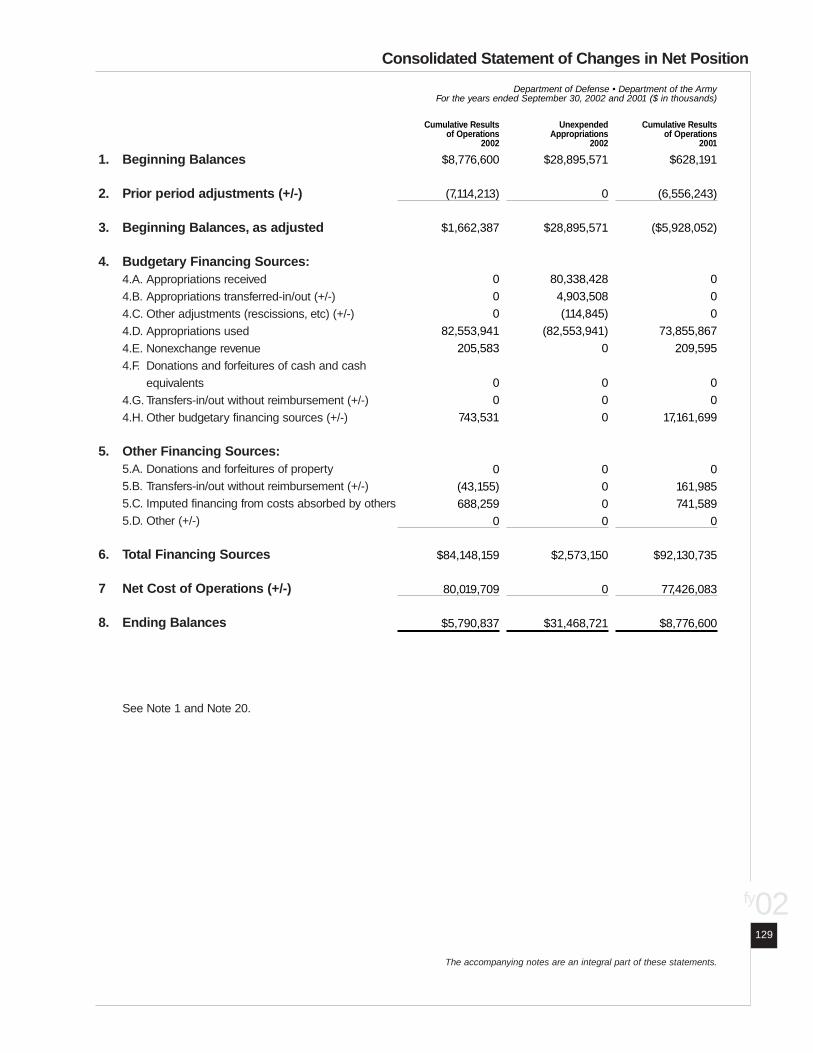
1. Beginning Balances
2. Prior period adjustments (+/-)
3. Beginning Balances, as adjusted
4. Budgetary Financing Sources:4.A. Appropriations received4.B. Appropriations transferred-in/out (+/-)4.C. Other adjustments (rescissions, etc) (+/-)4.D. Appropriations used4.E. Nonexchange revenue4.F. Donations and forfeitures of cash and cash
equivalents4.G. Transfers-in/out without reimbursement (+/-)4.H. Other budgetary financing sources (+/-)
5. Other Financing Sources:5.A. Donations and forfeitures of property 5.B. Transfers-in/out without reimbursement (+/-)5.C. Imputed financing from costs absorbed by others5.D. Other (+/-)
6. Total Financing Sources
7 Net Cost of Operations (+/-)
8. Ending Balances
See Note 1 and Note 20.
Consolidated Statement of Changes in Net Position
The accompanying notes are an integral part of these statements.
129
fy02
Department of Defense • Department of the Army For the years ended September 30, 2002 and 2001 ($ in thousands)
Cumulative Resultsof Operations
2002
$8,776,600
(7,114,213)
$1,662,387
0 0 0
82,553,941 205,583
0 0
743,531
0 (43,155)688,259
0
$84,148,159
80,019,709
$5,790,837
UnexpendedAppropriations
2002
$28,895,571
0
$28,895,571
80,338,428 4,903,508 (114,845)
(82,553,941)0
0 0 0
0 0 0 0
$2,573,150
0
$31,468,721
Cumulative Resultsof Operations
2001
$628,191
(6,556,243)
($5,928,052)
0 0 0
73,855,867 209,595
0 0
17,161,699
0 161,985 741,589
0
$92,130,735
77,426,083
$8,776,600

Gen
eral
Fun
dFY
02 U
nite
d S
tate
s A
rmy
Ann
ual F
inan
cial
Sta
tem
ent
130
Consolidated Statement of Changes in Net PositionT
he a
ccom
pany
ing
note
s ar
e an
inte
gral
par
t of t
hese
sta
tem
ents
.
Department of Defense • Department of the Army For the years ended September 30, 2002 and 2001 ($ in thousands)
1. Beginning Balances
2. Prior period adjustments (+/-)
3. Beginning Balances, as adjusted
4. Budgetary Financing Sources:4.A. Appropriations received4.B. Appropriations transferred-in/out (+/-)4.C. Other adjustments (rescissions, etc) (+/-)4.D. Appropriations used4.E. Nonexchange revenue4.F. Donations and forfeitures of cash and cash
equivalents4.G. Transfers-in/out without reimbursement (+/-)4.H. Other budgetary financing sources (+/-)
5. Other Financing Sources:5.A. Donations and forfeitures of property 5.B. Transfers-in/out without reimbursement (+/-)5.C. Imputed financing from costs absorbed by others5.D. Other (+/-)
6. Total Financing Sources
7 Net Cost of Operations (+/-)
8. Ending Balances
See Note 1 and Note 20.
UnexpendedAppropriations
2001
$25,887,329
0
$25,887,329
3,008,242 0 0 0 0
0 0 0
0 0 0 0
$3,008,242
0
$28,895,571
RestatedCumulative Resultsof Operations 2001
$628,191
(13,670,456)
($13,042,262)
0 0 0
73,855,867 209,595
0 17,161,699 17,161,699
0 161,985 741,589
0
$92,130,735
77,426,083
$1,662,387
Restated UnexpendedAppropriations 2001
$25,887,329
0
$25,887,329
3,008,242 0 0 0 0
0 0 0
0 0 0 0
$3,008,242
0
$28,895,571

Combined Statement of Budgetary Resources
The accompanying notes are an integral part of these statements.
131
fy02
Department of Defense • Department of the Army For the years ended September 30, 2002 and 2001 ($ in thousands)
BUDGETARY RESOURCES
1. Budget Authority:1a. Appropriations received 1b. Borrowing authority1c. Contract authority1d. Net transfers (+/-)1e. Other
2. Unobligated balance:2a. Beginning of period2b. Net transfers, actual (+/-)2c. Anticipated Transfers Balance
3. Spending authority from offsettingcollections:3a. Earned
1. Collected2. Receivable from Federal sources
3b. Change in unfilled customer orders1. Advance received2. Without advance from Federal
sources3c. Anticipated for the rest of year, without
advances3d. Transfers from trust funds3e. Subtotal
4. Recoveries of prior year obligations
5. Temporarily not available pursuant toPublic Law
6. Permanently not available
7. Total Budgetary Resources
See Note 1 and Note 21.
2001Non-Budgetary
FinancingAccounts
$0 0 0 0 0
0 0 0
0 0
0 0
0
0 $0
0
0
0
$0
2001BudgetaryFinancingAccounts
$74,232,106 0 0
2,112,116 0
5,970,023 869,646
0
11,631,079 (125,384)
(106,160)(183,369)
0
0 $11,216,166
10,706,763
0
(1,039,579)
$104,067,241
2002Non-Budgetary
FinancingAccounts
$0 0 0 0 0
691 0 0
39 0
0 0
0
0 $39
0
0
0
$730
2002BudgetaryFinancingAccounts
$81,067,276 0 0
5,290,599 0
5,701,789 408,970
0
12,012,602 (146,322)
87,119 1,164,785
0
0 $13,118,184
8,287,368
0
(1,569,179)
$112,305,007

Gen
eral
Fun
dFY
02 U
nite
d S
tate
s A
rmy
Ann
ual F
inan
cial
Sta
tem
ent
132
Combined Statement of Budgetary ResourcesT
he a
ccom
pany
ing
note
s ar
e an
inte
gral
par
t of t
hese
sta
tem
ents
.
Department of Defense • Department of the Army For the years ended September 30, 2002 and 2001 ($ in thousands)
STATUS OF BUDGETARY RESOURCES
8. Obligations incurred:8a. Direct8b. Reimbursable8c. Subtotal
9. Unobligated balance:9a. Apportioned9b. Exempt from apportionment9c. Other available
10. Unobligated Balances NotAvailable
11. Total, Status of BudgetaryResources
RELATIONSHIP OF OBLIGATIONS TOOUTLAYS:
12. Obligated Balance, Net – beginningof period
13. Obligated Balance transferred, net (+/-)
14. Obligated Balance, Net – end ofperiod:14a. Accounts receivable14b. Unfilled customer order from Federal
sources14c. Undelivered orders14d. Accounts payable
15. Outlays:15a. Disbursements15b. Collections15c. Subtotal
16. Less: Offsetting receipts
17. Net Outlays
See Note 1 and Note 21.
2001Non-Budgetary
FinancingAccounts
$0 0
$0
0 0 0
0
$0
$0
0
0 0
0 0
0 0
$0
0
$0
2001BudgetaryFinancingAccounts
$84,262,609 14,102,151
$98,364,760
4,494,010 0 1
1,208,470
$104,067,241
$28,485,816
0
(1,614,053)(5,996,218)
28,696,740 10,540,092
84,826,003 (11,524,919)$73,301,084
0
$73,301,084
2002Non-Budgetary
FinancingAccounts
$0 0
$0
730 0 0
0
$730
$0
0
0 0
0 0
0 (39)
($39)
0
($39)
2002BudgetaryFinancingAccounts
$91,731,863 14,715,031
$106,446,894
4,788,478 0 2
1,069,633
$112,305,007
$31,626,562
0
(1,467,731)(7,161,002)
30,611,343 11,679,657
95,105,359 (12,099,721)$83,005,638
(184,839)
$82,820,799

Combined Statement of Financing
The accompanying notes are an integral part of these statements.
133
fy02
Department of Defense • Department of the Army For the years ended September 30, 2002 and 2001 ($ in thousands)
Resources Used to Finance Activities:
Budgetary Resources Obligated1. Obligations incurred2. Less: Spending authority from offsetting collections and
recoveries (-)3. Obligations net of offsetting collections and recoveries4. Less: Offsetting receipts (-)5. Net obligations
Other Resources6. Donations and forfeitures of property7. Transfers in/out without reimbursement (+/-)8. Imputed financing from costs absorbed by others9. Other (+/-)10. Net other resources used to finance activities
11. Total resources used to finance activities
Resources Used to Finance Items not Part of the NetCost of Operations
12. Change in budgetary resources obligated for goods,services and benefits ordered but not yet providedUndelivered Orders (-)Unfilled Customer Orders
13. Resources that fund expenses recognized in prior periods14. Budgetary offsetting collections and receipts that do not
affect net cost of operations15. Resources that finance the acquisition of assets16. Other resources or adjustments to net obligated
resources that do not affect net cost of operationsLess: Trust or Special Fund Receipts Related to
Exchange in the Entity's Budget (-)Other (+/-)
17. Total resources used to finance items not part ofthe net cost of operations
18. Total resources used to finance the net cost ofoperations
See Note 1 and Note 22.
2002
$106,446,894
(21,405,591)$85,041,303
(184,839)$84,856,464
0 0
688,259 0
$688,259
$85,544,723
(2,138,888)1,251,904
(5,656,745)
0 (152,239)
0 0
($6,695,968)
$78,848,755
2001
98,364,761
(21,922,930)$76,441,831
0 $76,441,831
0 0
741,589 0
$741,589
$77,183,420
(1,693,599)(289,528)(103,514)
0 (3,730,946)
0 0
($5,817,587)
$71,365,833

Components of the Net Cost of Operations that will notRequire or Generate Resources in the Current Period:
Components Requiring or Generating Resources inFuture Periods:
19. Increase in annual leave liability20. Increase in environmental and disposal liability21. Upward/Downward reestimates of credit subsidy expense
(+/-)22. Increase in exchange revenue receivable from the
public (-)23. Other (+/-)24. Total components of Net Cost of Operations that will
require or generate resources in future periods
Components not Requiring or Generating Resources:25. Depreciation and amortization26. Revaluation of assets or liabilities (+/-)27. Other (+/-)28. Total components of Net Cost of Operations that
will not require or generate resources
29. Total components of net cost of operationsthat will not require or generate resources inthe current period
30. Net Cost of Operations
See Note 1 and Note 22.
Gen
eral
Fun
dFY
02 U
nite
d S
tate
s A
rmy
Ann
ual F
inan
cial
Sta
tem
ent
134
Combined Statement of FinancingT
he a
ccom
pany
ing
note
s ar
e an
inte
gral
par
t of t
hese
sta
tem
ents
.
Department of Defense • Department of the Army For the years ended September 30, 2002 and 2001 ($ in thousands)
2002
$276,719 0
0
0 1,486,858
$1,763,577
596,779 (1,793,293)
603,891
($592,623)
$1,170,954
$80,019,709
2001
$0 0
0
0 2,961,119
$2,961,119
782,618 0
(1,901)
$780,717
$3,741,836
$75,107,669

Notes to Principal Statements
135
fy02
Notes to the Principal Financial StatementsNote 1. Significant Accounting PoliciesA. Basis of Presentation
These financial statements have been prepared to report the financial position and results of operations of theDepartment of Army, as required by the "Chief Financial Officers Act of 1990," expanded by the"Government Management Reform Act of 1994," and other appropriate legislation. The financial statementshave been prepared from the books and records of the Army in accordance with the "DoD FinancialManagement Regulation," OMB Bulletin No. 01-09, "Form and Content of Agency Financial Statements,"and to the extent possible Federal GAAP. The accompanying financial statements account for all resourcesfor which the Army is responsible except that information relative to classified assets, programs, andoperations has been excluded from the statement or otherwise aggregated and reported in such a manner thatit is no longer classified. The Army's financial statements are in addition to the financial reports alsoprepared by the DoD pursuant to OMB directives that are used to monitor and control the Army's use ofbudgetary resources.
The Army is unable to fully implement all elements of Federal GAAP and OMB Bulletin No. 01-09 due tolimitations of its financial and nonfinancial management processes and systems. The Army derives itsreported values and information for major asset and liability categories largely from non-financial feedersystems, such as inventory systems and logistic systems. These were designed to support reportingrequirements focusing on maintaining accountability over assets and reporting the status of federalappropriations rather than preparing financial statements in accordance with Federal GAAP. As a result, theArmy currently cannot implement every aspect of Federal GAAP and OMB Bulletin No. 01-09. The Armycontinues to implement process and system improvements addressing the limitations of its financial andnonfinancial feeder systems. Further explanation of these financial statement elements is included in theapplicable footnote.
B. Mission of the ArmyThe overall mission of the Army is to organize, train, and equip armed forces to deter aggression and, ifnecessary, defeat aggressors of the United States and its allies. It is no longer a world in which two hostilesuperpowers face each other. It is our nation's force of decision-a full spectrum force-trained and ready torespond to a wide range of crises, from fighting and winning major theater wars, to peacekeeping, tohumanitarian relief missions and to disaster relief in communities as home.
The primary mission of the Army remains constant: to fight and win the nation's wars. In an uncertain world,the Army performs a wide variety of other missions around the world and at home including deterringpotential adversaries, reassuring and lending stability to allies and supporting our communities in times ofemergency; preserving the peace and security, supporting national policies, and implementing nationalobjects. In addition to its military operations, the Army is deployed frequently, both at home and abroad, inresponse to natural disasters. Nationally, the Army provides substantial support to relief operationsassociated with storms, tornados, and hurricanes. The Army also provides support and relief assistanceabroad. Whatever the mission, committing the Army commits the Nation.

Gen
eral
Fun
d
136
FY02
Uni
ted
Sta
tes
Arm
y A
nnua
l Fin
anci
al S
tate
men
t
Fiscal Year (FY) 2003 is the seventh year that the Army has prepared audited Financial Statements requiredby the Chief Financial Officers (CFO) Act of 1990, Government Management Reform Act (GMRA) of 1994,and Federal Financial Management Improvement Act of 1996. The purpose of the CFO Act was to bringmore effective general and financial management practices to the Federal Government through statutoryprovisions; provide for improvement of systems of accounting, financial management, and internal controls;and provide for the production of complete, reliable, timely, and consistent financial information. TheGMRA Act extended the CFO Act to all activities of all Executive Branch agencies. The FFMIA Actexpanded report requirements under the CFO Act. The reporting entities within the Army changed tofacilitate these reporting requirements.
C. Appropriations and FundsThe Army receives its appropriations as general, working capital (revolving funds), trust, special, and depositfunds. The Army uses these appropriations and funds to execute their missions and report resource usage.
General funds are used for financial transactions that arise under congressional appropriations, includingpersonnel, operation and maintenance, research and development, procurement, and constructionaccounts.
Special funds account for government receipts earmarked for a specific purpose.
Deposit funds generally are used to: (1) hold assets for which the Army is acting as an agent or acustodian or whose distribution awaits legal determination, or (2) account for unidentified remittances.
D. Basis of AccountingThe Army generally records transactions on a budgetary basis and not an accrual accounting basis as isrequired by Federal GAAP. For FY 2002, the Army's financial management systems were unable to meet allof the requirements for full accrual accounting. Many of the Army's financial and nonfinancial feedersystems and processes were designed and implemented prior to the issuance of Federal GAAP for federalagencies and, therefore, were not designed to collect and record financial information on the full accrualaccounting basis as required by Federal GAAP. The Army has undertaken efforts to determine the actionsrequired for bringing its financial and nonfinancial feeder systems and processes into compliance with allelements of Federal GAAP. One such action is the current revision of its accounting systems to recordtransactions based on the United States Government Standard General Ledger (USSGL). Until such time asall of the Army's financial and nonfinancial feeder systems and processes are updated to collect and reportfinancial information as required by Federal GAAP, the Army's financial data will be based on budgetarytransactions (obligations, disbursements, and collections), transactions from nonfinancial feeder systems, andadjusted for known accruals of major items such as payroll expenses, accounts payable, and environmentalliabilities. The financial statements are presented on the accrual basis of accounting. One example ofinformation presented on the budgetary basis is the data on the Statement of Net Cost, which is based onobligations and disbursements and may not always represent accrued costs.
In addition, the Army identifies programs based upon the major appropriation groups provided by Congress.The Army is in the process of reviewing available data and attempting to develop a cost reportingmethodology that balances the need for cost information required by the Statement of Federal FinancialAccounting Standard (SFFAS) No. 4, "Managerial Cost Accounting Concepts and Standards for the FederalGovernment," with the need to keep the financial statements from being overly voluminous.

Notes to Principal Statements
137
fy02
E. Revenues and other Financing SourcesThe Army receives congressional appropriations as financing sources for general funds (annual and amultiyear basis). When authorized, they supplement these appropriations with revenues generated by sales ofgoods or services through the reimbursable order process. The Army recognizes revenue as a result of costsincurred or services performed on behalf of other federal agencies and the public. The reimbursable orderprocess allows the Army to recognize revenue when earned.
Other financing sources reported by the Army do not include non-monetary support provided by U.S. Alliesfor common defense and mutual security. The U.S. has agreements with foreign countries that include bothdirect and indirect sharing of costs that each country incurs in support of the same general purpose.Examples include countries where there is a mutual or reciprocal defense agreement, where U.S. troops arestationed, or where the U.S. fleet is serviced in a port. The Army is reviewing these types of financing andcost reductions in order to establish accounting policies and procedures to identify what, if any, of these costsare appropriate for disclosure in the Army's financial statements in accordance with generally acceptedaccounting principles. Recognition of support provided by host nations, would affect both financing sourcesand recognition of expenses.
F. Recognition of ExpensesFor financial reporting purposes, the Army policy requires the recognition of operating expenses in the periodincurred. However, because the Army's financial and nonfinancial feeder systems were not designed tocollect and record financial information on the full accrual accounting basis, accrual adjustments are madefor major items such as payroll expenses, accounts payable, and environmental liabilities. The Army'sexpenditures for capital and other long-term assets are not recognized as operating expenses until depreciatedin the case of Property, Plant and Equipment (PP&E) or consumed in the case of Operating Materials andSupplies (OM&S). Net increases or decreases in unexpended appropriations are recognized as a change inthe net position. Certain expenses, such as annual and military leave earned but not taken, are financed in theperiod in which payment is made.
The Army adjusted operating expenses as a result of the elimination of balances between DoD Components.See Note 19.I, Intragovernmental Expenses and Revenue for disclosure of adjustment amounts.
G. Accounting for Intragovernmental ActivitiesThe Army, as an agency of the federal government, interacts with and is dependent upon the financialactivities of the federal government as a whole. Therefore, these financial statements do not reflect theresults of all financial decisions applicable to the Army as though the agency was a stand-alone entity.
The Army's proportionate share of public debt and related expenses of the federal government are notincluded. The federal government does not apportion Debt and its related costs to federal agencies. TheArmy's financial statements, therefore, do not report any portion of the public debt or interest thereon, nor dothe statements report the source of public financing whether from issuance of debt or tax revenues.
The Army obtains financing for construction of DoD facilities through budget appropriations. TheDepartment of Treasury does not allocate such interest costs to the benefiting agencies. The Army does notcapitalize interest costs obtained through the issuance of public debt.

Gen
eral
Fun
d
138
FY02
Uni
ted
Sta
tes
Arm
y A
nnua
l Fin
anci
al S
tate
men
t
The Army's civilian employees participate in the Civil Service Retirement System (CSRS) and the FederalEmployees Retirement Systems (FERS), while military personnel are covered by the Military RetirementSystem (MRS). Additionally, employees and personnel covered by FERS and MRS also have varyingcoverage under Social Security. The Army funds a portion of the civilian and military pensions. Reportingcivilian pensions under CSRS and FERS retirement systems is the responsibility of the Office of PersonnelManagement (OPM). The Army recognizes an imputed expense for the portion of civilian employeepensions and other retirement benefits funded by the OPM in the Statement of Net Cost; and recognizescorresponding imputed revenue from the civilian employee pensions and other retirement benefits in theStatement of Changes in Net Position.
The Army reports the assets, funded actuarial liability, and unfunded actuarial liability for the militarypersonnel retirement system in the Military Retirement Fund (MRF) financial statements. The Armyrecognizes the actuarial liability for the military retirement health benefits in the Other Defense OrganizationGeneral Fund column of the Army Agency-wide consolidating/combining statements.
To prepare reliable financial statements, transactions occurring between components or activities within theArmy must be eliminated. However, the Army, as well as the rest of the federal government, cannot identifyaccurately all intragovernmental transactions by customer. The Defense Finance and Accounting Service(DFAS) is responsible for eliminating transactions between components or activities of the Army. For FY1999 and beyond seller entities within the Department provided summary seller-side balances for revenue,accounts receivable and unearned revenue to the buyer-side internal Army accounting offices. In most cases,the buyer-side records have been adjusted to recognize unrecorded costs and accounts payable. Armyintragovernmental balances were then eliminated.
The Department of the Treasury, Financial Management Service (FMS) is responsible for eliminatingtransactions between the Department and other federal agencies. In September 2000, the FMS issued the"Federal Intragovernmental Transactions Accounting Policies and Procedures Guide." The Department wasnot able to fully implement the policies and procedures in this guide related to reconciling intragovernmentalassets, liabilities, revenues, and expenses for non-fiduciary transactions. The Army, however, was able toimplement the policies and procedures contained in the "Intragovernmental Fiduciary TransactionsAccounting Guide," as updated by the "Federal Intragovernmental Transactions Accounting Policies andProcedures Guide," for reconciling intragovernmental transactions pertaining to investments in federalsecurities, borrowings from the United States (U.S.) Treasury and the Federal Financing Bank, FederalEmployees' Compensation Act transactions with the Department of Labor (DoL), and benefit programtransactions with the OPM.
H. Transactions with Foreign Governments and International OrganizationsEach year, the Army Components sell defense articles and services to foreign governments and internationalorganizations, primarily under the provisions of the "Arms Export Control Act of 1976." Under theprovisions of the Act, the Army has authority to sell defense articles and services to foreign countries andinternational organizations, generally at no profit or loss to the U.S. Government. Customers may berequired to make payments in advance.

Notes to Principal Statements
139
fy02
I. Funds with the U.S. TreasuryThe Defense Finance and Accounting Service (DFAS), Military Services, U.S. Army Corp of Engineers,disbursing stations, and the Department of State financial service centers process the majority of cashcollections, disbursements, and adjustments worldwide. Each disbursing station prepares monthly reports,which provide information to the U.S. Treasury on check issues, electronic fund transfers, interagencytransfers and deposits.
In addition, the DFAS sites and the USACE Finance Center submit reports to the Department of theTreasury, by appropriation, on interagency transfers, collections received, and disbursements issued. TheDepartment of the Treasury then records this information to the applicable Fund Balance with Treasury(FBWT) account maintained in the Treasury's system. Differences between the Army's recorded balance inthe FBWT accounts and Treasury's FBWT accounts sometimes result and are reconciled subsequently. SeeNote 3, Fund Balance With Treasury for material disclosure. Differences between accounting offices' detail-level records and Treasury's FBWT accounts are disclosed in Note 21.B, specifically, differences caused byin-transit disbursements and unmatched disbursements (which are not recorded in the accounting offices'detail-level records).
J. Foreign CurrencyThe Army conducts a significant portion of its operations overseas. The Congress established a specialaccount to handle the gains and losses from foreign currency transactions for five general fund appropriations(operation and maintenance, military personnel, military construction, family housing operation andmaintenance, and family housing construction). The gains and losses are computed as the variance betweenthe exchange rate current at the date of payment and a budget rate established at the beginning of each fiscalyear. Foreign currency fluctuations related to other appropriations require adjustments to the originalobligation amount at the time of payment. The Army does not identify currency fluctuations separately.
K. Accounts ReceivableAs presented in the Balance Sheet statement, accounts receivable includes accounts, claims, and refundsreceivable from other federal entities or from the public. The Army bases the allowances for uncollectibleaccounts that are due from the public upon analysis of collection experience by fund type. The Army doesnot recognize an allowance for estimated uncollectible amounts from other federal agencies. Claims againstother federal agencies are to be resolved between the agencies. See Note 5, Accounts Receivable, formaterial disclosures.
L. Loans ReceivableNot Applicable
M. Inventories and Related PropertyInventories are reported at approximate historical cost using Latest Acquisition Cost (LAC) adjusted forholding gains and losses.
The Army uses the LAC method because its inventory systems were designed for material managementrather than accounting. The systems provide accountability and visibility over inventory items. They do not

Gen
eral
Fun
d
140
FY02
Uni
ted
Sta
tes
Arm
y A
nnua
l Fin
anci
al S
tate
men
t
maintain the historical cost data necessary to comply with the SFFAS No. 3, "Accounting for Inventory andRelated Property." Neither can they produce directly financial transactions using the United StatesGovernment Standard General Ledger (USSGL), as required by the Federal Financial ManagementImprovement Act of 1996 (P.L. 104-208).
The SFFAS No. 3 distinguishes between "Inventory Held for Sale" and "Inventory Held in Reserve forFuture Sale." There is no management or valuation difference between the two USSGL accounts. Further,the Army manages only military or government-specific material under normal conditions. Items commonlyused in and available from the commercial sector are not managed in the Army material managementactivities. Operational cycles are irregular, and the military risks associated with stock-out positions have nocommercial parallel. The Army holds material based on military need and support for contingencies.Therefore, the Army does not attempt to account separately for items held for "current" or "future" sale.
Related property includes Operating Materials and Supplies (OM&S) and stockpile materials. The OM&S,including munitions not held for sale, are valued at standard purchase price. For the most part the Army usesthe consumption method of accounting for OM&S by expensing material when issued to the end user.Where current systems cannot fully support the consumption method, the Army uses the purchase method -that is, expensed when purchased. For FY 2002, the Army reported significant amounts using the purchasemethod either because the systems could not support the consumption method or because managementdeems that the item is in the hands of the end user.
The Army implemented new policy in FY 2002 to account for condemned material (only) as "Excess,Obsolete, and Unserviceable." The net value of condemned material is zero, because the costs of disposalare greater than the potential scrap value. Potentially redistributable material, presented in previous years as"Excess, Obsolete, and Unserviceable," is included in "Held for Use" or "Held for Repair" categoriesaccording to its condition.
In addition, past audit results identified uncertainties about the completeness and existence of quantities usedto produce the reported values. Material disclosures related to inventory and related property are provided inNote 9.
N. Investments in U.S. Treasury SecuritiesThe Army reports investments in U.S. Treasury securities at cost, net of un-amortized premiums or discounts.Premiums or discounts amortize into interest income over the term of the investment using the effectiveinterest rate method or another method obtaining similar results. The Army's intent is to hold investmentsuntil maturity, unless the Army needs the investments to finance claims or otherwise sustain operations.Consequently, the Army does not make a provision for unrealized gains or losses on these securities.Material disclosures related to Investments in U.S. Treasury Securities are provided in Note 4.
O. General Property, Plant and EquipmentGeneral property, plant, and equipment (PP&E) assets are capitalized at historical acquisition cost pluscapitalized improvements when an asset has a useful life of 2 or more years, and when the acquisition costequals or exceeds the Army capitalization threshold of $100,000. Also, the Army requires capitalization of

Notes to Principal Statements
141
fy02
improvement costs over the Army capitalization threshold of $100,000 for General PP&E. The Armydepreciates all General PP&E, other than land, on a straight-line basis. The Army does not depreciate itslands.
Contractor Provided When it is in the best interest of the government, the Army provides to contractors government propertynecessary to complete contract work. The Army either owns or leases such property, or it is purchaseddirectly by the contractor for the government based on contract terms. When the value of contractorprocured General PP&E exceeds the DoD capitalization threshold, such PP&E is required to be included inthe value of General PP&E reported on the Army's Balance Sheet. The Army completed a study thatindicates that the value of General PP&E above the Army capitalization threshold and not older than theDoD Standard Recovery Periods for depreciation and that are presently in the possession of contractors, isimmaterial to the Army's financial statements. Regardless, the Army is developing new policies and acontractor reporting process that will provide appropriate General PP&E information for future financialstatement reporting purposes. Accordingly, the Army currently reports only government property, maintainedin the Army's property systems, in the possession of contractors.
The Army issues new property accountability and reporting regulations that require the components inproperty systems to maintain information on all property furnished to contractors to bring the Army intofuller compliance with federal accounting standards. This action and other Army proposed actions captureand report the information necessary for compliance with federal accounting standards.
Material disclosures related to General PP&E are provided in Note 10.
P. Advances and PrepaymentsThe Army records payments in advance of the receipt of goods and services as advances or prepayments andreports them as assets on the Balance Sheet. In addition, when the department receives the related goods andservices, it recognizes advances and prepayments as expenditures and expenses.
Q. LeasesGenerally, lease payments are for the rental of equipment and operating facilities. Their classification is eithercapital or operating leases. For a lease that is essentially equivalent to an installment purchase of property (acapital lease) and equals or exceeds the current Army capitalization threshold, the Army records theapplicable asset and liability. The Army records the lesser amount of the present value of the rental and otherlease payments during the lease term, excluding that portion of the payments representing executory costspaid to the lessor, or the asset's fair value. The Army deems the use of estimates for these costs as adequateand appropriate due to the relatively low dollar value of capital leases. Leases that do not transfersubstantially all of the benefits or risks of ownership are classified as operating leases and are recorded asexpenses as payments are made over the lease term.
R. Other AssetsThe Army conducts business with commercial contractors under two primary types of contracts--fixed priceand cost reimbursable. To alleviate the potential financial burden on the contractor that long-term contracts

Gen
eral
Fun
d
142
FY02
Uni
ted
Sta
tes
Arm
y A
nnua
l Fin
anci
al S
tate
men
t
can cause, the Army provides financing payments. For Real Property, the Army makes one type of financingpayment based upon a percentage of completion. In accordance with SFFAS No. 1, "Accounting forSelected Assets and Liabilities," such payments require treatment as construction in process. The Armyreports these treatments on the General PP&E line and in Note 10, General PP&E, Net. In addition,provision of the Federal Acquisition Regulation allows the Army to make financing payments under fixedprice contracts that are not based on a percentage of completion. The Army reports these financing paymentsas advances or prepayments in the "Other Assets" line item. The Army treats these payments as advances orprepayments because the Army becomes liable only after the contractor delivers the goods in conformancewith the contract terms. If the contractor does not deliver a satisfactory product, the Army is not obligated toreimburse the contractor for its costs and the contractor is liable to repay the Army for the full amount of theadvance. The Army has completed a review of all applicable federal accounting standards; applicable publiclaws on contract financing; Federal Acquisition Regulation Parts 32, 49, and 52; and the OMB guidance in 5Code of Federal Regulations Part 1315, "Prompt Payment." The Army has concluded that SFFAS No. 1does not address fully or adequately the subject of progress payment accounting and is considering whatfurther action is appropriate.
S. Contingencies and Other LiabilitiesThe SFFAS No. 5, "Accounting for Liabilities of the Federal Government," defines contingencies to be anexisting condition, situation, or set of circumstances that involves an uncertainty as to possible gain or loss tothe Army. The uncertainty will be resolved when one or more future events occur or fail to occur.Contingencies are recognized as liabilities when past events or exchange transactions have occurred, a futureloss is probable, and the amount of loss can be estimated reasonably.
Financial statement reporting is limited to disclosure when conditions for liability recognition do not exist butthere is at least a reasonable possibility of incurring a loss or additional losses. Examples of losscontingencies include the collectibility of receivables, pending or threatened litigation, possible claims andassessments. The Army's loss contingencies arising as a result of pending or threatened litigation or claimsand assessments occur due to events such as aircraft, ship and vehicle accidents, medical malpractice,property or environmental damages, and contract disputes.
Other liabilities arise as a result of anticipated disposal costs for the Army's assets. This type of liability hastwo components: non-environmental and environmental. Consistent with SFFAS No. 6, "Accounting forProperty, Plant, and Equipment" recognition of an anticipated environmental disposal liability commenceswhen the asset is placed into service. Nonenvironmental disposal liabilities are recognized for assets whenmanagement decides to dispose of an asset based upon the Army's policy, consistent with SFFAS No.5"Accounting for Liabilities of Federal Government." The Army agrees to the recognition of non-environmental disposal liability for National Defense PP&E nuclear powered assets when placed into service.Such amounts are developed in conjunction with, and not easily separately identifiable from, environmentaldisposal costs. See Notes 14 and 15 for material disclosures.
T. Accrued LeaveThe Army reports civilian annual leave and military leave that has been accrued and not used as of thebalance sheet date as liabilities. The liability reported at the end of the fiscal year reflects the current payrates.

Notes to Principal Statements
143
fy02
U. Net PositionNet Position consists of unexpended appropriations and cumulative results of operations. Unexpendedappropriations represent amounts of authority, which are unobligated and have not been rescinded orwithdrawn, and amounts obligated but for which legal liabilities for payments have not been incurred.
Cumulative results of operations represent the balances that result from subtracting expenses and losses fromfinancing sources including appropriations, revenue, and gains since the inception of the activity. Beginningwith FY 1998, this included the cumulative amount of donations and transfers of assets in and out withoutreimbursement.
V. Treaties for Use of Foreign BasesThe DoD Components have the use of land, buildings, and other facilities, which are located overseas andhave been obtained through various international treaties and agreements negotiated by the Department ofState. DoD capital assets overseas are purchased with appropriated funds; however, the title to land andimprovements is retained by the host country. Generally, treaty terms allow the DoD Components continueduse of these properties until the treaties expire. The fixed assets are subject to loss in the event treaties arenot renewed or the Department does not reach other agreements. Therefore, in the event treaties or otheragreements are terminated whereby use of the foreign bases is allowed no longer, losses will be recorded forthe value of any non-retrievable capital assets after negotiations between the U.S. and the host country havebeen concluded to determine the amount paid to the U.S. for such capital investments.
W. Comparative DataIn FY 2002, the Army modified the financial statement presentation for the Statements of Net Cost, Changesin Net Position, and Financing. As a result, the Army's statements during this reporting period may notalways lend themselves to comparative analysis. In some instances, amounts on the statements were reportedon one financial line in FY 2001 and split into multiple financial lines for FY 2002, in accordance withOMB's guidance.
X. Unexpended ObligationsThe Army records obligations for goods and services ordered but not yet received. A payment liability is notestablished in the financial statements because goods and services have not been delivered.

Gen
eral
Fun
d
144
FY02
Uni
ted
Sta
tes
Arm
y A
nnua
l Fin
anci
al S
tate
men
t
Note 2. Nonentity and Entity AssetsAs of September 30,(Amounts in thousands) 2002 2001
1. Intragovernmental Assets: Nonentity Entity Total
A. Fund Balance with Treasury ($5,382) $39,515,905 $39,510,523 $37,351,036B. Investments 0 5,240 5,240 3,193C. Accounts Receivable 0 452,597 452,597 727,509D. Other Assets 0 209,114 209,114 61,560E. Total Intragovernmental Assets ($5,382) $40,182,856 $40,177,474 $38,143,298
2. Non-Federal Assets:A. Cash and Other Monetary Assets $301,747 $0 $301,747 $168,401B. Accounts Receivable 24,415 543,673 568,088 362,702C. Loans Receivable 0 0 0 0D. Inventory & Related Property 0 27,259,422 27,259,422 34,543,535E. General Property, Plant and Equipment 0 18,700,626 18,700,626 17,621,538F Other Assets (89) 3,582,885 3,582,796 3,726,647G. Total Non-Federal Assets $326,073 $50,086,606 $50,412,679 $56,422,823
3. Total Assets: $320,691 $90,269,462 $90,590,153 $94,566,121
4. Other Information:
Relevant Information For ComprehensionEntity assets of $90,269,462 thousand consist of resources that the Army has the authority to use, or wheremanagement is obligated legally to use funds to meet their obligations. The $320,691 thousand in nonentityasset are assets held by the Army, but are not available for use in the operations. The abnormal balance of$5,382 thousand shown for Nonentity Intragovernmental Fund Balance with Treasury is attributable to acollection recorded in the Military Pay account instead of Servicemen's Group Life Insurance account wherefunds were disbursed. Corrective action has been taken to eliminate the abnormal balance. The abnormalcondition for Non-Federal Other Assets occurred due to deferred voucher conditions for amounts paid bytactical contingency disbursing offices in Bosnia that will be reported to the 266th Finance Command inGermany.
Note ReferenceFor Additional Line Item discussion, see:Note 4, InvestmentsNote 5, Accounts ReceivableNote 6, Other AssetsNote 7, Cash and Other Monetary Assets

Notes to Principal Statements
145
fy02
Note 3. Fund Balance with TreasuryAs of September 30,(Amounts in thousands) 2002 2001
1. Fund Balances:A. Appropriated Funds $39,407,718 $37,099,685B. Revolving Funds 79,199 136,412C. Trust Funds 1,537 931D. Other Fund Types 22,069 114,008E. Total Fund Balances $39,510,523 $37,351,036
2. Fund Balances Per Treasury Versus Agency:A. Fund Balance per Treasury $39,510,523 $37,351,035B. Fund Balance per DoD 39,510,523 37,351,036C. Reconciling Amount $0 ($1)
3. Explanation of Reconciliation Amount:
4. Other Information:
Intragovernmental Paying and Collecting (IPAC)The Intragovernmental Payment and Collection (IPAC) differences are reconcilable differences that representamounts recorded by Treasury but not reported by the organization. As of September 30, 2002 there were $6thousand of IPAC differences greater than 180 days old. However, for September 30, 2001, there were nodollars reported in the greater than 180 days old category. Automated reconciliation tools implementedduring fiscal year 2001 and used throughout fiscal year 2002 virtually eliminated all existing differences forthe Department of the Army. The only reason for an IPAC difference to exist today would relate to field sitesrequiring additional backup to record the transaction in their accounting system, or timing differencesbetween disbursing and Treasury cut-off dates.
Check Issue DiscrepancyThe Department of the Army is in the process of collecting information for all check issue discrepancy datathat are unsupportable because: (1) records have been lost during deactivation of disbursing offices, (2) theDepartment of the Treasury may not assist in research efforts for transactions over 1-year old, or (3)corrections were processed for transactions that the Department of the Treasury had removed from the checkcomparison report. Transactions that have no supporting documentation due to one of the precedingsituations shall be provided to the Department of the Treasury with a request to remove them from theTreasury Check Comparison Report. The vast majority of the remaining check issue discrepancies are aresult of timing differences between the Department of the Army and the Department of the Treasury forprocessing checks. The Department currently is not requesting the Department of the Treasury to removeany dollars from the check issue comparison report.

Gen
eral
Fun
d
146
FY02
Uni
ted
Sta
tes
Arm
y A
nnua
l Fin
anci
al S
tate
men
t
Aged September 30, 2002 September 30, 2001(Amounts in Thousands) (Amounts in Thousands)
0-60 days $302,541 $246,08861-180 days (14) 2,596>180 days (6) (2,021)Total $302, 521 $246,663
Check issue differences in the 0-60 days category are considered timing differences due to intransit timebetween reporting check issues by the field and processing into the Treasury Check Payments andReconciliation System. These differences include Army's disbursing stations on the Army 2100 Comparisonof Checks Issued Report received from Treasury; however, $42,114 thousand of the difference representsreported amounts under DFAS Columbus Performance Measurement Indicator (PMI) Reports.
The total difference in the 61-180 days category is $2,000 thousand less than September 30, 2001 andexpected to clear in the next reporting cycle.
The Department of the Army's over 180 days category decreased $2,104 thousand from fiscal year 2001. Theremaining difference represents small dollar amounts spread among various disbursing stations, dating fromFiscal Year 1991 through Fiscal Year 1998. Since the stations lack the supporting documentation, theseamounts have been provided to DFAS Arlington for inclusion in a package submitted to the Office of theSecretary of Defense (OSD) for resolution.
Deposit DifferencesThe Deposit differences are reconcilable differences that represent deposit amounts reported by theDepartment of the Treasury or the organization. As of September 30, 2002 and 2001, there was $5,871thousand and $932 thousand, respectively, of deposit differences greater than 180 days old.
The Fiscal Year 2002 difference is due to the Federal Reserve Bank of Atlanta reporting an EFT DebitVoucher as September 9, 2000 instead of September 9, 2002 for Disbursing Station 6944, MACOM 16.Corrective action took place in October's (Fiscal Year 2003) business.
Other DisclosuresOther Fund TypesThe Other Fund Types includes a balance of ($10,333) thousand in Deposit Funds, $27,450 thousand inSpecial Fund and Receipt accounts, and a balance remaining in two suspense accounts: (1) 21 F 3882 -($739) thousand and (2) 21 F 3886 $5,690 thousand. Please refer to Footnote 2 for further analysis.
Undisbursed Appropriation AccountThe Department of the Army's Undisbursed Appropriation Account Trial Balance (TFS 6654) reflected aCondition One negative closing balance during reporting period ending September 30, 2002 for the Account:Chemical Agents and Munitions Destruction, Defense (21 99 0390). The cause of this condition resultedfrom the Defense Civilian Pay System (DCPS) transactions being processed with incorrect fiscal years.Corrective action took place during October's business at Treasury.

Notes to Principal Statements
147
fy02
Canceling Appropriated FundsAs of September 30, 2002, $554,483 thousand of the Army's canceling Appropriated Funds were withdrawnin accordance with Treasury's policy.
Suspense/Budget Clearing AccountsDepartment of Treasury's year-end guidance directs the Department of the Army, on September 30 of eachfiscal year, to reduce uncleared suspense/budget clearing account balances to zero by transferring theirbalances to the Army's Operation and Maintenance account (21 2020). Please refer to Footnote 21 B forfurther analysis on these accounts for fiscal year 2002.
In conjunction with the Army's fiscal year 2002 year-end process, we also transferred out the ForeignCurrency Fluctuation Accounts to the Army's Operation and Maintenance account (21 2020). The followingamounts ($ in thousands) were transferred:
Accounts Amounts21 2 6763 ($ 231)21 1 6763 ($ 1,653)21 9 6763 ($ 1)
Note ReferenceSee Note Disclosure 1. I. - Significant Accounting Policies for additional discussion on financial reportingrequirements and DoD policies governing Funds with the U.S. Treasury.
Note 4. InvestmentsAs of September 30,(Amounts in thousands) 2002 2001
Amor- Amortized Marketzation (Premium/ Investments, Value Investments,
1. Intragovernmental Securities: Cost Method Discount) Net Disclosure Net
A. Marketable $0 $0 $0 $0 $0B. Non-Marketable, Par Value 0 0 0 0 0C. Non-Marketable, Market-Based 5,241 (7) 5,234 0 3,174D. Subtotal $5,241 ($7) $5,234 $0 $3,174E. Accrued Interest 6 0 6 6 19F. Total Intragovernmental Securities $5,247 ($7) $5,240 $6 $3,193
2. Other Investments: $0 $0 $0 $0 $0
3. Other Information:
Fluctuations and/or AbnormalitiesNon-Marketable Market-Based Investments for the Army increased $2,047 thousand (64%) due to the receiptof several large bequests to support various programs at the U.S. Military Academy at West Point, N.Y.

Gen
eral
Fun
d
148
FY02
Uni
ted
Sta
tes
Arm
y A
nnua
l Fin
anci
al S
tate
men
t
Other Information Related to InvestmentsArmy DisclosuresThe Army Gift Fund was established to control and account for the disbursement and use of monies donatedto the Army along with the interest received from the investment of such donations. The related earnings areallocated to appropriate Army activities to be used in accordance with the directions of the donor. Thesefunds are recorded as Non-Marketable Market-Based U.S. Treasury Securities that are not traded on anysecurities exchange, but they mirror the prices of marketable securities with similar terms.
Note ReferenceSee Note Disclosure 1.N. - Investments in U.S. Treasury for additional DoD policies governing Investmentsin U.S. Treasury Securities.
Note 5. Accounts ReceivableAs of September 30,(Amounts in thousands) 2002 2001
Gross Allowance For Accounts AccountsAmount Due Estimated Collectibles Receivable, Net Receivable, Net
1. Intragovernmental Receivables: $452,597 N/A $452,597 $727,509
2. Non-Federal Receivables the Public): 616,419 ($48,331) 568,088 362,702
3. Total Accounts Receivable: $1,069,016 ($48,331) $1,020,685 $1,090,211
4. Allowance method:The allowance for estimated uncollectible accounts was calculated by using the three-year average of FY 00to FY 02 actual out of service debt write-offs. This allowance method was implemented in FY 00.
5. Other information:
Fluctuations and/or AbnormalitiesAccounts ReceivableTotal accounts receivable dropped $69,526 thousand or 6.4% between FY 01 and FY 02. Intragovernmentalaccounts receivables decreased $274,912 thousand or 37.8% with several factors contributing to thereduction. Improvements in collection methods under the Intragovernmental Payment and Collections(IPAC) system, more aggressive management of intragovernmental receivables by accounting offices, morecomprehensive employee training, and an increase in customer involvement are all factors that improved theefficiency in managing the balance. Non-federal Receivables (From the Public) increased $205,386thousand, or 56.6%. The increase primarily resulted from recording Foreign Military Sales publicreceivables for $138,773 thousand, and realignment with DFAS Denver in the reporting of contractor debtand out of service debt.
On a related issue, the allowance for estimated uncollectibles for FY 01 was understated by $30,462thousand. The understating of the allowance for estimated uncollectibles had the effect of overstating FY 01Non-federal Receivables (From the Public), Net by that amount.

Notes to Principal Statements
149
fy02
Other Information Related to Accounts Receivables
Relevant Information For ComprehensionElimination Adjustments The Army General Fund's accounting systems do not capture trading partner data at the transaction level in amanner that facilitates trading partner aggregations. Therefore, the Army General Fund was unable toreconcile intragovernmental accounts receivable balances with its trading partners. The Department intendsto develop long-term systems improvements that will include sufficient up-front edits and controls toeliminate the need for after-the-fact reconciliations. The volume of intragovernmental transactions is so largethat after-the-fact reconciliation cannot be accomplished with the existing or foreseeable resources.
Intragovernmental Receivables Over 180 DaysThe Army General Fund had $35,306 thousand of aged intragovernmental receivables over 180 days. Of thisamount, $22,384 thousand was due from other DoD activities and $12,922 thousand was due from otherFederal Activities.
Non-federal Refunds Receivable(Amounts in thousands)
FY 2002 Non-Federal FY 2002 Non-Federal Refunds Receivable Accounts Receivable (Net) % of Net Amount$203,302 $568,088 35.8%
Note ReferenceSee Note Disclosure 1.K. - Significant Accounting Policies for additional discussion on financial reportingrequirements and DoD policies governing Accounts Receivable.
Note 6. Other AssetsAs of September 30,2002(Amounts in thousands) 2002 2001
1. Intragovernmental Other Assets:A. Advances and Prepayments $209,114 $61,560B. Other Assets 0 0C. Total Intragovernmental Other Assets $209,114 $61,560
2. Non-Federal Other Assets:A. Outstanding Contract Financing Payments $3,109,569 $3,272,775B. Other Assets (With the Public) 473,227 453,872C. Total Non-Federal Other Assets $3,582,796 $3,726,647
3. Total Other Assets: $3,791,910 $3,788,207
4. Other Information:

Gen
eral
Fun
d
150
FY02
Uni
ted
Sta
tes
Arm
y A
nnua
l Fin
anci
al S
tate
men
t
Fluctuation and/or AbnormalitiesIntragovernmental Advances and PrepaymentsThere is a $147,553 thousand, or 240%, increase in the Intragovernmental Advances and Prepayments. Itincreased from $61,560 thousand in FY 2001 to $209,114 thousand in FY 2002. These changes consists of adecrease of $16,378 thousand for the Operation and Maintenance appropriation, a decrease of $27,421thousand for the Conventional Ammunition Working Capital Fund (CAWCF), and a $189,445 thousandincrease for the Procurement appropriations. These three changes accounted for 99% of the $147,553thousand net increase.
Active Army's ProcurementThe majority of the Active Army's Procurement increase of $189,445 thousand can be attributed to the cashadvances made to the Army Working Capital Fund (AWCF). By June of 2002, fund balances available forthe operation of the AWCF fell to a level that posed the possibility of an anti-deficiency act violation. Toalleviate this problem, the Under Secretary of Defense issued a directive for the AWCF to begin advancebilling of unfilled project orders. Compliance with this directive resulted in a major portion of the 240%increase in intragovernmental advances to Other Federal Agencies.
Other Information Related to Other AssetsOther AssetsOther Assets (with the Public), which represents a material amount (more than 10 percent of the value of theline) is:
Type of Assets Amounts (in thousands)
Non-FederalOther Assets (With the Public):Advances to Others $418,726Other Assets 54,501
Totals $473,227
There was an $8,529 thousand, or 19%, increase in the amount of Other Assets, $45,972 thousand in FY2001 to $54,501 thousand in FY 2002.
The FY 2002 Other Assets amount of $54,501 thousand is a combination of $10,747 thousand increasefor two Military Construction (MILCON) projects currently under development at White Sands MissileRange, NM, and Firm Fixed Price adjustments, as directed by the Army's General Business Rules. TheseFirm Fixed Price adjustments consist of $4,920 thousand in the Missile Procurement Appropriation,$37,409 thousand in the Ammunition Procurement Appropriation, $1,350 thousand in the ResearchDevelopment, Testing and Evaluation Appropriation, and $75 thousand in the Army's MilitaryConstruction/Family Housing Appropriation.
The overall $8,529 thousand increase from FY 2001 to FY 2002 comes from an increase of $10,747thousand for the White Sands Missile Range MILCON projects; a decrease in the Firm Fixed PriceAdjustments of $3,564 thousand for the Missile Procurement and the Army's Ammunition ProcurementAppropriations; and an increase of $1,346 thousand in the Research, Development, Testing andEvaluation Appropriation.

Notes to Principal Statements
151
fy02
Outstanding Contract Financing PaymentsThe Army has reported outstanding financing payments for fixed price contracts as an advance andprepayment because under the terms of the fixed price contracts, the Army becomes liable only after thecontractor delivers the goods in conformance with the contract terms. If the contractor does not deliver asatisfactory product, the Army is not obligated to reimburse the contractor for its costs and the contractor isliable to repay the Army for the full amount of the outstanding contract financing payments. The Departmenthas completed its review of all applicable federal accounting standards; applicable public laws on contractfinancing; Federal Acquisition Regulation Parts 32, 48, and 52; and the OMB guidance in 5 CFR Part 1315,"Prompt Payment." The Department has concluded that the SFFAS No. 1, Accounting for Selected Assetsand Liabilities does not address fully or adequately the subject of progress payment accounting and isconsidering what further action is appropriate.
Advances and PrepaymentsThe buyer-side advances to others balances were adjusted upward $84,311 thousand to agree with seller-sideadvances from others on the books or other DoD reporting entities. Additionally, the buyer-side prepaymentbalances were adjusted to agree with seller-side deferred credits on the books of other DoD reporting entities.
Note ReferenceSee Note Disclosure 1. R. - Other Assets, Significant Accounting Policies for additional discussion onfinancial reporting requirements and DoD policies governing Other Assets.
Note 7. Cash and Other Monetary AssetsAs of September 30,(Amounts in thousands) 2002 2001
1. Cash $178,149 $125,789 2. Foreign Currency (non-purchased) 123,598 42,6123. Other Monetary Assets 0 04. Total Cash, Foreign Currency, & Other
Monetary Assets $301,747 $168,401
5. Other Information:
DefinitionsCash - The total of cash resources under the control of the Army, which includes coin, paper currency,purchased foreign currency, negotiable instruments, and amounts on deposit in banks and other financialinstitutions. Cash available for agency use should include petty cash funds and cash held in revolving fundsthat will not be transferred into the U.S. Government General Fund.
Foreign Currency - consists of the total U.S. dollar equivalent of non-purchased foreign currencies held inforeign currency fund accounts. Non-purchased foreign currency is limited to the Treasury Index 97X7000fund account (formerly called FT accounts).

Gen
eral
Fun
d
152
FY02
Uni
ted
Sta
tes
Arm
y A
nnua
l Fin
anci
al S
tate
men
t
Other Monetary Assets - includes gold, special drawing rights, and U.S. Reserves in the InternationalMonetary Fund. This category is principally for use by the Department of the Treasury.
Fluctuation and/or AbnormalitiesArmy cash and foreign currency increased 79% primarily in support of contingency mission OperationEnduring Freedom. Overall foreign currency increased approximately $80,986 thousand which includescurrency to pay foreign vendors and cash in the custody of foreign agents increase of $38,000 thousandprimarily in support of the Army's forward deployed tactical units.
Other Information Related to Cash and Other Monetary AssetsCash and foreign currency reported consists primarily of cash held by Disbursing Officers to carry out theirpaying, collecting and foreign currency accommodation exchange mission. Foreign currency is valued usingthe Department of Treasury Prevailing Rate of Exchange. This rate is the most favorable rate that wouldlegally be available to the U.S. Government's acquisition of foreign currency for its official disbursementsand accommodation of exchange transactions.
Note ReferenceSee Note Disclosure 1. J. - Significant Accounting Policies for additional discussion on financial reportingrequirements and DoD policies governing Foreign Currency.
Note 8. A. Direct Loan and/or Loan Guarantee Programs
1. Direct Loan and/or Loan Guarantee Programs:The entity operates the following direct loan and/or Loan guarantee program(s):Military Housing Privatization InitiativeArmament Retooling and Manufacturing Support Initiative
2. Other Information:
Other Information Related to Direct Loan and/or Loan Guarantee Programs
Relevant Information For ComprehensionArmament Retooling and Manufacturing Support InitiativeThe Armament Retooling and Manufacturing Support Initiative (ARMS), Title 10 USC 4551-4555, isdesigned to encourage commercial use of the Army's Inactive Ammunition Plants through many incentivesfor businesses willing to locate to a government ammunition production facility. These facilities’ productioncapacity is greater than the current military requirements, however this capacity could be needed in the eventof another major war. The revenues from the property rental are used to pay for the operation, maintenanceand environmental clean up at the facilities. This savings in overhead cost lowers the production cost of thegoods manufactured, and funds the environmental clean up at no cost to the government.

Notes to Principal Statements
153
fy02
The U.S. Department of Agriculture Rural Business-Cooperative Service (RBS) and the United States Armyestablished a Memorandum of Understanding (MOU) to furnish services to the Army in connection with theARMS Initiative Loan Guarantee Program (AILG) pursuant to section 195 of the Armament Retooling andManufacturing Support Act of 1992, as amended (10 U.S.C. 2501 note). The MOU is entered into pursuantto section 195 and 31 U.S.C. 1535.
The Army, by means of the ARMS Initiative legislation, has been authorized to establish a loan guaranteeprogram to facilitate commercial firms' use of specified ammunition manufacturing facilities. The Army isauthorized by Public Law 103-337, the National Defense Authorization Act for Fiscal Year 1995, to enterinto this agreement with the RBS. The RBS has the needed programmatic and administrative servicesnecessary and convenient to provide other services required to administer the AILG Program. Therefore, inorder to ensure service to the public and for protection of the federal interests and rights, it is necessary forthe Army to obtain services from the RBS.
Note 8.B. Direct Loans Obligated After FY 1991Not Applicable
Note 8.C. Total Amount of Direct Loans DisbursedNot Applicable
Note 8.D. Subsidy Expense for Post-1991 Direct LoansNot Applicable
Note 8.E. Subsidy Rate for Direct Loans Not Applicable
Note 8.F. Schedule for Reconciling Subsidy Cost Allowance Balances for Post-1991 Direct Loans
Not Applicable
Note 8.G. Defaulted Guaranteed Loans from Post-1991 GuaranteesNot Applicable

Gen
eral
Fun
d
154
FY02
Uni
ted
Sta
tes
Arm
y A
nnua
l Fin
anci
al S
tate
men
t
Note 8.H. Guaranteed Loans OutstandingAs of September 30,(Amounts in thousands)
Outstanding Principal,Guaranteed Loans, Amount of Outstanding
Loan Guarantee Program Title Face Value Principal Guaranteed
20021. Military Housing Privatization Initiative $0 $02. Armament Retooling and Mfg. Support Initiative 8,553 7,6983. Total $8,553 $7,698
20011. Military Housing Privatization Initiative $0 $02. Armament Retooling and Mfg. Support Initiative 0 03. Total $0 $0
4. Other Information:
Relevant Information For ComprehensionThis is a joint program with the USDA. Prior to FY 2002 the USDA was required to include this program inthe USDA's financial statements. In FY 2002, the USDA is not required to include this program in itsfinancial statements. Therefore, the Army is required to include it in the Department's financial statements.This is in compliance with Note 36 in the Office of Management and Budget (OMB) Form and Content,OMB Bulletin No. 01-09.
Note 8.I. Liability for Post-1991 Loan Guarantees, Present ValueAs of September 30,(Amounts in thousands) 2002 2001
Loan Guarantee Program Title1. Military Housing Privatization Initiative $0 $02. Armament Retooling and Mfg. Support Initiative 730 03. Total $730 $0
4. Other Information:None.

Notes to Principal Statements
155
fy02
Note 8.J. Subsidy Expense for Post-1991 Loan GuaranteesAs of September 30,(Amounts in Thousands)
2002 Interest Differential Defaults Fees Other Total
1. Subsidy Expense for New Direct Loans Disbursed:Military Housing Privatization Initiative $0 $0 $0 $0 $0Armament Retooling and Mfg. Initiative 0 (11) 8 5 2Total $0 ($11) $8 $5 $2
2001 Interest Differential Defaults Fees Other Total
2. Subsidy Expense for New Direct Loans Disbursed:Military Housing Privatization Initiative $0 $0 $0 $0 $0Armament Retooling and Mfg. Initiative 0 0 0 0 0Total $0 $0 $0 $0 $0
Interest Rate Technical Total2002 Modifications Reestimates Reestimates Reestimates Total
3. Direct Loan Modifications and Reestimates:Military Housing Privatization Initiative $0 $0 $0 $0 $0Armament Retooling and Mfg. Initiative 0 0 0 0 0Total $0 $0 $0 $0 $0
Interest Rate Technical Total2001 Modifications Reestimates Reestimates Reestimates Total
4. Direct Loan Modifications and Reestimates:Military Housing Privatization Initiative $0 $0 $0 $0 $0Armament Retooling and Mfg. Initiative 0 0 0 0 0Total $0 $0 $0 $0 $0
2002 20015. Total Direct Loan Subsidy Expense:
Military Housing Privatization Initiative $0 $0Armament Retooling and Mfg. Initiative 2 0Total $2 $0
6. Other Information:Other information consists of prepayments, losses other than default, and outflow other than disbursements.
Note 8.K. Subsidy Rate for Loan Guarantees Not Applicable

Gen
eral
Fun
d
156
FY02
Uni
ted
Sta
tes
Arm
y A
nnua
l Fin
anci
al S
tate
men
t
Note 8.L. Schedule for Reconciling Loan Guarantee Liability Balances for Post-1991 Loan Guarantees
Beginning Balance, Changes and Ending Balance 2002(Amounts in Thousands)
1. Beginning balance of the loan guarantee liability $0
2. Add: subsidy expense for guaranteed loans disbursed during the reporting years by component:A. Interest supplement costs $0B. Default costs (net of recoveries) (10)C. Fees and other collections 7D. Other subsidy costs 5E. Total of the above subsidy expense components $2
3. Adjustments:A. Loan guarantee modifications $0B. Fees received 0C. Interest supplements paid 0D. Foreclosed property and loans acquired 0E. Interest accumulation on the liability balance 37F. Other 691G. Total of the above adjustment $728
4. Ending balance of the loan guarantee liability before reestimates $730
5. Add or subtract subsidy reestimates by component:A. Interest rate reestimate $0B. Technical/default reestimate 0C. Total of the above reestimate components $0
6. Ending balance of the loan guarantee liability $730
7. Other Information:
Relevant Information for ComprehensionThis is a joint program with the USDA. Prior to FY 2002 the USDA was required to include this program inUSDA's financial statements. In FY 2002, the USDA is not required to include this program in its financialstatements. Therefore, the Army is required to include it in the Department's financial statements. This is incompliance with Note 36 in the Office of Management and Budget (OMB) Form and Content, OMB BulletinNo. 01-09.
"Note 36 Description of Transfers that Appear as a Reconciling Item on the Statement of Financing:
When budget authority and other resources are allocated to another agency or bureau (allocation transfer ofappropriation- see OMB Circular A-11, sections 20.4 (1) and 71.5), the following guidance applies.

Notes to Principal Statements
157
fy02
The parent (transferor of the appropriation) should report the activity in its financial statements, unless theallocation transfer is material to the child's (recipient of the transfer) financial statements. If the allocationtransfer is material to the child's financial statements, the child should report the activity relating to theallocation in all of its financial statements, except the Statement of Budgetary Resources. In this case, theparent should continue to report the appropriation and the related budgetary activity in its Statements ofBudgetary Resources. It is the responsibility of the parent to ensure that the reporting to treasury, throughFACTS I, is consistent with the presentation in the financial statements.
When the child reports material allocation transfers in its Statement of Net Cost, both the parent and the childshould report a reconciling item on their respective Statements of Financing. In their footnotes, the parentand child should provide a general description of the funds transferred to or the funds received from anotherentity, including the nature and purpose of the transfer. Agencies are encouraged to add more detail (e.g.,their trading partner/agency, bureau, and account title for each parent appropriation) as they deem necessary.
Note 8.M. Administrative ExpenseAs of September 30,(Amount in thousands) 2002 2001
1. Direct Loans:Military Housing Privatization Initiative $0 $0Armament Retooling and Mfg. Support Initiative 0 0Total $0 $0
2. Loan Guarantees:Military Housing Privatization Initiative $0 $0Armament Retooling and Mfg. Support Initiative 36 0Total $36 $0
Note 9. Inventory and Related PropertyAs of September 30, 2002 2001(Amounts in thousands)
1. Inventory, Net (Note 9.A.) $294,480 $337,5252. Operating Materials & Supplies, Net (Note 9.B.) 26,964,942 27,091,7963. Stockpile Materials, Net (Note 9.C.) 0 04. Total $27,259,422 $27,429,322

Gen
eral
Fun
d
158
FY02
Uni
ted
Sta
tes
Arm
y A
nnua
l Fin
anci
al S
tate
men
t
Note 9.A. Inventory, NetAs of September 30(Amounts in thousands) 2002 2001
Inventory, Revaluation Inventory, Inventory, Valuation1. Inventory Categories: Gross Value Allowance Net Net Method
A. Available and Purchased for Resale $57,377 ($12,958) 44,419 $80,734 LACB. Held for Repair 0 0 0 0C. Excess, Obsolete, and Unserviceable 0 0 0 0D. Raw Materials 0 0 0 0E. Work in Process 250,061 0 250,061 256,791 SPF. Total $307,438 ($12,958) 294,480 $337,525
Legend for Valuation Methods:Adjusted LAC = Latest Acquisition Cost, adjusted for holding gains and lossesNRV = Net Realizable ValueO = OtherSP = Standard PriceAC = Actual Cost
2. Restrictions of Inventory Use, Sale, or Disposition:
3. Other Information:
General Composition of InventoryInventory includes spare and repair parts, clothing and textiles, fuels, and ammunition. Inventory is tangiblepersonal property that is
1) Held for sale, or held for repair for eventual sale;
2) In the process of production for sale; or
3) To be consumed in the production of goods for sale or in the provision of services for a fee.
"Inventory held for repair" is damaged material that requires repair to make it usable. "Excess inventory" iscondemned material that must be retained for management purposes. "Work in process" includes munitionsin production and depot maintenance work with its associated labor, applied overhead, and supplies used inthe delivery of maintenance services. The USSGL does not include a separate work in process accountunrelated to sales.
Restrictions of Inventory Use, Sale or DispositionThere are no restrictions on the use, sale, or disposition of inventory except in the following situations: 1) distributions without reimbursement are made when authorized by DoD directives; 2) War Reserve Material includes fuels and subsistence items that are considered restricted; and 3) Inventory, with the exception of safety stocks, may be sold to foreign, state and local governments,private parties, and contractors in accordance with current policies and guidance or at the direction of thePresident.

Notes to Principal Statements
159
fy02
Decision Criteria for Identifying the Category to Which Operating Materials and Supplies are AssignedManagers determine which items are more costly to repair than to replace. Items retained for managementpurposes are coded "condemned." The net value of these items is zero, and is shown as "Excess, Obsolete,and Unserviceable."
Changes in the Criteria for Identifying the Category to Which Inventory is AssignedThe category "Held for Sale" includes all issuable material. The category "Held for Repair" includes alleconomically reparable material. Before FY 2002, the Department showed "Potentially re-distributable"material, regardless of condition, as "Excess, Obsolete, and Unserviceable."
Other information Related to Inventory, Net
Fluctuations and/or AbnormalitiesArmy Conventional Ammunition Working Capital Fund (CAWF)The CAWF appropriation contains the Inventory "Available and Purchased for Resale and Work in Progress."There is a 45% decrease in the Inventory, Gross Value/Available and Purchased for Resale, Inventory, Net of$36,315 thousand, from $80,734 thousand in FY 2001 to $44,419 thousand in FY 2002. The CAWFinventory will continue to drop because the CAWF is in the process of closing out. The projected date for theCAWF to complete production and delivery of all CAWF orders is set for June 2004. The CAWF orders areprojected to be final billed by October 2004 and the financial close-out of CAWF contracts is set for June2005. The final CAWF financial position then will be determined and the CAWF will close on 31 October2005. Of course these dates are not firm and most likely will change. Any slip in production, the ability toaward a contract in a timely manner, or a host of other variables could cause these dates to slip.
The majority of the CAWF work in process is being performed at the Government Owned ContractorOperated (GOCO) plants. Also, the CAWF stopped accepting new customer orders in July 1998 at whichtime Procurement Appropriation took over the acceptance of any new orders for ammunition.
Note ReferenceSee Note Disclosure 1. M. - Significant Accounting Policies for additional discussion on financial reportingrequirements and DoD policies governing Inventory and related Property.

Gen
eral
Fun
d
160
FY02
Uni
ted
Sta
tes
Arm
y A
nnua
l Fin
anci
al S
tate
men
t
Note 9.B. Operating Materials and Supplies, NetAs of September 30,(Amounts in thousands) 2002 2001
Revaluation Valuation1. OM&S Categories: OM&S Gross Value Allowance OM&S, Net OM&S, Net Method
A. Held for Use $26,964,942 $0 $26,964,942 $27,078,918 LACB. Held for Repair 0 0 0 0C. Excess, Obsolete, and Unserviceable 568,040 (568,040) 0 12,879 SPD. Total $27,532,982 ($568,040) $26,964,942 $27,091,797
Legend for Valuation Methods:Adjusted LAC = Latest Acquisition Cost, adjusted for holding gains and lossesNRV = Net Realizable ValueO = OtherSP = Standard PriceAC = Actual Cost
2. Restrictions on OM&S:The total tonnage of munitions stock, to include chemical stocks, awaiting destruction for FY 2002 and outyears is 439,384.
Army owns $5,000,000 thousand in ammunition that is under treaty agreements and is not intended for useby U.S. Forces. This ammunition is intended for use in defense of the host nation by the host nation.
3. Other Information:Adjustment for National Defense Property, Plant, and EquipmentIn accordance with the Department of Defense Inspector General (DoDIG) directive to remove FY 2001OM&S balances on the Balance Sheet for retail and wholesale guided missiles, a Prior Period Adjustmentwas prepared to remove $7,114,213 thousand in FY 2001 OM&S, and $6,747,585 thousand in FY 2002.The DoDIG's opinion is that these items should not have been reclassified as O&MS from ND PP&E on theFY 2001 financial statements, but should continue to be reported as National Defense Property, Plant, andEquipment. This restatement of FY 2001 numbers brings the Army's report in line with what was reportedon the FY 2001 Government-wide financial statements
General Composition of Operating Materials and SuppliesOperating Materials and Supplies includes spare and repair parts, ammunition, tactical missiles, aircraftconfiguration pods, and centrally managed aircraft engines.
Changes In The Criteria For Identifying The Category To Which Operating Materials And Supplies AreAssignedThe category "Held for Use" includes all issuable material. The category "Held for Repair" includes alleconomically reparable material. Before FY 2002, the Department showed "Potentially re-distributable"material, regardless of condition, as "Excess, Obsolete, and Unserviceable."
Notes to Principal Statements
161
fy02
Decision Criteria For Identifying The Category To Which Operating Materials And Supplies Are AssignedManagers determine which items are more costly to repair than to replace. Items retained for managementpurposes are coded "condemned." The net value of these items is zero, and is shown as "Excess, Obsolete,and Unserviceable."
Other Information Related to Operating Material and Supplies, Net
Fluctuations and/or AbnormalitiesTotal Excess, Obsolete and UnserviceableIn FY 2001, the Office of the Under Secretary of Defense provided us with a 1.9% figure we were to reportin the OM&S, Net column. The financial statements of the Department of Defense reflected values ofexcess, obsolete, and unserviceable inventory and operating materials and supplies that were derived from theSupply System Inventory Report (SSIR). In FY 2002, the Office of the Under Secretary of Defense advisedthe Services that they will no longer use the SSIR as the basis for its financial presentation of excess,obsolete, and unserviceable inventory. The account "Excess, Obsolete and Unserviceable" will be populatedas defined by the Military Standard Transaction Reporting and Accounting Procedures Manual (DoD4000.25-2-M). The disposal facilities will also record 100% revaluation allowance, which produces aninventory value of zero.
Relevant Information for ComprehensionGovernment Furnished Material (GFM) and Contractor Acquired Material (CAM)Generally, the value of the Army's GFM and CAM in the hands of contractors is not included in the OM&Svalues reported above. The DoD presently is reviewing its process for reporting these amounts in an effort todetermine the appropriate accounting treatment and the best method to collect and report annually requiredinformation without duplicating information already in other existing logistics systems.
Note ReferenceSee Note Disclosure 1. M. - Significant Accounting Policies for additional discussion on financial reportingrequirements and DoD policies governing Inventory and Related Property.
Note 9.C. Stockpile Materials, NetNot Applicable

Gen
eral
Fun
d
162
FY02
Uni
ted
Sta
tes
Arm
y A
nnua
l Fin
anci
al S
tate
men
t
Note 10. General PP&E, NetAs of September 30,(Amounts in thousands) 2002 2001
Depreciation/ (AccumulatedAmortization Acquisition Depreciation/ Net Prior FY Net
1. Major Asset Classes: Method Service Life Value Amortization) Book Value Book Value
A. Land N/A N/A $423,884 N/A $423,884 $389,471B. Buildings, Structures and
Facilities S/L 20 Or 40 35,376,259 ($22,393,721) 12,982,538 12,220,845C. Leasehold Improvements S/L lease term 8,731 (7,398) 1,333 554D. Software S/L 2-5 Or 10 942 (574) 368 671E. Equipment S/L 5 Or 10 2,260,798 (1,512,977) 747,821 690,381F. Assets Under Capital Lease1 S/L lease term 166,069 (110,513) 55,556 63,859 G. Construction-in-Progress N/A N/A 4,471,634 N/A 4,471,634 4,237,160H. Other 17,492 0 17,492 18,597I. Total General PP&E $42,725,809 ($24,025,183) $18,700,626 $17,621,538
1Note 15.B for additional information on Capital Leases
Legend for Valuation Methods:S/L = Straight Line N/A = Not Applicable
2. Other Information:
Relevant Information for Comprehension
The increase in Buildings, Structures, and Facilities is due to a review of the National Guard's propertysystem. During the review, the National Guard discovered that property items were coded as state ownedrather than federal owned. These corrections are reflected in the current year increase. The NationalGuard also included cost for structures not included previously in their property system.
In fiscal year 2002, the Army is reporting $8,251 thousand of land previously reported byNonappropriated Funds and Defense Logistics Agency.
The Army implemented the Defense Property Accountability System (DPAS) for Table of Distributionand Allowances (TDA) property books to account for personal property. DPAS is an automated CFO-compliant system. Notably, it captures accounting and depreciation data, and provides greater visibility ofthe Army's capital assets.
The $17,492 thousand for Other represents Natural Resources (Value of Timber Reserves).
Military Equipment (Unaudited Supplementary Information)In June 2002, the Federal Accounting Standards Advisory Board issued in draft a standard entitledEliminating the Category National Defense Property, Plant, and Equipment (ND PP&E). In addition toeliminating the category ND PP&E, this standard would rescind Statement of Federal Financial AccountingStandards (SFFAS) No. 11, Amendment to Property, Plant, and Equipment - Definitional Changes; amendsSFFAS No. 8, Supplementary Stewardship Reporting; and amends SFFAS No. 6, Accounting for Property,

Notes to Principal Statements
163
fy02
Plant, and Equipment. This standard is effective for years ending after September 30, 2002. The standardcurrently is sitting before Congress for a 45-day period in accordance with provisions of the Chief FinancialOfficers Act of 1990.
Prior standards provide for the expensing of ND PP&E when costs are incurred and the reporting of suchcosts as supplementary stewardship information. The Department of Defense has not reported the cost ofND PP&E in accordance with existing standards due to an absence of detailed cost information for propertyacquired over many decades.
The standard on eliminating the category of ND PP&E provides for the capitalization of property previouslydefined as ND PP&E and the reporting of such property as General Property, Plant, and Equipment. Inrecognition of the absence of detailed historical cost information, this standard provides that, "If obtaininginitial historical cost is not practical, estimated historical cost may be used. Other information such as butnot limited to budget, appropriation, or engineering documents and other reports reflecting amountsexpended may be used as the basis for estimating historical cost." The standard acknowledges thatimprecision may result from the use of estimates or other information.
Capitalization of property previously defined as ND PP&E will require extensive research to develop costestimates for the property inventory. The Department initiated the valuation process this fiscal year byconducting detailed reviews of three selected "pilot" programs including the Paladin Mobile Howitzer. Theobjective of this effort was the development of a valuation methodology and associated business rules, whichthe Department could use to value the balance of its military equipment. The accompanying informationsummarizes the results of the review of the Paladin program.
Valuation basisThe valuation is based on information derived from reports reflecting amounts expended on this program.
Included costs - The estimated total program costs include funds expended for procurement, research,development, test and evaluation, trainers and simulators, government furnished equipment, and other itemsincluded in the cost of the acquisition programs. The estimated portion of total program cost attributable toequipment under construction is reported as "work-in-process."
Useful life and depreciation - The estimated useful life used for the Paladin Howitzer is 20 years.Depreciation is calculated on a group basis whereby the depreciation rate is applied to the estimatedcumulative cost of the equipment "placed in service."
Estimated program cost, accumulated depreciation, and net book value for the Paladin Howitzer arepresented in the following table for disclosure purposes only. The balances have not been recorded in Army'sBalance Sheet.
(Dollars in Thousands)Paladin Mobile Howitzer Program Cost Accumulated Depreciation Net Book Value
Placed in service $ 1,802,420 ($541,660) $ 1,260,760Work in process 17,429 0 17,429
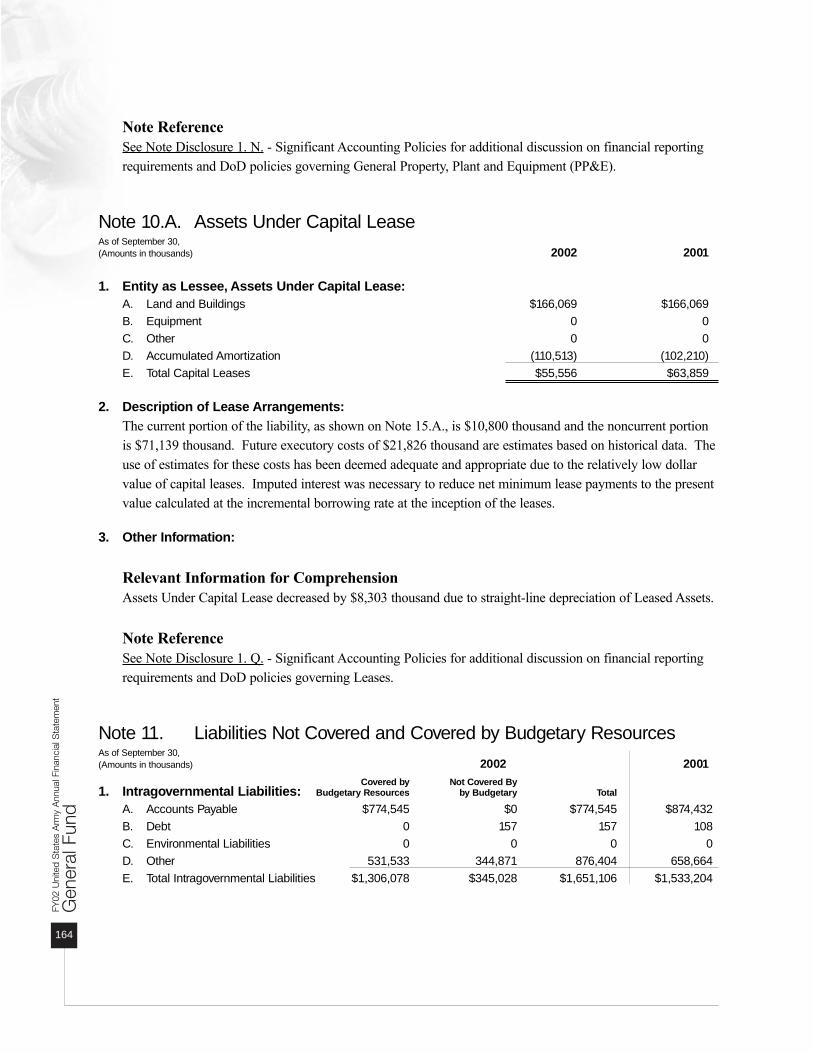
Gen
eral
Fun
d
164
FY02
Uni
ted
Sta
tes
Arm
y A
nnua
l Fin
anci
al S
tate
men
t
Note ReferenceSee Note Disclosure 1. N. - Significant Accounting Policies for additional discussion on financial reportingrequirements and DoD policies governing General Property, Plant and Equipment (PP&E).
Note 10.A. Assets Under Capital LeaseAs of September 30,(Amounts in thousands) 2002 2001
1. Entity as Lessee, Assets Under Capital Lease:A. Land and Buildings $166,069 $166,069B. Equipment 0 0C. Other 0 0D. Accumulated Amortization (110,513) (102,210)E. Total Capital Leases $55,556 $63,859
2. Description of Lease Arrangements:The current portion of the liability, as shown on Note 15.A., is $10,800 thousand and the noncurrent portionis $71,139 thousand. Future executory costs of $21,826 thousand are estimates based on historical data. Theuse of estimates for these costs has been deemed adequate and appropriate due to the relatively low dollarvalue of capital leases. Imputed interest was necessary to reduce net minimum lease payments to the presentvalue calculated at the incremental borrowing rate at the inception of the leases.
3. Other Information:
Relevant Information for ComprehensionAssets Under Capital Lease decreased by $8,303 thousand due to straight-line depreciation of Leased Assets.
Note ReferenceSee Note Disclosure 1. Q. - Significant Accounting Policies for additional discussion on financial reportingrequirements and DoD policies governing Leases.
Note 11. Liabilities Not Covered and Covered by Budgetary ResourcesAs of September 30,(Amounts in thousands) 2002 2001
Covered by Not Covered By1. Intragovernmental Liabilities: Budgetary Resources by Budgetary Total
A. Accounts Payable $774,545 $0 $774,545 $874,432B. Debt 0 157 157 108C. Environmental Liabilities 0 0 0 0D. Other 531,533 344,871 876,404 658,664E. Total Intragovernmental Liabilities $1,306,078 $345,028 $1,651,106 $1,533,204

Notes to Principal Statements
165
fy02
As of September 30,(Amounts in thousands) 2002 2001
Covered by Not Covered By2. Non-federal Liabilities: Budgetary Resources by Budgetary Total
A. Accounts Payable $5,967,178 $0 $5,967,178 $6,698,778B. Military Retirement Benefits and
Other Employment-RelatedActuarial Liabilities 0 1,624,557 1,624,557 1,646,526
C. Environmental Liabilities 0 35,078,280 35,078,280 40,071,084D. Loan Guarantee Liability 730 0 730 0E. Other Liabilities 3,843,568 5,165,176 9,008,744 6,944,358F. Total Non-Federal Liabilities $9,811,476 $41,868,013 $51,679,489 $55,360,746
3. Total Liabilities: $11,117,554 $42,213,041 $53,330,595 $56,893,950
4. Other Information:
Liabilities Not Covered and Covered by Budgetary Resources
Liabilities Not Covered by Budgetary Resources are those liabilities which are not considered covered byrealized budgetary resources as of the balance sheet date.
Liabilities Covered by Budgetary Resources are those that are incurred by the reporting entity that arecovered by realized budget resources as of the balance sheet date. Budgetary resources encompass notonly new budget authority, but also other resources available to cover liabilities for specified purposes in agiven year. Available budgetary resources include: (1) new budget authority, (2) spending authority fromoffsetting collections (credited to an appropriation or fund account), 3) recoveries of unexpired budgetauthority through downward adjustments of prior year obligations, 4) unobligated balances of budgetaryresources at the beginning of the year or net transfers of prior year balances during the year, and 5)permanent indefinite appropriations or borrowing authority, which have been enacted and signed into lawas of the balance sheet date, provided that the resources may be apportioned by the OMB without furtheraction by the Congress or without a contingency first having to be met.
A schedule is presented below to identify Army's Other Intragovernmental and Non-Federal liabilities.
Intragovernmental Liabilities-Other Amounts (in thousands)
Funded Disbursing Officer Cash $ 300,378Unemployment Comp 89,210Advances from Others 65,329Employer Contributions 52,758FECA (delinquencies) 23,985VSIP 1,034Deposit Fund Liability (1,161)
Total Funded $531,533Unfunded FECA $269,625
Judgment Fund 75,246Total Unfunded $344,871
Total Intragovernmental Liabilities - Other $876,404

Gen
eral
Fun
d
166
FY02
Uni
ted
Sta
tes
Arm
y A
nnua
l Fin
anci
al S
tate
men
t
Non-Federal Liabilities-Other Liabilities Amounts (in thousands)
Funded Accrued Payroll $2,111,116Contract Holdbacks 617,351Advances 476,385Contingent Liabilities 303,781Employer Contributions 242,389Capital Leases 81,939TERA 9,952Nonenvironmental - Other 627Deposit Fund Liability 28
Total Funded $3,843,568Unfunded Annual Leave $2,712,350
Nonenvironmental -Disposal 1,424,298Contingent Liabilities 960,000Cancelled Appropriations 68,528
Total Unfunded $5,165,176
Total Non-Federal Liabilities - Other $9,008,744
Note ReferenceFor Additional Line Item discussion, see:Note 8, Direct Loan and/or Loan Guarantee ProgramsNote 12, Accounts PayableNote 13, DebtNote 14, Environmental Liabilities and Disposal LiabilitiesNote 15, Other LiabilitiesNote 16, Commitments and ContingenciesNote 17, Military Retirement Benefits and Other Employment Related Actuarial Liabilities
Note 12. Accounts PayableAs of September 30,(Amounts in thousands) 2002 2001
Interest, Penalties, andAccounts Payable Administrative Fees Total Total
1. Intragovernmental Payables: $774,545 N/A $774,545 $874,432 2. Non-Federal Payables
(to the Public): $5,967,178 $0 5,967,178 6,698,778 3. Total 6,741,723 $0 $6,741,723 $7,573,210
4. Other Information:Intragovernmental Accounts Payable consists of amounts owed to other federal agencies for goods orservices ordered and received but not yet paid. Interest, penalties and administrative fees are not applicableto intragovernmental payables. Non-Federal Payables (to the Public) are payments to non-federalgovernment entities.

Notes to Principal Statements
167
fy02
Fluctuation and/or AbnormalityTotal Account Payable decreased $831,487 thousand (11%) between current year and prior year. Themajority of this decrease is attributable to a re-classification of liabilities in FY 2002 from Accounts Payableto Accrued Funded Payroll and Benefits for the Active Army; Military Personnel appropriation.
Other Information Related to Accounts Payable
Relevant Information for ComprehensionUndistributed DisbursementsUndistributed disbursements are the difference between disbursements/collections recorded at the detailedlevel to a specific obligation, payable, or receivable in the activity field records versus those reported by theU.S. Treasury via the reconciled DD 1329 and DD 1400. This should agree with the undistributeddisbursements reported on accounting reports (SF 133/ (M) 1002/ (M) 1307). Intransit payments arepayments that have been made for other agencies or entities that have not been recorded in their accountingrecords. These payments are applied to the entities outstanding accounts payable balance at year-end.Accounts payable were adjusted downward in the amount of $449,173 thousand for these payments.
Intragovernmental EliminationsThe majority of intra-agency sales Army accounting systems do not capture trading partner data at thetransaction level in a manner that facilitates trading partner aggregations. Therefore, the Army was unable toreconcile intragovernmental accounts payable to the related intragovernmental accounts receivable thatgenerated the payable.
The DoD summary level seller accounts receivables were compared to the Army accounts payable. Anadjustment was posted to the Army accounts payable based on the comparison with the accounts receivableof the DoD Components providing goods and services to the Army. Positive differences were treated asunrecognized accounts payable and in the case of the Army, accounts payable were adjusted upwards in theamount of $839,063 thousand.
The Department intends to develop long-term systems improvements that will include sufficient up-frontedits and controls to eliminate the need for after-the-fact reconciliations. The volume of intragovernmentaltransactions is so large that after-the-fact reconciliation cannot be accomplished with the existing orforeseeable resources.
Note ReferenceSee Note Disclosure 1. G. - Significant Accounting Policies for additional discussion on financial reportingrequirements and DoD policies governing accounting for Intragovernmental Activities.

Gen
eral
Fun
d
168
FY02
Uni
ted
Sta
tes
Arm
y A
nnua
l Fin
anci
al S
tate
men
t
Note 13. DebtAs of September 30,(Amounts in thousands) 2002 2001
1. Public Debt: Beginning Balance Net Borrowings Ending Balance Ending Balance
A. Held by Government Accounts N/A N/A N/A N/AB. Held by the Public N/A N/A N/A N/AC. Total Public Debt N/A N/A N/A N/A
2. Agency Debt:A. Debt to the Treasury $0 $0 $0 $0B. Debt to the Federal Financing Bank 0 0 0 0C. Debt to Other Federal Agencies 108 49 157 108D. Total Agency Debt $108 $49 $157 $108
3. Total Debt: $108 $49 $157 $108
4. Classification of Debt:A. Intragovernmental Debt $157 $108B. Non-Federal Debt N/A N/AC. Total Debt $157 $108
5. Other Information:
Relevant Information For ComprehensionDebt to Other Federal Agencies represents the unfunded interest payable on reimbursements to the DoDEducation Benefits Trust Fund for education benefits paid on behalf of separated Army personnel. The DoDBoard of Actuaries determined the amount of accumulated interest to be $157 thousand for FY 2002.
Note 14. Environmental Liabilities and Disposal LiabilitiesAs of September 30,(Amounts in thousands) 2002 2001
Current Noncurrent1. Environmental Liabilities: Liability Liability Total Total
A. Intragovernmental:1. Accrued Environmental Restoration
(Defense Environmental Restoration Program(DERP) funded) Costs:a. Active Installations-Environmental Restoration (ER) $0 $0 $0 $0b. Active Installations—ER for Closed Ranges 0 0 0 0c. Formerly Used Defense Sites (FUDS) —ER 0 0 0 0d. FUDS—ER for Transferred Ranges 0 0 0 0
2. Other Accrued Environmental Costs (Non-DERP funds)a. Active Installations—Environmental Corrective Action 0 0 0 0b. Active Installations—Environmental Closure Requirements 0 0 0 0c. Active Installations—Environ. Response at Active Ranges 0 0 0 0d. Other 0 0 0 0

Notes to Principal Statements
169
fy02
As of September 30,(Amounts in thousands) 2002 2001
Current Noncurrent1. Environmental Liabilities: Liability Liability Total Total
A. Intragovernmental:3. Base Realignment and Closure (BRAC)
a. BRAC Installations--Environmental Restoration (ER) 0 0 0 0b. BRAC Installations--ER for Transferring Ranges 0 0 0 0c. BRAC Installations--Environmental Corrective Action 0 0 0 0d. Other 0 0 0 0
4. Environmental Disposal for Weapon Systems Programs a. Nuclear Powered Aircraft Carriers 0 0 0 0b. Nuclear Powered Submarines 0 0 0 0c. Other Nuclear Powered Ships 0 0 0 0d. Other National Defense Weapon Systems 0 0 0 0e. Chemical Weapons Disposal Program 0 0 0 0f. Other 0 0 0 0
5. Total Intragovernmental EnvironmentalLiabilities: $0 $0 $0 $0
B. Non-Federal:1. Accrued Environmental Restoration (DERP funded) Costs:
a. Active Installations--EnvironmentalRestoration (ER) $791,062 $3,377,471 $4,168,533 $4,207,241
b. Active Installations--ER for Closed Ranges 24,514 624,922 649,436 1,812,297c. Formerly Used Defense Sites (FUDS) -- ER 281,411 4,023,445 4,304,856 3,170,282d. FUDS--ER for Transferred Ranges 114,139 11,106,176 11,220,315 14,473,400
2. Other Accrued Environmental Costs (Non-DERP funds)a. Active Installations--Environmental Corrective Action 68,127 213,114 281,241 366,528b. Active Installations--Environmental
Closure Requirements 10,609 33,956 44,565 53,098 c. Active Installations--Environ.Response at Active
Ranges 38,900 253,300 292,200 277,700 d. Other 15,160 0 15,160 0
3. Base Realignment and Closure (BRAC)a. BRAC Installations--Environmental Restoration (ER) 116,978 458,173 575,151 607,508b. BRAC Installations--ER for Transferring Ranges 11,178 356,339 367,517 398,557c. BRAC Installations--Environmental Corrective Action 22,500 49,806 72,306 71,127d. Other 269,696 0 269,696 380,839
4. Environmental Disposal for Weapons Systems Programs a. Nuclear Powered Aircraft Carriers 0 0 0 0b. Nuclear Powered Submarines 0 0 0 0c. Other Nuclear Powered Ships 0 0 0 0d. Other National Defense Weapons Systems 0 0 0 0e. Chemical Weapons Disposal Program 2,168,524 10,648,780 12,817,304 14,252,507
f. Other 0 0 0 05. Total Non-Federal Environmental Liabilities: $3,932,798 $31,145,482 $35,078,280 $40,071,084
2. Total Environmental Liabilities: $3,932,798 $31,145,482 $35,078,280 $40,071,084
Gen
eral
Fun
d
170
FY02
Uni
ted
Sta
tes
Arm
y A
nnua
l Fin
anci
al S
tate
men
t
3. Other Information:
Relevant Information For ComprehensionEnvironmental Cost LiabilitiesThe Defense Environmental Restoration Program (DERP) was established by Section 211 of the SuperfundAmendments and Reauthorization Act of 1986 codified in Title 10 of the United States Code, Section 2701.Related sections in Title 10 of the United States Code, 2701-2706 and 2810-2811, further define the program.The DERP is implemented in accordance with the Department of Defense (DoD) Directive 4715.1,Environmental Security, February 24, 1996; DoD Instruction 4715.7, Environmental Restoration Program,April 22, 1996; and the Management Guidance for the Defense Environmental Restoration Program,September 28, 2001. Environmental liabilities for the Army DERP and the Base Realignment and Closure(BRAC) are prepared in accordance with the Management Guidance for the Defense EnvironmentalRestoration Program and the DoD Financial Management Regulation (FMR) 7000.14.
The assigned estimated total cleanup cost for the current operating period is the amount of the current yearappropriation. The assigned total cleanup liability cost includes the current year budget and the total prioryear un-liquidated obligations.
There is no unrecognized portion of the estimated total cleanup cost associated with general PP&E and thereare no material changes in the total estimated liability due to changes in laws, technology, or plans. Themajor change in technology affecting the liability estimate was standardizing use of the estimating toolsconsistently across the Army programs.
The estimates used for environmental liability calculations are estimates of the cost to complete all activitiesat a site of environmental concern. The cost estimates are calculated at the site-level using a validated cost-estimating model or an engineered cost and entered into a database. There were no changes to the totalliability cost due to inflation, deflation, technology, or applicable laws and regulations.
Environmental Disposal Cost Liabilities:No Liabilities for Environmental Disposal for Weapon Systems Programs were reported by ACSIM.
Range CharacteristicsFor FY2001 and FY2002, the Army estimated that its environmental liability at closed, transferred andtransferring ranges was $16,684,254 thousand and $12,237,268 thousand respectively. Currently, the Armyis inventorying closed ranges at 430 sites, transferred ranges at 1,650 properties, and transferring ranges at 63sites.
Closed Ranges. $649,436 thousand must be expended to characterize and investigate closed ranges.Until such characterization is completed, total environmental liabilities cannot be estimated. Closedranges have been taken out of service as a range and put to new use (incompatible with range activities) orare not considered by the military to be a potential range area. A closed range is still under the control ofa DoD Component.
Transferring Ranges. Site level investigations reveal that the total environmental liability for these typesof ranges is $367,517 thousand. Transferring ranges are proposed for transfer or will be returned from

Notes to Principal Statements
171
fy02
DoD to another entity, including other federal entities.
Transferred Ranges. 1,549 out of 1,650 properties have completed range inventories and the estimatedliability for those ranges is $11,220,315 thousand. These are properties formerly used as a military rangethat are no longer under military control and have been leased by DoD, transferred, or returned from theDoD to another entity, including federal entities.
Active Ranges. At this time, the Army is conducting only one active range investigation andcharacterization, that being for the Massachusetts Military Reservation. The cost of the characterizationand investigation is $292,200 thousand. This pays for sampling and analysis, groundwater monitoring,feasibility studies, soil and groundwater cleanup, and the Unexploded Ordnance (UXO) investigation andresponse. Active ranges include military ranges that are currently in service and are being used regularly,but that are considered still by the cognizant Military Service to be a potential range area, and that havenot been put to a new use that is incompatible with range activities.
Methodology Used to Estimate Environmental LiabilitiesThe Army uses the annual cost-to-complete estimate as the basis for the environmental liability calculation.The cost-to-complete estimate is prepared for each site in the DERP in accordance with the ManagementGuidance for the DERP and the DoD FMR 7000.14.
Accrued Environmental Restoration (DERP Funded) Costs:For Active installations the cost-to-complete estimate is collected in the Defense Site EnvironmentalRestoration Tracking System (DSERTS). The current liability number is based on FY 2003 allocation andunliquidated obligations (ULOs). The ULO data are pulled from preliminary FY 2002 year-end reportsprovided by DFAS. Noncurrent liabilities include the cost-to-complete estimates from FY 2004 throughprogram completion in accordance with the Management Guidance for the DERP and the DoD FMR7000.14.
At Formerly Used Defense Site (FUDS) properties, the cost-to-complete estimate is collected in the FUDSManagement Information System (FUDMIS). The current liability number also is based on FY 2003allocation and the ULOs. The ULO data are obtained from the Corps of Engineers Financial ManagementSystem (CEFMS) for existing FUDS ULOs as of September 30. Noncurrent liabilities include the cost-to-complete estimates from FY 2004 through program completion in accordance with the ManagementGuidance for the DERP and the DoD FMR 7000.14.
Active Installations - Environmental Restoration for Closed Ranges. Noncurrent liability for EnvironmentalRestoration (ER) for closed ranges, is a developing requirement based on the results of an Army-wideinventory of all ranges. The inventory for closed ranges is 30% complete. The $624,922 thousandnoncurrent liability estimate for ER at closed ranges is the most probable cost and is based on site-level data.Estimates for closed ranges that have not been inventoried are disclosed as a possible contingent liability inNote 16.
FUDS - Environmental Restoration for Transferred Ranges. The noncurrent liability for ER for transferredranges is also based on results of an inventory of transferred ranges at 1,650 properties. The inventory oftransferred ranges is 94% complete with site-level cost data collected from 1,549 properties.

Gen
eral
Fun
d
172
FY02
Uni
ted
Sta
tes
Arm
y A
nnua
l Fin
anci
al S
tate
men
t
Other Accrued Environmental Costs (Non-DERP Funds):Active Installations - Environmental Corrective Action. Reflects the total of active projects in the Fall 01Environmental Program Requirements (EPR) data base which are reported under 1) the Law/Reg RCRA-Cwith Environmental Category (ECAT) CORA (Corrective Action), 2) the Law/Reg RCRA-D with ECATCORA, 3) the Law/Reg RCRA-I with ECAT USTR (Underground Storage Tanks) and the Law/RegSFND/CLNP (Superfund/Cleanup) with all ECATs (including those for Preliminary Assessments/SiteInvestigations, Remedial Action (CONUS Cleanup), and Removal Actions (Overseas Cleanup). The CurrentLiability total reflects costs recorded in the EPR for FY 2003, while the Noncurrent Liability total reflectstotal estimated costs for FY 2004 through FY 2015.
Active Installations - Environmental Closure Requirements. Reflects the total of active projects in the Fall01 EPR database which are reported under 1) the Law/Reg RCRA-C with ECAT CPLN (Closure Plan) and2) RCRA-D with ECAT CPLN. The Current Liability total reflects costs recorded in the EPR for FY 2003,while the Noncurrent Liability total reflects total estimated costs for FY 2004 through FY 2015.
Active installations - Environmental Response at Active Ranges. The estimated total Non-DERP liability forEnvironmental Response at Active Ranges reflects costs for the Massachusetts Military Reservation, brokenout into current and noncurrent liabilities. This includes soils and groundwater cleanup and UXO detectionand removal.
Base Realignment and Closure (BRAC):For BRAC installations the cost-to-complete estimate is collected in the Defense Sites EnvironmentalRestoration Tracking System (DSERTS). Because BRAC installations are funded separately using the BaseClosure Account, restoration liabilities are reported as Environmental Restoration; unexploded ordnanceliabilities are reported as Environmental Restoration for Transferring Ranges; and compliance liabilities arereported as Environmental Corrective Action. For current liabilities, the number is based on FY 2003allocation and the ULOs. Because prior year BRAC ULOs are not identified by individual program, BRACULOs for non-Federal liabilities are provided as "BRAC-Other." Noncurrent liabilities include the cost-to-complete estimates from FY 2004 through program completion (collected in DSERTS) in accordance withthe Management Guidance for the DERP and the DoD FMR 7000.14.
BRAC - Environmental Restoration for Transferring Ranges. The noncurrent liability for ER for transferringranges is based on results of an inventory of transferring ranges at 63 properties. The inventory oftransferring ranges is 99% complete with site-level cost data available for 62 of 63 properties.
Environmental Disposal for Weapons Systems Programs:Chemical Weapons Disposal Program: The total $12,817,304 thousand for FY 2002 is based on the probablecosts for the Program Manager for Chemical Demilitarization, the Chemical Stockpile EmergencyPreparedness Project, and the Project Manager for the Assembled Chemical Weapons, compared to the$14,252,507 thousand for FY 2001.
Year-to-Year Changes in the Liability EstimateThe estimated total Active Installations - Environmental Restoration (ER and ER for Closed Ranges) liabilityis $6,019,538 thousand and $4,817,969 thousand for FY 2001 and FY 2002 respectively. The currentestimate is a decrease from the liability reported in the most recent prior fiscal year. The major factor

Notes to Principal Statements
173
fy02
contributing to change includes increased QA/QC of program requirements. Noncurrent liability for ER forclosed ranges is a developing requirement based on the results of an Army-wide inventory of all ranges.
The estimated total FUDS - Environmental Restoration (ER and ER for Transferred Ranges) liability is$17,643,682 thousand and $15,525,171 thousand for FY 2001 and FY 2002 respectively. The currentestimate is a significant decrease from the liability reported in the most recent prior fiscal year. Major factorscontributing to the change include modifications to Remedial Action Cost Engineering Requirements(RACER) to account for varying ordnance densities at range areas (which decreased FUDS-ER TransferredRange estimate), increase in the number of Hazardous, Toxic, and Radioactive Waste (HTRW) projects, andreview of all future cost-to-complete estimates (which increased FUDS-ER estimate).
The estimated BRAC Installation - Environmental Corrective Action (current plus noncurrent) liability is$72,306 thousand for FY2002 and $71,127 thousand for FY2001. The current estimate is an increase fromthe liability reported in the most recent prior fiscal year. Major factors contributing to the change includerefinement of cost estimates and identification of new requirements due to new characterization data andregulatory negotiations.
Other InformationOthers Category Disclosure Comparative Table
Types FY2002 FY2001Amounts in Thousands Amounts in Thousands
Non-Derp - OtherLow Level Radioactive Waste Clean up $ 15,160 $ 0
BRAC - OtherPrior Year BRAC ULOs That Cannot Be Identified To A Specific Program $269,417 $380,839Low Level Radioactive Waste Clean up $ 279 $ 0
Note 15.A. Other Liabilities As of September 30,(Amounts in thousands) 2002 2001
1. Intragovernmental: Current Liability Noncurrent Liability Total TotalA. Advances from Others $65,329 $0 $65,329 $41,444B. Deferred Credits 0 0 0 0C. Deposit Funds and Suspense Account
Liabilities (1,161) 0 (1,161) 65,779D. Resources Payable to Treasury 0 0 0 6,002E. Disbursing Officer Cash 300,377 0 300,377 171,320F. Non-environmental Disposal Liabilities:
(1) National Defense PP&E (Non-nuclear) 0 0 0 0(2) Excess/Obsolete Structures 0 0 0 0(3) Conventional Munitions Disposal 0 0 0 0(4) Other 0 0 0 0

Gen
eral
Fun
d
174
FY02
Uni
ted
Sta
tes
Arm
y A
nnua
l Fin
anci
al S
tate
men
t
As of September 30,(Amounts in thousands) 2002 2001
1. Intragovernmental: Current Liability Noncurrent Liability Total TotalG. Accounts Payable-- Cancelled Appropriations 0 0 0 924H. Judgment Fund Liabilities 0 75,246 75,246 70,878I. FECA Reimbursement to the
Department of Labor 116,127 153,499 269,626 260,841J. Capital Lease Liability 0 0 0 0K. Other Liabilities 166,987 0 166,987 41,476L. Total Intragovernmental Other Liabilities $647,659 $228,745 $876,404 $658,664
2. Non-Federal:A. Accrued Funded Payroll and Benefits $2,111,116 $0 $2,111,116 $1,500,967B. Advances from Others 476,385 0 476,385 432,835C. Deferred Credits 0 0 0 0D. Loan Guarantee Liability 0 0 0 0E. Liability for Subsidy Related to
Undisbursed Loans 0 0 0 0F. Deposit Funds and Suspense Accounts 0 28 28 0G. Temporary Early Retirement Authority 9,952 0 9,952 19,525H. Non-environmental Disposal Liabilities:
(1) National Defense PP&E (Non-nuclear) 0 0 0 0(2) Excess/Obsolete Structures 0 0 0 0(3) Conventional Munitions Disposal 0 1,424,298 1,424,298 0(4) Other 627 0 627 0I. Accounts Payable--Cancelled Appropriations 0 68,528 68,528 43,357J. Accrued Unfunded Annual Leave 2,712,350 0 2,712,350 2,435,630K. Accrued Entitlement Benefits for
Military Retirees and Survivors 0 0 0 0L. Capital Lease Liability 10,800 71,139 81,939 91,874
M. Other Liabilities 1,665,611 457,910 2,123,521 2,420,170N. Total Non-Federal Other Liabilities $ 6,986,841 $2,021,903 $9,008,744 $6,944,358
3. Total Other Liabilities: $7,634,500 $2,250,648 $9,885,148 $7,603,022
4. Other Information:
Fluctuations and/or AbnormalitiesThe (Intragovernmental) Deposit Funds abnormal balance of $1,161 thousand shown for FY 2002 isattributable to a collection recorded in the Military Pay Account instead of Servicemen's Group LifeInsurance account where funds were disbursed. Corrective action has been taken to eliminate the abnormalbalance.
Other Information Related to Other Liabilities
Relevant Information for Comprehension

Notes to Principal Statements
175
fy02
Intragovernmental Liabilities
Total Intragovernmental Other Liabilities has an increase of $217,741 thousand (33%). The majority isattributable to Advances from Others, Disbursing Officer Cash, Federal Employees Compensation ActReimbursement to the Department of Labor and Other Liabilities.
Advances from Others has an increase of $23,885 thousand (58%). This increase is reported by theArmy's Research, Development, Test and Evaluation (RDTE) appropriation.
Disbursing Officer Cash has an increase of $129,058 thousand (75%) due primarily to the Army's supportof Operation Enduring Freedom during FY 2002.
Other Liabilities has an increase of $125,511 thousand (303%). This is attributable to Employercontributions (CSRS, FERS, FEGLI and FEHB) and VISP in FY 2002. In addition, $89,210 thousand inUnemployment Compensation was never reported in the statement until FY 2002.
Non-Federal Liabilities
Total Non-Federal Other Liabilities has an increase of $2,064,386 thousand (30%). The majority isattributable to Accrued Funded Payroll and Benefits, Non-environmental Disposal Liabilities forConventional Munitions Disposal, Accounts Payable--Cancelled appropriation and Accrued UnfundedAnnual Leave.
Accrued Funded Payroll and Benefits has an increase of $610,149 thousand (41%). The majority isattributable to a reclassification between Non-Federal Accounts Payable in 2001 and Accrued FundedPayroll and Benefits in 2002.
Non-environmental Disposal Liabilities for Conventional Munitions Disposal has an increase of $1,424thousand (100%) resulting from OSDC concurring with the USD (AT&L) response to a "April 2001General Accounting Office report to Senate Armed Services Committee" review directing the Army toreport this liability in FY 2002.
Accounts Payable--Cancelled Appropriation has an increase of $25,170 thousand (58%) due to areclassification from Intragovernmental to Non-Federal.
Temporary Early Retirement Authority (TERA) has a decrease of $9,573 thousand (-49%). It continuesto decrease due to the Army's downsizing prior to FY 2001.
Capital Lease Liability has a decrease of $9,935 thousand (-11%) resulting from annual straight-lineamortization.
Other (Non-Federal) Liabilities:
Other Current Liabilities consist of $502,090 thousand for Chemical Demilitarization Non-stockpile,$617,351 thousand for Contract Holdbacks, $242,389 thousand for Employer Contributions and$303,781 thousand for Contingent Liabilities.
Noncurrent Liability in the amount of $457,910 thousand is represented by Chemical DemilitarizationNon-stockpile.

Gen
eral
Fun
d
176
FY02
Uni
ted
Sta
tes
Arm
y A
nnua
l Fin
anci
al S
tate
men
t
Conventional Munitions DisposalFY 2002 is the first year conventional munitions are reported in the financial statements. The Armyclassified the total amount of Conventional Munitions Disposal as noncurrent. The current portion ofConventional Munitions Disposal was not available readily. Army is in the process of identifying the currentportion of conventional munitions disposal. The current amount will be reported in the first quarterlyfinancial statements.
Note 15.B. Capital Lease LiabilityAs of September 30,(Amounts in Thousands) 2002 2001
Asset Category1. Future Payments Due: Land and Buildings Equipment Other Total Total
A. 2003 $20,785 $0 $0 $20,785 $20,785B. 2004 20,785 0 0 20,785 20,785C. 2005 20,785 0 0 20,785 20,785D. 2006 20,785 0 0 20,785 20,785E. 2007 18,009 0 0 18,009 20,785F. After 5 Years 27,743 0 0 27,743 46,678G. Total Future Lease Payments Due $128,892 $0 $0 $128,892 $150,603H. Less: Imputed Interest
Executory Costs 46,953 0 0 46,953 58,728I. Net Capital Lease Liability $81,939 $0 $0 $81,939 $91,875
2. Capital Lease Liabilities Coveredby Budgetary Resources: $10,800 $9,935
3. Capital Lease Liabilities Not Covered by Budgetary Resources: $71,139 $81,939
4. Other Information:Capital Lease Liabilities Not Covered by Budgetary ResourcesThe Army is the lessee in eight capital leases for military family housing. All leases prior to FY 1992 arefunded on a fiscal year basis causing the noncurrent amounts to be shown as Not Covered by BudgetaryResources.
Note 16. Commitments and ContingenciesDisclosures Related to Commitments and Contingencies:
Relevant Information for ComprehensionNature of ContingencyThe Army General Fund is subject to various claims that represent contingent liabilities for the United StatesGovernment. While no opinion has been expressed regarding the likely outcome or possible loss associatedwith specific claims, experience indicates that many claims are settled for less than sought, dismissedaltogether, or the possibility of loss is remote. These liabilities are not accrued in the Army's financialstatements.

Notes to Principal Statements
177
fy02
In addition, the Army General Fund has other contingent liabilities in which the possibility of loss isconsidered reasonable. These liabilities are not accrued in the Army's financial statements. As of September30, 2002, the Army General Fund has approximately $10,154,727 thousand in claims considered reasonablypossible. These contingent liabilities and estimates are presented next.
Estimate of the Possible Liability
Title of Contingent Liabilities Estimate (Amounts in thousands)
Environmental Restoration -FUDS & Active Installations $1,070,078
Non-Stockpile Chemical Materiel Demilitarization 8,900,000
Stockpile Chemical Demilitarization Disposal 85,600
Judgment Fund Liabilities 48,000
European Environmental Claims (NATO SOFA) 40,000
Other Claims 11,049
Total $10,154,727
Note ReferenceSee Note Disclosure 1. S. - Significant Accounting Policies for additional discussion on financial reportingrequirements and DoD policies governing Contingencies and Other Liabilities.
Note 17. Military Retirement Benefits and Other Employment Related Actuarial Liabilities
As of September 30,(Amounts in Thousands) 2002 2001
Actuarial Present Assumed Less:Assets Unfunded UnfundedValue of Projected Interest Available to Actuarial Actuarial
1. Pension and Health Benefits: Plan Benefits Rate (%) Pay Benefits Liability Liability
A. Military Retirement Pensions $0 $0 $0 $0B. Military Retirement Health Benefits 0 0 0 0C. Medicare-Eligible Retiree Benefits 0 0 0 0D. Total Pension and Health Benefits $0 $0 $0 $0
2. Other:A. FECA $1,624,557 $0 $1,624,557 $1,646,526B. Voluntary Separation Incentive Programs 0 0 0 0C. DoD Education Benefits Fund 0 0 0 0D. [Enter Program Name} 0 0 0 0E. Total Other $1,624,557 $0 $1,624,557 $1,646,526
3. Total Military Retirement Benefits andOther Employment RelatedActuarial Liabilities: $1,624,557 $0 $1,624,557 $1,646,526
4. Other Information:

Gen
eral
Fun
d
178
FY02
Uni
ted
Sta
tes
Arm
y A
nnua
l Fin
anci
al S
tate
men
t
Actuarial Cost Method Used:Assumptions:Market Value of Investments in Market-based and Marketable Securities:
Military Retirement Pensions:The portion of the military retirement benefits actuarial liability applicable to the Army is reported on thefinancial statements of the Military Retirement Fund.
Military Retirement Health Benefits:Health benefits are funded centrally at the DoD level. As such the portion of the health benefits actuarialliability that is applicable to the Army is reported only on the DoD Agency-wide financial statements.
Medicare-Eligible Retiree Benefits:Not reported by Military Retirement Systems.
FECA:
Actuarial Cost Method Used: The Army's actuarial liability for workers' compensation benefits isdeveloped by the Department of Labor and provided to the Army at the end of each fiscal year. Theliability includes the expected liability for death, disability, medical, and miscellaneous costs for approvedcompensation cases. The liability is determined using a method that utilizes historical benefit paymentpatterns to predict the ultimate payments.
Assumptions: The projected annual benefit payments then are discounted to the present value using theOMB's economic assumptions for 10-year U.S. Treasury notes and bonds. Cost of living adjustments andmedical inflation factors also are applied to the calculation of projected future benefits.
Note 18. Unexpended Appropriations As of September 30,(Amounts in Thousands) 2002 2001
1. Unexpended Appropriations:A. Unobligated, Available $4,551,201 $4,333,679B. Unobligated, Unavailable 1,069,634 1,208,470C. Unexpended Obligations 25,847,886 23,353,422D. Total Unexpended Appropriations $31,468,721 $28,895,571
2. Other Information:
Relevant Information For ComprehensionUnexpended AppropriationsBeginning Fiscal Year 2002, the Unexpended Appropriations displayed on the Balance Sheet is broken outinto further subcategories such as Cumulative, Appropriations Received, Transfers-In, Transfers-Out, Used,Prior-Period Adjustments - Restated, Prior-Period Adjustments - Not Restated, and Adjustments. Due to

Notes to Principal Statements
179
fy02
system constraints, the 3100 account is still used to post undelivered orders and any residual value notincluded in the subcategories, as the appropriated attribute is not available for the other subcategories.
Unexpended ObligationsUnexpended Obligations reported as a component of Unexpended Appropriations include both UndeliveredOrders-Unpaid and Undelivered Orders-Paid only for Direct Appropriated funds. This amount is distinctfrom Change in Amount of Goods, Services, and Benefits Ordered but Not Yet Provided of the Statement ofFinancing, which includes the change during the fiscal year in Unexpended Obligations against budgetauthority from all services.
Note 19.A. General Disclosures Related to the Statement of Net CostDisclosures Related to the Statement of Net Cost The Consolidated Statement of Net Cost in the federal government is unique because its principles are drivenon understanding the net cost of programs and/or organizations that the federal government supports throughappropriations or other means. This statement provides gross and net cost information that can be related tothe amount of output or outcome for a given program and/or organization administered by a responsiblereporting entity. The amounts presented in the Statement of Net Cost (SoNC) are based on funding,obligation, accrual and disbursing transactions, which are not recorded always using accrual accounting.Army systems do not record always the transactions on an accrual basis as is required by the generallyaccepted accounting principles. The information presented also includes data from non-financial feedersystems to capture all cost and financing sources for the Army.
The Statement of Net Cost is unable to report earned revenues and costs consistent with performance goalsand measures in accordance with Federal accounting standards. The Army is unable to capture costaccounting information because of inadequate cost accounting systems; as a result, the Army reports earnedrevenues and costs by nine major appropriation categories.
Note 19.B. Gross Cost and Earned Revenue by Budget Functional Classification
Not Applicable
Note 19.C. Gross Cost to Generate Intragovernmental Revenue and Earned Revenue (Transactions with Other Federal-Non-DoD-Entities) by Budget Functional Classification
Not Applicable

Gen
eral
Fun
d
180
FY02
Uni
ted
Sta
tes
Arm
y A
nnua
l Fin
anci
al S
tate
men
t
Note 19.D. Imputed Expenses As of September 30,(Amount in thousands) 2002 2001
1. Civilian (e.g., CSRS/FERS) Retirement $261,042 $263,410 2. Civilian Health 330,812 408,191 3. Civilian Life Insurance 1,425 1,340 4. Military Retirement Pension 0 0 5. Military Retirement Health 0 0 6. Judgment Fund 94,980 68,649 7. Total Imputed Expenses $688,259 $741,590
Note 19.E. Benefit Program Expenses Not Applicable
Note 19. F. Exchange Revenue Disclosures Related to the Exchange Revenue: Not Applicable
Note 19.G. Amounts for Foreign Military Sales (FMS) Program Procurements from Contractors
Disclosures Related to Amounts for FMS Program Procurements from Contractors:Not Applicable
Note 19.H. Stewardship AssetsDisclosures Related to Stewardship Assets:Stewardship assets include Heritage Assets, Stewardship Land, Non-Federal Physical Property, Investmentsin Research and Development, and Military Equipment Deferred Maintenance. The current year cost ofacquiring, constructing, improving, reconstructing, or renovating stewardship assets are included in theStatement of Net Cost. Material yearly investment amounts related to stewardship assets are provided in theRequired Supplemental Stewardship Information section of this financial statement.
Note 19.I. Intragovernmental Revenue and ExpenseDisclosures Related to Intragovernmental Revenue and Expense:Intragovernmental Revenue. The Army's accounting systems do not capture trading partner data at thetransaction level in a manner that facilitates trading partner aggregations. Therefore, the Army was unable toreconcile intragovernmental revenue balances with its trading partners. The Department intends to developlong-term systems improvements that will include sufficient up-front edits and controls to eliminate the needfor after-the-fact reconciliations. The volume of intragovernmental transactions is so large that after-the-fact
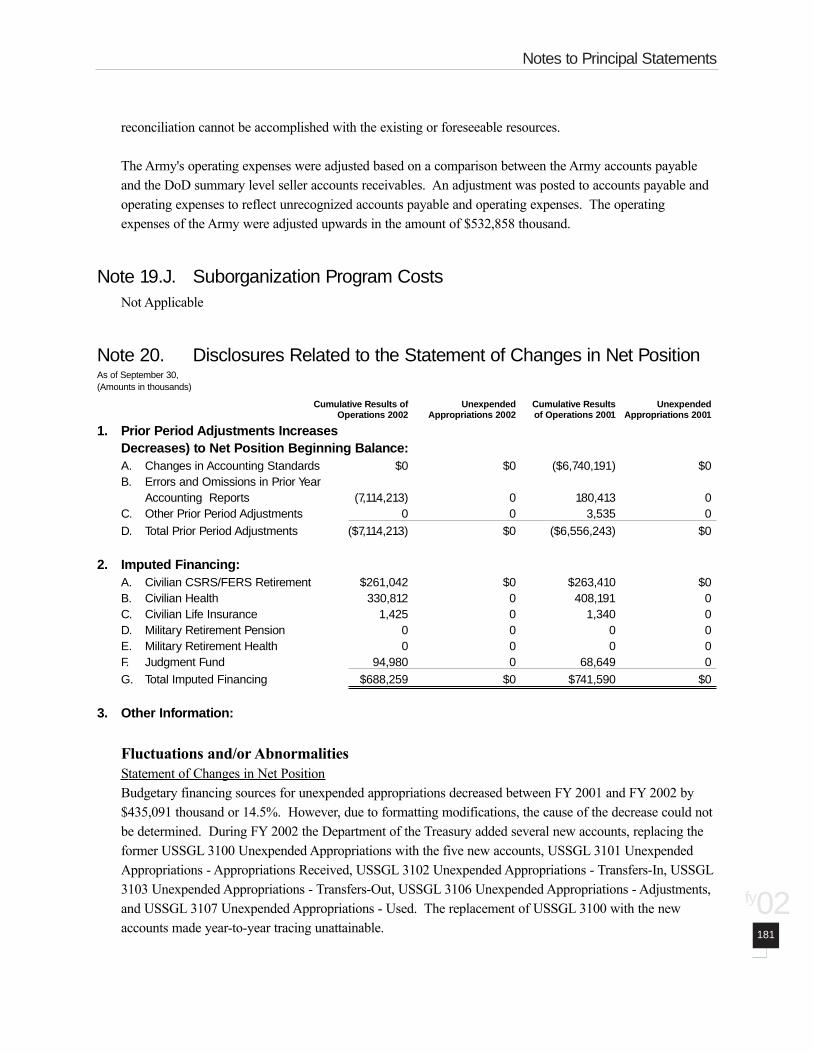
Notes to Principal Statements
181
fy02
reconciliation cannot be accomplished with the existing or foreseeable resources.
The Army's operating expenses were adjusted based on a comparison between the Army accounts payableand the DoD summary level seller accounts receivables. An adjustment was posted to accounts payable andoperating expenses to reflect unrecognized accounts payable and operating expenses. The operatingexpenses of the Army were adjusted upwards in the amount of $532,858 thousand.
Note 19.J. Suborganization Program CostsNot Applicable
Note 20. Disclosures Related to the Statement of Changes in Net PositionAs of September 30,(Amounts in thousands)
Cumulative Results of Unexpended Cumulative Results UnexpendedOperations 2002 Appropriations 2002 of Operations 2001 Appropriations 2001
1. Prior Period Adjustments Increases Decreases) to Net Position Beginning Balance:A. Changes in Accounting Standards $0 $0 ($6,740,191) $0 B. Errors and Omissions in Prior Year
Accounting Reports (7,114,213) 0 180,413 0 C. Other Prior Period Adjustments 0 0 3,535 0 D. Total Prior Period Adjustments ($7,114,213) $0 ($6,556,243) $0
2. Imputed Financing:A. Civilian CSRS/FERS Retirement $261,042 $0 $263,410 $0 B. Civilian Health 330,812 0 408,191 0 C. Civilian Life Insurance 1,425 0 1,340 0 D. Military Retirement Pension 0 0 0 0 E. Military Retirement Health 0 0 0 0 F. Judgment Fund 94,980 0 68,649 0G. Total Imputed Financing $688,259 $0 $741,590 $0
3. Other Information:
Fluctuations and/or AbnormalitiesStatement of Changes in Net PositionBudgetary financing sources for unexpended appropriations decreased between FY 2001 and FY 2002 by$435,091 thousand or 14.5%. However, due to formatting modifications, the cause of the decrease could notbe determined. During FY 2002 the Department of the Treasury added several new accounts, replacing theformer USSGL 3100 Unexpended Appropriations with the five new accounts, USSGL 3101 UnexpendedAppropriations - Appropriations Received, USSGL 3102 Unexpended Appropriations - Transfers-In, USSGL3103 Unexpended Appropriations - Transfers-Out, USSGL 3106 Unexpended Appropriations - Adjustments,and USSGL 3107 Unexpended Appropriations - Used. The replacement of USSGL 3100 with the newaccounts made year-to-year tracing unattainable.
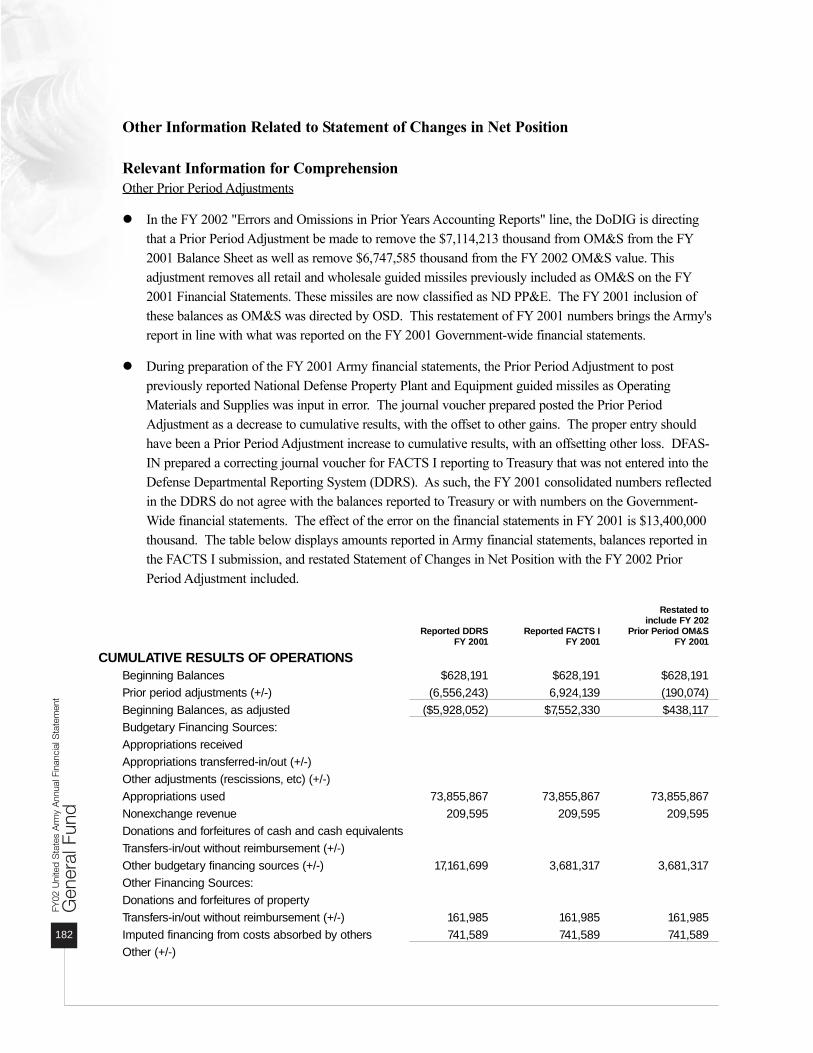
Gen
eral
Fun
d
182
FY02
Uni
ted
Sta
tes
Arm
y A
nnua
l Fin
anci
al S
tate
men
t
Other Information Related to Statement of Changes in Net Position
Relevant Information for ComprehensionOther Prior Period Adjustments
In the FY 2002 "Errors and Omissions in Prior Years Accounting Reports" line, the DoDIG is directingthat a Prior Period Adjustment be made to remove the $7,114,213 thousand from OM&S from the FY2001 Balance Sheet as well as remove $6,747,585 thousand from the FY 2002 OM&S value. Thisadjustment removes all retail and wholesale guided missiles previously included as OM&S on the FY2001 Financial Statements. These missiles are now classified as ND PP&E. The FY 2001 inclusion ofthese balances as OM&S was directed by OSD. This restatement of FY 2001 numbers brings the Army'sreport in line with what was reported on the FY 2001 Government-wide financial statements.
During preparation of the FY 2001 Army financial statements, the Prior Period Adjustment to postpreviously reported National Defense Property Plant and Equipment guided missiles as OperatingMaterials and Supplies was input in error. The journal voucher prepared posted the Prior PeriodAdjustment as a decrease to cumulative results, with the offset to other gains. The proper entry shouldhave been a Prior Period Adjustment increase to cumulative results, with an offsetting other loss. DFAS-IN prepared a correcting journal voucher for FACTS I reporting to Treasury that was not entered into theDefense Departmental Reporting System (DDRS). As such, the FY 2001 consolidated numbers reflectedin the DDRS do not agree with the balances reported to Treasury or with numbers on the Government-Wide financial statements. The effect of the error on the financial statements in FY 2001 is $13,400,000thousand. The table below displays amounts reported in Army financial statements, balances reported inthe FACTS I submission, and restated Statement of Changes in Net Position with the FY 2002 PriorPeriod Adjustment included.
Restated toinclude FY 202
Reported DDRS Reported FACTS I Prior Period OM&SFY 2001 FY 2001 FY 2001
CUMULATIVE RESULTS OF OPERATIONSBeginning Balances $628,191 $628,191 $628,191Prior period adjustments (+/-) (6,556,243) 6,924,139 (190,074)Beginning Balances, as adjusted ($5,928,052) $7,552,330 $438,117 Budgetary Financing Sources:Appropriations receivedAppropriations transferred-in/out (+/-)Other adjustments (rescissions, etc) (+/-)Appropriations used 73,855,867 73,855,867 73,855,867Nonexchange revenue 209,595 209,595 209,595Donations and forfeitures of cash and cash equivalentsTransfers-in/out without reimbursement (+/-)Other budgetary financing sources (+/-) 17,161,699 3,681,317 3,681,317Other Financing Sources:Donations and forfeitures of propertyTransfers-in/out without reimbursement (+/-) 161,985 161,985 161,985Imputed financing from costs absorbed by others 741,589 741,589 741,589Other (+/-)

Notes to Principal Statements
183
fy02
Restated toinclude FY 202
Reported DDRS Reported FACTS I Prior Period OM&SFY 2001 FY 2001 FY 2001
CUMULATIVE RESULTS OF OPERATIONSTotal Financing Sources $92,130,735 $78,650,353 $78,650,353Net Cost of Operations (+/-) 77,426,083 77,426,083 77,426,083Ending Balances $8,776,600 $8,776,600 $1,662,387
Other Army General Fund DisclosuresImputed Financing:
Civilian Health decreased by $77,379 thousand or 19% between FY 2001 and FY 2002. The decreasewas attributable to a decrease in Federal Employee Health Benefit enrollment of 40,957 enrollees.
Judgment Fund increased by $26,331 thousand or 38% between FY 2001 and FY 2002. The increase wasattributable largely to a $31,169 thousand or 33% increase in payments to settle tort claims.
Note 21.A. Disclosures Related to the Statement of Budgetary ResourcesAs of September 30,(Amounts in thousands) 2002 2001
1. Net Amount of Budgetary Resources Obligated forUndelivered Orders at the End of the Period $31,241,578 $29,084,306
2. Available Borrowing and Contract Authority at theEnd of the Period $0 $0
3. Other Information:
Statement PresentationIn fiscal year 2002, the following two enhancements were made to the Statement of Budgetary Resources tofacilitate the reconciliation of information between the Statement of Budgetary Resources, the budgetexecution reports (SF 133) and the Budget of the United States Government:
Separate Column for Non-budgetary Credit Program Financing Accounts. This change allows for a cleardistinction between budgetary and non-budgetary credit program financing account information. Non-budgetary credit financing accounts are reported separately from the budgetary totals in the Budget of theUnited States Government. Separate reporting on the Statement of Budgetary Resources enhances thereconciliation of the two sets of information.
Offsetting Receipts Line. Offsetting Receipts are introduced as a new line item in the Statement ofBudgetary Resources. These receipts are collections that are credited to the general, special or trust fundsreceipt accounts. In addition, they represents offsetting receipts distributed to the Department of theArmy. Offsetting receipts offset budget authority and outlays at the agency level in the Budget of UnitedStates Government. Offsetting receipts must be included in the Statement of Budgetary Resources toreconcile it to information in the Budget of the United States Government.

Gen
eral
Fun
d
184
FY02
Uni
ted
Sta
tes
Arm
y A
nnua
l Fin
anci
al S
tate
men
t
Intra-entity TransactionsThe Statement of Budgetary Resources does not include intra-entity transactions because the statements arepresented as combined and combining. A Disaggregated Statement of Budgetary Resources is presented inthe Required Supplementary Information section of the financial statements. Additionally, UndeliveredOrders presented in the Statement of Budgetary Resources includes Undelivered Orders-Unpaid for bothdirect and reimbursable funds.
Fluctuations and/or AbnormalitiesStatement of Budgetary Resources In fiscal year 2002, the Statement of Budgetary Resources presentation changed to closely follow the Reporton Budget Execution (SF 133). Balances increased primarily as a result of additional funding for fightingterrorism throughout the World. During fiscal year 2002, the Army received supplemental funding from theEmergency Response Fund for $3,842,000 thousand and the Counter-Terrorism & Operational ResponseTransfer Fund for $47,665 thousand to aid in their efforts. In addition, the Department of the Army receiveda new treasury appropriation warrant in Fiscal Year 2002 of $194,400 thousand for further recovery from andresponse to the terrorist attacks on the United States. This recovery and effort increased Army's fundingconsiderably from fiscal year 2001.
Accounting Standard U.S. Standard General LedgerThe Department has not implemented fully the U.S. Standard General Ledger (USSGL) in all operationalaccounting systems. The Department of the Army uses the Federal Agencies' Centralized Trial BalanceSystem II (FACTS II) to populate their Statement of Budgetary Resources. FACTS II collects pre-closing,adjusted trial balance (ATB) data by U.S. Standard General Ledger (SGL) accounts and SGL attributes foreach fund symbol. The SGL accounts reported by FACTS II are budgetary, 4000 series SGL accounts.
Beginning Balance AdjustmentsThe Department of the Army's beginning balances for Fiscal Year 2002 FACTS II submission were adjustedbetween reimbursable and direct for Undelivered Orders - Unpaid and Accounts Payable because accountingtransactions such as MOCAS accruals and Undistributed, do not include direct or reimbursable codes. Theadjustments were prorated in FACTS II with a zero affect to the bottom-line general ledger account to keepthe Statement of Budgetary Resources and the Report of Execution (SF 133) in agreement between directand reimbursable.
Ending Balance AdjustmentsThe ending balances for Undelivered Orders - Unpaid and Accounts Payable reported in the Statement ofBudgetary Resources varied from the FACTS II submission because of the "Elimination process" and the"Data Call" information reported for the Voluntary Early Retirement Authority and the Voluntary SeparationIncentive Pay (VERA/VSIP), Unemployment Compensation, Civil Service Retirement System (CSRS)/Federal Employee Retirement System (FERS)/Federal Employee Group Life Insurance (FEGLI) /FederalEmployee Health Benefits (FEHB) and Worker's Compensation. The effect of these adjustments on theArmy's books amounted to $545,625 thousand for eliminations, $1,033 thousand for VERA/VSIP, $89,210thousand for Unemployment Compensation, $52,758 thousand for CSRS/FERS/FEGLI/FEHB and $23,984thousand for Worker's Compensation. In addition, the ending balances for Undelivered Orders - Paid and

Notes to Principal Statements
185
fy02
Expended Authority reported in the Statement of Budgetary Resources were changed by $36,132 thousandfor the elimination process. The accounting adjustments are deemed necessary since the elimination processdirects "seller-side rule" which forces the Army to modify their accounting records to agree with the seller'sbooks and the booking of data call information not found in the FACTS II submission. Overall, theadjustments do not affect bottom-line totals.
Other Information Related to the Statement of Budgetary ResourcesSpending Authority from Offsetting CollectionsAdjustments in funds that are temporarily not available pursuant to Public Law, and those that arepermanently not available are not included in the "Spending Authority From Offsetting Collections" line onthe Statement of Budgetary Resources or the "Spending Authority for Offsetting Collections and Recoveries"line on the Statement of Financing.
Note 21.B. Disclosures Related to Problem Disbursements, In-transit Disbursements and Suspense/Budget Clearing Accounts
As of September 30,(Amounts in thousands)
(Decrease)/Increase1. Total Problem Disbursement Sep 2000 Sep 2001 Sep 2002 from 2001 to 2002
A. Absolute Unmatched Disbursements $261,092 $228,878 $160,726 ($68,152)B. Negative Unliquidated Obligations 133,477 34,245 20,985 (13,260)
2. Total In-transit Disbursements, Net $968,596 $910,960 $710,194 ($200,766)
3. Other Information Related to Problem Disbursements and In-transit Disbursements
Fluctuations and /or AbnormalitiesBeginning in fiscal year 2002, the presentation for Total Problem Disbursements changed to breakoutUnmatched Disbursement (UMDs) and Negative Unliquidated Obligations (NULOs) and report them asabsolute value. In previous years, Problem Disbursements displayed as a single "net" total. Due to thischange in presentation, the Department of the Army reinstated amounts displayed in fiscal year 2000 and2001 to represent "absolute value." In addition, the following schedule is included to show further analysisby "net" value.
Sep 2000 Sep 2001 Sep 2002Amounts in Thousands (Net)
UMDs $149,897 $111,738 $133,251NULOs $133,477 $34,244 $20,985In-transit $968,596 $910,960 $710,194
The elimination of both problem and aged in-transit disbursements is a high financial management priorityfor the Army. The balances represent a financial management concern since: (1) accuracy of accountingreports is affected; (2) availability of funds is more difficult to determine; and (3) the required research andresolution process becomes much more labor intensive as the ages of the problem disbursements increase.Performance metrics have been established and the Army has exceeded consistently the goals as each entitycontinues to strive towards minimizing these problems.

Gen
eral
Fun
d
186
FY02
Uni
ted
Sta
tes
Arm
y A
nnua
l Fin
anci
al S
tate
men
t
Other Information Related to Problem Disbursements and In-transit Disbursement
Relevant Information for ComprehensionProblem DisbursementsProblem disbursements are classified in three major categories - unmatched disbursements (UMDs), negativeunliquidated obligations (NULOs) and intransit disbursements. A UMD occurs when a payment is notmatched to a corresponding obligation in the accounting system. A NULO occurs when a payment is madeagainst a valid obligation, but the payment is greater than the amount of the obligation recorded in the officialaccounting system. In-transit disbursements generally represent payments made by a disbursing activity onbehalf of an accountable activity that has not attempted to post the disbursement to the accounting system.
For Fiscal Year 2002, the Department of the Army has $160 thousand in aged UMDs, $20 thousand in agedNULOs, and $710 thousand in aged in-transit disbursements that represent disbursements of Department ofthe Army's funds that have been reported by a disbursing station to the Department of the Treasury, but haveyet to be matched precisely against the specific source obligation giving rise to the disbursements.
4. Suspense/Budget Clearing (Decrease)/IncreaseAccounts, Net Sep 2000 Sep 2001 Sep 2002 from 2001 to 2002
F3875 $0 $0 $0 $0F3880 2,600 1,994 0 (1,994)F3882 0 0 (739) ( 739)F3885 0 0 0 0F3886 0 5,162 5,690 528Total $2,600 $7,156 $4,951 $(2,205)
5. Other Information Related to Suspense/Budget Clearing Accounts:
Fluctuations and/or AbnormalitiesThe Department of the Army has made a concerted effort to reduce balances in the suspense andbudget/clearing accounts related to disbursements. Additionally, the Department of the Army establishedpolicies and procedures to ensure accurate and consistent use of these accounts. The information presentedindicates a significant reduction from fiscal year 2001 of $1,994 thousand in the Army's suspense accountF3880, Unavailable Check Cancellation.
On 30 September of each fiscal year, most of the uncleared suspense/budget clearing account balances arereduced to zero (as required by the Department of the Treasury) by transferring the balances to properappropriation accounts. On 1 October of the following year, the uncleared suspense/clearing accountbalances are reestablished. The Department of the Army transferred the following accounts to theirOperation and Maintenance account (21 2020) for fiscal year 2002:
Account AmountAmounts in Thousands
21 F3875 $56, 09121 F3880 $4,37621 F3885 $16,494

In addition, Budget Clearing Accounts such as the Uniformed Service TSP (F3882) and Federal EmployeesRetirement System (F3886) remain open at fiscal year end.
The Army shows an abnormal Budget Clearing balance in their Uniformed Service account, which meansthat more money was disbursed (invested) than collected from military service members. The Federal ThriftRetirement Board contracts with the Department of Agriculture National Finance Center (NFC) to managethe disbursements for investment. The Department of the Army is making every effort to reconcile thisaccount and establish a proper audit trail to ensure that variances do not exist between collections anddisbursements.
Other Information Related to Suspense Budget Clearing AccountsDeposit FundDeposit fund accounts hold non-government monies for individual statutory authorizations or programs. On30 September, the Department of the Army's net amount in the deposit fund accounts was ($10,333)thousand. Please refer to Footnote 2, Intragovernmental Assets - Fund Balance with Treasury for furtherexplanation on deposits and suspense/budgetary clearing accounts.
Note 22. Disclosures Related to the Statement of FinancingDisclosures Related to the Statement of Financing: The statement of financing was expanded to further articulate and detail the relationship between netobligations from budgetary accounting and net cost of operations from proprietary accounting. Some itemsthat were reported last year as a single line were subdivided to reflect its components. Several new line itemswere added to identify separately and further explain the use of resources to finance net obligations or netcost of operations. This change notes key differences between the net obligations and net cost of operations.
"Net Cost of Operations" in the 2001 column of the Statement of Financing shows $75,107,669 thousand,compared to $77,426,083 thousand in the Statement of Net Cost, and the amount reflected on the FY 2001financial statements. Improper posting of the change in unfunded liability during preparation of the FY 2001financial statements created a $2,250,468 thousand difference. Incorrectly posting the change in FY 2001 ofthe actuarial liability contributed $72,124 thousand to the difference. The remaining $-4,178 thousanddifference was caused by other account mapping differences.
Budgetary data is not in agreement with Proprietary Expenses and Assets Capitalized. A $1,876,534thousand correcting entry was made to "Revaluation of assets or liabilities" to bring the Statement ofFinancing into balance with the Statement of Net Cost. Differences between budgetary and proprietary datafor the Army are a previously identified deficiency.
Intra-entity transactions have not been eliminated because the statements are presented as combined andcombining.
Notes to Principal Statements
187
fy02

Gen
eral
Fun
d
188
FY02
Uni
ted
Sta
tes
Arm
y A
nnua
l Fin
anci
al S
tate
men
t
Note 23. Disclosures Related to the Statement of Custodial ActivityDisclosures Related to the Statement of Custodial Activity: Not Applicable
Note 24.A. Other Disclosures
1. ENTITY AS LESSEE-Operating LeasesA. Description of lease arrangements:
Other Information Related to Entity as Lessee - Operating Leases
Relevant Information for ComprehensionDescription - Operating lease amounts are for Section 801 Family Housing.
Lease Period - The lease periods vary.
Lease Terms - Leases are not expected to be renewed at the end of the lease term. There are no material escalation clauses or contingent rental restrictions.
Other InformationDefinitionsLessee - A person or entity that receives the use and possession of leased property (e.g. real estateor equipment) from a lessor in exchange for a payment of funds.
Operating Lease - A lease that does not transfer substantially all the benefits and risk of ownership.Payments should be charged to expense over the lease term as it becomes payable.
As of September 30,(Amounts in thousands) 2002 2001
B. Future Payments Due: Asset Asset AssetFiscal Year Category 1 Category 2 Category 3 Total Total
2003 $0 $8,917 $0 $8,917 $13,6952004 0 7,610 0 7,610 11,1862005 0 6,613 0 6,613 8,9172006 0 6,303 0 6,303 7,6102007 0 6,298 0 6,298 6,613After 5 Years 0 24,910 0 24,910 37,509
Total Future Lease Payments Due $0 $60,651 $0 $60,651 $85,530

2. ENTITY AS LESSOR:A. Capital Leases:
1. Description of lease arrangements:
As of September 30,(Amounts in thousands) 2002 2001
2. Future Projected Receipts, Asset Asset AssetCapital Leases Category 1 Category 2 Category 3 Total Total
Fiscal Year2003 $0 $0 $0 $0 $02004 0 0 0 0 02005 0 0 0 0 02006 0 0 0 0 02007 0 0 0 0 0After 5 Years 0 0 0 0 0
Total Future Capital LeaseReceivables $0 $0 $0 $0 $0
B. Operating Leases:1. Description of lease arrangements:
As of September 30,(Amounts in thousands) 2002 2001
2. Future Projected Receipts: Asset Asset AssetCategory 1 Category 2 Category 3 Total Total
Fiscal Year2003 $0 $0 $0 $0 $02004 0 0 0 0 02005 0 0 0 0 02006 0 0 0 0 02007 0 0 0 0 0After 5 Years 0 0 0 0 0
Total Future Operating LeaseReceivables $0 $0 $0 $0 $0
Note 24.B. Other Disclosures Not Applicable
Notes to Principal Statements
189
fy02

Gen
eral
Fun
d
190
FY02
Uni
ted
Sta
tes
Arm
y A
nnua
l Fin
anci
al S
tate
men
t

Consolidating Balance Sheet
The accompanying notes are an integral part of these statements.
191
fy02
Department of Defense • Department of the Army As of September 30, 2002 and 2001 ($ in thousands)
Active Army
$35,589,866
5,240 423,834 207,289
$36,226,229 $301,747
512,502 0
27,259,422 16,872,144 3,458,037
$84,630,081
$715,168 157
0824,437
$1,539,762 $5,275,478
1,312,467 35,078,280
730 8,347,691
$51,554,408
$28,543,070 4,532,603
$33,075,673
$84,630,081
Army Reserve
$1,346,258
017,103
848 $1,364,209
$0
19,273 00
1,206,710 4,178
$2,594,370
$27,003 00
8,562 $35,565
$362,541
52,147 00
205,691
$655,944
$683,764 1,254,662
$1,938,426
$2,594,370
Army National Guard
$2,574,399
060,749
982 $2,636,130
$0
36,313 00
621,772 120,581
$3,414,796
$81,463 00
43,410 $124,873 $329,159
259,943 00
455,362
$1,169,337
$2,241,887 3,572
$2,245,459
$3,414,796
1. ASSETS (Note 2)A. Intragovernmental:
1. Fund Balance with Treasury(Note 3)
2. Investments (Note 4)3. Accounts Receivable (Note 5)4. Other Assets (Note 6)5. Total Intragovernmental Assets
B. Cash and Other Monetary Assets(Note 7)
C. Accounts Receivable (Note 5)D. Loans Receivable (Note 8)E. Inventory and Related Property (Note 9)F. General Property, Plant and Equipment
(Note 10)G. Other Assets (Note 6)
2. TOTAL ASSETS
3. LIABILITIES (Note 11)A. Intragovernmental:
1. Accounts Payable (Note 12)2. Debt (Note 13)3. Environmental Liabilities (Note 14)4. Other Liabilities (Notes 15 and 16)5. Total Intragovernmental Liabilities
B. Accounts Payable (Note 12)C. Military Retirement Benefits and
Other Employment-Related ActuarialLiabilities (Note 17)
D. Environmental Liabilities (Note 14)E. Loan Guarantee Liability (Note 8)F. Other Liabilities (Notes 15 and 16)
4. TOTAL LIABILITIES
5. NET POSITIONA. Unexpended Appropriations (Note 18)B. Cumulative Results of Operations
6. TOTAL NET POSITION
7. TOTAL LIABILITIES AND NETPOSITION
Combined Total
$39,510,523
5,240 501,686 209,119
$40,226,568 $301,747
568,088 0
27,259,422 18,700,626 3,582,796
$90,639,247
$823,634 157
0876,409
$1,700,200 $5,967,178
1,624,557 35,078,280
730 9,008,744
$53,379,689
$31,468,721 5,790,837
$37,259,558
$90,639,247

Gen
eral
Fun
dFY
02 U
nite
d S
tate
s A
rmy
Ann
ual F
inan
cial
Sta
tem
ent
192
Consolidating Balance SheetT
he a
ccom
pany
ing
note
s ar
e an
inte
gral
par
t of t
hese
sta
tem
ents
.
Department of Defense • Department of the Army As of September 30, 2002 and 2001 ($ in thousands)
1. ASSETS (Note 2)A. Intragovernmental:
1. Fund Balance with Treasury(Note 3)
2. Investments (Note 4)3. Accounts Receivable (Note 5)4. Other Assets (Note 6)5. Total Intragovernmental Assets
B. Cash and Other Monetary Assets(Note 7)
C. Accounts Receivable (Note 5)D. Loans Receivable (Note 8)E. Inventory and Related Property (Note 9)F. General Property, Plant and Equipment
(Note 10)G. Other Assets (Note 6)
2. TOTAL ASSETS
3. LIABILITIES (Note 11)A. Intragovernmental:
1. Accounts Payable (Note 12)2. Debt (Note 13)3. Environmental Liabilities (Note 14)4. Other Liabilities (Notes 15 and 16)5. Total Intragovernmental Liabilities
B. Accounts Payable (Note 12)C. Military Retirement Benefits and Other
Employment-Related Actuarial Liabilities(Note 17)
D. Environmental Liabilities (Note 14)E. Loan Guarantee Liability (Note 8)F. Other Liabilities (Notes 15 and 16)
4. TOTAL LIABILITIES
5. NET POSITIONA. Unexpended Appropriations (Note 18)B. Cumulative Results of Operations
6. TOTAL NET POSITION
7. TOTAL LIABILITIES AND NETPOSITION
Eliminations
$0 0
49,089 5
$49,094 $0
0000
0
$49,094
$49,089 005
$49,094 $0
0000
$49,094
$0 -
$0
$49,094
FY 2002Consolidated
$39,510,523 5,240
452,597 209,114
$40,177,474 $301,747
568,088 0
27,259,422 18,700,626
3,582,796
$90,590,153
$774,545 157
0876,404
$1,651,106 $5,967,178
1,624,557 35,078,280
730 9,008,744
$53,330,595
$31,468,721 5,790,837
$37,259,558
$90,590,153
FY 2001Consolidated
$37,351,036 3,193
727,509 61,560
$38,143,298 $168,401
362,702 0
34,543,535 17,621,538
3,726,647
$94,566,121
$874,432 108
0 658,664
$1,533,204 $6,698,778
1,646,526 40,071,084
06,944,358
$56,893,950
$28,895,571 8,776,600
$37,672,171
$94,566,121
Restated FY2001Consolidated
$37,351,036 $37,351,036
3,193 727,509 61,560
$38,143,298
$168,401362,702
0 27,429,322 17,621,538 3,726,647
$87,451,908
$874,432108
0 658,664
$1,533,204$6,698,778
1,646,526 40,071,084
0 6,944,358
$56,893,950
$28,895,571
1,662,387
$30,557,958
$87,451,908

Consolidating Statement of Net Cost
The accompanying notes are an integral part of these statements.
193
fy02
Department of Defense • Department of the Army For the years ended September 30, 2002 and 2001 ($ in thousands)
1. Program CostsA. Military Personnel
1. Intragovernmental Gross Costs2. (Less: Intragovernmental Earned Revenue)3. Intragovernmental Net Costs4. Gross Costs With the Public5. (Less: Earned Revenue From the Public)6. Net Costs With the Public7. Total Net Cost
B. Operation and Maintenance1. Intragovernmental Gross Costs2. (Less: Intragovernmental Earned Revenue)3. Intragovernmental Net Costs4. Gross Costs With the Public5. (Less: Earned Revenue From the Public)6. Net Costs With the Public7. Total Net Cost
C. Procurement1. Intragovernmental Gross Costs2. (Less: Intragovernmental Earned Revenue)3. Intragovernmental Net Costs4. Gross Costs With the Public5. (Less: Earned Revenue From the Public)6. Net Costs With the Public7. Total Net Cost
D. Research, Development, Test & Evaluation1. Intragovernmental Gross Costs2. (Less: Intragovernmental Earned Revenue)3. Intragovernmental Net Costs4. Gross Costs With the Public5. (Less: Earned Revenue From the Public)6. Net Costs With the Public7. Total Net Cost
E. Military Construction/Family Housing1. Intragovernmental Gross Costs2. (Less: Intragovernmental Earned Revenue)3. Intragovernmental Net Costs4. Gross Costs With the Public5. (Less: Earned Revenue From the Public)6. Net Costs With the Public7. Total Net Cost
Active Army
$4,967,982 (91,890)
$4,876,092 $20,688,735
(19,381)$20,669,354 $25,545,446
$11,098,932 (3,135,132)$7,963,800
$14,395,436 (638,103)
$13,757,333 $21,721,133
$764,156 (427,714)$336,442
$10,981,576 (25,271)
$10,956,305 $11,292,747
$221,620 (905,828)
($684,208)$7,292,395
(126,198)$7,166,197
$6,481,989
$18,807 (1,067,330)
($1,048,523)$2,787,731
(175,714)$2,612,017 $1,563,494
Army Reserve
$379,041 (19,387)
$359,654 $2,135,154
823 $2,135,977 $2,495,631
$494,660 (44,434)
$450,226 $1,246,563
(2,909)$1,243,654 $1,693,880
$0 0
$0 $00
$0 $0
$0 0
$0 $00
$0 $0
$4,278 0
$4,278 $41,319
0$41,319 $45,597
Army National Guard
$565,466 (29,667)
$535,799 $3,756,856
(723)$3,756,133 $4,291,932
$574,548 (96,423)
$478,125 $3,171,805
(9,516)$3,162,289 $3,640,414
$0 0
$0 $00
$0 $0
$0 0
$0 $00
$0 $0
$2,245 0
$2,245 $164,565
0$164,565 $166,810

Gen
eral
Fun
dFY
02 U
nite
d S
tate
s A
rmy
Ann
ual F
inan
cial
Sta
tem
ent
194
Consolidating Statement of Net CostT
he a
ccom
pany
ing
note
s ar
e an
inte
gral
par
t of t
hese
sta
tem
ents
.
Department of Defense • Department of the Army For the years ended September 30, 2002 and 2001 ($ in thousands)
F. Other1. Intragovernmental Gross Costs2. (Less: Intragovernmental Earned Revenue)3. Intragovernmental Net Costs4. Gross Costs With the Public5. (Less: Earned Revenue From the Public)6. Net Costs With the Public7. Total Net Cost
G. Total Program Costs1. Intragovernmental Gross Costs2. (Less: Intragovernmental Earned Revenue)3. Intragovernmental Net Costs4. Gross Costs With the Public5. (Less: Earned Revenue From the Public)6. Net Costs With the Public7. Total Net Cost
2. Cost Not Assigned to Programs
3. (Less:Earned Revenue Not Attributable to Programs)
4. Net Cost of Operations
Active Army
$259,584 (22,411)
$237,173 $631,179 212,284
$843,463 $1,080,636
$17,331,081 (5,650,305)
$11,680,776 $56,777,052
(772,383)$56,004,669 $67,685,445
$0
0
$67,685,445
Army Reserve
$0 0
$0 $00
$0$0
$877,979 (63,821)
$814,158 $3,423,036
(2,086)$3,420,950 $4,235,108
$0
0
$4,235,108
Army National Guard
$0 0
$0 $00
$0 $0
$1,142,259 (126,090)
$1,016,169 $7,093,226
($10,239)$7,082,987 $8,099,156
$0
0
$8,099,156

Consolidating Statement of Net Cost
The accompanying notes are an integral part of these statements.
195
fy02
Department of Defense • Department of the Army For the years ended September 30, 2002 and 2001 ($ in thousands)
1. Program CostsA. Military Personnel
1. Intrag-overnmental Gross Costs2. (Less: Intragovernmental Earned
Revenue)3. Intragovernmental Net Costs4. Gross Costs With the Public5. (Less: Earned Revenue From the
Public)6. Net Costs With the Public7. Total Net Cost
B. Operation and Maintenance1. Intragovernmental Gross Costs2. (Less: Intragovernmental Earned
Revenue)3. Intragovernmental Net Costs4. Gross Costs With the Public5. (Less: Earned Revenue From the
Public)6. Net Costs With the Public7. Total Net Cost
C. Procurement1. Intragovernmental Gross Costs2. (Less: Intragovernmental Earned
Revenue)3. Intragovernmental Net Costs4. Gross Costs With the Public5. (Less: Earned Revenue From the
Public)6. Net Costs With the Public7. Total Net Cost
D. Research, Development, Test &Evaluation1. Intragovernmental Gross Costs2. (Less: Intragovernmental Earned
Revenue)3. Intragovernmental Net Costs4. Gross Costs With the Public5. (Less: Earned Revenue From the
Public)6. Net Costs With the Public7. Total Net Cost
Combined Total
$5,912,489
(140,944)$5,771,545
$26,580,745
(19,281)$26,561,464 $32,333,009
$12,168,140
(3,275,989)$8,892,151
$18,813,804
(650,528)$18,163,276 $27,055,427
$764,156
(427,714)$336,442
$10,981,576
(25,271)$10,956,305 $11,292,747
$221,620
(905,828)($684,208)$7,292,395
(126,198)$7,166,197
$6,481,989
Eliminations
($31,544)
29,591 ($1,953)
$0
0$0
($1,953)
$328,295
(273,239)$55,056
$0
0$0
$55,056
$4,676
(162)$4,514
$0
00
$4,514
$3,071
(7,913)($4,842)
$0
0$0
($4,842)
FY 2002
$5,944,033
(170,535)$5,773,498
$26,580,745
(19,281)$26,561,464 $32,334,962
$11,839,845
(3,002,750)$8,837,095
$18,813,804
(650,528)$18,163,276 $27,000,371
$759,480
(427,552)$331,928
$10,981,576
(25,271)$10,956,305 $11,288,233
$218,549
(897,915)($679,366)$7,292,395
(126,198)$7,166,197
$6,486,831
FY 2001
$5,110,569
(70,982)$5,039,587
$23,783,686
(38,166)$23,745,520 $28,785,107
$5,490,066
(2,428,730)$3,061,336 $27,115,225
(636,042)$26,479,183 $29,540,519
$221,260
(342,183)($120,923)
$11,428,009
(79,034)$11,348,975 $11,228,052
$91,224
(1,636,206)($1,544,982)
$7,367,211
(107,598)$7,259,613 $5,714,631

Gen
eral
Fun
dFY
02 U
nite
d S
tate
s A
rmy
Ann
ual F
inan
cial
Sta
tem
ent
196
Consolidating Statement of Net CostT
he a
ccom
pany
ing
note
s ar
e an
inte
gral
par
t of t
hese
sta
tem
ents
.
Department of Defense • Department of the Army For the years ended September 30, 2002 and 2001 ($ in thousands)
E. Military Construction/Family Housing1. Intragovernmental Gross Costs2. (Less: Intragovernmental Earned
Revenue)3. Intragovernmental Net Costs4. Gross Costs With the Public5. (Less: Earned Revenue From the
Public)6. Net Costs With the Public7. Total Net Cost
F. Other1. Intragovernmental Gross Costs2. (Less: Intragovernmental Earned
Revenue)3. Intragovernmental Net Costs4. Gross Costs With the Public5. (Less: Earned Revenue From the
Public)6. Net Costs With the Public7. Total Net Cost
G. Total Program Costs1. Intragovernmental Gross Costs2. (Less: Intragovernmental Earned
Revenue)3. Intragovernmental Net Costs4. Gross Costs With the Public5. (Less: Earned Revenue From the
Public)6. Net Costs With the Public7. Total Net Cost
2. Cost Not Assigned to Programs
3. (Less:Earned Revenue NotAttributable to Programs)
4. Net Cost of Operations
Combined Total
$25,330
(1,067,330)($1,042,000)
$2,993,615
(175,714)$2,817,901 $1,775,901
$259,584
(22,411)$237,173 $631,179
212,284 $843,463
$1,080,636
$19,351,319
(5,840,216)$13,511,103 $67,293,314
(784,708)$66,508,606 $80,019,709
$0
0
$80,019,709
Eliminations
$4,524
(57,299)($52,775)
$0
0 $0
($52,775)
$0
0$0 $0
0$0 $0
$309,022
(309,022)$0 $0
0$0 $0
$0
0
$0
FY 2002
$20,806
(1,010,031)($989,225)$2,993,615
(175,714)$2,817,901
$1,828,676
$259,584
(22,411)$237,173 $631,179
212,284 $843,463
$1,080,636
$19,042,297
(5,531,194)$13,511,103 $67,293,314
(784,708)$66,508,606 $80,019,709
$0
0
$80,019,709
FY 2001
$1,957,834
(798,350)$1,159,484
$295,951
(132,504)$163,447
$1,322,931
$582,171
(33,659)$548,512 $321,852
(35,521)$286,331 $834,843
$13,453,124
(5,310,110)$8,143,014
$70,311,934
(1,028,865)$69,283,069 $77,426,083
$0
0
$77,426,083

Consolidating Statement of Changes in Net Position
The accompanying notes are an integral part of these statements.
197
fy02
Department of Defense • Department of the Army For the years ended September 30, 2002 and 2001 ($ in thousands)
Beginning Balances
Prior period adjustments (+/-)
Beginning Balances, as adjusted
Budgetary Financing Sources:Appropriations receivedAppropriations transferred-in/out (+/-)Other adjustments (rescissions, etc) (+/-)Appropriations usedNonexchange revenueDonations and forfeitures of cash and cash
equivalentsTransfers-in/out without reimbursement (+/-)Other budgetary financing sources (+/-)
Other Financing Sources:Donations and forfeitures of propertyTransfers-in/out without reimbursement (+/-)Imputed financing from costs absorbed by
othersOther (+/-)
Total Financing Sources
Net Cost of Operations (+/-)
Ending Balances
Active ArmyCumulativeResults of
Operations
$7,839,828
(7,114,213)
$725,615
000
69,894,774 205,583
0
0742,113
0(38,295)688,259
0
$71,492,434
67,685,445
$4,532,604
Army ReserveUnexpended
Appropriations
$609,947
0
$609,947
4,581,360 25,513
0(4,533,056)
00
00
0000
$73,817
0
$683,764
ArmyReserve
CumulativeResults of
Operations
$960,606
0
$960,606
000
4,533,056 00
0(3,828)
0(64)
00
$4,529,164
4,235,108
$1,254,662
Active ArmyUnexpended
Appropriations
$26,353,479
0
$26,353,479
67,592,802 4,606,408 (114,845)
(69,894,774)00
00
0000
$2,189,591
0
$28,543,070

Gen
eral
Fun
dFY
02 U
nite
d S
tate
s A
rmy
Ann
ual F
inan
cial
Sta
tem
ent
198
Consolidating Statement of Changes in Net PositionT
he a
ccom
pany
ing
note
s ar
e an
inte
gral
par
t of t
hese
sta
tem
ents
.
Department of Defense • Department of the Army For the years ended September 30, 2002 and 2001 ($ in thousands)
Beginning Balances
Prior period adjustments (+/-)
Beginning Balances, as adjusted
Budgetary Financing Sources:Appropriations receivedAppropriations transferred-in/out (+/-)Other adjustments (rescissions, etc) (+/-)Appropriations usedNonexchange revenueDonations and forfeitures of cash and cash
equivalentsTransfers-in/out without reimbursement (+/-)Other budgetary financing sources (+/-)
Other Financing Sources:Donations and forfeitures of propertyTransfers-in/out without reimbursement (+/-)Imputed financing from costs absorbed by
othersOther (+/-)
Total Financing Sources
Net Cost of Operations (+/-)
Ending Balances
Army NationalGuard
CumulativeResults of
Operations
($23,834)
0
($23,834)
000
8,126,111 00
05,246
0(4,796)
0
0
$8,126,561
8,099,156
$3,571
CombinedTotal
UnexpendedAppropriations
$28,895,571
0
$28,895,571
80,338,428 4,903,508 (114,845)
(82,553,941)00
00
000
0
$2,573,150
0
$31,468,721
CombinedTotal
CumulativeResults of
Operations
$8,776,600
(7,114,213)
$1,662,387
000
82,553,941 205,583
0
0743,531
0(43,155)688,259
0
$84,148,159
80,019,709
$5,790,837
Army NationalGuard
UnexpendedAppropriations
$1,932,145
0
$1,932,145
8,164,266 271,587
0(8,126,111)
00
00
000
0
$309,742
0
$2,241,887

Consolidating Statement of Changes in Net Position
The accompanying notes are an integral part of these statements.
199
fy02
Department of Defense • Department of the Army For the years ended September 30, 2002 and 2001 ($ in thousands)
Beginning Balances
Prior period adjustments (+/-)
Beginning Balances, as adjusted
Budgetary Financing Sources:Appropriations receivedAppropriations transferred-in/out (+/-)Other adjustments (rescissions, etc) (+/-)Appropriations usedNonexchange revenueDonations and forfeitures of cash and cash equivalentsTransfers-in/out without reimbursement (+/-)Other budgetary financing sources (+/-)
Other Financing Sources:Donations and forfeitures of propertyTransfers-in/out without reimbursement (+/-)Imputed financing from costs absorbed by othersOther (+/-)
Total Financing Sources
Net Cost of Operations (+/-)
Ending Balances
Eliminations
$0
0
$0
00000000
0000
$0
0
$0
FY 2002Consolidated
CumulativeResults of
Operations
$8,776,600
(7,114,213)
$1,662,387
000
82,553,941 205,583
00
743,531
0(43,155)688,259
0
$84,148,159
80,019,709
$5,790,837
FY 2002ConsolidatedUnexpended
Appropriations
$28,895,571
0
$28,895,571
80,338,428 4,903,508 (114,845)
(82,553,941)0000
0000
$2,573,150
0
$31,468,721

Gen
eral
Fun
dFY
02 U
nite
d S
tate
s A
rmy
Ann
ual F
inan
cial
Sta
tem
ent
200
Consolidating Statement of Changes in Net PositionT
he a
ccom
pany
ing
note
s ar
e an
inte
gral
par
t of t
hese
sta
tem
ents
.
Department of Defense • Department of the Army For the years ended September 30, 2002 and 2001 ($ in thousands)
FY 2001ConsolidatedUnexpended
Appropriations
$25,887,329
0
$25,887,329
3,008,242 00000
00
000
0
$3,008,242
0
$28,895,571
FY 2001Consolidated
CumulativeResults of
Operations
$628,191
(6,556,243)
($5,928,052)
000
73,855,867 209,595
0
017,161,699
0161,985 741,589
0
$92,130,735
77,426,083
$8,776,600
Beginning Balances
Prior period adjustments (+/-)
Beginning Balances, as adjusted
Budgetary Financing Sources:Appropriations receivedAppropriations transferred-in/out (+/-)Other adjustments (rescissions, etc) (+/-)Appropriations usedNonexchange revenueDonations and forfeitures of cash and cash
equivalentsTransfers-in/out without reimbursement (+/-)Other budgetary financing sources (+/-)
Other Financing Sources:Donations and forfeitures of propertyTransfers-in/out without reimbursement (+/-)Imputed financing from costs absorbed by
othersOther (+/-)
Total Financing Sources
Net Cost of Operations (+/-)
Ending Balances
FY 2001Restated
ConsolidatedUnexpended
Appropriations
$25,887,329
0
$25,887,329
3,008,242 0 0 0 0
0 0 0
0 0 0
0
$3,008,242
0
$28,895,571
FY 2001Restated
ConsolidatedCumulativeResults of
Operations
$628,191
(13,670,456)
($13,042,265)
0 0 0
73,855,867 209,595
0 0
17,161,699
0 161,985 741,589
0
$92,130,735
77,426,083
$1,662,387

Combining Statement of Budgetary Resources
The accompanying notes are an integral part of these statements.
201
fy02
Department of Defense • Department of the Army For the years ended September 30, 2002 and 2001 ($ in thousands)
Budgetary Resources:A. Budget Authority:
Appropriations receivedBorrowing authorityContract authorityNet transfers (+/-)Other
B. Unobligated balance:Beginning of periodNet transfers, actual (+/-)Anticipated Transfers Balances
C. Spending authority from offsetting collections:Earned
CollectedReceivable from Federal sources
Change in unfilled customer ordersAdvance receivedWithout advance from Federal sources
Anticipated for the rest of year, without advancesTransfers from trust fundsSubtotal
D. Recoveries of prior year obligationsE. Temporarily not available pursuant to Public LawF Permanently not availableG Total Budgetary Resources
Status of Budgetary Resources:H. Obligations incurred:
DirectReimbursableSubtotal
I. Unobligated balance:ApportionedExempt from apportionmentOther available
J. Unobligated Balances Not AvailableK. Total, Status of Budgetary Resources
Relationship of Obligations to Outlays:L. Obligated Balance, Net - beginning of periodM. Obligated Balance transferred, net (+/-)N. Obligated Balance, Net - end of period:
Accounts receivableUnfilled customer order from Federal sourcesUndelivered ordersAccounts payable
O. Outlays:DisbursementsCollectionsSubtotal
P. Less: Offsetting receiptsQ. Net Outlays
Active ArmyBudgetary
$68,250,796 00
4,993,499 0
4,951,901 394,593
0
11,786,245 (163,751)
87,072 1,117,961
00
$12,827,527 7,123,438
0(1,361,042)$97,180,712
$77,734,700 14,387,306 92,122,006
4,448,253 01
610,452 $97,180,712
$28,889,558 0
(1,359,126)(7,097,227)
28,625,607 10,371,762
82,392,899 (11,873,317)$70,519,582
(184,839)$70,334,743
Army ReserveNon-BudgetaryCredit Program
FinancingAccounts
$0 0000
000
00
0000
$0000
$0
$0 00
0000
$0
$00
0000
00
$00
$0
Army ReserveBudgetary
$4,607,062 00
25,513 0
170,289 00
68,436 (293)
50 4,567
00
$72,760 423,674
0(69,749)
$5,229,549
$4,974,362 79,968
5,054,330
41,739 00
133,480 $5,229,549
$1,014,143 0
(19,451)(10,987)509,651 691,826
4,469,487 (68,486)
$4,401,001 0
$4,401,001
Active ArmyNon-BudgetaryCredit Program
FinancingAccounts
$0 0000
691 00
39 0
0000
$39 000
$730
$0 00
730 00 0
$730
$00
0000
0(39)
($39)0
($39)

Gen
eral
Fun
dFY
02 U
nite
d S
tate
s A
rmy
Ann
ual F
inan
cial
Sta
tem
ent
202
Combining Statement of Budgetary ResourcesT
he a
ccom
pany
ing
note
s ar
e an
inte
gral
par
t of t
hese
sta
tem
ents
.
Department of Defense • Department of the Army For the years ended September 30, 2002 and 2001 ($ in thousands)
Budgetary Resources:A. Budget Authority:
Appropriations receivedBorrowing authorityContract authorityNet transfers (+/-)Other
B. Unobligated balance:Beginning of periodNet transfers, actual (+/-)Anticipated Transfers Balances
C. Spending authority from offsetting collections:Earned
CollectedReceivable from Federal sources
Change in unfilled customer ordersAdvance receivedWithout advance from Federal sources
Anticipated for the rest of year, without advancesTransfers from trust fundsSubtotal
D. Recoveries of prior year obligationsE. Temporarily not available pursuant to Public LawF Permanently not availableG Total Budgetary Resources
Status of Budgetary Resources:H. Obligations incurred:
DirectReimbursableSubtotal
I. Unobligated balance:ApportionedExempt from apportionmentOther available
J. Unobligated Balances Not AvailableK. Total, Status of Budgetary Resources
Relationship of Obligations to Outlays:L. Obligated Balance, Net - beginning of periodM. Obligated Balance transferred, net (+/-)N. Obligated Balance, Net - end of period:
Accounts receivableUnfilled customer order from Federal sourcesUndelivered ordersAccounts payable
O. Outlays:DisbursementsCollectionsSubtotal
P. Less: Offsetting receiptsQ. Net Outlays
2002 CombinedBudgetary
$81,067,276 00
5,290,599 0
5,701,789 408,970
0
12,012,602 (146,322)
87,119 1,164,785
00
13,118,184 8,287,368
0(1,569,179)
$112,305,007
$91,731,863 14,715,031
106,446,894
4,788,478 02
1,069,633 $112,305,007
31,626,562 0
(1,467,731)(7,161,002)30,611,343 11,679,657
95,105,359 (12,099,721)$83,005,638
(184,839)$82,820,799
Army NationalGuard Non-
Budgetary CreditProgram Financing
Accounts
$0 0000
000
00
00000000
$0
$0 00
0000
$0
00
0000
00
$00
$0
Army NationalGuard Budgetary
$8,209,418 00
271,587 0
579,599 14,377
0
157,921 17,722
(3)42,257
00
217,897 740,256
0(138,388)
$9,894,746
$9,022,801 247,757
9,270,558
298,486 01
325,701 $9,894,746
1,722,861 0
(89,154)(52,788)
1,476,085 616,069
8,242,973 (157,918)
$8,085,055 0
$8,085,055

Combining Statement of Budgetary Resources
The accompanying notes are an integral part of these statements.
203
fy02
Department of Defense • Department of the Army For the years ended September 30, 2002 and 2001 ($ in thousands)
Budgetary Resources:A. Budget Authority:
Appropriations receivedBorrowing authorityContract authorityNet transfers (+/-)Other
B. Unobligated balance:Beginning of periodNet transfers, actual (+/-)Anticipated Transfers Balances
C. Spending authority from offsetting collections:Earned
CollectedReceivable from Federal sources
Change in unfilled customer ordersAdvance receivedWithout advance from Federal sources
Anticipated for the rest of year, without advancesTransfers from trust fundsSubtotal
D. Recoveries of prior year obligationsE. Temporarily not available pursuant to Public LawF Permanently not availableG Total Budgetary Resources
Status of Budgetary Resources:H. Obligations incurred:
DirectReimbursableSubtotal
I. Unobligated balance:ApportionedExempt from apportionmentOther available
J. Unobligated Balances Not AvailableK. Total, Status of Budgetary Resources
Relationship of Obligations to Outlays:L. Obligated Balance, Net - beginning of periodM. Obligated Balance transferred, net (+/-)N. Obligated Balance, Net - end of period:
Accounts receivableUnfilled customer order from Federal sourcesUndelivered ordersAccounts payable
O. Outlays:DisbursementsCollectionsSubtotal
P. Less: Offsetting receiptsQ. Net Outlays
FY 2001 CombinedNon-BudgetaryCredit Program
Financing Accounts
$0 0000
000
00
0000
$0000
$0
$0 0
$0
0000
$0
$00
0000
00
$00
$0
2001 CombinedBudgetary
$74,232,106 00
2,112,116 0
5,970,023 869,646
0
11,631,079 (125,384)
(106,160)(183,369)
00
$11,216,166 10,706,763
0(1,039,579)
$104,067,241
$84,262,609 14,102,151
$98,364,760
4,494,010 01
1,208,470 $104,067,241
$28,485,816 0
(1,614,053)(5,996,218)28,696,740 10,540,092
84,826,003 (11,524,919)$73,301,084
0$73,301,084
FY 2002 CombinedNon-BudgetaryCredit Program
Financing Accounts
$0 0000
691 00
39 0
0000
$39 000
$730
$0 0
$0
730 0
730 0
$1,460
$00
0000
0(39)
($39)0
($39)

Gen
eral
Fun
dFY
02 U
nite
d S
tate
s A
rmy
Ann
ual F
inan
cial
Sta
tem
ent
204
Combining Statement of FinancingT
he a
ccom
pany
ing
note
s ar
e an
inte
gral
par
t of t
hese
sta
tem
ents
.
Department of Defense • Department of the Army For the years ended September 30, 2002 and 2001 ($ in thousands)
Resources Used to Finance Activities:
Budgetary Resources Obligated1. Obligations incurred2. Less: Spending authority from offsetting
collections and recoveries (-)3. Obligations net of offsetting collections and
recoveries4. Less: Offsetting receipts (-)5. Net obligations
Other Resources6. Donations and forfeitures of property7. Transfers in/out without reimbursement (+/-)8. Imputed financing from costs absorbed by
others9. Other (+/-)10. Net other resources used to finance activities
11. Total resources used to finance activities
Resources Used to Finance Items not Part ofthe Net Cost of Operations
12. Change in budgetary resources obligated forgoods, services and benefits ordered but notyet providedUndelivered Orders (-)Unfilled Customer Orders
13. Resources that fund expenses recognized inprior periods
14. Budgetary offsetting collections and receiptsthat do not affect net cost of operations
15. Resources that finance the acquisition ofassets
16. Other resources or adjustments to net obligatedresources that do not affect net cost ofoperationsLess: Trust or Special Fund Receipts Relatedto Exchange in the Entity's Budget (-)Other (+/-)
17. Total resources used to finance items notpart of the net cost of operations
18. Total resources used to finance the netcost of operations
Army National Guard
$9,270,558
(958,153)
$8,312,405 0
$8,312,405
00
00
$0
$8,312,405
(237,176)42,254
0
0
0
0 0
($194,922)
$8,117,483
Army Reserve
$5,054,330
(496,434)
$4,557,896 0
$4,557,896
00
00
$0
$4,557,896
(65,030)4,617
(15)
0
(111,167)
0 0
($171,595)
$4,386,301
Active Army
$92,122,006
(19,951,004)
$72,171,002 (184,839)
$71,986,163
00
688,259 0
$688,259
$72,674,422
(1,836,682)1,205,033
(5,656,730)
0
(41,072)
00
($6,329,451)
$66,344,971

Combining Statement of Financing
The accompanying notes are an integral part of these statements.
205
fy02
Department of Defense • Department of the Army For the years ended September 30, 2002 and 2001 ($ in thousands)
Army National Guard
$15,985 0
0
0
$39,790
55,775
18,756 (92,859)
0
($74,103)
($18,328)
$8,099,155
Army Reserve
$10,221 0
0
0
$7,321
17,542
21,666 (190,403)
0
($168,737)
($151,195)
$4,235,106
Active Army
$250,513 0
0
0
$1,439,747
1,690,260
556,357 (1,510,031)
603,891
($349,783)
$1,340,477
$67,685,448
Components of the Net Cost of Operations thatwill not Require or Generate Resources in theCurrent Period:
Components Requiring or GeneratingResources in Future Periods:
19. Increase in annual leave liability20. Increase in environmental and disposal liability21. Upward/Downward reestimates of credit
subsidy expense (+/-)22. Increase in exchange revenue receivable from
the public (-)23. Other (+/-)24. Total components of Net Cost of Operations
that will require or generate resources in futureperiods
Components not Requiring or GeneratingResources:
25. Depreciation and amortization26. Revaluation of assets or liabilities (+/-)27. Other (+/-)28. Total components of Net Cost of Operations
that will not require or generate resources
29. Total components of net cost of operationsthat will not require or generate resourcesin the current period
30. Net Cost of Operations
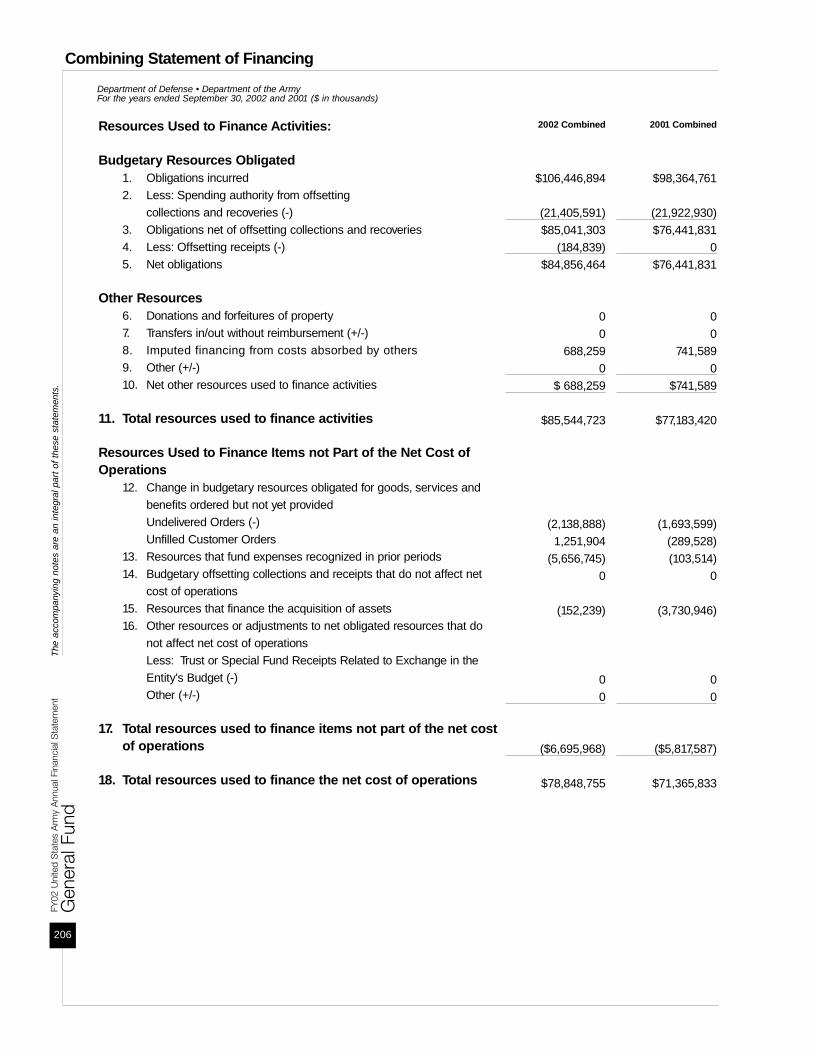
Gen
eral
Fun
dFY
02 U
nite
d S
tate
s A
rmy
Ann
ual F
inan
cial
Sta
tem
ent
206
Combining Statement of FinancingT
he a
ccom
pany
ing
note
s ar
e an
inte
gral
par
t of t
hese
sta
tem
ents
.
Department of Defense • Department of the Army For the years ended September 30, 2002 and 2001 ($ in thousands)
Resources Used to Finance Activities:
Budgetary Resources Obligated1. Obligations incurred2. Less: Spending authority from offsetting
collections and recoveries (-)3. Obligations net of offsetting collections and recoveries4. Less: Offsetting receipts (-)5. Net obligations
Other Resources6. Donations and forfeitures of property7. Transfers in/out without reimbursement (+/-)8. Imputed financing from costs absorbed by others9. Other (+/-)10. Net other resources used to finance activities
11. Total resources used to finance activities
Resources Used to Finance Items not Part of the Net Cost ofOperations
12. Change in budgetary resources obligated for goods, services andbenefits ordered but not yet providedUndelivered Orders (-)Unfilled Customer Orders
13. Resources that fund expenses recognized in prior periods14. Budgetary offsetting collections and receipts that do not affect net
cost of operations15. Resources that finance the acquisition of assets16. Other resources or adjustments to net obligated resources that do
not affect net cost of operationsLess: Trust or Special Fund Receipts Related to Exchange in theEntity's Budget (-)Other (+/-)
17. Total resources used to finance items not part of the net costof operations
18. Total resources used to finance the net cost of operations
2001 Combined
$98,364,761
(21,922,930)$76,441,831
0$76,441,831
00
741,589 0
$741,589
$77,183,420
(1,693,599)(289,528)(103,514)
0
(3,730,946)
00
($5,817,587)
$71,365,833
2002 Combined
$106,446,894
(21,405,591) $85,041,303
(184,839)$84,856,464
00
688,259 0
$ 688,259
$85,544,723
(2,138,888)1,251,904
(5,656,745)0
(152,239)
00
($6,695,968)
$78,848,755
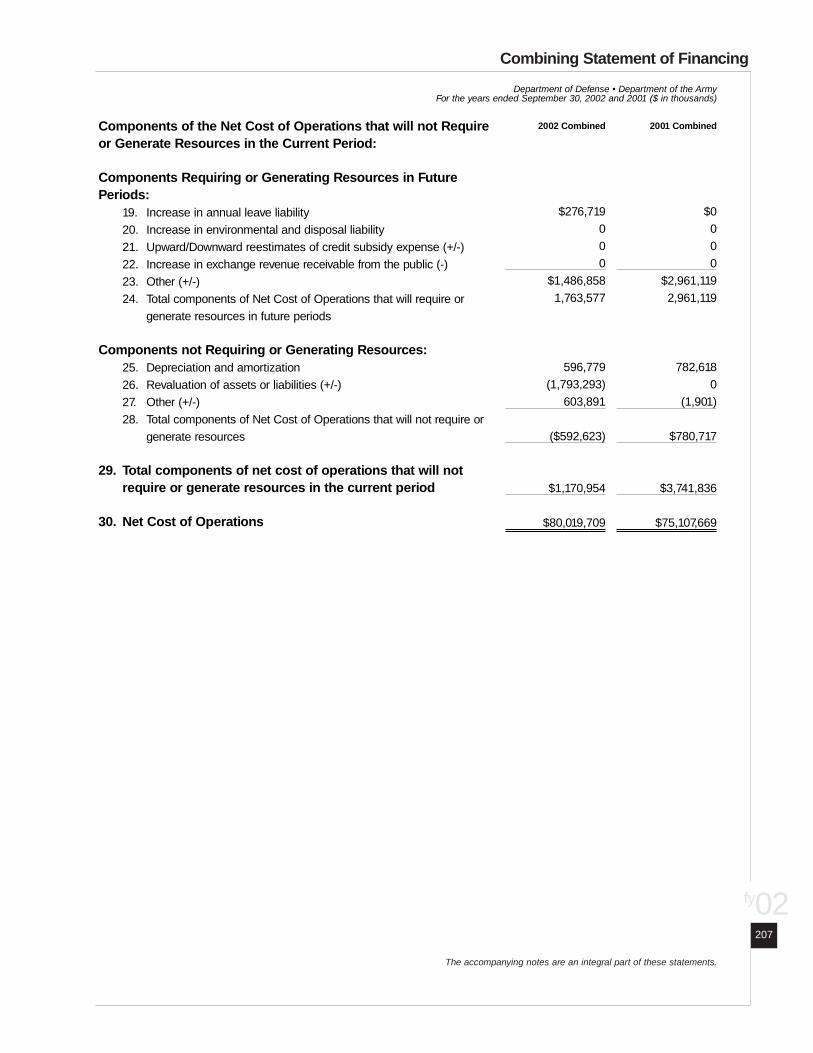
Combining Statement of Financing
The accompanying notes are an integral part of these statements.
207
fy02
Department of Defense • Department of the Army For the years ended September 30, 2002 and 2001 ($ in thousands)
2001 Combined
$0000
$2,961,119 2,961,119
782,618 0
(1,901)
$780,717
$3,741,836
$75,107,669
2002 Combined
$276,719 000
$1,486,858 1,763,577
596,779 (1,793,293)
603,891
($592,623)
$1,170,954
$80,019,709
Components of the Net Cost of Operations that will not Requireor Generate Resources in the Current Period:
Components Requiring or Generating Resources in FuturePeriods:
19. Increase in annual leave liability20. Increase in environmental and disposal liability21. Upward/Downward reestimates of credit subsidy expense (+/-)22. Increase in exchange revenue receivable from the public (-)23. Other (+/-)24. Total components of Net Cost of Operations that will require or
generate resources in future periods
Components not Requiring or Generating Resources:25. Depreciation and amortization26. Revaluation of assets or liabilities (+/-)27. Other (+/-)28. Total components of Net Cost of Operations that will not require or
generate resources
29. Total components of net cost of operations that will notrequire or generate resources in the current period
30. Net Cost of Operations

Gen
eral
Fun
d
208
FY02
Uni
ted
Sta
tes
Arm
y A
nnua
l Fin
anci
al S
tate
men
t
NATIONAL DEFENSE PLANT, PROPERTY, AND EQUIPMENTThe Federal Accounting Standards Advisory Board (FASAB) amended the Statement of Federal FinancialAccounting Standard No. 6 to require the capitalization and depreciation of military equipment (formerlyknown as National Defense Property, Plant and Equipment) for fiscal years (FY) 2003 and beyond, andencouraged early implementation. Accordingly, the Department began the process of developing andreporting values for these assets in notes to the Balance Sheet, beginning in FY 2002.
HERITAGE ASSETSFor Fiscal Year Ended September 30, 2002
(a) (b) (c) (d) (e) (f)Measure-ment/Quantity As Of10/01/01 Additions Deletions As Of9/30/02
Museums (Note 4) Each 217 15 11 221Monuments & Memorials (Note 5) Each 655 198 23 830Cemeteries (Note 6) Sites 521 18 9 530Buildings (Note 2) Each 5,687 119 128 5,678Structures (Note 3) Each 87 1 10 78Major Collections (Note 8) Each 6 0 0 6
Narrative Statement:In most cases, the additions/deletions are a result of installations defining cemeteries and historical facilitieslocated on their installations as a result of CFO audits. Some deletions are a result of disposing of BRAC'dproperty.
Notes:
1. Includes government-owned (ownership code (OC) 1), in-leases (OC2 and 6), military permits (OC4),other permits (OC3), NATO (OC5), and agreements (OC7).
2. Historical Buildings: buildings designated as historical (excludes museums).
3. Historical Structures: structures designated as historical; excludes monuments and memorials.
4. Museums: includes category code 76010.
5. Memorial/Monuments: only Monuments and Memorials are included (76020).
6. Cemeteries: includes category code 76030.
7. Exclusions/Inclusions: With the exception of Active Historical Buildings and Structures, Heritage Assetsare excluded from the General PP&E Report.
8. The U.S. Army Tank-automotive & Armaments Command is reporting two (2) major collections underthe Donation Program; Ceremonial Rifles and Monuments/Static. The U.S. Army Center of MilitaryHistory is the proponent for all Army Historical property. Currently, there are four (4) major or significantcollections that are maintained outside the definition of an Army museum and museum activity. The

collections consist of the U.S. Army Center of Military History, Museum Division, Collections Branch,the Anniston Historical Clearinghouse, and the Maple Leaf and Benton Small Arms collections. Thegeneral condition of the historical collection is stable. Multi-year conservation contracts have been let withcertified conservators, who are members in good standing with the American Institute of Conservators.The ongoing effort ensures that the historical collection is preserved in accordance with statutoryrequirements, Army regulations, and professional museum standards, and is interpreted in the interest ofhistory, the U.S. Army, and the American people. Furthermore, the historical collection actively supportstraining and development, and serves as a bridge for common interest between the military and civiliancommunities.
STEWARDSHIP LANDFor Fiscal Year Ended September 30, 2002(Thousand Acres)
(a) (b) (c) (d (e)As Of As Of Land Use
10/01/01 Additions Deletions 09/30/02
1. Mission 7,089.6 37.6 129.0 6,998.2(Note 1)
2. Parks & Historic Sites .9 .02 .002 .91(Note 2)
Narrative Statement: Additions/deletions are the result of: (a) acquiring additional land through donation or withdrawal frompublic domain; (b) identification of missing land records; and, (c) disposal of BRAC'd property.
Notes:
1. Mission Land: includes the following category codes: 91120, 91131, 91141, 91210, 91310, 91320,91330, 91410, 92111, 92121, 92131, and 92190. These category codes represent land that was notpurchased, but was donated or withdrawn from public domain.
2. Parks/Historic Sites: Includes all cemeteries (category code 76030). Unable to determine if cemeteriesare purchased, donated or transferred property. This value could be double reported within MissionRelated, therefore, this report should not be totaled.
Required Supplementary Stewardship Information
209
fy02

Gen
eral
Fun
d
210
FY02
Uni
ted
Sta
tes
Arm
y A
nnua
l Fin
anci
al S
tate
men
t
NON-FEDERAL PHYSICAL PROPERTYYearly Investment in State and Local GovernmentsFor Fiscal Years FY 1998 through FY 2002(In Millions of Dollars)
(a) (b) (c) (d) (e) (f)Categories FY 1998 FY 1999 FY 2000 FY 2001 FY2002
Transferred Assets:1. National Defense Mission Related $34.4 $20.2 $4.7 $94.8 $7.4Total
Funded Assets:1. National Defense Mission Related 0 0 0 0 02. Environmental Improvement 0 0 0 0 03. Base Closure and Realignment 0 0 0 0 04. Other 0 0 0 0 0Grand Total $34.4 $20.2 $4.7 $94.8 $7.4
Narrative Statement:Investments in Non-federal Physical Property refers to those expenses incurred by the Army for the purchase,construction, or major renovation of physical property owned by State and Local Governments, includingmajor additions, alterations and replacements; the purchase of major equipment; and the purchase ofimprovements of other physical assets. The following is a schedule of estimated investments value of state-owned properties that are used by the Federal Government.
Notes:
1. Investment values included in this report are based on outlays (expenditures). Outlays are used becausecurrent DoD systems are unable to capture and summarize costs in accordance with the accountingstandards.
2. Data provided here are significant because these are properties that are owned by the various USPFOs andare essential in accomplishing the mission of the Army National Guard.
3. Costs of maintenance of these non-federal assets are included in the budgetary resources of the ArmyNational Guard.
4. These properties represent non-cash items that were transferred to State and local governments.

INVESTMENTS IN RESEARCH AND DEVELOPMENTYearly Investment in Research and DevelopmentFor Fiscal Years FY 1998 through FY 2002(In Millions of Dollars)
(a) (b) (c) (d) (e) (f)Categories FY 1998 FY 1999 FY 2000 FY 2001 FY 2002
1. Basic Research 178.3 175.4 187.1 209.2 206.42. Applied Research 540.2 574.3 677.6 806.6 864.133. Development:Advanced Technology
Development 635.8 685.8 701.2 821.9 863.1Demonstration and Validation 515.5 498.6 476.5 622.6 897.7Engineering and Manufacturing Development 1,094.5 1,221.1 1,326.4 1,653.0 1,954.9Research, Development, Test and Evaluation
Management Support 1,171.5 1,192.9 961.9 888.8 880.9Operational Systems Development 657.2 656.2 605.4 849.3 970.4
Total $4,792.9 $5,004.2 $4,936.1 $5,851.3 $6,637.5
NARRATIVE STATEMENT:The following are two representative program examples for each of the above major categories:
Basic Research:Defense Research Sciences: This program sustains scientific and technological superiority in U.S. Army landwar fighting capability, providing new concepts and technologies for the Army's Objective Force, the meansto exploit scientific breakthroughs and avoid technological surprise. This program responds to the scientificand technological requirements of the Department of Defense Basic Research Plan, the Army Science andTechnology Master Plan, and the Army Modernization Plan, enabling technologies that can improvesignificantly joint war fighting capabilities. The in-house portion of the program capitalizes on the Army'sscientific talent and specialized facilities to transition expeditiously knowledge and technology into theappropriate developmental activities. The program leverages the research efforts of other governmentagencies, academia, and industry. This translates to a coherent, well-integrated program executed by the fiveprimary contributors: 1) the Army Research Laboratory (ARL), 2) the Army Materiel Command Research,Development and Engineering Centers (RDECs); 3) the Army Corps of Engineers Research andDevelopment Center (ERDC); 4) the Army Medical Research and Materiel Command laboratories; and 5)the Army Research Institute. The Army's research program promotes quality through in-depth reviews of theentire basic research program and the establishment of Strategic Research Objectives. The Army broadenedits research base, expanding its basic research investments at Historically Black Colleges and Universitiesand Minority Institutions (HBCU/MIs). The basic research program coordinates with the other Services viathe Joint Directors of Laboratories panels, Project Reliance, and other inter-service working groups. Projectsinvolve basic research efforts providing fundamental knowledge for the solution of military problems relatedto long-term national security needs. The program contains no duplication with any effort within the otherMilitary Departments.
University and Industry Research Centers: This program leverages research in the private sector throughFederated Laboratories, Collaborative Technology Alliances (CTA), Centers of Excellence, and theUniversity Affiliated Research Centers. A significant portion of the work performed within this program
Required Supplementary Stewardship Information
211
fy02

Gen
eral
Fun
d
212
FY02
Uni
ted
Sta
tes
Arm
y A
nnua
l Fin
anci
al S
tate
men
t
directly supports Objective Force requirements, providing the enabling technologies which will makeObjective Force equipment development possible. Collaborative Technology Alliances (CTA) are innovativealliances among government, industry and academic organizations, built to exploit scientific andtechnological breakthroughs and to transition them to exploratory development and applied research. CTAswill be established competitively in the areas of Advanced Sensors, Advanced Decision Architecture,Communications and Networks, Power and Energy, and Robotics. This program includes the Army's Centersof Excellence, which couple state-of-the-art research programs at academic institutions with broad-basedgraduate education programs, increasing the supply of scientists and engineers in materials science,electronics and rotary wing technology. The Army's Institute of Creative Technologies (ICT) is included alsoin this program. The ICT is a partnership with academia and the entertainment industry, leveraginginnovative research and concepts for training and design. Specific research of mutual interest to theentertainment industry and the Army are technologies for realistic immersion in synthetic environments,networked simulation, standards for interoperability, and tools for creating simulated environments. Work isconsistent with the Army Science and Technology Master Plan (ASTMP), the Army Modernization Plan, andProject Reliance. The program contains no duplication with any effort within the Military Departments.
Applied Research:Combat Vehicle and Automotive Technology: This program develops component technology to improveautomotive and survivability capabilities of Army ground vehicle systems for the Objective Force. Itprovides a portion of the Army's share of the Army/Defense Advanced Research Projects Agency (DARPA)collaborative Future Combat Systems (FCS) program. This funding supports both the FCS design anddemonstration activities, and critical enabling technologies at DARPA. To achieve the Army vision, it mustbe more strategically deployable and agile, with a smaller logistical footprint. Additionally, these lighterground vehicle systems must be more lethal, survivable, and tactically mobile. Other major projects withinthis area include the development of critical automotive enabling component technologies, such as activeprotection defeat mechanisms, advanced, lighter armor technology, and support for the National AutomotiveCenter (NAC). The NAC leverages the large commercial investments in automotive technology research anddevelopment, and it pursues shared technology programs that focus on military ground vehicles. Thisprogram adheres to Tri-Service Reliance Agreements on advanced materials, fuels, lubricants, and groundvehicles, with oversight and coordination provided by the Joint Directors of Laboratories. The project iscoordinated with the Marine Corps through the Naval Surface Warfare Center, and with other ground vehicledevelopers within the Departments of Energy, Commerce and Transportation and DARPA. The work isconsistent with the Army Science and Technology Master Plan (ASTMP), the Army Modernization Plan andProject Reliance. The program contains no duplication with any effort within the Military Departments.
Medical Technology: This program supports focused research for healthy, medically protected soldiers, andresearch consistent with the "Medical," "Survivability," and "Future Warrior" technology areas of theObjective Force. The primary goal is to sustain medical technology superiority, and improve the protectionand survivability of U.S. forces. This program funds applied research in the Department of Defense (DoD)medical protection against naturally occurring diseases, combat dentistry, and in the Department of Armycare of combat casualties, health hazard assessments, and medical factors enhancing soldier effectiveness.This program is the core DoD technology base to develop methods and materials for infectious diseaseprevention and treatment, including vaccines, prophylactic and therapeutic drugs, insect repellents, methods

of diagnosis and identification, prevention and treatment of combat maxillofacial (face and neck) injuries,essential dental treatment on the battlefield, combat casualty care of trauma and burns, organ system survival,blood loss and infection shock, blood preservation, potential blood substitutes for battlefield care, and thesustainment or enhancement of soldier performance. The cited work is consistent with the Army Science andTechnology Master Plan (ASTMP), the Army Modernization Plan, and Project Reliance. The programcontains no duplication with any effort within the Military Departments. The U.S. Army Medical Researchand Materiel Command manage this program.
Advanced Technology Development:Medical Advanced Technology: This program supports focused research for healthy, medically protectedsoldiers, and research consistent with the "Medical" and "Survivability" technology areas of the ObjectiveForce. The primary goal of this program is to provide, with minimum adverse effects, maximum soldiersurvivability and sustainability on the integrated battlefield, as well as in military operations other than war.This program funds advanced technology development for the Department of Defense (DoD) core Vaccineand Drug Program, field medical protective devices, and combat injury management. The DoD core Vaccineand Drug Program provides, in accordance with Food and Drug Administration (FDA) regulations, drugs andvaccines for development that effectively protect, treat, and act as antidotes against military disease threats.It produces pilot and standard lots of candidate pharmaceutical-grade drugs, antidotes, and vaccines. Thecited work is consistent with the Army Science and Technology Master Plan (ASTMP), the ArmyModernization Plan, and Project Reliance. The program contains no duplication with any effort within theMilitary Departments. The U.S. Army Medical Research and Materiel Command manage this program.
Combat Vehicle and Automotive Advanced Technology: The goal of this program is to mature anddemonstrate new and improved combat vehicle and automotive technologies, enabling the transformation ofthe Army to the Objective Force. Future Combat Systems (FCS), the Army's top priority program, is theprimary emphasis of work funded here in support of Army Transformation. A large portion of the fundssupport the collaborative Army/Defense Advanced Research Projects Agency (DARPA) FCS program andprovide support for the FCS analysis function of the Objective Force Task Force. The Army vision calls forstrategic dominance across the spectrum of operations. This demands a force that is deployable, agile,versatile, lethal, survivable and sustainable. In addition, this program supports enabling componenttechnology areas, such as survivability (e.g., Full Spectrum Active Protection (FSAP)), mobility (including anew engine demonstration initiative with a goal to double the power density of a comparable commercialengine to meet FCS power, size, and weight constraints), and intra-vehicular digital electronics. It alsointegrates diverse vehicle technologies developed by the Army, other DoD agencies and industry. Thesetechnologies are demonstrated in coordination with Army war fighter organizations through vehiclecomponent and system level technology demonstrations. Aside from FCS, an Advanced TechnologyDemonstration (ATD) will be conducted on the Future Scout and Cavalry System (FSCS), the CrewIntegration & Automation Testbed (CAT), and the Robotic Follower. The CAT ATD will demonstrate multi-mission capable crew stations required for the versatility of the Objective Force. The Robotic Follower ATDwill demonstrate an unmanned system capability for initial FCS systems, increasing survivability andreducing logistics for the FCS system. The U.S. Army Tank-Automotive Research, Development andEngineering Center (TARDEC), a subordinate organization of the Tank-Automotive and ArmamentsCommand (TACOM), located in Warren, MI, manages this program. It is coordinated with the Marine Corps
Required Supplementary Stewardship Information
213
fy02

Gen
eral
Fun
d
214
FY02
Uni
ted
Sta
tes
Arm
y A
nnua
l Fin
anci
al S
tate
men
t
office through the Naval Surface Warfare Center; the Naval Research Lab; Air Force Armaments Command;and with other ground vehicle developers within the Departments of Energy, Commerce, Transportation, andDARPA. The cited work is consistent with the Army Science and Technology Master Plan (ASTMP), theArmy Modernization Plan and Project Reliance. The program contains no duplication with any effort withinthe Military Departments.
Demonstration and Validation:Artillery Systems: This program supports efforts for the Crusader Advanced Development Program. TheCrusader system is the Army's next generation self-propelled howitzer (SPH) and Artillery Resupply Vehicle(RSV) and is the first installment of the Objective Force in the Army Transformation. Crusader hasincreased significantly capabilities in the areas of lethality, mobility, survivability, resupply, command andcontrol, and sustainability, capitalizing on mature, state-of-the-art technologies. The combination ofCrusader's unique capabilities, including vehicle speed, rate of fire, range, and exploitation of computers andcommunications yield unparalleled fire support capabilities for US forces. The Crusader vehicles have beendesigned specifically to facilitate air transportability, using a minimum combination of any two vehiclestransportable in either a C5 or C17 aircraft. The mix of resupply vehicles (tracked and wheeled) also givesthe Commander in theater additional flexibility to respond to threats, adapting his Tactics, Techniques andProcedures with the most appropriate utilization and interaction of tracked and wheeled resupply vehicles.
Advanced Tank Armament System: This program looks at promising tank and medium caliber technologies,assessing advantages and disadvantages of each technology, as well as costs and implementation impacts. Italso supports the International Quadripartite Agreement among the U.S., France, Germany and the UnitedKingdom for cooperative development/interoperability efforts to reduce risks on Tank and Medium CaliberAmmunition Systems. An immediate need exists for an Interim Armored Vehicle (IAV) equipped, C-130transportable Brigade Combat Team (BCT), capable of deployment anywhere on the globe in a combat readyconfiguration. The IAV family is the force and it consists of an Infantry Carrier (ICV), ReconnaissanceVehicle (RV), Mobile Gun System (MGS), Mortar Carrier (MC), Commander's Vehicle (CV), Fire SupportVehicle (FSV), Engineer Squad Vehicle (ESV), Medical Evacuation Vehicle (MEV), Anti-Tank GuidedMissile Vehicle (ATGM), and NBC Reconnaissance Vehicle (NBC RV).
Engineering and Manufacturing Development:Comanche: This program provides for the development, operational testing and evaluation of the RAH-66Comanche and the T800-801 growth engine. The Comanche is a multi-mission aircraft optimized for thecritical battlefield mission of tactical armed reconnaissance. It provides a globally self-deployable attackplatform for light/contingency forces. Comanche provides the solution to reconnaissance deficiencies (i.e. nonight/adverse weather/high/hot/stand-off capability) and is a key component on the digitized battlefield inwinning the information war. The Comanche is the Army's technology leader and provides significanthorizontal technology transfer within the Army and DoD. This program also provides for the continueddevelopment and qualification of the T800-801 growth engine and air vehicle support for integration into theComanche aircraft. It includes funding for the operational testing of Comanche, as well as modeling andsimulation accreditation for Early User Test, Limited User Test and Initial Operational Test and Evaluation.The program also provides for development of the airframe, mission equipment package, integration andqualification of the complete system, including logistic support, training, and training devices.

Information Technology Development: Supports efforts to plan, design, develop, and test informationtechnology solutions, fulfilling the Army's Warfighter Support Mission and future needs whileaccommodating changing requirements. Provides for development and acquisition of Combat ServiceSupport (CSS) and business information technology solutions to help arm, sustain, fix, move, train and manthe force. Completes development/acquisition efforts enhancing sustaining base functions, power projectioncapabilities and facilitating global messaging and electronic data interchange (EDI). Ongoing developmentefforts support multiple functional areas including logistics, personnel, transportation, training, medical/healthprotection, and sustaining base.
Research, Development, Test and Evaluation Management Support:Army Test Ranges and Facilities: This program provides the institutional funding required to assure adevelopmental test capability is available for the Department of Defense (DoD) Program Executive Officers,Program and Product Managers, and Research, Development, and Engineering Centers. Funds operation ofthe Army's Major Range and Test Facility Bases, such as Yuma Proving Ground (YPG), Arizona (to includemanagement of Army natural environmental testing), Aberdeen Test Center, Aberdeen Proving Ground,Maryland; White Sands Missile Range, New Mexico (including the Electronic Proving Ground (EPG) at FortHuachuca, Arizona); and Dugway Proving Ground, Utah (not test mission operations). This program alsoprovides the Army's developmental test capability at the Aviation Technical Test Center, Fort Rucker,Alabama; Redstone Technical Test Center, Redstone Arsenal, Alabama; Cold Regions Test Center, FortGreely and Fort Wainwright, Alaska; and the Tropic Test Site at Schofield Barracks, Hawaii. In addition, itprovides for the capability for test planning plus safety verification/confirmation at HQ, the DevelopmentalTest Command (DTC) located at Aberdeen Proving Ground, Maryland. Developmental test capabilities ateach test range have been established uniquely to support test and evaluation (T&E) requirements of fundedweapons programs, assure technical performance, adherence to safety requirements, reliability, logisticssupportability, and quality materiel in the development and production stages. Program funding includesefforts leveraging technologies to include the procurement of essential equipment, personnel training and testfacility modernization in support of the war fighter's weapons and equipment. These current testingcapabilities are not duplicated within DoD and they represent test capabilities needed to assure minimal riskto the soldier as new technologies emerge into fielded weapons systems. This program also finances indirecttest operating costs, replacement of test equipment, and test facility modernization projects necessary tomaintain current testing capabilities, improve safety, environmental protection, efficiency of test operations,and technological advances. The developmental test capability provided primarily supports Joint Service orOther Service systems, hardware, and technologies, and not just Army unique systems. Some of the majorsystems tested include: Joint Services Lightweight Howitzer, ABRAMS, BRADLEY, PATRIOT, PAC3,JAVELIN, LONGBOW HELLFIRE, Interim Armored Vehicle, COMANCHE, ATACMS/BAT, as well asother service systems such as Navy STANDARD missile and the Air Force AMRAAM missile.
Required Supplementary Stewardship Information
215
fy02

Gen
eral
Fun
d
216
FY02
Uni
ted
Sta
tes
Arm
y A
nnua
l Fin
anci
al S
tate
men
t
Army Kwajalein Atoll: The U.S. Army Kwajalein Atoll/Ronald Reagan Ballistic Missile Defense Site(USAKA/RTS), located in the Republic of the Marshall Islands, is a remote, secure activity of the MajorRange and Test Facility Base as constituted by DoD Directive 3200.11. Its function is to support test andevaluation of major Army and DoD missile systems, Army Space surveillance and object identification, andNational Aeronautics and Space Administration (NASA) scientific and space programs. Programs supportedinclude Army missile defense, Ballistic Missile Defense Organization (BMDO) demonstration/validationtests, Air Force Intercontinental Ballistic Missile (ICBM) development and operational tests, U.S. SpaceSurveillance Network, and NASA Space Transportation System (Shuttle) and orbital debris experiments.USAKA/RTS supports the Missile Defense Act of 1991 to put in place a Ground Based Defense System by2006 or the earliest date possible. The technical element of USAKA/RTS is the RTS, which consists of anumber of sophisticated, one-of-a-kind, radar, optical, telemetry, command/control/ communications, anddata reduction systems. These systems include the four unique radars of the Kiernan Reentry MeasurementSite (KREMS); Super Recording Automatic Digital Optical Tracker (SRADOT) long range video-metrictracking systems; high density data recorders for high data-rate telemetry collected by nine antennas; andunderwater acoustic impact location system data analysis/reduction hardware/software. Funds also supportthe Kwajalein Modernization and Remoting (KMAR) Program, a concurrent, range-wide modernizationeffort to maximize the use of common, standardized commercial off-the-shelf (COTS) technology to replaceobsolete components; implement common hardware/software architectures and automation; and "remote" theoperation of range sensors and instrumentation to the island of Kwajalein. This effort will upgrade rangecapabilities that are critical to the success of upcoming Theater Missile Defense (TMD) and National MissileDefense (NMD) test missions. The Army, Air Force, Navy and BMDO have significant test and datagathering requirements at USAKA/RTS. Air Force programs require firing from Vandenberg AFB, CA withcomplete data collection during late mid-course and terminal trajectory. BMDO programs require rangesensors to collect technical data in support of the National Missile and Theater Missile Defense programs.This test data cannot be obtained except through the use of technical facilities available on and in the vicinityof USAKA/RTS. Program also supports CINCSPACE requirements for data collection on objects in space.The Advanced Research Project Agency (ARPA) Long-Range Tracking and Instrumentation Radar(ALTAIR), and the Target Resolution Discrimination Experiment (TRADEX) radar located at USAKA/RTS,are two of only three radars world-wide that have deep-space tracking capability. Some of the supportedprograms are Air Force's Peacekeeper, Minuteman III, and Delta; Army/BMDO's NMD (Ground BasedInterceptor (GBI), Ground Based Radar (GBR), Battle Management/Command, Control andCommunications (BMC3), In-Flight Interceptor Communication System (IFICS), TMD, ( PAC-3, SystemIntegration of Tests, Family of Systems, Critical Measurements Program, Theater High Altitude Air Defense(THAAD), Patriot, and ground-based radar); NASA's Space Transportation System (STS), Orbital DebrisMeasurement Program, Small Expendable Deployer System and Orbital Debris Measurement Program, andassociated programs at the Air Force Space and Missile Center.
Operational Systems Development:Aircraft Modifications/Product Improvement Program: This program develops modifications andimprovements for the Guardrail Common Sensor/Aerial Common Sensor, the Improved Cargo Helicopter(ICH), the UH-60A/L Black Hawk Recapitalization/Modernization, and the Apache 2nd Generation ForwardLooking Infrared (FLIR). Improved Cargo Helicopter (ICH) is a recapitalization program, extending theuseful life of the CH-47D Cargo helicopter. This funding will assure heavy lift capability into the 21st

century. This is the basis for establishing remanufacture, modernization, and upgrades to meet the futurereadiness needs and required heavy lift capability. The UH-60 Black Hawk will serve as the Army's utilityhelicopter in the Objective Force. It is used for air assault, general support, aeromedical evacuation(MEDEVAC), and command and control in the active and reserve component theater, corps, division, andtable of distribution and allowance units. The UH-60A entered service in fiscal year 1978, and the newermodel UH-60L in 1989. The Army continues to procure UH-60L helicopters today. The Army hasestablished a recapitalization goal for its systems, maintaining the fleet's average age at the design half-life orless. The UH-60 was designed for a 20-year service life. The oldest UH-60As are now over 23 years old,and the average age of the UH-60A fleet is 18 years old. The increased operational tempo, coupled with thetechnological age of the basic airframe, components, and systems, is having an adverse impact on theoperational readiness (OR) and operating and support (O&S) costs of the over 1500 UH-60 fleet. Inaddition, the UH-60A/L helicopters lack the necessary digital avionics architecture to meet current and futureArmy and Joint Service interoperability communication requirements. The plan is to use an evolutionary,block approach to transform the utility helicopter force to one that is more deployable, responsive, and lessexpensive to operate. It will recapitalize the oldest UH-60A Black Hawks to the UH-60M configuration.The UH-60M selected upgrade includes airframe service life extension, structural improvements, upgrade ofthe propulsion system (UH-60A T700-GE-700 engine and drive train to UH-60L T700-GE-701C engine anddrive train), and a digital cockpit. The UH-60M provides a common platform for the modernized airambulance MEDEVAC medical mission equipment package (MEP).
Combat Vehicle Improvement Programs: This program responds to vehicle deficiencies identified duringDesert Storm, continues technical system upgrades, and addresses needed evolutionary enhancements totracked combat (Abrams and Bradley) and tactical (Bradley Fire Support (FIST)) vehicles. It providescombat effectiveness and enhancements for the Abrams Tank through a series of product improvements tothe current M1A1 and M1A2 vehicles. Additional improvements allow the M1A2 System EnhancementPackage (SEP) tank to operate effectively with the M2A3 Bradley. This program also addresses futureproduct improvements to the M2A3, and the Abrams tank fleet. Common Digitization (CD) efforts willwork towards the resolution of common digitization concerns impacting all current and future GroundCombat Support Systems (GCSS). Included are Real Time Common Operating Environment (RTCOE)Expansion, and the Abrams/Bradley Objective IC3 Program.
Required Supplementary Stewardship Information
217
fy02

Gen
eral
Fun
d
218
FY02
Uni
ted
Sta
tes
Arm
y A
nnua
l Fin
anci
al S
tate
men
t
Department of the ArmyGeneral Property, Plant, and Equipment
Real Property Deferred Maintenance AmountsAs of September 30, 2002
Narrative Statement:FY 2002 sustainment requirements for the Army are from version 2.0 of the DoD Facilities SustainmentModel (FSM). The requirements and funding represent facilities funded from Operations & Maintenance(O&M), Army Family Housing (AFH), and Working Capital Fund (WCF) appropriations, and from Non-Appropriated Funds (NAF). Army sustainment data includes facilities that are multi-use heritage assets.Sustainment funding contributions from host nation funding (Japan) and military pay are included. Thesustainment data excludes facilities funded from Research, Development, Test and Evaluation (RDTE), andProcurement appropriations, and Chemical Depots, because we lack separately identifiable sustainmentfunding for these locations.
Annual Sustainment FY 2002Property Type 1. Required 2. Actual 3. DifferenceBuildings, Structures, and Utilities $3,122.2M $2,208.8M $913.4M
Annual Deferred Sustainment TrendProperty Type FY 2000 FY 2001 FY 2002Buildings, Structures, and Utilities $629.4M $1,167M $913.4M
Army Restoration & Modernization (R&M) requirements are modeled in the annual Installation StatusReport (ISR). During ISR data collection, facility occupants evaluate the condition of each facility againstpublished standards. Facilities are rated Green (complies with standards), Amber (does not fully meetstandards), or Red (dysfunctional or substandard). ISR establishes a C-rating for groups of facilities, basedon the proportion of facilities rated Green, Amber, and Red. Facility groups are rated C-1 (facilities fullysupport the mission), C-2 (facilities support the majority of assigned missions), C-3 (facilities impair missionperformance), or C-4 (facilities significantly impair mission performance).
ISR develops cost estimates to improve groups of facilities to higher C-ratings. Using industry basedimprovement cost factors for each facility type, ISR builds the cost to improve Red and Amber facilities toGreen in order to achieve higher C-ratings. The requirement reported for General PP&E R&M is the cost toimprove the quality of facilities to C-1. For FY 2002, these requirements address facility types funded fromArmy appropriated O&M, WCF, and AFH funds. The Army's R&M requirement does not includerequirements for facilities funded by Department of Defense (hospitals, clinics), NAF (recreation, sports),Army Air Force Exchange Service, Defense Commissary Agency, and private funding. The R&Mrequirement also excludes costs for utilities planned for privatization, BRAC closures, ammunition plants andchemical depots.
Army facilities are predominantly C-3, due to years of underfunding sustainment. The Army's estimate toreturn these facilities to a C-1 status for FY 2002 is $20.2B, based on the FY 2002 ISR. The reduction of

$8.4B in the R&M requirement is the result of a change in the Army's facility evaluation methodology toprevent overstating restoration cost estimates for facilities. As a result of a recommendation from the U.S.Army Audit Agency (AAA), ISR facility standards were adjusted to remove "critical components" from theevaluation methodology. In past years, a low rating for a single facility component, if from a "criticalcomponent", would cause the facility to receive a low rating. For FY 2002, each facility received a ratingrepresenting the majority of the component ratings. The overall ratings collected for FY 2002 are higher thanthose of FY 2001 due to this change in standards. The higher ratings and the corresponding reduction inR&M requirements do not reflect an actual improvement in Army facilities from FY 2001 to FY 2002, butrather a recalibration of facility ratings.
Restoration & Modernization RequirementsProperty Type End FY 2001 End FY 2002 ChangeBuildings, Structures, and Utilities $28.6B $20.2B -$8.4B
National Defense Property, Plant and Equipment Deferred Maintenance Amounts
As of September 30, 2002($ in Thousands)
Army ActiveMajor Type Army Reserve National Guard Army Total
1. Aircraft $3.1 $35.5 $101.6 $140.22. Ships3. Missiles 0.9 18.2 19.14. Combat Vehicles 3.3 8.1 80.3 91.75. Other Weapons Systems 7.9 5.7 117.5 131.1
Total $14.3 $50.2 $317.6 $382.1
Required Supplementary Stewardship Information
219
fy02

Gen
eral
Fun
dFY
02 U
nite
d S
tate
s A
rmy
Ann
ual F
inan
cial
Sta
tem
ent
220
Statement of Disaggregated Budgetary ResourcesT
he a
ccom
pany
ing
note
s ar
e an
inte
gral
par
t of t
hese
sta
tem
ents
.
Department of Defense • Department of the Army For the years ended September 30, 2002 and 2001 ($ in thousands) Budgetary Financing Accounts
BUDGETARY RESOURCESA. Budget Authority:
1. Appropriations received2. Borrowing authority3. Contract authority4. Net transfers (+/-)5. Other
B. Unobligated balance:4. Beginning of period5. Net transfers, actual (+/-)6. Anticipated Transfers Balances
C. Spending authority from offsettingcollections:7. Earned8. Collected9. Receivable from Federal sources10. Change in unfilled customer orders11. Advance received12. Anticipated for the rest of year,
without advances13. Transfers from trust funds14. Subtotal
D. Recoveries of prior year obligationsE. Temporarily not available pursuant to
Public LawF. Permanently not availableG. Total Budgetary Resources
STATUS OF BUDGETARY RESOURCESA. Obligations incurred:
15. Direct16. Reimbursable17. Subtotal
B. Unobligated balance:18. Apportioned19. Exempt from apportionment20. Other available
C. Unobligated Balances Not AvailableD. Total, Status of Budgetary Resources
Relationship of Obligations to Outlays:A. Obligated Balance, Net - beginning of
periodB. Obligated Balance transferred, net (+/-)C. Obligated Balance, Net - end of period:
21. Accounts receivable22. Unfilled customer order from
Federal sources23. Undelivered orders24. Accounts payable
D. Outlays:25. Disbursements26. Collections27. Subtotal
E. Less: Offsetting receiptsF. Net Outlays
Other
$1,137,125 0 0
16,665 0
147,543 (12,776)
0
7,648 1,628
0 (16,793)(9,102)
0 0
($16,619)64,721
0 (8,379)
$1,328,280
$1,205,614 12,996
$1,218,610
105,885 0 0
3,785 $1,328,280
$549,719 0
(12,346)
(37,031)453,207 72,909
$1,234,343 9,145
$1,243,488 (184,839)
$1,058,649
Procurement
$10,721,868 0 0
(19,528)0
2,196,519 9,776
0
490,709 3,218
0 (5,933)
236,560
0 0
$724,554 466,115
0 (241,371)
$13,857,933
$11,235,484 666,775
$11,902,259
1,852,434 0 0
103,240 $13,857,933
$11,301,834 0
(60,616)
(1,001,775)11,583,072 1,086,394
$10,891,125 (484,776)
$10,406,349 0
$10,406,349
Operation andMaintenance
$28,976,751 0 0
3,466,418 0
878,473 263,409
0
6,954,019 (106,947)
0 (24,429)614,736
0 0
$7,437,379 5,173,159
0 (834,179)
$45,361,410
$36,029,929 8,549,714
$44,579,643
107,117 0 0
674,651 $45,361,411
$12,117,902 0
(750,052)
(2,541,047)9,983,300 6,514,756
$37,809,638 (6,929,590)
$30,880,048 0
$30,880,048
Research,Development,
Test & Evaluation
$7,114,274 0 0
3,613 0
1,064,942 3,000
0
2,142,650 61,656
0 53,327
229,319
0 0
$2,486,952 659,107
0 (116,370)
$11,215,518
$7,358,954 2,707,188
$10,066,142
1,100,730 0 0
48,645 $11,215,517
$3,101,066 0
(302,463)
(1,210,061)4,450,570
513,858
$8,765,222 (2,195,977)$6,569,245
0 $6,569,245

Statement of Disaggregated Budgetary Resources
The accompanying notes are an integral part of these statements.
221
fy02
Department of Defense • Department of the Army For the years ended September 30, 2002 and 2001 ($ in thousands)
BUDGETARY RESOURCESA. Budget Authority:
1. Appropriations received2. Borrowing authority3. Contract authority4. Net transfers (+/-)5. Other
B. Unobligated balance:4. Beginning of period5. Net transfers, actual (+/-)6. Anticipated Transfers Balances
C. Spending authority from offsettingcollections:7. Earned8. Collected9. Receivable from Federal sources10. Change in unfilled customer orders11. Advance received12. Anticipated for the rest of year,
without advances13. Transfers from trust funds14. Subtotal
D. Recoveries of prior year obligationsE. Temporarily not available pursuant to
Public LawF. Permanently not availableG. Total Budgetary Resources
STATUS OF BUDGETARY RESOURCESA. Obligations incurred:
15. Direct16. Reimbursable17. Subtotal
B. Unobligated balance:18. Apportioned19. Exempt from apportionment20. Other available
C. Unobligated Balances Not AvailableD. Total, Status of Budgetary Resources
Relationship of Obligations to Outlays:A. Obligated Balance, Net - beginning of
periodB. Obligated Balance transferred, net (+/-)C. Obligated Balance, Net - end of period:
21. Accounts receivable22. Unfilled customer order from
Federal sources23. Undelivered orders24. Accounts payable
D. Outlays:25. Disbursements26. Collections27. Subtotal
E. Less: Offsetting receiptsF. Net Outlays
MilitaryPersonnel
$30,432,976 0 0
1,808,816 0
214,684 127,343
0
140,777 (87,180)
0 0
46,218
0 0
$99,815 1,504,144
0 (292,128)
$33,895,650
$33,341,023 328,581
$33,669,604
3,957 0 0
222,090 $33,895,651
$2,679,468 0
(296,052)
(54,231)(170,422)2,732,973
$32,673,621 (140,777)
$32,532,844 0
$32,532,844
2001 Combined
$74,232,106 0 0
2,112,116 0
5,970,023 869,646
0
11,631,079 (125,384)
0 (106,160)(183,369)
0 0
$11,216,166 10,706,763
0 (1,039,579)
$104,067,241
$84,262,609 14,102,151
$98,364,760
4,494,010 0 1
1,208,470 $104,067,241
$28,485,816 0
(1,614,053)
(5,996,218)28,696,740 10,540,092
$84,826,003 (11,524,919)$73,301,084
0 $73,301,084
2002 Combined
$81,067,276 0 0
5,290,599 0
5,701,789 408,970
0
12,012,602 (146,322)
0 87,119
1,164,785
0 0
$13,118,184 8,287,368
0 (1,569,179)
$112,305,007
$91,731,863 14,715,031
$106,446,894
4,788,478 0 2
1,069,633 $112,305,007
$31,626,562 0
(1,467,731)
(7,161,002)30,611,343 11,679,657
$95,105,359 (12,099,721)$83,005,638
(184,839)$82,820,799
MilitaryConstruction /
Family Housing
$2,684,282 0 0
14,615 0
1,199,628 18,218
0
2,276,798 (18,697)
0 80,948 47,053
0 0
$2,386,102 420,122
0 (76,753)
$6,646,214
$2,560,859 2,449,777
$5,010,636
1,618,357 0 0
17,221 $6,646,214
$1,876,574 0
(46,204)
(2,316,857)4,311,616
758,767
$3,731,410 (2,357,746)$1,373,664
0 $1,373,664
Budgetary Financing Accounts

Gen
eral
Fun
dFY
02 U
nite
d S
tate
s A
rmy
Ann
ual F
inan
cial
Sta
tem
ent
222
Statement of Disaggregated Budgetary ResourcesT
he a
ccom
pany
ing
note
s ar
e an
inte
gral
par
t of t
hese
sta
tem
ents
.
Department of Defense • Department of the Army For the years ended September 30, 2002 and 2001 ($ in thousands) Non-Budgetary Financing Accounts
BUDGETARY RESOURCESA. Budget Authority:
1. Appropriations received2. Borrowing authority3. Contract authority4. Net transfers (+/-)5. Other
B. Unobligated balance:4. Beginning of period5. Net transfers, actual (+/-)6. Anticipated Transfers Balances
C. Spending authority from offsettingcollections:7. Earned8. Collected9. Receivable from Federal sources10. Change in unfilled customer orders11. Advance received12. Anticipated for the rest of year,
without advances13. Transfers from trust funds14. Subtotal
D. Recoveries of prior year obligationsE. Temporarily not available pursuant to
Public LawF. Permanently not availableG. Total Budgetary Resources
STATUS OF BUDGETARY RESOURCESA. Obligations incurred:
15. Direct16. Reimbursable17. Subtotal
B. Unobligated balance:18. Apportioned19. Exempt from apportionment20. Other available
C. Unobligated Balances Not AvailableD. Total, Status of Budgetary Resources
Relationship of Obligations to Outlays:A. Obligated Balance, Net - beginning of
periodB. Obligated Balance transferred, net (+/-)C. Obligated Balance, Net - end of period:
21. Accounts receivable22. Unfilled customer order from
Federal sources23. Undelivered orders24. Accounts payable
D. Outlays:25. Disbursements26. Collections27. Subtotal
E. Less: Offsetting receiptsF. Net Outlays
Other
$0 0 0 0 0
$691 0 0
39 0 0 0 0
0 0
$39 0
0 0
$730
$0 0
$0
$730 0 0 0
$730
$0 0
0
0 0 0
0 (39)
($39)0
($39)
Procurement
$0 0 0 0 0
$0 0 0
0 0 0 0 0
0 0
$0 0
0 0
$0
$0 0
$0
$0 0 0 0
$0
$0 0
0
0 0 0
0 0
$0 0
$0
Operation andMaintenance
$0 0 0 0 0
$0 0 0
0 0 0 0 0
0 0
$0 0
0 0
$0
$0 0
$0
$0 0 0 0
$0
$0 0
0
0 0 0
0 0
$0 0
$0
Research,Development,
Test & Evaluation
$0 0 0 0 0
$0 0 0
0 0 0 0 0
0 0
$0 0
0 0
$0
$0 0
$0
$0 0 0 0
$0
$0 0
0
0 0 0
0 0
$0 0
$0

Statement of Disaggregated Budgetary Resources
The accompanying notes are an integral part of these statements.
223
fy02
Department of Defense • Department of the Army For the years ended September 30, 2002 and 2001 ($ in thousands)Non-Budgetary Financing Accounts
BUDGETARY RESOURCESA. Budget Authority:
1. Appropriations received2. Borrowing authority3. Contract authority4. Net transfers (+/-)5. Other
B. Unobligated balance:4. Beginning of period5. Net transfers, actual (+/-)6. Anticipated Transfers Balances
C. Spending authority from offsettingcollections:7. Earned8. Collected9. Receivable from Federal sources10. Change in unfilled customer orders11. Advance received12. Anticipated for the rest of year,
without advances13. Transfers from trust funds14. Subtotal
D. Recoveries of prior year obligationsE. Temporarily not available pursuant to
Public LawF. Permanently not availableG. Total Budgetary Resources
STATUS OF BUDGETARY RESOURCESA. Obligations incurred:
15. Direct16. Reimbursable17. Subtotal
B. Unobligated balance:18. Apportioned19. Exempt from apportionment20. Other available
C. Unobligated Balances Not AvailableD. Total, Status of Budgetary Resources
Relationship of Obligations to Outlays:A. Obligated Balance, Net - beginning of
periodB. Obligated Balance transferred, net (+/-)C. Obligated Balance, Net - end of period:
21. Accounts receivable22. Unfilled customer order from
Federal sources23. Undelivered orders24. Accounts payable
D. Outlays:25. Disbursements26. Collections27. Subtotal
E. Less: Offsetting receiptsF. Net Outlays
MilitaryPersonnel
$0 0 0 0 0
$0 0 0
0 0 0 0 0
0 0
$0 0
0 0
$0
$0 0
$0
$0 0 0 0
$0
$0 0
0
0 0 0
0 0
$0 0
$0
2001Combined
$0 0 0 0 0
$0 0 0
0 0 0 0 0
0 0
$0 0
0 0
$0
$0 0
$0
$0 0 0 0
$0
$0 0
0
0 0 0
0 0
$0 0
$0
2002Combined
$0 0 0 0 0
$691 0 0
39 0 0 0 0
0 0
$39 0
0 0
$730
$0 0
$0
$730 0
730 0
$1,460
$0 0
0
0 0 0
0 (39)
($39)0
($39)
MilitaryConstruction /
Family Housing
$0 0 0 0 0
$0 0 0
0 0 0 0 0
0 0
$0 0
0 0
$0
$0 0
$0
$0 0 0 0
$0
$0 0
0
0 0 0
0 0
$0 0
$0
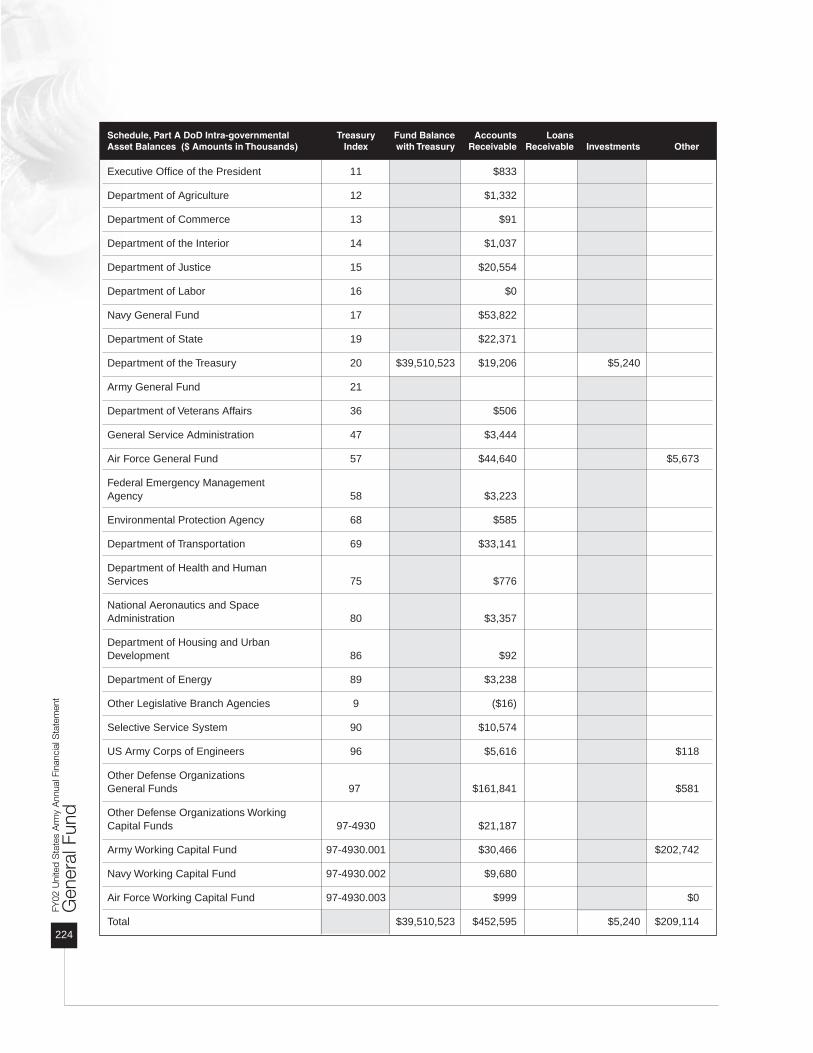
Gen
eral
Fun
d
224
FY02
Uni
ted
Sta
tes
Arm
y A
nnua
l Fin
anci
al S
tate
men
t
Schedule, Part A DoD Intra-governmental Treasury Fund Balance Accounts LoansAsset Balances ($ Amounts in Thousands) Index with Treasury Receivable Receivable Investments Other
Executive Office of the President 11 $833
Department of Agriculture 12 $1,332
Department of Commerce 13 $91
Department of the Interior 14 $1,037
Department of Justice 15 $20,554
Department of Labor 16 $0
Navy General Fund 17 $53,822
Department of State 19 $22,371
Department of the Treasury 20 $39,510,523 $19,206 $5,240
Army General Fund 21
Department of Veterans Affairs 36 $506
General Service Administration 47 $3,444
Air Force General Fund 57 $44,640 $5,673
Federal Emergency ManagementAgency 58 $3,223
Environmental Protection Agency 68 $585
Department of Transportation 69 $33,141
Department of Health and HumanServices 75 $776
National Aeronautics and SpaceAdministration 80 $3,357
Department of Housing and UrbanDevelopment 86 $92
Department of Energy 89 $3,238
Other Legislative Branch Agencies 9 ($16)
Selective Service System 90 $10,574
US Army Corps of Engineers 96 $5,616 $118
Other Defense Organizations General Funds 97 $161,841 $581
Other Defense Organizations Working Capital Funds 97-4930 $21,187
Army Working Capital Fund 97-4930.001 $30,466 $202,742
Navy Working Capital Fund 97-4930.002 $9,680
Air Force Working Capital Fund 97-4930.003 $999 $0
Total $39,510,523 $452,595 $5,240 $209,114
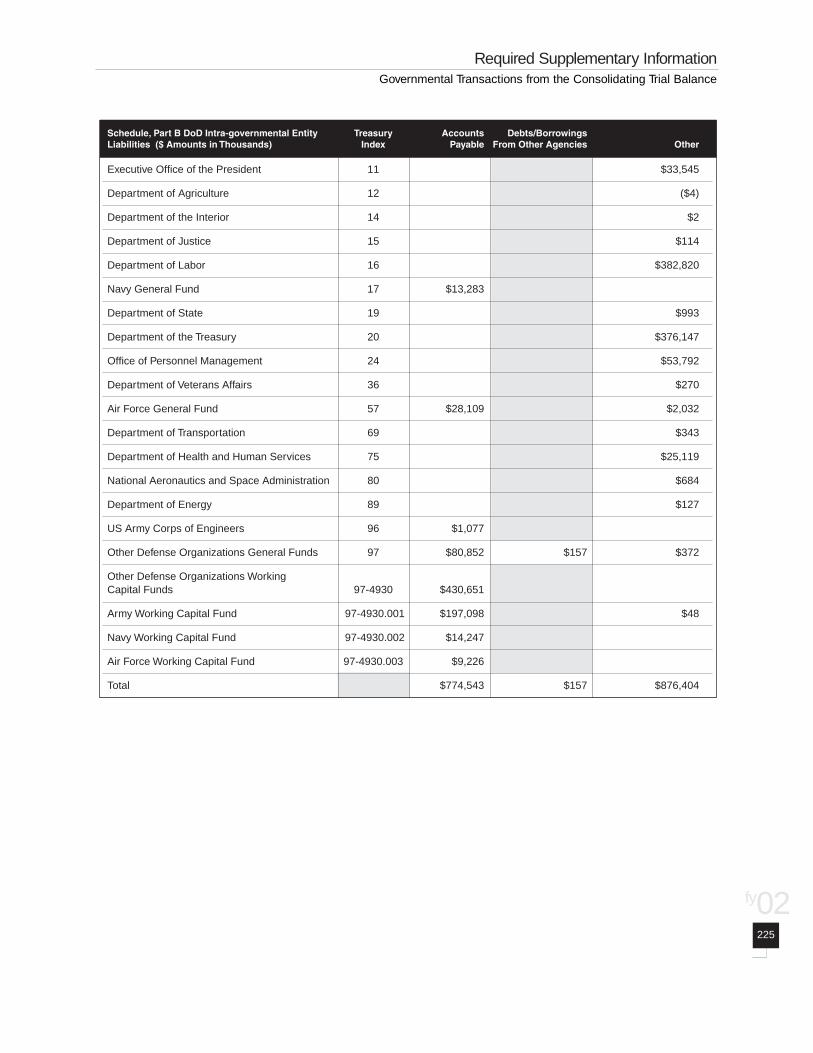
Required Supplementary Information
225
fy02
Schedule, Part B DoD Intra-governmental Entity Treasury Accounts Debts/BorrowingsLiabilities ($ Amounts in Thousands) Index Payable From Other Agencies Other
Executive Office of the President 11 $33,545
Department of Agriculture 12 ($4)
Department of the Interior 14 $2
Department of Justice 15 $114
Department of Labor 16 $382,820
Navy General Fund 17 $13,283
Department of State 19 $993
Department of the Treasury 20 $376,147
Office of Personnel Management 24 $53,792
Department of Veterans Affairs 36 $270
Air Force General Fund 57 $28,109 $2,032
Department of Transportation 69 $343
Department of Health and Human Services 75 $25,119
National Aeronautics and Space Administration 80 $684
Department of Energy 89 $127
US Army Corps of Engineers 96 $1,077
Other Defense Organizations General Funds 97 $80,852 $157 $372
Other Defense Organizations WorkingCapital Funds 97-4930 $430,651
Army Working Capital Fund 97-4930.001 $197,098 $48
Navy Working Capital Fund 97-4930.002 $14,247
Air Force Working Capital Fund 97-4930.003 $9,226
Total $774,543 $157 $876,404
Governmental Transactions from the Consolidating Trial Balance
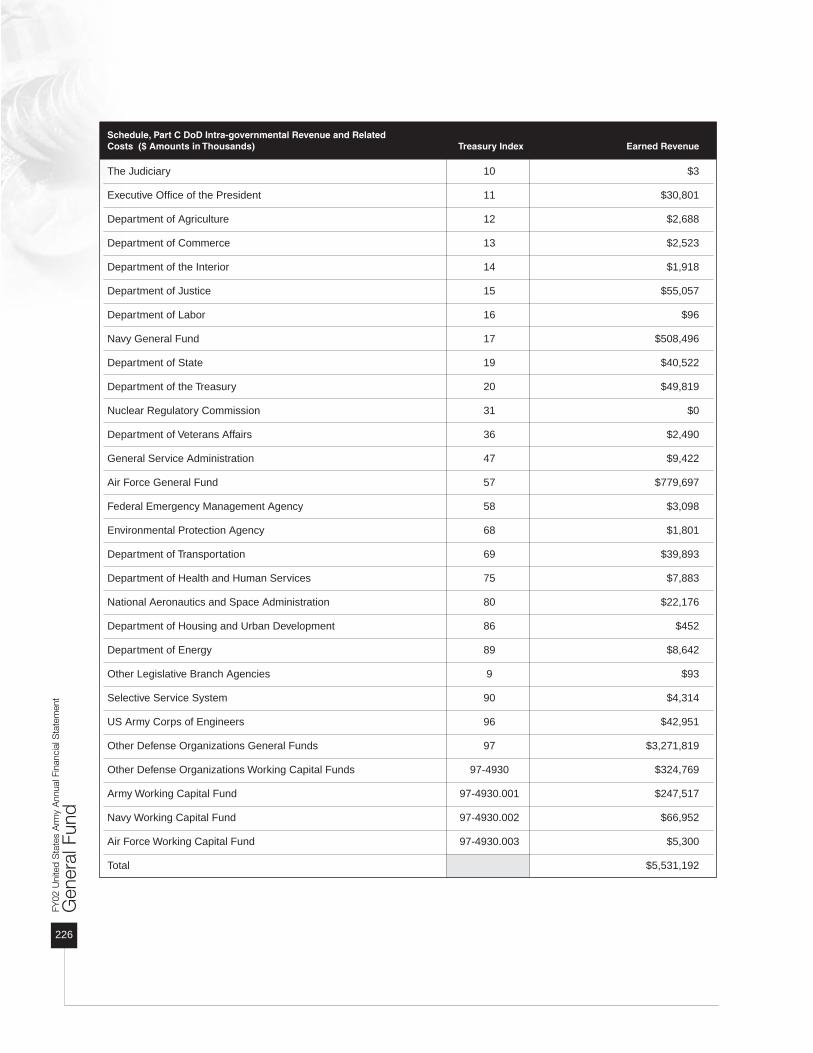
Gen
eral
Fun
d
226
FY02
Uni
ted
Sta
tes
Arm
y A
nnua
l Fin
anci
al S
tate
men
t
Schedule, Part C DoD Intra-governmental Revenue and RelatedCosts ($ Amounts in Thousands) Treasury Index Earned Revenue
The Judiciary 10 $3
Executive Office of the President 11 $30,801
Department of Agriculture 12 $2,688
Department of Commerce 13 $2,523
Department of the Interior 14 $1,918
Department of Justice 15 $55,057
Department of Labor 16 $96
Navy General Fund 17 $508,496
Department of State 19 $40,522
Department of the Treasury 20 $49,819
Nuclear Regulatory Commission 31 $0
Department of Veterans Affairs 36 $2,490
General Service Administration 47 $9,422
Air Force General Fund 57 $779,697
Federal Emergency Management Agency 58 $3,098
Environmental Protection Agency 68 $1,801
Department of Transportation 69 $39,893
Department of Health and Human Services 75 $7,883
National Aeronautics and Space Administration 80 $22,176
Department of Housing and Urban Development 86 $452
Department of Energy 89 $8,642
Other Legislative Branch Agencies 9 $93
Selective Service System 90 $4,314
US Army Corps of Engineers 96 $42,951
Other Defense Organizations General Funds 97 $3,271,819
Other Defense Organizations Working Capital Funds 97-4930 $324,769
Army Working Capital Fund 97-4930.001 $247,517
Navy Working Capital Fund 97-4930.002 $66,952
Air Force Working Capital Fund 97-4930.003 $5,300
Total $5,531,192

Required Supplementary Information
227
fy02
Schedule, Part E DoD Intra-governmental TreasuryNon-exchange Revenues ($ Amounts in Thousands) Index Transfers In Transfers Out
Air Force General Fund 57 $9,055
US Army Corps of Engineers 96 $0
Other Defense Organizations General Funds 97 $22,140
Army Working Capital Fund 97-4930.001 $74,349
Total $31,195 $74,349
Governmental Transactions from the Consolidating Trial Balance

Gen
eral
Fun
d
228
FY02
Uni
ted
Sta
tes
Arm
y A
nnua
l Fin
anci
al S
tate
men
t
January 8, 2003
MEMORANDUM FOR ASSISTANT SECRETARY OF THE ARMY (FINANCIALMANAGEMENT AND COMPTROLLER)
SUBJECT: Independent Auditor's Report on the Army General Fund Fiscal Year 2002 Principal Financial Statements (Report No. D-2003-0047)
The Chief Financial Officers (CFO) Act of 1990, as amended, requires the Inspector General of theDepartment of Defense to audit the accompanying Consolidated Balance Sheet of the Army General Fund asof September 30, 2002, and the related Consolidated Statements of Net Cost and Changes in Net Positionand the Combined Statements of Financing and Budgetary Resources for the fiscal years then ended. Thesefinancial statements are the responsibility of Army management. The Army is also responsible forimplementing effective internal control and for complying with laws and regulations. In addition to ourdisclaimer of opinion on the financial statements, we are including the required reports on internal controland compliance with laws and regulations. The Army did not prepare FY 2001 General Fund FinancialStatements due to the loss of financial management personnel during the September 11, 2001, terrorist attack.Because the Army did not prepare FY 2001 financial statements, an audit was not performed.
Disclaimer of Opinion on the Financial Statements The Assistant Secretary of the Army (Financial Management and Comptroller) has acknowledged that (1)Army General Fund financial management systems do not substantially comply with Federal financialmanagement systems requirements, generally accepted accounting principles, and the U.S. GovernmentStandard General Ledger at the transaction level and (2) Army General Fund financial management andfeeder systems cannot currently provide adequate evidence supporting various material amounts on thefinancial statements. Therefore, we did not perform auditing procedures to support material amounts on thefinancial statements. In addition, other auditing procedures were not performed because Section 1008(d) ofthe FY 2002 National Defense Authorization Act requires the Inspector General of the Department ofDefense to perform only the audit procedures required by generally accepted government auditing standardsconsistent with representations made by management. These material deficiencies also affected the reliabilityof certain financial information contained in the accompanying Management's Discussion and Analysis andcertain other information-much of which was taken from the same data sources as the principal financialstatements.1 These deficiencies would have precluded an audit opinion. Therefore, we are unable to express,and we do not express, an opinion on the financial statements and the accompanying information.
229
fy02
INSPECTOR GENERALDEPARTMENT OF DEFENSE
400 ARMY NAVY DRIVEARLINGTON, VIRGINIA 22202-4704
A Regular Statement and Account of the Receipts and Expenditures of all public Money shall be publishedfrom time to time. —Constitution of the United States Article I, Section 9
1 Other information includes the Supporting Consolidating and Combining Financial Statements, the Required Supplementary Stewardship Information, andRequired Supplementary Information.

Gen
eral
Fun
d
230
FY02
Uni
ted
Sta
tes
Arm
y A
nnua
l Fin
anci
al S
tate
men
t
Summary of Internal Control In planning and performing our audit, we considered Army internal control over financial reporting andcompliance. We did this to determine our procedures for auditing the financial statements and to complywith Office of Management and Budget guidance but not to express an opinion on internal control.Accordingly, we do not express an opinion on internal control over financial reporting and compliancebecause previously identified reportable conditions,2 all of which are material, continue to exist in thefollowing areas:
financial management systems
accounting adjustments;
intragovernmental transactions and eliminations;
Fund Balance with Treasury;
Accounts Receivable;
Inventory and Related Property;
General Property, Plant, and Equipment;
Accounts Payable;
Other Liabilities;
National Defense Property, Plant, and Equipment;
problem disbursements;
Statement of Net Cost;
Statement of Financing; and
Statement of Budgetary Resources.
A material weakness is a condition that precludes the entity's internal control from providing reasonableassurance that misstatements, losses, or noncompliance that are material in relation to the financial statementswould be prevented or detected on a timely basis. Our internal control work would not necessarily discloseall material weaknesses. See the Attachment for additional details on material internal control weaknesses.
2 Reportable conditions are matters coming to the auditor's attention that, in his or her judgment, should be communicated to management because theyrepresent significant deficiencies in the design or operation of internal control, which could adversely affect the organization's ability to initiate, record,process, and report financial data consistent with the assertions of management in financial statements.
A Regular Statement and Account of the Receipts and Expenditures of all public Money shall be publishedfrom time to time. —Constitution of the United States Article I, Section 9

Summary of Compliance With Laws and Regulations Our work to determine compliance with selected provisions of the applicable laws and regulations waslimited because management acknowledged instances of noncompliance, and previously reported instancesof noncompliance continued to exist. The Army was unable to comply with the requirements of the CFO Actof 1990, as amended. The Army has acknowledged that many of its financial management and feedersystems did not comply with the requirements of the Federal Financial Management Improvement Act of1996. The Army was also unable to comply with Government Performance and Results Act requirementsbecause it did not have cost accounting systems in place to collect, process, and report operating costs.Therefore, we did not determine whether the Army was in compliance with all other applicable laws andregulations related to financial reporting. See the Attachment for additional details on compliance with lawsand regulations.
In order for DoD to comply with statutory reporting requirements and applicable financial systemsrequirements, the Under Secretary of Defense (Comptroller)/Chief Financial Officer is developing the DoD-wide financial management enterprise architecture. DoD anticipates developing and implementing theenterprise architecture by 2007. Until the enterprise architecture is developed and implemented, the Armywill be unable to fully comply with statutory reporting requirements.
We caution that other noncompliance may have occurred and not been detected. Further, the results of ourlimited procedures may not be sufficient for other purposes. Our objective was not to express an opinion oncompliance with applicable laws and regulations.
Management ResponsibilityManagement is responsible for:
preparing the financial statements in conformity with generally accepted accounting principles;
establishing, maintaining, and assessing internal control to provide reasonable assurance that the broadcontrol objectives of the Federal Managers' Financial Integrity Act of 1982 are met;
ensuring that the Army financial management systems substantially comply with Federal FinancialManagement Improvement Act of 1996 requirements; and
complying with applicable laws and regulations.
David K. SteensmaDeputy Assistant Inspector General
for Auditing
Opinion Report
231
fy02A Regular Statement and Account of the Receipts and Expenditures of all public Money shall be publishedfrom time to time. —Constitution of the United States Article I, Section 9

Gen
eral
Fun
d
232
FY02
Uni
ted
Sta
tes
Arm
y A
nnua
l Fin
anci
al S
tate
men
t
Reports on Internal Control and Compliance with Laws andRegulations
Internal ControlManagement is responsible for implementing effective internal control and for providing reasonableassurance that accounting data are accumulated, recorded, and reported properly; and that assets aresafeguarded. We performed reviews of the Army strategic plan for correcting accounting and reportingdeficiencies, and followed up on selected deficiencies in internal control over financial reporting identified inprior audit reports. We did not obtain sufficient evidence to support or express an opinion on internal controlbecause previously identified reportable conditions, all of which are material, continue to exist. Thefollowing material internal control weaknesses precluded an audit opinion of the Army General Fundfinancial statements and significantly impaired the ability of DoD to detect and investigate fraud or theft ofassets. A high risk of material misstatements will continue to exist until the internal control deficiencies arecorrected.
Financial Management Systems. Army accounting systems lacked a single standard transaction-drivengeneral ledger. In addition, the accounting systems did not produce account-oriented subsidiary ledgers, datafor physical assets were compiled using "work-around" procedures, and data from management systems werenot intended and not suitable for financial reporting. Consequently, the audit trails necessary to verify andreconcile account balances were inadequate. The Army also needed to upgrade or replace many of its feedersystems so that the requirements of financial statement reporting could be met. The lack of integrated,transaction-driven, financial management systems will continue to prevent the Army from preparingauditable financial statements until such time as they are corrected.
The Army has disclosed its financial management system deficiencies in the footnotes to the Army GeneralFund financial statements. The Army stated that elements of Federal generally accepted accountingprinciples were not met due to limitations of its financial and non-financial management processes andsystems. The Army derives its reported values and information for major asset and liability accounts fromnon-financial feeder systems, such as inventory and logistics systems. Major assets include Property, Plant,and Equipment (PP&E), and Inventory and Related Property. The Army generally records transactions on abudgetary basis, similar to a cash basis, and not an accrual accounting basis. Budgetary transactions wererecorded, for example, in Fund Balance with Treasury, accounts receivable, accounts payable, gross costs,and earned revenues. Until the Army systems are updated, Army financial data will be based on budgetarytransactions (obligations, disbursements, and collections).
Accounting Adjustments. Because of inadequate financial management systems and processes, journalvoucher adjustments and data calls were used to prepare the Army financial statements. The DefenseFinance and Accounting Service (DFAS) did not adequately support $500.1 billion in journal voucheradjustments to the general ledger accounts that were used to prepare the Army General Fund financialstatements. Journal vouchers were not properly prepared, reviewed, and approved. These unsupportedadjustments presented a material uncertainty regarding the line item balances on the FY 2002 Army GeneralFund financial statements. DFAS Indianapolis made:

$319.1 billion in unsupported adjustments to force general ledger accounts to agree with budgetary data,without reconciling the differences or determining which data source was correct;
$80.4 billion in unsupported adjustments to correct errors and reclassify amounts to other accounts;
$48.2 billion in unsupported adjustments to force amounts to agree with other sources of information andrecords or financial statement lines;
$27.1 billion in adjustments to intragovernmental accounts to force the accounts to agree with the recordsof Army's trading partners; and
$25.3 billion in unsupported adjustments to record financial information from data calls.
Intragovernmental Transactions and Eliminations. DoD and Army accounting systems did not capturetrading partner data at the transaction level in a manner that facilitated trading partner reconciliations, andDoD guidance did not require adequate support for eliminations. In addition, DoD procedures required thatbuyer-side transaction data be forced to agree with seller-side transaction data without performing properreconciliations. DFAS Indianapolis made $27.1 billion in unsupported adjustments to intragovernmentalaccounts to force the accounts to agree with the records of Army's trading partners. These adjustmentscaused both accounts receivable and accounts payable on the Balance Sheet and the breakout betweenintragovernmental and public costs on the Statement of Net Cost to be unsupported.
Fund Balance with Treasury. Cash balances between installation, headquarters, and U.S. Treasury recordscould not be reconciled. DoD financial systems were not integrated; errors in preparation and perpetuation offinancial information occurred; and the DoD collection and payment process had weaknesses. DFASIndianapolis increased Fund Balance with Treasury by $4.6 billion in unsupported adjustments through theending balance adjustment for FY 2002.
Accounts Receivable. DFAS made $125.7 million in unsupported adjustments to increase accountsreceivable balance because of the ending balance adjustment for FY 2002. Also, the Army disclosed in itsfinancial statement footnotes that it could not reconcile its $452.6 million intragovernmental accountsreceivable, or make proper eliminations.
Inventory and Related Property. Statements of Federal Financial Accounting Standards (SFFAS) No. 3requires the use of the consumption method of accounting for Operating Materials and Supplies; however,DoD has acknowledged that its entities use the purchase method of accounting for a significant amount ofOperating Materials and Supplies. Operating Materials and Supplies in-transit records were not properlyclosed out and Operating Materials and Supplies were reported using the purchase method of accounting,instead of the consumption method. Inventories were reported at latest acquisition cost because Armysystems do not maintain historical data. An unsupported adjustment for $590 million was used to correct anabnormal balance in the Conventional Ammunition Working Capital Fund allowance account. In addition,the Army disclosed that audit results have identified uncertainties about the completeness and existence ofquantities reported.
Opinion Report
233
fy02
Gen
eral
Fun
d
234
FY02
Uni
ted
Sta
tes
Arm
y A
nnua
l Fin
anci
al S
tate
men
t
General Property, Plant, and Equipment. SFFAS No. 6 requires that all PP&E be recorded at cost. It alsorequires that depreciation expense be recognized on all general PP&E. Depreciation is to be calculatedthrough the systematic and rational allocation of the cost of general PP&E, less the estimated salvage orresidual value, over the estimated useful life. Army systems were unable to capture the correct acquisitiondate and cost and could not provide reliable information for reporting account balances and computingdepreciation.
Accounts Payable. DFAS made $713.5 million in unsupported adjustments that increased accounts payablebalances through the FY 2002 ending balance adjustment. The Army disclosed that it could not reconcile its$775 million intragovernmental accounts payable, or make proper eliminations. As a result, DFASIndianapolis made $1.3 billion in unsupported adjustments to increase accounts payable with the public andmade $697.6 million in unsupported adjustments to decrease intragovernmental accounts payable in order toforce the amounts to agree with Army's trading partners.
Other Liabilities. The Army was working on determining what actions are needed to improveaccountability over environmental liabilities. Also, accrued funded payroll included an unsupportedadjustment of $3.4 billion made to the general ledger data. The Army had not established controls andprocedures to express an opinion in its legal representation letter on the likely outcome of 220 pending legalcases or to estimate value of the Government's potential monetary loss as required by Office of Managementand Budget Bulletin No. 01-02, "Audit Requirement for Federal Financial Statements," October 16, 2002.However, some case narratives showed that the Government is seeking settlement or settlement is pending.As a result, contingent liabilities on the Balance Sheet or the footnotes are probably understated.
National Defense Property, Plant, and Equipment. SSFAS No. 8 requires reporting the value of NationalDefense PP&E using the total cost or the latest acquisition cost method. The Army did not include NationalDefense PP&E in its Required Supplementary Stewardship Information. Processes and procedures to captureand report that material did not provide reasonable assurance that the data were accurate and complete.
Problem Disbursements. Problem disbursements occurred because accounting and finance systems werenot integrated and disbursements were made by organizations that were not collocated with the accountingstations. Therefore, errors and delays occurred in posting disbursement data to accounting records. As ofSeptember 30, 2002, the Army General Fund reported $160.7 million (absolute value) of unmatcheddisbursements, $21 million (absolute value) of negative unliquidated obligations and $710.2 million (netvalue) of in-transit disbursements. These payments and collections have been reported to the Treasury, buthave not been recorded in the Department's accounting records. This adversely affects expenditure rates andrevenue recognition, and distorts financial statements.
Statement of Net Cost. SFFAS No. 4 requires that Federal agencies provide reliable and timely informationon the full cost of Federal programs, activities, and outputs. DoD entities use the major appropriationcategories, as set forth by the Congress, instead of program-level information. This approach does not meetthe intent of SFFAS No. 4. Appropriation categories are not consistent with DoD performance goals andmeasures and are inappropriate for the preparation of the Statement of Net Cost, which is intended to showthe full net cost for entity programs. An appropriation is a funding mechanism that does not record accrued

expenses, and a program may use more than one appropriation and include non-productive costs allocated toentity programs, such as accrued expenses. The Army also used budgetary data to record expenses.Specifically, DFAS made $10.9 billion in unsupported adjustments to force costs to agree with obligationinformation. In addition, Army intragovernmental transactions were not properly accounted for, reported,and appropriately eliminated, because DoD did not require trading partner reconciliations and DFASIndianapolis was unable to reconcile Army intragovernmental transactions with its trading partners. As aresult, DFAS Indianapolis made $13.8 billion in unsupported adjustments to decrease intragovernmentalcosts and $14.3 billion in unsupported adjustments to increase cost with the public in order to force buyer-side transaction data to agree with seller-side transaction data.
Statement of Financing. The Statement of Financing was prepared on a combined basis, whereas, theStatement of Net Cost was prepared on a consolidated basis. Also, DFAS Indianapolis made $3.7 billion inunsupported adjustments to force the Statement of Financing to match similar information on the Statementof Net Cost.
Statement of Budgetary Resources. DFAS was unable to provide a single database supporting thesummary transactions used to prepare the Army Reports on Budget Execution and the Army financialstatements. In addition, DFAS Indianapolis made $8.4 billion in unsupported adjustments to general ledgerdata used to prepare the Statement of Budgetary Resources.
Compliance with Laws and RegulationsManagement is responsible for compliance with existing laws and regulations related to financial reporting.Our work to determine compliance with selected provisions of the applicable laws and regulations waslimited because management acknowledged instances of noncompliance, and previously reported instancesof noncompliance continued to exist. Therefore, we did not determine whether the Army was in compliancewith selected provisions of all applicable laws and regulations related to financial reporting. Our objectivewas not to express an opinion on compliance with applicable laws and regulations.
Statutory Financial Management Systems Reporting Requirements. The Army is required to complywith the following financial management systems reporting requirements.
The Federal Financial Management Improvement Act of 1996 requires DoD to establish and maintainfinancial management systems that comply substantially with the Federal financial management systemsrequirements, applicable Federal accounting standards, and the U.S. Government Standard General Ledger atthe transaction level. In addition, the Federal Managers' Financial Integrity Act of 1982 requires DoD toevaluate the systems and to annually report whether those systems are in compliance with applicablerequirements. The CFO Act requires that each agency develop and maintain an integrated agency accountingand financial management system, including financial reporting and internal control. The system shouldcomply with internal control standards, applicable accounting principles, standards, and requirements, andprovide for complete, reliable, consistent, and timely information.
The Army acknowledged that many of its critical financial management and feeder systems do not complysubstantially with the Federal financial management systems requirements, Federal accounting standards, and
Opinion Report
235
fy02

Gen
eral
Fun
d
236
FY02
Uni
ted
Sta
tes
Arm
y A
nnua
l Fin
anci
al S
tate
men
t
the U.S. Government Standard General Ledger at the transaction level. The Army was also unable to complywith the CFO Act because its financial management systems were not integrated and it has acknowledgedthat many of its financial management and feeder systems did not comply with applicable Federal accountingstandards.
In an attempt to comply with statutory reporting requirements and applicable financial systems requirementsin the future, DoD plans to develop a DoD-wide financial management enterprise architecture. Theenterprise architecture is intended to provide a "blueprint" of DoD financial management systems andprocesses to initiate a comprehensive financial management reform effort. Until the architecture isdeveloped, the Army will be unable to fully comply with the statutory reporting requirements. Therefore, wedid not perform tests of compliance for these requirements.
Government Performance and Results Act (GPRA). The GPRA requires that each Federal agencyprepare a strategic plan and annual performance plans and reports. Until the DoD-wide financialmanagement enterprise architecture is developed, DoD will be unable to fully measure its performance goalsrelated to financial and information management. The Army did not comply with GPRA because it did nothave cost accounting systems in place to collect, process, and report operating costs. This resulted in theArmy Statement of Net Cost being unable to provide cost-of-operations data that were consistent with GPRAperformance goals and measures.
Audit DisclosuresWe recognize that there were additional laws and regulations pertinent to Army General Fund financialoperations during FY 2002. However, in accordance with Public Law 107-107, the "National DefenseAuthorization Act for Fiscal Year 2002," we limited our audit scope and performed only audit proceduresrequired by generally accepted government auditing standards consistent with the representations made bythe Assistant Secretary of the Army (Financial Management and Comptroller) in the engagementmemorandum signed on August 21, 2002. Therefore, we did not perform tests of compliance for theserequirements.
Anti-Deficiency Act.
Provisions Governing Claims of the United States Government.
Federal Credit Reform Act of 1990.
Pay and Allowance System for Civilian Employees.
Prompt Pay Act.
The Assistant Secretary of the Army (Financial Management and Comptroller) acknowledged in theEngagement Memorandum signed on August 21, 2002, that the Army financial management systems couldnot provide adequate evidence supporting various material amounts on the financial statements. As a result,we were unable to obtain adequate evidential matter to form or express an opinion on the financialstatements, internal control, and compliance with laws and regulations.

1. ASSETS (Note 2)A. Intragovernmental:
1. Fund Balance with Treasury (Note 3)2. Investments (Note 4)3. Accounts Receivable (Note 5)4. Other Assets (Note 6)5. Total Intragovernmental Assets
B. Cash and Other Monetary Assets (Note 7)C. Accounts Receivable (Note 5)D. Loans Receivable (Note 8)E. Inventory and Related Property (Note 9)F. General Property, Plant and Equipment (Note 10)G. Other Assets (Note 6)
2. TOTAL ASSETS
3. LIABILITIES (Note 11)A. Intragovernmental:
1. Accounts Payable (Note 12)2. Debt (Note 13)3. Environmental Liabilities (Note 14)4. Other Liabilities (Notes 15 and 16)5. Total Intragovernmental Liabilities
B. Accounts Payable (Note 12)C. Military Retirement Benefits and Other Employment-
Related Actuarial Liabilities (Note 17)D. Environmental Liabilities (Note 14)E. Loan Guarantee Liability (Note 8)F. Other Liabilities (Notes 15 and 16)
4. TOTAL LIABILITIES
5. NET POSITIONA. Unexpended Appropriations (Note 18)B. Cumulative Results of Operations
6. TOTAL NET POSITION
7. TOTAL LIABILITIES AND NET POSITION
See Note 1 and Note 2.
Consolidated Balance Sheet
The accompanying notes are an integral part of these statements.
237
fy02
Department of Defense • Department of the Army As of September 30, 2002 and 2001 ($ in thousands)
FY 2001
$325,682 0
276,355 27,006
$629,043 $0
22,622 0
10,791,280 1,149,629
274,330
$12,866,904
$67,184 0 0
118,906 $186,090 $355,452
308,657 0 0
209,928
$1,060,127
$38,860 11,767,917
$11,806,777
$12,866,904
FY 2002
$251,030 0
221,978 48
$473,056 $0
16,419 0
11,319,284 1,250,240
251,298
$13,310,297
$77,257 0 0
262,039 $339,566 $511,007
304,524 0 0
212,055
$1,367,152
$30,043 11,913,102
$11,943,145
$13,310,297
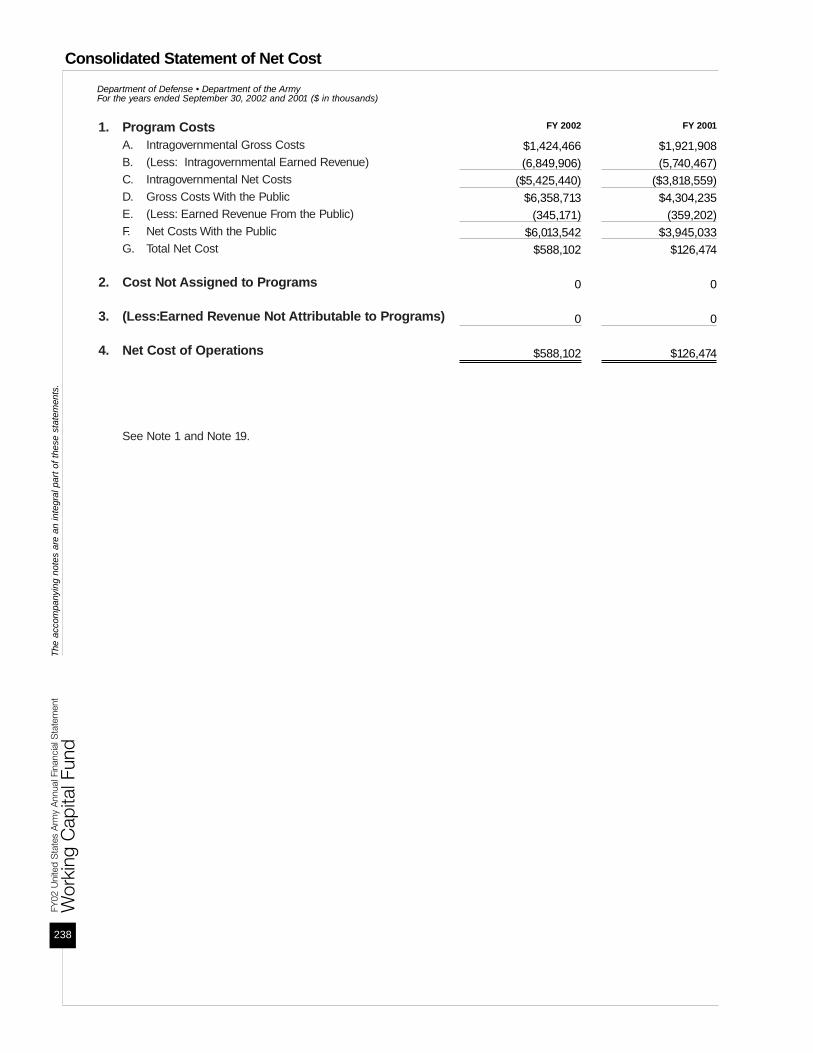
1. Program CostsA. Intragovernmental Gross CostsB. (Less: Intragovernmental Earned Revenue)C. Intragovernmental Net CostsD. Gross Costs With the PublicE. (Less: Earned Revenue From the Public)F. Net Costs With the PublicG. Total Net Cost
2. Cost Not Assigned to Programs
3. (Less:Earned Revenue Not Attributable to Programs)
4. Net Cost of Operations
See Note 1 and Note 19.
Wor
king
Cap
ital F
und
FY02
Uni
ted
Sta
tes
Arm
y A
nnua
l Fin
anci
al S
tate
men
t
238
Consolidated Statement of Net CostT
he a
ccom
pany
ing
note
s ar
e an
inte
gral
par
t of t
hese
sta
tem
ents
.
Department of Defense • Department of the Army For the years ended September 30, 2002 and 2001 ($ in thousands)
FY 2001
$1,921,908 (5,740,467)
($3,818,559)$4,304,235
(359,202)$3,945,033
$126,474
0
0
$126,474
FY 2002
$1,424,466 (6,849,906)
($5,425,440)$6,358,713
(345,171)$6,013,542
$588,102
0
0
$588,102

CUMULATIVE RESULTS OF OPERATIONSBeginning BalancesPrior period adjustments (+/-)Beginning Balances, as adjusted
Budgetary Financing Sources:Appropriations receivedAppropriations transferred-in/out (+/-)Other adjustments (rescissions, etc) (+/-)Appropriations usedNonexchange revenueDonations and forfeitures of cash and cash equivalentsTransfers-in/out without reimbursement (+/-)Other budgetary financing sources (+/-)
Other Financing Sources:Donations and forfeitures of propertyTransfers-in/out without reimbursement (+/-)Imputed financing from costs absorbed by othersOther (+/-)
Total Financing SourcesNet Cost of Operations (+/-)Ending Balances
UNEXPENDED APPROPRIATIONSBeginning BalancesPrior period adjustments (+/-)Beginning Balances, as adjusted
Budgetary Financing Sources:Appropriations receivedAppropriations transferred-in/out (+/-)Other adjustments (rescissions, etc) (+/-)Appropriations usedNonexchange revenueDonations and forfeitures of cash and cash equivalentsTransfers-in/out without reimbursement (+/-)Other budgetary financing sources (+/-)
Other Financing Sources:Donations and forfeitures of propertyTransfers-in/out without reimbursement (+/-)Imputed financing from costs absorbed by othersOther (+/-) total Financing Sources
Total Financing SourcesNet Cost of Operations (+/-)Ending Balances
See Note 1 and Note 20.
Consolidated Statement of Changes in Net Position
The accompanying notes are an integral part of these statements.
239
fy02
Department of Defense • Department of the Army For the years ended September 30, 2002 and 2001 ($ in thousands)
FY 2001
$11,849,314 1,463,816
$13,313,130
0 0 0
29,082 0 0 0
(1,558,924)
0 6,073
105,030 0
($1,418,739)126,474
$11,767,917
$55,990 0
$55,990
(17,130)0 0 0 0 0 0 0
00 0 0
($17,130)0
$38,860
FY 2002
$11,767,917 0
$11,767,917
0 0 0
176,217 170,039
0 0
202,799
0 74,348
109,884 0
$733,287 588,102
$11,913,102
$38,860 0
$38,860
167,400 0 0
(176,217)0 0 0 0
00 0 0
($8,817)0
$30,043

Wor
king
Cap
ital F
und
FY02
Uni
ted
Sta
tes
Arm
y A
nnua
l Fin
anci
al S
tate
men
t
240
Combined Statement of Budgetary ResourcesT
he a
ccom
pany
ing
note
s ar
e an
inte
gral
par
t of t
hese
sta
tem
ents
.
Department of Defense • Department of the Army For the years ended September 30, 2002 and 2001 ($ in thousands)
Budgetary Resources:A. Budget Authority:
Appropriations receivedBorrowing authorityContract authorityNet transfers (+/-)Other
B. Unobligated balance:Beginning of periodNet transfers, actual (+/-)Anticipated Transfers Balances
C. Spending authority from offsetting collections:Earned
CollectedReceivable from Federal sources
Change in unfilled customer ordersAdvance receivedWithout advance from Federal sources
Anticipated for the rest of year, without advancesTransfers from trust fundsSubtotal
D. Recoveries of prior year obligationsE. Temporarily not available pursuant to Public LawF Permanently not availableG Total Budgetary Resources
Status of Budgetary Resources:H. Obligations incurred:
DirectReimbursableSubtotal
I. Unobligated balance:ApportionedExempt from apportionmentOther available
J. Unobligated Balances Not AvailableK. Total, Status of Budgetary Resources
Relationship of Obligations to Outlays:L. Obligated Balance, Net - beginning of periodM. Obligated Balance transferred, net (+/-)N. Obligated Balance, Net - end of period:
Accounts receivableUnfilled customer order from Federal sourcesUndelivered ordersAccounts payable
O. Outlays:DisbursementsCollectionsSubtotal
P. Less: Offsetting receiptsQ. Net Outlays
See Note 1 and Note 21.
FY 2001
$11,952 0
809,853 00
1,352,632 6,100
0
05,920,104
(88,265)0
24,505 (721,912)
00
$5,134,432 196,090
00
$7,511,059
$(717,549)6,723,163
$6,005,614
1,505,447 0
(2)0
$7,511,059
$821,673 0
(335,328)(2,123,227)
2,995,646 592,401
6,311,883 (5,944,608)
$367,275 0
$367,275
FY 2002
$167,400 0
66,607 00
1,505,447 00
06,145,494
(55,125)0
128,906 177,233
00
$6,396,508 403,899
00
$8,539,861
$171,652 6,659,961
$6,831,613
1,708,248 000
$8,539,861
$1,129,489 0
(280,204)(2,300,462)
2,770,002 729,331
- 6,516,428
(6,274,399)$242,029
0$242,029

Combined Statement of Financing
The accompanying notes are an integral part of these statements.
241
fy02
Department of Defense • Department of the Army For the years ended September 30, 2002 and 2001 ($ in thousands)
Resources Used to Finance Activities:
Budgetary Resources Obligated1. Obligations incurred2. Less: Spending authority from offsetting collections and
recoveries (-)3. Obligations net of offsetting collections and recoveries4. Less: Offsetting receipts (-)5. Net obligations
Other Resources6. Donations and forfeitures of property7. Transfers in/out without reimbursement (+/-)8. Imputed financing from costs absorbed by others9. Other (+/-)10. Net other resources used to finance activities
11. Total resources used to finance activities
Resources Used to Finance Items not Part of the NetCost of Operations
12. Change in budgetary resources obligated for goods,services and benefits ordered but not yet providedUndelivered Orders (-)Unfilled Customer Orders
13. Resources that fund expenses recognized in prior periods14. Budgetary offsetting collections and receipts that do not
affect net cost of operations15. Resources that finance the acquisition of assets16. Other resources or adjustments to net obligated
resources that do not affect net cost of operationsLess: Trust or Special Fund Receipts Related to
Exchange in the Entity's Budget (-)Other (+/-)
17. Total resources used to finance items not part ofthe net cost of operations
18. Total resources used to finance the net cost ofoperations
See Note 1 and Note 22.
2002 Combined
$6,831,613
(6,800,407)$31,206
0$31,206
0 0
109,884 0
$109,844
$141,090
259,206 306,139 (4,133)
0(338,258)
00
222,954
$364,044
2001 Combined
$6,005,613
(5,330,521)$675,092
0$675,092
00
105,030 0
$105,030
$780,122
365,539 (697,406)
(4,377)
0(2,660,662)
0(71,152)
(3,068,058)
$(2,287,936)

Wor
king
Cap
ital F
und
FY02
Uni
ted
Sta
tes
Arm
y A
nnua
l Fin
anci
al S
tate
men
t
242
Combined Statement of FinancingT
he a
ccom
pany
ing
note
s ar
e an
inte
gral
par
t of t
hese
sta
tem
ents
.
Department of Defense • Department of the Army For the years ended September 30, 2002 and 2001 ($ in thousands)
2002 Combined
$2,211 0
0
01,128
$3,339
105,065 107,703
7,951 $220,719
$224,058
$588,102
2001 Combined
$00
0
016,675
$16,675
85,460 1,588,075
484,690 $2,158,225
$2,174,900
($113,036)
Components of the Net Cost of Operations that will notRequire or Generate Resources in the Current Period:
Components Requiring or Generating Resources inFuture Periods:
19. Increase in annual leave liability20. Increase in environmental and disposal liability21. Upward/Downward reestimates of credit subsidy expense
(+/-)22. Increase in exchange revenue receivable from the
public (-)23. Other (+/-)24. Total components of Net Cost of Operations that will
require or generate resources in future periods
Components not Requiring or Generating Resources:25. Depreciation and amortization26. Revaluation of assets or liabilities (+/-)27. Other (+/-)28. Total components of Net Cost of Operations that
will not require or generate resources
29. Total components of net cost of operationsthat will not require or generate resources inthe current period
30. Net Cost of Operations

243
fy02
Notes to the Principal Financial StatementsNote 1. Significant Accounting PoliciesA. Basis of Presentation
These financial statements have been prepared to report the financial position and results of operations of theAWCF, as required by the "Chief Financial Officers Act of 1990," expanded by the "GovernmentManagement Reform Act of 1994," and other appropriate legislation. The financial statements have beenprepared from the books and records of the AWCF in accordance with the "DoD Financial ManagementRegulation," OMB Bulletin No. 01-09, "Form and Content of Agency Financial Statements," and to theextent possible Federal GAAP. The accompanying financial statements account for all resources for whichthe AWCF is responsible except that information relative to classified assets, programs, and operations hasbeen excluded from the statement or otherwise aggregated and reported in such a manner that it is no longerclassified. The AWCF's financial statements are in addition to the financial reports also prepared by the DoDpursuant to OMB directives that are used to monitor and control the AWCF' use of budgetary resources.
The AWCF is unable to implement fully all elements of Federal GAAP and OMB Bulletin No. 01-09 due tolimitations of its financial and nonfinancial management processes and systems. The AWCF derives itsreported values and information for major assets and liability categories largely from nonfinancial feedersystems, such as inventory systems and logistic systems. These were designed to support reportingrequirements focusing on maintaining accountability over assets and reporting the status of federalappropriations rather than preparing financial statements according to Federal GAAP. As a result, the AWCFcurrently cannot implement every aspect of Federal GAAP and OMB Bulletin No. 01-09. The AWCFcontinues to implement process and system improvements addressing the limitations of its financial andnonfinancial feeder systems. The AWCF provides a more detailed explanation of these financial statementelements in the applicable footnote.
B. Mission of the Army Working Capital Fund (AWCF)Four separate activity groups make-up the AWCF: Supply Management, Depot Maintenance, Ordnance, andInformation Services. These separate activities ensure delivery, as needed, of critical items such as fuel,repair parts, consumable supplies, depot maintenance services and information services to the Department'swar fighters in the most efficient and cost-effective means available.
C. Appropriations and FundsThe Working Capital Fund (WCF) primarily operates through the use of revolving funds, however, they maybe supplemented by appropriated funding. They receive their initial working capital through anappropriation or a transfer of resources from existing appropriations or funds and use those capital resourcesto finance the initial cost of products and services. The AWCF generates financial resources by acceptingcustomer's orders, which replenish the initial working capital and permit continuing operations. The ArmyWorking Capital Fund operates with financial principles that provide improved cost visibility andaccountability to enhance business management and improve the decision making process. The activitiesprovide goods and services on a reimbursable basis. Receipts derived from operations generally are availablein their entirety for use without further congressional action.

Wor
king
Cap
ital F
und
244
FY02
Con
solid
ated
Arm
y A
nnua
l Fin
anci
al S
tate
men
ts
D. Basis of AccountingThe AWCF generally records transactions on an accrual accounting basis as required by Federal GAAP. ForFY 2002, the AWCF's financial management systems are unable to meet all of the requirements for fullaccrual accounting. Many of the AWCF's financial and nonfinancial feeder systems and processes weredesigned and implemented prior to the issuance of Federal GAAP for federal agencies and, therefore, werenot designed to collect and record financial information on the full accrual accounting basis as required byFederal GAAP.
The AWCF has undertaken efforts to determine the actions required to bring all of its financial andnonfinancial feeder systems and processes into compliance with all elements of Federal GAAP. One suchaction is the current revision of its accounting systems to record transactions based on the United StatesGovernment Standard General Ledger (USSGL). Until such time as all of the processes are updated tocollect and report financial information as required by Federal GAAP, some of the AWCF's financial datawill be based on budgetary transactions (obligations, disbursements, collections), and nonfinancial feedersystems. For example, most information presented on the Statement of Net Cost is based on accrued costs,however, some of the information is based on obligations and disbursements.
In addition, the AWCF is in the process of reviewing available data and attempting to develop a costreporting methodology that balances the need for cost information required by the Statement of FederalFinancial Accounting Standard (SFFAS) No. 4, "Managerial Cost Accounting Concepts and Standards for theFederal Government," with the need to keep the financial statements from being overly voluminous.
E. Revenues and other Financing SourcesDepot Maintenance and Ordnance Working Capital Funds (WCF) recognize revenue according to thepercentage of completion method. Supply Management WCF activities recognize revenue from the sale ofinventory items and Information Services recognizes revenue at the time the expense is incurred.
Other financing sources reported by the Department do not include non-monetary support provided by U.S.Allies for common defense and mutual security. The U.S. has agreements with foreign countries that includeboth direct and indirect sharing of costs that each country incurs in support of the same general purpose.Examples include countries where there is a mutual or reciprocal defense agreement, where U.S. troops arestationed, or where the U.S. fleet is serviced in a port. The DoD is reviewing these types of financing andcost reductions in order to establish accounting policies and procedures to identify what, if any, of these costsare appropriate for disclosure in the Department's financial statements in accordance with generally acceptedaccounting principles. Recognition of support provided by host nations would affect both financing sourcesand recognition of expenses
F. Recognition of ExpensesFor financial reporting purposes, the AWCF policy requires the recognition of operating expenses in theperiod incurred. The AWCF's expenditures for capital and other long-term assets are not recognized asoperating expenses until depreciated in the case of Property, Plant and Equipment (PP&E) or consumed inthe case of Operating Materials and Supplies (OM&S). Net increases or decreases in unexpendedappropriations are recognized as a change in the net position. Certain expenses, such as annual and militaryleave earned but not taken, are financed in the period in which payment is made.

Notes to Principal Statements
245
fy02
The AWCF adjusts operating expenses as a result of the elimination of balances between DoD Components.See Note 19.I, Intragovernmental Expenses and Revenue for disclosure of adjustment amounts.
G. Accounting for Intragovernmental ActivitiesThe AWCF, as an agency of the federal government, interacts with and is dependent upon the financialactivities of the federal government as a whole. Therefore, these financial statements do not reflect theresults of all financial decisions applicable to the AWCF as though the agency was a stand-alone entity.
Public DebtThe AWCF's proportionate share of public debt and related expenses of the federal government are notincluded. The federal government does not apportion debts and its related costs to federal agencies. TheAWCF's financial statements, therefore, do not report any portion of the public debt or interest thereon, nordo the statements report the source of public financing whether from issuance of debt or tax revenues.
Civilian Retirement SystemsThe AWCF's civilian employees participate in the Civil Service Retirement System (CSRS) and the FederalEmployees Retirement Systems (FERS). Additionally, employees and personnel covered by FERS also havevarying coverage under Social Security. The AWCF funds a portion of the civilian and military pensions.Reporting civilian pensions under the CSRS and FERS retirement systems is the responsibility of the Officeof Personnel Management (OPM). The AWCF recognizes an imputed expense for the portion of civilianemployee pensions and other retirement benefits funded by the OPM in the Statement of Net Cost; andrecognizes corresponding imputed revenue from the civilian employee pensions and other retirement benefitsin the Statement of Changes in Net Position.
Inter/Intragovernmental EliminationPreparation of reliable financial statements requires transactions occurring between components or activitiesof the AWCF be eliminated. The Defense Finance and Accounting Service (DFAS) is responsible foreliminating transactions between components or activities of the AWCF. However, the AWCF, as well as therest of the federal government, cannot accurately identify all intragovernmental transactions by customer.For FY 1999 and beyond seller entities within the Department provided summary seller-side balances forrevenue, accounts receivable, and unearned revenue to the buyer-side internal AWCF accounting offices. Inmost cases, the buyer-side records have been adjusted to recognize unrecorded costs and accounts payable.Intra-AWCF intragovernmental balances then are eliminated.
The Department of the Treasury, Financial Management Service (FMS) is responsible for eliminatingtransactions between the Department and other federal agencies. In September 2000, the FMS issued the"Federal Intragovernmental Transactions Accounting Policies and Procedures Guide." The Department wasnot able to implement fully the policies and procedures in this guide related to reconciling intragovernmentalassets, liabilities, revenues, and expenses for non-fiduciary transactions. The AWCF, however, was able toimplement the policies and procedures contained in the "Intragovernmental Fiduciary TransactionsAccounting Guide," as updated by the "Federal Intragovernmental Transactions Accounting Policies andProcedures Guide," for reconciling intragovernmental transactions pertaining to investments in federalsecurities, borrowings from the United States (U.S.) Treasury and the Federal Financing Bank, Federal

Wor
king
Cap
ital F
und
246
FY02
Con
solid
ated
Arm
y A
nnua
l Fin
anci
al S
tate
men
ts
Employees' Compensation Act transactions with the Department of Labor (DoL), and benefit programtransactions with the OPM.
H. Transactions with Foreign Governments and International OrganizationsEach year, the AWCF Components sell defense articles and services to foreign governments and internationalorganizations, primarily under the provisions of the "Arms Export Control Act of 1976." Under theprovisions of the Act, the Department has authority to sell defense articles and services to foreign countriesand international organizations, generally at no profit or loss to the U.S. Government. Customers may berequired to make payments in advance.
I. Funds with the U.S. TreasuryThe AWCF's financial resources are maintained in U.S. Treasury accounts. DFAS, Military Services, U.S.Army Corp of Engineers disbursing stations, and the Department of State financial service centers processthe majority of cash collections, disbursements, and adjustments worldwide. Each disbursing stationprepares monthly reports, which provide information to the U.S. Treasury on check issues, electronic fundtransfers, interagency transfers and deposits.
In addition, the DFAS sites and the USACE Finance Center submit reports to the Department of theTreasury, by appropriation, on interagency transfers, collections received, and disbursements issued. TheDepartment of the Treasury then records this information to the applicable Fund Balance with Treasury(FBWT) account maintained in the Treasury's system. Differences between the AWCF's recorded balance inthe FBWT accounts and Treasury's FBWT accounts sometimes result and are reconciled subsequently. SeeNote 3, Fund Balance with Treasury for material disclosure. Differences between accounting offices' detail-level records and Treasury's FBWT accounts are disclosed in Note 21.B, specifically, differences caused byin-transit disbursements and unmatched disbursements (which are not recorded in the accounting offices'detail-level records).
J. Foreign CurrencyNot Applicable
K. Accounts ReceivableAs presented in the Balance Sheet statement, accounts receivable includes accounts, claims, and refundsreceivable from other federal entities or from the public. The AWCF bases the allowances for uncollectibleaccounts that are due from the public upon analysis of collection experience. The AWCF does not recognizean allowance for estimated uncollectible amounts from other federal agencies. Claims against other federalagencies are resolved between the agencies. See Note 5, Accounts Receivable for material disclosure.
L. Loans ReceivableNot Applicable
M. Inventories and Related PropertyInventories are reported at approximate historical cost using Latest Acquisition Cost (LAC) adjusted forholding gains and losses.
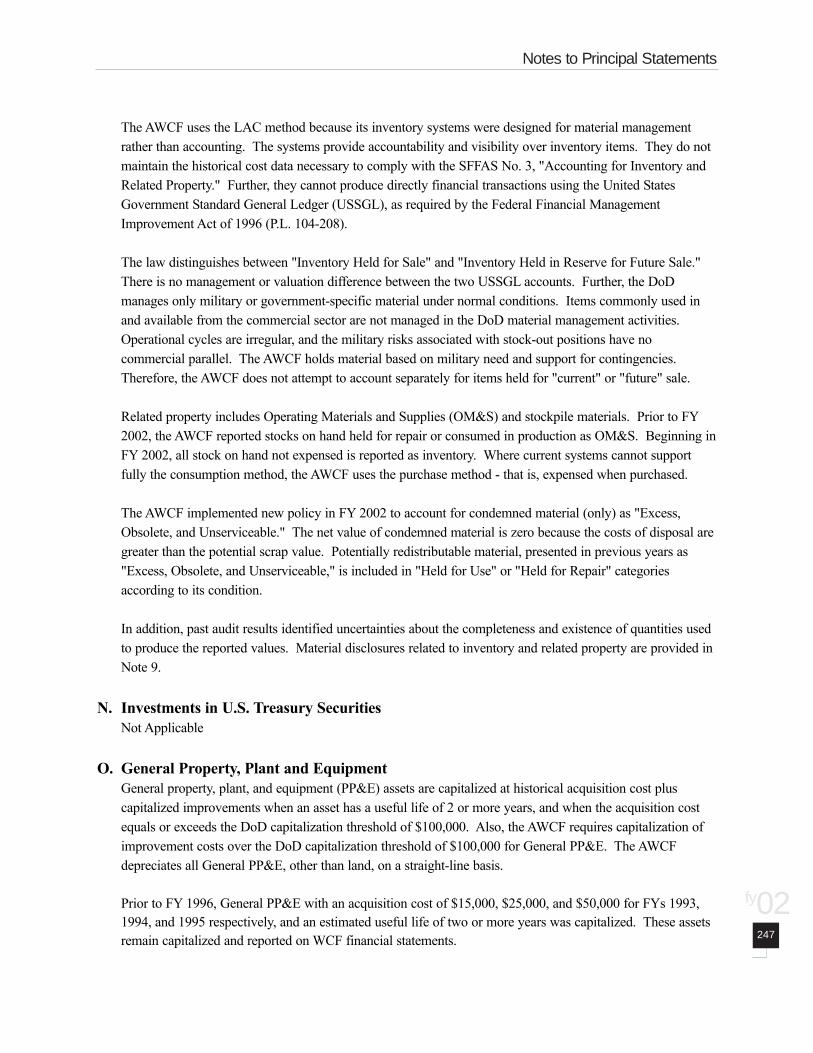
Notes to Principal Statements
247
fy02
The AWCF uses the LAC method because its inventory systems were designed for material managementrather than accounting. The systems provide accountability and visibility over inventory items. They do notmaintain the historical cost data necessary to comply with the SFFAS No. 3, "Accounting for Inventory andRelated Property." Further, they cannot produce directly financial transactions using the United StatesGovernment Standard General Ledger (USSGL), as required by the Federal Financial ManagementImprovement Act of 1996 (P.L. 104-208).
The law distinguishes between "Inventory Held for Sale" and "Inventory Held in Reserve for Future Sale."There is no management or valuation difference between the two USSGL accounts. Further, the DoDmanages only military or government-specific material under normal conditions. Items commonly used inand available from the commercial sector are not managed in the DoD material management activities.Operational cycles are irregular, and the military risks associated with stock-out positions have nocommercial parallel. The AWCF holds material based on military need and support for contingencies.Therefore, the AWCF does not attempt to account separately for items held for "current" or "future" sale.
Related property includes Operating Materials and Supplies (OM&S) and stockpile materials. Prior to FY2002, the AWCF reported stocks on hand held for repair or consumed in production as OM&S. Beginning inFY 2002, all stock on hand not expensed is reported as inventory. Where current systems cannot supportfully the consumption method, the AWCF uses the purchase method - that is, expensed when purchased.
The AWCF implemented new policy in FY 2002 to account for condemned material (only) as "Excess,Obsolete, and Unserviceable." The net value of condemned material is zero because the costs of disposal aregreater than the potential scrap value. Potentially redistributable material, presented in previous years as"Excess, Obsolete, and Unserviceable," is included in "Held for Use" or "Held for Repair" categoriesaccording to its condition.
In addition, past audit results identified uncertainties about the completeness and existence of quantities usedto produce the reported values. Material disclosures related to inventory and related property are provided inNote 9.
N. Investments in U.S. Treasury SecuritiesNot Applicable
O. General Property, Plant and EquipmentGeneral property, plant, and equipment (PP&E) assets are capitalized at historical acquisition cost pluscapitalized improvements when an asset has a useful life of 2 or more years, and when the acquisition costequals or exceeds the DoD capitalization threshold of $100,000. Also, the AWCF requires capitalization ofimprovement costs over the DoD capitalization threshold of $100,000 for General PP&E. The AWCFdepreciates all General PP&E, other than land, on a straight-line basis.
Prior to FY 1996, General PP&E with an acquisition cost of $15,000, $25,000, and $50,000 for FYs 1993,1994, and 1995 respectively, and an estimated useful life of two or more years was capitalized. These assetsremain capitalized and reported on WCF financial statements.

Wor
king
Cap
ital F
und
248
FY02
Con
solid
ated
Arm
y A
nnua
l Fin
anci
al S
tate
men
ts
Government Equipment in the Hands of ContractorsWhen it is in the best interest of the government, the AWCF provides to contractors government propertynecessary to complete contract work. The AWCF either owns or leases such property, or it is purchaseddirectly by the contractor for the government based on contract terms. When the value of contractorprocured General PP&E exceeds the DoD capitalization threshold, such PP&E is required to be included inthe value of General PP&E reported on the AWCF's Balance Sheet. The AWCF completed a study thatindicates that the value of General PP&E above the DoD capitalization threshold, not older than the DoDStandard Recovery Periods for depreciation and that are presently in the possession of contractors, isimmaterial to the AWCF's financial statements. Regardless, the AWCF is developing new policies and acontractor reporting process that will provide appropriate General PP&E information for future financialstatement reporting purposes. Accordingly, the AWCF currently reports only government property,maintained in the AWCF's property systems, in the possession of contractors.
To bring the AWCF into fuller compliance with federal accounting standards, the DoD has issued newproperty accountability and reporting regulations that require the AWCF to maintain, in DoD propertysystems, information on all property furnished to contractors. This action and other DoD proposed actionsare structured to capture and report the information necessary for compliance with federal accountingstandards.
AWCF activities categorize all PP&E used in the performance of their mission as General PP&E, whether ornot it meets the definition of any other PP&E categories. The AWCF is currently reporting no HeritageAssets or Stewardship Land. See Note 10, General PP&E, Net for material disclosures.
P. Advances and PrepaymentsThe AWCF records payments in advance of the receipt of goods and services as advances or prepaymentsand reports them as assets on the Balance Sheet. In addition, when the AWCF receives the related goods andservices it recognizes advances and prepayments as expenditures and expenses.
Q. LeasesNot Applicable
R. Other AssetsThe AWCF conducts business with commercial contractors under two primary types of contracts--fixed priceand cost reimbursable. To alleviate the potential financial burden on the contractor that long-term contractscan cause, the AWCF provides financing payments. In addition, provisions of the Federal AcquisitionRegulations allow the AWCF to make financing payments under fixed price contracts that are not based on apercentage of completion. The AWCF reports these financing payments as advances or prepayments in the"Other Assets" line item. The AWCF treats these payments as advances or prepayments because the AWCFbecomes liable only after the contractor delivers the goods in conformance with the contract terms. If thecontractor does not deliver a satisfactory product, the AWCF is not obligated to reimburse the contractor forits costs and the contractor is liable to repay the AWCF for the full amount of the advance.
The AWCF has completed a review of all applicable federal accounting standards; applicable public laws oncontract financing; Federal Acquisition Regulation Parts 32, 49, and 52; and the OMB guidance in 5 Code of

Notes to Principal Statements
249
fy02
Federal Regulations Part 1315, "Prompt Payment." The AWCF has concluded that SFFAS No. 1 does notaddress fully or adequately the subject of progress payment accounting and is considering appropriate action.
S. Contingencies and Other LiabilitiesThe SFFAS No. 5, "Accounting for Liabilities of the Federal Government," defines a contingency as anexisting condition, situation, or set of circumstances that involves an uncertainty as to possible gain or loss tothe AWCF. The uncertainty will be resolved when one or more future events occur or fail to occur. Acontingency is recognized as a liability when a past event or exchange transaction has occurred, a future lossis probable and the amount of loss can be estimated reasonably. Financial statement reporting is limited todisclosure when conditions for liability recognition do not exist but there is at least a reasonable possibilitythat a loss or additional loss will be incurred. Examples of loss contingencies include the collectibility ofreceivables, pending or threatened litigation, possible claims and assessments.
T. Accrued LeaveThe AWCF reports civilian annual leave that has been accrued and not used as of the balance sheet date asliabilities. The liability reported at the end of the fiscal year reflects the current pay rates.
U. Net PositionNet Position consists of unexpended appropriations and cumulative results of operations.
Unexpended appropriations represent amounts of authority, which are unobligated and have not beenrescinded or withdrawn, and amounts obligated but for which legal liabilities for payments have not beenincurred.
Cumulative results of operations for the AWCF represent the excess of revenues over expenses less refundsto customers and returns to the U.S. Treasury since fund inception.
V. Treaties for Use of Foreign BasesNot Applicable
W. Comparative DataBeginning in FY 2001, the AWCF presents for comparative purposes the current and previous year's financialdata in the financial statements, as well as in the notes to the principal statements.
In FY 2002, the Department modified the financial statement presentation for the Statements of Net Cost,Changes in Net Position, and Financing. As a result, the Department's statements during this reporting periodmay not lend themselves to comparative analysis. In some instances, amounts on the statements werereported on one financial line in FY 2001 and split into multiple financial lines for FY 2002, in accordancewith OMB's guidance.
X. Unexpended ObligationsThe AWCF obligates funds to provide goods and services for outstanding orders not yet delivered. Thefinancial statements do not reflect this liability for payment for goods/services not yet delivered.

Wor
king
Cap
ital F
und
250
FY02
Con
solid
ated
Arm
y A
nnua
l Fin
anci
al S
tate
men
ts
Note 2. Nonentity and Entity AssetsAs of September 30,(Amounts in thousands) 2002 2001
1. Intragovernmental Assets: Nonentity Entity Total
A. Fund Balance with Treasury $0 $251,030 $251,030 $325,682B. Investments 0 0 0 0C. Accounts Receivable 0 221,978 221,978 276,355D. Other Assets 0 48 48 27,007E. Total Intragovernmental Assets $0 $473,056 $473,056 $629,044
2. Non-Federal Assets:A. Cash and Other Monetary Assets $0 $0 $0 $0B. Accounts Receivable 0 16,419 16,419 22,622C. Loans Receivable 0 0 0 0D. Inventory & Related Property 0 11,319,284 11,319,284 10,791,279E. General Property, Plant and Equipment 0 1,250,240 1,250,240 1,149,629F Other Assets 0 251,298 251,298 274,330G. Total Non-Federal Assets 0 $12,837,241 $12,837,241 $12,237,860
3. Total Assets: $0 $13,310,297 $13,310,297 $12,866,904
4. Other Information:
Relevant Information for ComprehensionAssets are categorized as:
Entity assets consist of resources that the AWCF has the authority to use, or where management is legallyobligated to use funds to meet entity obligations.
Nonentity asset are assets held by an entity, but are not available for use in the operations of the entity.
Note ReferenceFor Additional Line Item discussion, see:Note 3, Fund Balance with TreasuryNote 4, InvestmentsNote 5, Accounts ReceivableNote 6, Other Assets

Notes to Principal Statements
251
fy02
Note 3. Fund Balance with TreasuryAs of September 30,(Amounts in thousands) 2002 2001
1. Fund Balances:A. Appropriated Funds $0 $0B. Revolving Funds 251,030 325,682C. Trust Funds 0 0D. Other Fund Types 0 0E. Total Fund Balances $251,030 $325,682
2. Fund Balances Per Treasury Versus Agency:A. Fund Balance per Treasury $251,030 $325,682B. Fund Balance per DoD 251,030 325,682C. Reconciling Amount $0 $0
3. Explanation of Reconciliation Amount:
4. Other Information:
Fluctuations and/or Abnormalities Compared to the FY 2001 balance, the fund balance available for the AWCF decreased by $74,652 thousand(22.9%) as of September 30, 2002. By June of 2002 fund balance available for the operations of the AWCFfell to a level that posed the possibility of an anti-deficiency act violation. To alleviate this problem, theUnder Secretary of Defense authorized the AWCF to advance bill unfilled project orders. Included in thefund balance is $200,000 thousand in advance billings against unfilled project orders in the DepotMaintenance and Ordnance activity groups. Also during FY 2002 the AWCF received cash infusions of$170,000 thousand. The cash infusion represents funds provided by the appropriated funds for underassessment of surcharges by the AWCF for services/goods provided in prior fiscal years.
Other Information Related to Fund Balance with Treasury
Relevant Information for Comprehension
Fund Balance TransferDuring the course of the fiscal year the AWCF maintains the net of reimbursements and disbursements offunds at the business area level. On September 30, 2002, the net of these figures is transferred to thecomponent level that maintains the fund balance for the entire AWCF.
Intragovernmental Paying and Collecting (IPAC).The Intragovernmental Payment and Collection (IPAC) differences are reconcilable differences that representamounts recorded by Treasury but not reported by the organization. IPAC difference figures reported for theArmy include both Army General Fund Balance and AWCF balances. Efforts to separate the balances for theindividual components have not been successful. Therefore, the Army General Fund statements include theamount applicable to the AWCF. A majority of the differences represent internal DoD transactions and,therefore, do not affect the FBWT at the DoD consolidated level. For individual entity level statements,

Wor
king
Cap
ital F
und
252
FY02
Con
solid
ated
Arm
y A
nnua
l Fin
anci
al S
tate
men
ts
however, these differences would affect the amount reported for the FBWT. The Department is working withthe DFAS sites, the Department of the Treasury, and a Treasury Department contractor to develop anautomated tool to aid in reconciling the Treasury's Statement of Differences. The accounting and payingcenters established metrics and implemented monthly reporting requirements for FY 2001. These actionswill aid the AWCF in clearing many of the old balances and establishing better internal controls over theIPAC process. The Army reported IPAC difference greater than 180 days old as of September 30, 2002 was$6 thousand.
Check Issue Discrepancy.The Army is in the process of collecting information for all check issue discrepancy data that areunsupportable because: (1) records have been lost during deactivation of disbursing offices, (2) theDepartment of the Treasury may not assist in research efforts for transactions over 1-year old, or (3)corrections were processed for transactions that the Department of the Treasury had removed from the checkcomparison report. Transactions that have no supporting documentation due to one of the precedingsituations shall be provided to the Department of the Treasury with a request to remove them from theTreasury Check Comparison Report. The vast majority of the remaining check issue discrepancies are aresult of timing differences between the AWCF and the Department of the Treasury for processing checks.The amount applicable to the AWCF cannot be identified separately. The Army currently is not requestingthe Department of Treasury to remove any dollars from the check issue comparison report.
Deposit Differences.The Deposit differences are reconcilable differences that represent deposit amounts reported by theDepartment of the Treasury or the organization. The amount applicable to the AWCF cannot be identifiedseparately.
Note ReferenceSee Note Disclosure 1. I. - Significant Accounting Policies for additional discussion on financial reportingrequirements and DoD policies governing Funds with the U.S. Treasury.
Note 4. InvestmentsNot Applicable
Note 5. Accounts ReceivableAs of September 30,(Amounts in thousands) 2002 2001
Gross Allowance For Accounts AccountsAmount Due Estimated Collectibles Receivable, Net Receivable, Net
1. Intragovernmental Receivables: $221,978 N/A $221,978 $276,355
2. Non-Federal Receivables the Public): $16,419 $0 $16,419 $22,622
3. Total Accounts Receivable: $238,397 $0 $238,397 $298,977
4. Allowance method:

Notes to Principal Statements
253
fy02
5. Other information:
Fluctuations and/or AbnormalitiesMore emphasis on liquidating accounts receivable and more timely billings has resulted in a decrease of$54,375 thousand (20%) in federal accounts receivable and $6,203 thousand (27%) in non-federal accountsreceivable. A change in revenue recognition by the depots and arsenals also contributed to this decrease.Prior to FY 2002 the AWCF set their billings equal to budgeted costs. During FY 2002 procedures werechanged to bill for costs incurred. This resulted in a decrease in both accounts receivable and revenue.
Other Information Related to Accounts Receivables
Relevant Information for ComprehensionAllowance Method - The AWCF used the actual uncollectible written off over the last five years to establishan estimated allowance for uncollectibles. A review of accounting data accumulated over this period of timefound that in FY 1999 $14.6 thousand had been charged to bad debts expense for an uncollectible accountsreceivable, but nothing had been recorded in any of the other four years. Based on this data it wasdetermined that any amounts that could be considered as uncollectible would be immaterial.
Intragovernmental Account Receivable Adjustments
Allocation of Undistributed Collections - As of September 30, 2002 accounting data for the AWCF reflect abalance of $36,744 thousand in undistributed collections. Reported intragovernmental accounts receivableincludes this balance which is transparent to the reader of the statements as the balance was eliminated usingthe reporting entity as the "buyer side" trading partner.
Elimination Adjustments - The AWCF accounting systems do not capture trading partner data at thetransaction level in a manner that facilitates trading partner aggregations. Therefore, the AWCF was unableto reconcile intragovernmental accounts receivable balances with its trading partners. The Departmentintends to develop long-term systems improvements that will include sufficient up-front edits and controls toeliminate the need for after-the-fact reconciliations. The volume of intragovernmental transactions is so largethat after-the-fact reconciliation cannot be accomplished with the existing or foreseeable resources.
Intragovernmental Receivables Over 180 Days - Intragovernmental accounts receivable include $2,239thousand in receivables over 180 days old.
Nonfederal Refunds ReceivableFY 2002 Non-Federal FY 2002 Non-Federal Refunds Receivable Accounts Receivable (Net) % of Net Amount
$5,325 $16,419 32%
Note ReferenceSee Note Disclosure 1.K. - Significant Accounting Policies for additional discussion on financial reportingrequirements and DoD policies governing Accounts Receivable.

Wor
king
Cap
ital F
und
254
FY02
Con
solid
ated
Arm
y A
nnua
l Fin
anci
al S
tate
men
ts
Note 6. Other AssetsAs of September 30,2002(Amounts in thousands) 2002 2001
1. Intragovernmental Other Assets:A. Advances and Prepayments $48 $27,007B. Other Assets 0 0C. Total Intragovernmental Other Assets $48 $27,007
2. Non-Federal Other Assets:A. Outstanding Contract Financing Payments $232,513 $252,714B. Other Assets (With the Public) 18,785 21,616C. Total Non-Federal Other Assets $251,298 $274,330
3. Total Other Assets: $251,346 $301,337
4. Other Information Related to Other Assets:
Fluctuations and/or AbnormalitiesIntragovernmental advances and prepayments decreased by $26,959 thousand (99.8%) from the reported2001 balance. During any fiscal year the AWCF trading partners determine the balance shown in advancesand prepayments based on their reported unearned revenue. In FY 2001, AWCF partners reported $27,007thousand in unearned revenue and in FY 2002 they only reported $48 thousand. Of the balance reported inFY 2001, DLA Supply Management Material reported unearned revenue received from the AWCF of$26,986 thousand and in FY 2002 they reported no unearned revenue applicable to the AWCF.
Other Information Related to Other Assets
Relevant Information for ComprehensionOther Assets Non-FederalType of Assets AmountsAdvances to Others
Contractor Advance $18,372Travel Advances 17 $18,389
Prepayments 396Totals $18,785
Outstanding Contract Financing PaymentsThe AWCF has reported outstanding financing payments for fixed price contracts as an advance andprepayment because, under the terms of the fixed price contracts, the AWCF becomes liable only after thecontractor delivers the goods in conformance with the contract terms. If the contractor does not deliver asatisfactory product, the AWCF is not obligated to reimburse the contractor for its costs and the contractor isliable to repay the AWCF for the full amount of the outstanding contract financing payments. TheDepartment has completed its review of all applicable federal accounting standards; applicable public lawson contract financing; Federal Acquisition Regulation Parts 32, 48, and 52; and the OMB guidance in 5 CFR

Notes to Principal Statements
255
fy02
Part 1315, "Prompt Payment." The Department has concluded that the SFFAS No. 1, Accounting forSelected Assets and Liabilities does not address fully or adequately the subject of progress paymentaccounting and is considering what further action is appropriate.
Advances and PrepaymentsIn accordance with elimination guidance, the AWCF advances to others balances were adjusted to agree withseller-side advances from others on the books of other DoD reporting entities. Additionally, the AWCFbuyer-side prepayment balances were adjusted to agree with deferred credits reported on the books of otherDoD reporting entities. This resulted in an increase of reported advances and prepayments of $9,355thousand.
Note ReferenceSee Note Disclosure 1. R. - Significant Accounting Policies for additional discussion on financial reportingrequirements and DoD policies governing Other Assets.
Note 7. Cash and Other Monetary AssetsNot Applicable
Note 8. A. Direct Loan and/or Loan Guarantee Programs
1. Direct Loan and/or Loan Guarantee Programs: The entity operates the following direct loanand/or Loan guarantee program(s):Military Housing Privatization InitiativeDirect Loan Or Loan Guarantee Program Title
2. Other Information: None
Note 8.B. Direct Loans Obligated After FY 1991Not Applicable
Note 8.C. Total Amount of Direct Loans DisbursedNot Applicable
Note 8.D. Subsidy Expense for Post-1991 Direct LoansNot Applicable
Wor
king
Cap
ital F
und
256
FY02
Con
solid
ated
Arm
y A
nnua
l Fin
anci
al S
tate
men
ts
Note 8.E. Subsidy Rate for Direct Loans Not Applicable
Note 8.F. Schedule for Reconciling Subsidy Cost Allowance Balances for Post-1991 Direct Loans
Not Applicable
Note 8.G. Defaulted Guaranteed Loans from Post-1991 GuaranteesNot Applicable
Note 8.H. Guaranteed Loans OutstandingNot Applicable
Note 8.I. Liability for Post-1991 Loan Guarantees, Present ValueNot Applicable
Note 8.J. Subsidy Expense for Post-1991 Loan GuaranteesNot Applicable
Note 8.K. Subsidy Rate for Loan Guarantees Not Applicable
Note 8.L. Schedule for Reconciling Loan Guarantee Liability Balances for Post-1991 Loan Guarantees
Not Applicable
Note 8.M. Administrative ExpenseNot Applicable

Notes to Principal Statements
257
fy02
Note 9. Inventory and Related PropertyAs of September 30, 2002 2001(Amounts in thousands)
1. Inventory, Net (Note 9.A.) $11,319,284 $10,708,9132. Operating Materials & Supplies, Net (Note 9.B.) 0 82,3663. Stockpile Materials, Net (Note 9.C.) 0 04. Total $11,319,284 10,791,279
Note 9.A. Inventory, NetAs of September 30(Amounts in thousands) 2002 2001
Inventory, Revaluation Inventory, Inventory, Valuation1. Inventory Categories: Gross Value Allowance Net Net Method
A. Available and Purchased for Resale $10,458,038 ($297,734) 10,160,304 $9,288,643 LACB. Held for Repair 2,135,597 (981,417) 1,154,180 1,375,105 LACC. Excess, Obsolete, and Unserviceable 359,309 (359,309) 0 5,841 LACD. Raw Materials 0 0 0 0E. Work in Process 4,800 0 4,800 39,324 SPF. Total $12,957,744 ($1,638,460) 11,319,284 $10,708,913
Legend for Valuation Methods:Adjusted LAC = Latest Acquisition Cost, adjusted for holding gains and lossesNRV = Net Realizable ValueO = OtherSP = Standard PriceAC = Actual Cost
2. Restrictions of Inventory Use, Sale, or Disposition:
3. Other Information:
General Composition of InventoryInventory includes spare and repair parts, clothing and textiles, fuels, and ammunition. Inventory is tangiblepersonal property that is:
1) Held for sale, or held for repair for eventual sale;
2) In the process of production for sale; or
3) To be consumed in the production of goods for sale or in the provision of services for a fee.
"Inventory held for repair" is damaged material that requires repair to make it usable. "Excess inventory" iscondemned material that must be retained for management purposes. "Work in process" includes munitionsin production and depot maintenance work with its associated labor, applied overhead, and supplies used inthe delivery of maintenance services. The USSGL does not include a separate work in process accountunrelated to sales.

Wor
king
Cap
ital F
und
258
FY02
Con
solid
ated
Arm
y A
nnua
l Fin
anci
al S
tate
men
ts
BalancesIn addition to the account balances shown in Table 9.A., the Federal Accounting Standard requires disclosureof the amount of inventory held for "future sale." The AWCF estimates that $73,400 thousand of theInventory held for sale will be sold more than 24 months after the end of FY 2002.
Restrictions of Inventory Use, Sale or DispositionThere are no restrictions on the use, sale, or disposition of inventory except in the following situations:
1) Distributions without reimbursement are made when authorized by DoD directives;
2) War Reserve Material includes fuels and subsistence items that are considered restricted; and
3) Inventory, with the exception of safety stocks, may be sold to foreign, state and local governments, privateparties, and contractors in accordance with current policies and guidance or at the direction of thePresident.
Decision Criteria for Identifying the Category to Which Operating Materials and Supplies are AssignedManagers determine which items are more costly to repair than to replace. Items retained for managementpurposes are coded "condemned." The net value of these items is zero, and is shown as "Excess, Obsolete,and Unserviceable."
Changes in the Criteria for Identifying the Category to Which Inventory is AssignedThe category "Held for Sale" includes all issuable material. The category "Held for Repair" includes alleconomically reparable material. Before FY 2002, the Department showed "Potentially redistributable"material, regardless of condition, as "Excess, Obsolete, and Unserviceable."
Other information Related to Inventory, NetOther AWCF DisclosuresThe Office of the Undersecretary of Defense Comptroller issued guidance during FY 2002 directing thereported balance of material held by Depot Maintenance and Ordnance to be reported as Inventory. Inprevious years this material was reported as Operating Materials and Supplies. This change resulted in anincrease in inventory of $139,718 thousand. The 2001 Inventory Value shown above of $10,708,913thousand was not restated to include the FY 2001 Operating Material & Supplies (see footnote 9.B.). Adirect appropriation of $163,600 thousand issued for the purpose of procuring additional inventory and atransfer-in of inventory from the Army General Fund of $74,349 thousand also contributed to the increase.

Notes to Principal Statements
259
fy02
Note 9.B. Operating Materials and Supplies, Net(Amounts in thousands) 2002 2001
Revaluation Valuation1. OM&S Categories: OM&S Gross Value Allowance OM&S, Net OM&S, Net Method
A. Held for Use $0 $0 $0 $81,982B. Held for Repair 0 0 0 0C. Excess, Obsolete, and Unserviceable 0 0 0 384D. Total $0 $0 $0 $82,366
Legend for Valuation Methods:Adjusted LAC = Latest Acquisition Cost, adjusted for holding gains and lossesNRV = Net Realizable ValueO = OtherSP = Standard PriceAC = Actual Cost
2. Restrictions on OM&S:
3. Other Information:
Fluctuations and/or AbnormalitiesReported OM&S decreased to zero in FY 2002. See footnote 9.A. Other AWCF Disclosures for furtherdiscussion.
Note 9.C. Stockpile Materials, NetNot Applicable
Note 10. General PP&E, NetAs of September 30,(Amounts in thousands) 2002 2001
Depreciation/ (AccumulatedAmortization Acquisition Depreciation/ Net Prior FY Net
1. Major Asset Classes: Method Service Life Value Amortization) Book Value Book Value
A. Land N/A N/A $10,254 N/A $10,254 $10,270B. Buildings, Structures and
Facilities S/L 20 Or 40 1,721,880 ($1,130,232) 591,648 424,803C. Leasehold Improvements S/L lease term 95,320 (67,926) 27,394 30,460D. Software S/L 2-5 Or 10 198,092 (60,725) 137,367 44,530E. Equipment S/L 5 Or 10 1,477,632 (1,031,364) 446,268 583,336F. Assets Under Capital Lease1 S/L lease term 0 0 0 0G. Construction-in-Progress N/A N/A 37,299 N/A 37,299 37,188H. Other 10 0 10 19,042I. Total General PP&E $3,540,487 ($2,290,247) $1,250,240 $1,149,629
1Note 15.B for additional information on Capital Leases

Wor
king
Cap
ital F
und
260
FY02
Con
solid
ated
Arm
y A
nnua
l Fin
anci
al S
tate
men
ts
Legend for Valuation Methods:S/L = Straight Line N/A = Not Applicable
2. Other Information:
Other Information Related to General PP&E, NetOther AWCF DisclosuresLeasehold Improvements - The entire amount shown on this line is for improvements being made to facilitiesat Corpus Christi Army Depot (CCAD). CCAD uses facilities on a Navy installation as a tenant with anownership code on the real property records of Permit, Military. Improvements made on these facilities arerecorded as leasehold improvements.
Buildings, Structures and Facilities increased due to an addition of $155,000 thousand for a chemical burnincinerator at Anniston Army Depot.
Note ReferenceSee Note Disclosure 1. N. - Significant Accounting Policies for additional discussion on financial reportingrequirements and DoD policies governing General Property, Plant and Equipment (PP&E).
Note 10.A. Assets Under Capital LeaseNot Applicable
Note 11. Liabilities Not Covered and Covered by Budgetary ResourcesAs of September 30,(Amounts in thousands) 2002 2001
Covered by Not Covered By1. Intragovernmental Liabilities: Budgetary Resources by Budgetary Total
A. Accounts Payable $77,527 $0 $77,527 $67,186 B. Debt 0 0 0 0 C. Environmental Liabilities 0 0 0 0 D. Other 211,913 50,126 262,039 118,905 E. Total Intragovernmental Liabilities $289,440 $50,126 $339,566 $186,091
As of September 30,(Amounts in thousands) 2002 2001
Covered by Not Covered By2. Non-Federal Liabilities: Budgetary Resources by Budgetary Total
A. Accounts Payable $511,007 $0 $511,007 $355,450 B. Military Retirement Benefits and
Other Employment-RelatedActuarial Liabilities 0 304,524 304,524 308,657
C. Environmental Liabilities 0 0 0 0 D. Loan Guarantee Liability 0 0 0 0 E. Other Liabilities 138,693 73,362 212,055 209,928 F. Total Non-Federal Liabilities $649,700 $377,886 $1,027,586 $874,035
3. Total Liabilities: $939,140 $428,012 $1,367,152 $1,060,126
4. Other Information:

Notes to Principal Statements
261
fy02
Liabilities Not Covered and Covered by Budgetary ResourcesLiabilities Not Covered by Budgetary Resources are those liabilities which are not considered covered byrealized budgetary resources as of the balance sheet date.
Liabilities Covered by Budgetary Resources are those that are incurred by the reporting entity that arecovered by realized budget resources as of the balance sheet date. Budgetary resources encompass not onlynew budget authority, but also other resources available to cover liabilities for specified purposes in a givenyear. Available budgetary resources include: (1) new budget authority, (2) spending authority from offsettingcollections (credited to an appropriation or fund account), (3) recoveries of unexpired budget authoritythrough downward adjustments of prior year obligations, (4) unobligated balances of budgetary resources atthe beginning of the year or net transfers of prior year balances during the year, and (5) permanent indefiniteappropriations or borrowing authority, which have been enacted and signed into law as of the balance sheetdate, provided that the resources may be apportioned by the OMB without further action by the Congress orwithout a contingency first having to be met.
Other Information Related to Liabilities Not Covered by Budgetary Resources
Other Liabilities consists of the following, in thousands of dollars:TypesIntragovernmental - Other Liabilities Covered Not Covered
Advances From Others $204,747.7 $0.0FECA Reimbursement to the Dept of Labor 0.0 50,125.9Employers share of VSIP 30.5 0.0Employers share of CSRS/FERS, FEGLI, and FEHB 7,134.4 0.0
Total $211,912.6 $50,125.9
Non-Federal -Other Liabilities Covered Not Covered
Accrued Funded Payroll and Benefits $71,913.9 $0Advances From Others 31,278.7 0Accrued Unfunded Annual Leave 0.0 73,362.3Contract Holdbacks 20,911.7 0Employers Contribution to Thrift Savings Plan 2,814.1 0Taxes payable (payroll withholding) 11,774.1 0
Total $138,692.5 $73,362.3
Total Other Liabilities $350,605.2 $123,488.2
Non-Federal Liabilities - Accounts Payable: The increase in Non-Federal Payables is due to an increase of$108,036.8 thousand in accounts payable and a decrease of $47,519.2 thousand in undistributeddisbursements in-transit and unmatched disbursements. The balances are applied to reduce NonfederalPayables. This decrease in Unmatched Disbursements caused a related increase in Nonfederal payables.
Intragovernmental Liabilities - Other: During FY 2002 Other Intragovernmental Liabilities increased by$143,134 thousand (120 percent). This resulted from advance billing authority that was granted to the depots

Wor
king
Cap
ital F
und
262
FY02
Con
solid
ated
Arm
y A
nnua
l Fin
anci
al S
tate
men
ts
and arsenals to avoid an Anti-deficiency Act violation. As of the end of FY 2002, the AWCF advance billingran in the $200 million range.
Note ReferenceFor Additional Line Item discussion, see:Note 12, Accounts PayableNote 15, Other LiabilitiesNote 17, Military Retirement Benefits and Other Employment Related Actuarial Liabilities
Note 12. Accounts PayableAs of September 30,(Amounts in thousands) 2002 2001
Interest, Penalties, andAccounts Payable Administrative Fees Total Total
1. Intragovernmental Payables: $77,527 N/A $77,527 $67,1862. Non-Federal Payables
(to the Public): 511,007 0 511,007 355,4503. Total $588,534 $0 $588,534 $422,636
4. Other Information:Intragovernmental Accounts Payable consists of amounts owed to other federal agencies for goods orservices ordered and received but not yet paid. Interest, penalties and administrative fees are not applicableto intragovernmental payables. Non-Federal Payables (to the Public) are payables for debts owed toindividuals and entities outside the federal government.
Other Information Related to Accounts Payable
Relevant Information for ComprehensionUndistributed DisbursementsUndistributed disbursements are the difference between disbursements/collections recorded at the detailedlevel to a specific obligation, payable, or receivable in the activity field records versus those reported by theU.S. Treasury via the reconciled DD 1329 and DD 1400. This should agree with the undistributeddisbursements reported on accounting reports (SF 133/ (M) 1002/ (M) 1307). Intransit payments arepayments that have been made for other agencies or entities that have not been recorded in their accountingrecords. These payments are applied to the entities outstanding accounts payable balance at year-end.Accounts payable were adjusted downward in the amount of $124,716.4 thousand for these payments.
Intragovernmental EliminationsFor the majority of intra-agency sales the Army WCF's accounting systems do not capture trading partnerdata at the transaction level in a manner that facilitates trading partner aggregations. Therefore, the ArmyWCF was unable to reconcile intragovernmental accounts payable to the related intragovernmental accountsreceivable that generated the payable.
Notes to Principal Statements
263
fy02
The DoD summary level seller accounts receivables were compared to the Army WCF's accounts payable.An adjustment was posted to the Army WCF's accounts payable based on the comparison with the accountsreceivable of the DoD Components providing goods and services to the Army WCF. Positive differenceswere treated as unrecognized accounts payable and in the case of the Army WCF, accounts payable wereadjusted upwards in the amount of $61,717.1 thousand.
The Department [DoD] intends to develop long-term systems improvements that will include sufficient up-front edits and controls to eliminate the need for after-the-fact reconciliations. The volume ofintragovernmental transactions is so large that after-the-fact reconciliation can not be accomplished with theexisting or foreseeable resources.
Other DisclosuresThe increase in Non-Federal Payables of $155,557 thousand is due to an increase of $108,036.8 thousand inaccounts payable over FY 2001. This increase in accounts payable is a result of the increased acquisitions inthe Supply Management Activity Group to support the War on Terrorism. Also impacting the increase inaccounts payable is a decrease in Disbursements In Transit (Unmatched Disbursements) of $47,519.2thousand. Unmatched Disbursements are applied to reduce Nonfederal Payables. Therefore, this decrease inUnmatched Disbursements caused a related increase in Nonfederal payables.
Note ReferenceSee Note Disclosure 1. G. - Significant Accounting Policies for additional discussion on financial reportingrequirements and DoD policies governing accounting for Intragovernmental Activities.
Note 13. DebtNot Applicable
Note 14. Environmental Liabilities and Disposal LiabilitiesNot Applicable

Wor
king
Cap
ital F
und
264
FY02
Con
solid
ated
Arm
y A
nnua
l Fin
anci
al S
tate
men
ts
Note 15.A. Other Liabilities As of September 30,(Amounts in thousands) 2002 2001
1. Intragovernmental: Current Liability Noncurrent Liability Total TotalA. Advances from Others $204,748 $0 $204,748 $46,442B. Deferred Credits 0 0 0 0C. Deposit Funds and Suspense Account
Liabilities 0 0 0 0D. Resources Payable to Treasury 0 0 0 0E. Disbursing Officer Cash 0 0 0 0F. Non-environmental Disposal Liabilities:
(1) National Defense PP&E (Non-nuclear) 0 0 0 0(2) Excess/Obsolete Structures 0 0 0 0(3) Conventional Munitions Disposal 0 0 0 0(4) Other 0 0 0 0
G. Accounts Payable-- Cancelled Appropriations 0 0 0 0H. Judgment Fund Liabilities 0 0 0 0I. FECA Reimbursement to the
Department of Labor 21,789 28,337 50,126 48,998J. Capital Lease Liability 0 0 0 0K. Other Liabilities 7,165 0 7,165 23,464L. Total Intragovernmental Other Liabilities $233,702 $28,337 $262,039 $118,904
2. Non-Federal:A. Accrued Funded Payroll and Benefits $71,914 $0 $71,914 $68,578B. Advances from Others 31,279 0 31,279 41,547C. Deferred Credits 0 0 0 1,897D. Loan Guarantee Liability 0 0 0 0E. Liability for Subsidy Related to
Undisbursed Loans 0 0 0 0F. Deposit Funds and Suspense Accounts 0 0 0 0G. Temporary Early Retirement Authority 0 0 0 0H. Non-environmental Disposal Liabilities:
(1) National Defense PP&E (Non-nuclear) 0 0 0 0(2) Excess/Obsolete Structures 0 0 0 0(3) Conventional Munitions Disposal 0 0 0 0(4) Other 0 0 0 0I. Accounts Payable--Cancelled Appropriations 0 0 0 0J. Accrued Unfunded Annual Leave 73,362 0 73,362 71,152K. Accrued Entitlement Benefits for
Military Retirees and Survivors 0 0 0 0L. Capital Lease Liability 0 0 0 0
M. Other Liabilities 35,500 0 35,500 26,754N. Total Non-Federal Other Liabilities $212,055 $0 $212,055 $209,928
3. Total Other Liabilities: $445,757 $28,337 $474,094 $328,832
4. Other Information:
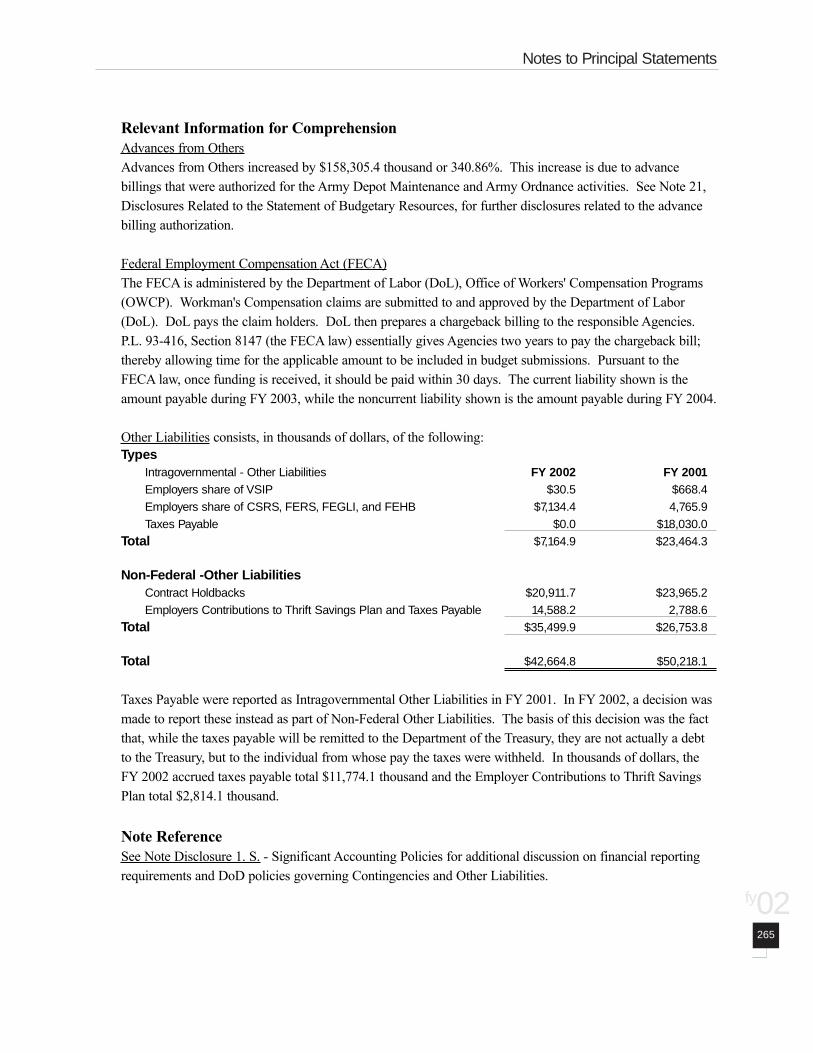
Notes to Principal Statements
265
fy02
Relevant Information for ComprehensionAdvances from OthersAdvances from Others increased by $158,305.4 thousand or 340.86%. This increase is due to advancebillings that were authorized for the Army Depot Maintenance and Army Ordnance activities. See Note 21,Disclosures Related to the Statement of Budgetary Resources, for further disclosures related to the advancebilling authorization.
Federal Employment Compensation Act (FECA)The FECA is administered by the Department of Labor (DoL), Office of Workers' Compensation Programs(OWCP). Workman's Compensation claims are submitted to and approved by the Department of Labor(DoL). DoL pays the claim holders. DoL then prepares a chargeback billing to the responsible Agencies.P.L. 93-416, Section 8147 (the FECA law) essentially gives Agencies two years to pay the chargeback bill;thereby allowing time for the applicable amount to be included in budget submissions. Pursuant to theFECA law, once funding is received, it should be paid within 30 days. The current liability shown is theamount payable during FY 2003, while the noncurrent liability shown is the amount payable during FY 2004.
Other Liabilities consists, in thousands of dollars, of the following: Types
Intragovernmental - Other Liabilities FY 2002 FY 2001Employers share of VSIP $30.5 $668.4Employers share of CSRS, FERS, FEGLI, and FEHB $7,134.4 4,765.9Taxes Payable $0.0 $18,030.0
Total $7,164.9 $23,464.3
Non-Federal -Other LiabilitiesContract Holdbacks $20,911.7 $23,965.2Employers Contributions to Thrift Savings Plan and Taxes Payable 14,588.2 2,788.6
Total $35,499.9 $26,753.8
Total $42,664.8 $50,218.1
Taxes Payable were reported as Intragovernmental Other Liabilities in FY 2001. In FY 2002, a decision wasmade to report these instead as part of Non-Federal Other Liabilities. The basis of this decision was the factthat, while the taxes payable will be remitted to the Department of the Treasury, they are not actually a debtto the Treasury, but to the individual from whose pay the taxes were withheld. In thousands of dollars, theFY 2002 accrued taxes payable total $11,774.1 thousand and the Employer Contributions to Thrift SavingsPlan total $2,814.1 thousand.
Note ReferenceSee Note Disclosure 1. S. - Significant Accounting Policies for additional discussion on financial reportingrequirements and DoD policies governing Contingencies and Other Liabilities.

Wor
king
Cap
ital F
und
266
FY02
Con
solid
ated
Arm
y A
nnua
l Fin
anci
al S
tate
men
ts
Note 15.B. Capital Lease LiabilityNot applicable.
Note 16. Commitments and ContingenciesDisclosures Related to Commitments and Contingencies: As of September 30, 2002, the Army Working Capital Fund was awaiting an arbitration hearing date forclaims for Hazardous Duty Pay by GS Employees at Corpus Christi Army Depot with possible damages of$20 million. We are unable to express an opinion about the likely outcome of this case.
Note 17. Military Retirement Benefits and Other Employment Related Actuarial Liabilities
As of September 30,(Amounts in Thousands) 2002 2001
Actuarial Present Assumed Less:Assets Unfunded UnfundedValue of Projected Interest Available to Actuarial Actuarial
1. Pension and Health Benefits: Plan Benefits Rate (%) Pay Benefits Liability Liability
A. Military Retirement Pensions $0 $0 $0 $0B. Military Retirement Health Benefits 0 0 0 0C. Medicare-Eligible Retiree Benefits 0 0 0 0D. Total Pension and Health Benefits $0 $0 $0 $0
2. OtherA. FECA $304,524 $0 $304,524 $308,657B. Voluntary Separation Incentive Programs 0 0 0 0C. DoD Education Benefits Fund 0 0 0 0D. [Enter Program Name} 0 0 0 0E. Total Other $304,524 $0 $304,524 $308,657
3. Total Military Retirement Benefits andOther Employment RelatedActuarial Liabilities: $304,524 $0 $304,524 $308,657
4. Other Information:Actuarial Cost Method Used:Assumptions:Market Value of Investments in Market-based and Marketable Securities:
Federal Employment Compensation Act (FECA)The Army's actuarial liability for workers' compensation benefits is developed by the Department of Laborand provided to the Army at the end of each fiscal year. The liability includes the expected liability for death,disability, medical, and miscellaneous costs for approved compensation cases. The liability is determinedusing a method that utilizes historical benefit payment patterns to predict the ultimate payments. Theprojected annual benefit payments then are discounted to the present value using the OMB's economic

Notes to Principal Statements
267
fy02
assumptions for 10-year U.S. Treasury notes and bonds. Cost of living adjustments and medical inflationfactors are also applied to the calculation of projected future benefits.
The Army Working Capital Fund (AWCF) computes its portion of the total Army actuarial liability based onthe percentage of total Army current and noncurrent FECA liability accrued by the AWCF. The decreasebetween Fiscal Years (FYs) 2001 and 2002 shown above is due to a decrease in AWCF current andnoncurrent liability during FY 2002. See Note 15A, Other Liabilities, for information on the FECA currentand noncurrent liability.
Note 18. Unexpended Appropriations As of September 30,(Amounts in Thousands) 2002 2001
1. Unexpended Appropriations:A. Unobligated, Available $25 $25 B. Unobligated, Unavailable 0 0 C. Unexpended Obligations 30,018 38,835 D. Total Unexpended Appropriations $30,043 $38,860
2. Other Information:
Relevant Information For ComprehensionDuring FY 2002, the AWCF received, obligated, and expended, $167,400.0 thousand of Appropriated Funds.See Note 21A, Disclosures Related to the Statement of Budgetary Resources, for further details.
AWCF Supply ManagementThe AWCF Supply Management business area received during FY 2000 a $62,000 thousand appropriationfor the procurement of war reserve material. The following events have occurred since FY 2000:
During FY 2000 - $321 thousand of this appropriation was rescinded, $55,964.9 thousand was obligated, and$25.0 thousand remained available for use in FY 2001.
During FY 2001 - $15,461.6 thousand of downward adjustments were made to the obligations recorded inFY 2000 and $1,668.0 thousand of the FY 2000 obligations were expended.
During FY 2002 - $9.1 thousand of downward adjustments were made to the obligations recorded in FY2000 and $8,826.7 thousand of the FY 2000 obligations were expended. On September 30, 2002, $25.0thousand remained available for use in FY 2003 and $30,017.7 thousand remained obligated, butunexpended.
Unexpended ObligationsUnexpended obligations reported as a component of Unexpended Appropriations include both UndeliveredOrders-Unpaid and Undelivered Orders-Paid only for Direct Appropriated funds. This amount is distinctfrom Change in Budgetary Resources Obligated for Goods, Services, and Benefits Ordered but Not Yet

Wor
king
Cap
ital F
und
268
FY02
Con
solid
ated
Arm
y A
nnua
l Fin
anci
al S
tate
men
ts
Received (Line 12) of the Statement of Financing, which includes the change during the fiscal year inunexpended obligations against budget authority from all sources.
Note 19.A. General Disclosures Related to the Statement of Net CostDisclosures Related to the Statement of Net Cost The Consolidated Statement of Net Cost in the federal government is unique because its principles are drivenon understanding the net cost of programs and/or organizations that the federal government supports throughappropriations or other means. This statement provides gross and net cost information that can be related tothe amount of output or outcome for a given program and/or organization administered by a responsiblereporting entity.
Working Capital FundWhile the Army Working Capital Funds (WCFs) generally record transactions on an accrual basis as isrequired by generally accepted accounting principles, the systems do not capture always actual costs.Information presented on the Statement of Net Cost (SoNC) is based primarily on budgetary obligation,disbursements, or collection transactions, as well as information from nonfinancial feeder systems.
Other Information Related to Gross Cost to Generate Intragovernmental Revenue andEarned Revenue (Note 19C)
Relevant Information for ComprehensionThe Department's accounting systems do not capture cost data in a manner that enables the Department todetermine if the cost was incurred to generate intragovernmental revenue. Therefore, the Department wasunable to complete this note. The Department is in the process of upgrading its financial and feeder systemsand will be addressing this issue. Additionally, the identification of intragovernmental revenue and expensesis a government-wide problem. The OMB and the Department of the Treasury have efforts underway todevelop government-wide guidance to enable accurate reporting of intragovernmental transactions. Theprimary cause of the fluctuations in the Statement of Net Cost is the increase of Army activities during FY2002. However, two other items also affected the gross and net balances. Elimination balancing entries tobring our buyer-side costs into agreement with the seller-side revenues caused a shift of $5,689,625.9thousand in Intragovernmental Gross and Net Costs to Public Gross and Net Costs. This explains thedecrease of 25.9% in Intragovernmental Gross Costs and the increase of 47.7% in Gross Costs With thePublic. These entries are further explained in Note 19I. The other factor influencing the costs and revenuesis a policy change in recording Prior Period Adjustments. As of FY 2002, Prior Period Adjustments are to berecorded only if material. If not material, the adjustments are to be applied as current year activity. AWCFPrior Period Adjustments were deemed to be immaterial, and therefore a $289,555.8 thousand decrease wasapplied to Gross Costs With the Public, with a $30,845.5 thousand increase applied to Earned Revenue Fromthe Public.
Note 19.B. Gross Cost and Earned Revenue by Budget Functional Classification
Not Applicable

Notes to Principal Statements
269
fy02
Note 19.C. Gross Cost to Generate Intragovernmental Revenue and Earned Revenue (Transactions with Other Federal-Non-DoD-Entities) by Budget Functional Classification
Not Applicable
Note 19.D. Imputed Expenses As of September 30,(Amount in thousands) 2002 2001
1. Civilian (e.g.,CSRS/FERS) Retirement $49,291 $46,0122. Civilian Health 60,422 58,8573. Civilian Life Insurance 171 1624. Military Retirement Pension 0 0 5. Military Retirement Health 0 06. Judgment Fund 0 07. Total Imputed Expenses $109,884 $105,031
Note 19.E. Benefit Program Expenses Not Applicable
Note 19. F. Exchange Revenue Disclosures Related to the Exchange Revenue: Exchange Revenue - arises when a Government entity provides goods and services to the public or to anotherGovernment entity for a price, - "earned revenue." Exchange revenue includes most user charges other thantaxes, i.e., regulatory user charges.
Depot Maintenance and Ordnance Working Capital Funds (WCF) recognize revenue according to thepercentage of completion method. Supply Management WCF activities recognize revenue from the sale ofinventory items.
Note 19.G. Amounts for Foreign Military Sales (FMS) Program Procurements from Contractors
Not Applicable
Note 19.H. Stewardship AssetsNot Applicable

Wor
king
Cap
ital F
und
270
FY02
Con
solid
ated
Arm
y A
nnua
l Fin
anci
al S
tate
men
ts
Note 19.I. Intragovernmental Revenue and ExpenseDisclosures Related to Intragovernmental Revenue and Expense:Intragovernmental RevenueFor the majority of buyer-side transactions, the Army Working Capital Fund's (WCF) accounting systems donot capture trading partner data at the transaction level in a manner that facilitates trading partneraggregations. Therefore, the WCF was unable to reconcile intragovernmental accounts payable balanceswith its trading partners. The Department intends to develop long-term system improvements that willinclude sufficient up-front edits and controls to eliminate the need for after-the-fact reconciliations. Thevolume of intragovernmental transactions is so large that after-the-fact reconciliations cannot beaccomplished with the existing or foreseeable resources.
Operating ExpensesThe Army WCF's operating expenses were adjusted based on a comparison between the Army WCF'saccounts payable and the DoD summary level seller accounts receivables. In addition, the Army WCF'soperating expenses also were adjusted based on a comparison between the Army WCF's expenses and theDoD summary level seller revenues. The adjustments posted were an upward adjustment of $61,717.1thousand to accounts payable and a downward adjustment of $5,689,625.9 thousand to operating expenses.
Note 19.J. Suborganization Program CostsNot Applicable
Note 20. Disclosures Related to the Statement of Changes in Net PositionAs of September 30,(Amounts in thousands)
Cumulative Results of Unexpended Cumulative Results UnexpendedOperations 2002 Appropriations 2002 of Operations 2001 Appropriations 2001
1. Prior Period Adjustments Increases Decreases) to Net Position Beginning Balance:A. Changes in Accounting Standards $0 $0 $0 $0 B. Errors and Omissions in Prior Year
Accounting Reports 0 0 1,463,817 0 C. Other Prior Period Adjustments 0 0 0 0 D. Total Prior Period Adjustments 0 $0 $1,463,817 $0
2. Imputed Financing:A. Civilian CSRS/FERS Retirement $49,291 $0 $46,012 $0 B. Civilian Health 60,422 0 58,857 0 C. Civilian Life Insurance 171 0 162 0 D. Military Retirement Pension 0 0 0 0 E. Military Retirement Health 0 0 0 0 F. Judgment Fund 0 0 0 0G. Total Imputed Financing $109,884 $0 $105,031 $0

Notes to Principal Statements
271
fy02
3. Other Information:
Relevant Information for ComprehensionPrior Period AdjustmentsErrors and Omissions in Prior Year Accounting Practices have decreased $1,463,816.6 thousand (100%). Asof Fiscal Year (FY) 2002, The Department of the Treasury has emphasized the usage of USSGL accounts7400 and 7401 for material changes only. Use of these accounts should be infrequent. Prior PeriodAdjustments for Army Working Capital Fund (WCF) for FY 2002 were not considered to be materialamounts. Transactions that would have been classified as Prior Period Adjustments were recorded instead toexpense and revenue accounts as if they had occurred during the current fiscal year. The net amount of PriorPeriod Adjustments, in thousands of dollars, that were reclassified as current year activity is as follows:
Depot Maintenance $23,793.9 Ordnance $158,182.8 Information Services $6,510.7 Supply Management $321,857.2
The Nonexchange Revenue reported on the Statement of Changes in Net Position represents cash infusionsrelating to prior period earnings. Cash infusions are movements of prior year Army Operations andMaintenance funds into the proper Army Working Capital Fund General Ledger accounts. These werereported as Prior Period Adjustments during FYs 2001 and previous. Depot Maintenance reported $7,793.4thousand and Ordnance reported $162,242.8 thousand during FY 2002.
Other Budgetary Financing SourcesOther Budgetary Financing Sources represents:
A decrease in Material Returns Liability for 63,902.7 thousand and
Transfers In/Out Without Reimbursement for $70,619.5 thousand for which a trading partner could not beidentified and $68,276.2 thousand due to Single Stock Fund M-3 Capitalized VIOC items received fromthe Army General Funds.
The increase between FY 2001 and FY 2002 is due to $1,953.3 thousand transferred out without a tradingpartner in FY 2001 compared to $139.0 thousand transferred in without trading partner information duringFY 2002 and a decrease in Material Returns Liability from $394.4 thousand in FY 2001 to $63.9 thousandin FY 2002.
Appropriations UsedThe increase is due to $163,300 thousand Direct Appropriations received for Spare Parts and War Reservesand $4,100 thousand in current year funding to offset utility expense. All Direct Appropriations receivedduring FY 2002 were used during FY 2002, as well as additional Expended Appropriation of $7,000thousand from Unexpended Funds Obligated in Prior Fiscal Years.

Wor
king
Cap
ital F
und
272
FY02
Con
solid
ated
Arm
y A
nnua
l Fin
anci
al S
tate
men
ts
Other Financing SourcesThe increase in Transfers In/Out Without Reimbursement is due to the transfer in of $74,000 thousand ininventory from Milestone 3 of Single Stock Fund, transferred in from Army General Fund.
Note ReferenceFor Additional Line Item discussion, see:Note 19, General Disclosures Relating to the Statement of Net CostNote 21, Disclosures Related to the Statement of Budgetary Resources
Note 21.A. Disclosures Related to the Statement of Budgetary ResourcesAs of September 30,(Amounts in thousands) 2002 2001
1. Net Amount of Budgetary Resources Obligated forUndelivered Orders at the End of the Period $2,801,419 $3,060,625
2. Available Borrowing and Contract Authority at theEnd of the Period $2,375,862 $2,309,254
3. Other Information:
Other Information Related to the Statement of Budgetary Resources
Relevant Information for ComprehensionApportionment CategoriesNet amount of Budgetary Resources Obligated for Undelivered Orders at the End of Period consists of$30,017.7 thousand Direct Obligations and $2,771,401.5 thousand Reimbursable Obligations. Please seeNote 18, Unexpended Appropriations, for details on the Direct Obligations.
During Fiscal Year (FY) 2002, the Army Working Capital Fund (WCF) incurred Direct Obligations of$171,651.9 thousand and Reimbursable Obligations of $6,659,960.8 thousand as shown on the Statement ofBudgetary Resources “Obligations Incurred.”
Primary funding for the Army WCF is earned through customer orders, as described in Note 1C. In additionto revenues earned, Direct Appropriations, in thousands of dollars, were received by the following businessareas during FY 2002:
Ordnance $1,400.0 Depot Maintenance $2,300.0Supply Management $163,600.0 Information Service $100.0
These appropriations are permanent, indefinite appropriations, available for obligation until exhausted, for thepurpose of continuing business operations and maintenance of the corpus. The unobligated balance of theseappropriated funds as of September 30, 2002 is $25.0 thousand (Supply Management business area). Theobligated balance is $30,017.7 thousand (Supply Management business area).

Notes to Principal Statements
273
fy02
Unobligated balances from Spending Authority from offsetting collections (revenues earned) as of September30, 2002, in thousands of dollars, by business areas are:
Ordnance $583,260.2 Depot Maintenance $983,9163.1Supply Management $1,105.9 Information Service $39,966.1Component $100,00.0
Available borrowing and contract authority as of September 30, 2002, in thousands of dollars, is as follows:
New Contract Authority Unobligated Balance Contract AuthorityType For FY 2002 Beginning of Period Available 9/30/2002
Ordnance $2,212.2 $2,842.4 $5,054.6Depot Maintenance 704.4 7,269.5 7,973.9Supply Management 63,691.4 2,299,141.7 2,362,833.1Total AWCF $66,608.0 $2,309,253.6 $2,375,861.6
Other Army WCF Disclosures:
The Army WCF was unable to make eliminating entries in the Statement of Budgetary Resources andtherefore presented a Disaggregated Statement of Budgetary Resources in the Required SupplementaryInformation section of the financial statements.
Transfers In and Out of property for the Army WCF and transfers of collections and disbursements to theComponent level for applicable Defense WCFs, which are reflected on the Statement of Changes in NetPosition, are not included in Transfers In/Out Without Reimbursement on the Statement of BudgetaryResources. The Transfers In reflected in the FY 2001 column for $6,100 thousand was a ConsumableItem Transfer (CIT) between the AWCF and the Defense Logistics Agency (DLA), in which the AWCFgave up title to inventory to the DLA, who transferred unobligated authority to the AWCF in return. Thistype of transfer did not occur during FY 2002, so Net Transfers decreased 100% to $0.
Advance billings were authorized for the Army Depot Maintenance and Army Ordnance activities, up to$200,000.0 thousand. This step was taken to maintain the minimum corpus requirement of $297,000.0thousand. This action was primarily necessary due to excessive credit being provided to SupplyManagement customers. The Army has taken action to restrict their credit percentage to the approvedbudget ratio of 39.2 percent of sales. These advance billings are the primary cause of the decrease inReceivables From Federal Sources of $33,140.7 thousand, or 37.55%, and the increase in UnfilledOrders With Advance of $104,400.1 thousand, or 426%. These advance billings, along with an increasein Earned collections, also contributed to the decrease in Net Outlays of $125,246.4 thousand, or34.10%.
Change in unfilled customer orders without advance from federal sources increased by $899,145thousand (125%) primarily because of the increase in backorders in the Supply Management activitygroup due to the non-availability of spares.
Direct Obligations increased by $889,201.5 thousand (123.92%). This is due to the fact that $740,669.1thousand in Reimbursable Obligations were crosswalked incorrectly to Direct on the FY 2000 reports. Acrosswalk correction was made during FY 2001 to correct these balances, which caused the FY 2001

Wor
king
Cap
ital F
und
274
FY02
Con
solid
ated
Arm
y A
nnua
l Fin
anci
al S
tate
men
ts
Direct Obligations Incurred to appear to be negative $717,549.6 thousand. The true Direct ObligationsIncurred during FY 2001 was $23,199.6 thousand. Therefore, the true change between DirectObligations Incurred in FY 2002 and Direct Obligations Incurred in FY 2001 is an increase of$148,532.4 thousand.
Unobligated Balance Apportioned increased by $202,802.0 thousand (13%) due to the receipt of andobligation of direct appropriations. Appropriations received by business area are noted above.
The increase in accounts payable is commensurate with the increase in acquisition within the SupplyManagement activity group.
The AWCF is unable to implement fully all elements of Federal GAAP and OMB Bulletin No. 01-09due to limitations of its financial and nonfinancial management processes and systems. See Note 1,Significant Accounting Policies, for a full disclosure of accounting policies not in compliance with thesestandards.
Undelivered OrdersUndelivered Orders presented in the Statement of Budgetary Resources includes Undelivered Orders-Unpaidfor both direct and reimbursable funds. The AWCF has not implemented fully the U.S. Standard GeneralLedger (USSGL) in all operational accounting systems.
Spending Authority from Offsetting CollectionsAdjustments in funds that temporarily are not available pursuant to Public Law, and those that permanentlyare not available (included in the "Adjustments" line on the Statement of Budgetary Resources), are notincluded in the "Spending Authority From Offsetting Collections and Adjustments" line on the Statement ofBudgetary Resources or the "Spending Authority for Offsetting Collections and Adjustments" line on theStatement of Financing.
Note 21.B. Disclosures Related to Problem Disbursements, In-transit Disbursements and Suspense/Budget Clearing Accounts
As of September 30,(Amounts in thousands)
(Decrease)/Increase1. Total Problem Disbursement Sep 2000 Sep 2001 Sep 2002 from 2001 to 2002
A. Absolute Unmatched Disbursements $36,757 $7,241 $17,301 $10,060B. Negative Unliquidated Obligations 34,859 11,708 4,477 (7,231)
2. Total In-transit Disbursements, Net $220,448 $83,580 $65,368 $(18,212)
3. Other Information Related to Problem Disbursements and In-transit Disbursements:

Notes to Principal Statements
275
fy02
Relevant Information for ComprehensionDefinitionsAbsolute value is the sum of the positive values of debit and credit transactions without regard to the sign.
UMDs occur when payments do not match to a corresponding obligation in the accounting system.
NULOs occur when payments have a valid obligation, but the payment is greater than the amount of theobligation recorded in the official accounting system. These payments use available funds for valid receivingreports on delivered goods and services under valid contracts.
In-Transits represents the net value of disbursements and collections made by a DoD disbursing activity onbehalf of an accountable activity but not posted yet in an accounting system.
Aged UMDs and NULOsThe Army WCF has $17,301.3 thousand in absolute value aged UMDs, $4,476.6 thousand in aged NULOs,and $65,367.6 thousand in aged in-transit disbursements that represent disbursements of Army WCF fundsthat have been reported by a disbursing station to the Department of the Treasury but have not been matchedprecisely yet against the specific source obligation giving rise to the disbursements. For the most part, thesepayments have been made using available funds and based on valid receiving reports for goods and servicesdelivered under valid contracts. The problem disbursements and in-transit disbursements arise when theArmy WCF's various contracting, disbursing, and accounting systems fail to match the data necessary toaccount properly for the disbursement transactions in all applicable accounting systems. The Army WCF hasefforts underway to improve the systems and to resolve all previous problem disbursements and process allin-transit disbursements.
The Problem Disbursement Reduction Goal is stated in Absolute Value UMDs, NULOs, and Net Intransits.Therefore, the UMDs presented above are shown in absolute value for comparison to the official ReductionGoal. However, in prior years, Net UMDs and NULOs were reported together on the "ProblemDisbursements" line of Note 21. In order to facilitate comparability with prior years and comprehension ofthe net dollar amounts, the Net UMDs and NULOs, in thousands of dollars, are shown in the table below.
Problem Disbursement Type FY 2000 FY 2001 FY 2002Net UMDs $22,089.4 $3,355.0 $6,346.5NULOs 34,858.7 11,707.7 4,476.6
Total Net Problem Disbursements $56,948.1 $15,062.7 $10,823.1
4. Suspense/Budget Clearing Accounts, NetAccount Sep 2000 Sep 2001 Sep 2002 (Decrease)/Increase
F3875 $0 $0 $0 $0F3880 0 0 0 0F3882 0 0 0 0F3885 0 0 0 0F3886 0 0 0 0Total $0 $0 $0 $0

Wor
king
Cap
ital F
und
276
FY02
Con
solid
ated
Arm
y A
nnua
l Fin
anci
al S
tate
men
ts
5. Other Information Related to Suspense/Budget Clearing Accounts:The Suspense/Budget Clearing Accounts shown above are maintained and reported by the Army GeneralFunds. Some transactions relating to the Army WCF may be in suspense accounts, but these transactions arenot identifiable. When they are identified to the Army WCF, they will be transferred from thesuspense/clearing account to the correct Treasury appropriation of 97X4930.1.
Note 22. Disclosures Related to the Statement of FinancingDisclosures Related to the Statement of FinancingThe objective of the Statement of Financing is to make users understand the difference between budgetaryand net cost of operations reported. The statement provides this understanding through a comprehensivereconciliation process.
Other Information Related to the Statement of FinancingStatement of FinancingThe statement of financing was expanded to further articulate and detail the relationship between netobligations from budgetary accounting and net cost of operation from proprietary accounting. Some itemsthat were reported last year as a single line were subdivided to reflect their components. Several new lineitems were added to identify separately and further explain the use of resources to finance net obligations ornet cost of operations. This change notes key differences between the net obligations and net cost ofoperations.
"Net Cost of Operation" in the 2001 column of the Statement of Financing shows ($113,036) thousandcompared to $126,474 thousand in the Statement of Net Cost, and the amount reflected on the FY 2001statements. This is due to a change in DoD policy for mapping USSGLs to this statement. In FY 2001 andprior years, the unfunded liabilities were posted based on the change in the liability accounts. In FY 2002,this was changed to map liabilities based on the expense accounts. Both mapping policies are approved byTreasury.
The AWCF had been instructed in FY 2001 and prior years to post all expenses to USSGL 6500, Cost ofGoods Sold, which does not crosswalk to the Statement of Financing under the new mapping policy. As ofFY 2002, this policy was changed to promote posting of expenses to the relevant expense accounts forBenefits, Unfunded Expenses, and Future Funded Expenses, which do crosswalk to the Statement ofFinancing.
Posting of the expense related to unfunded liabilities during preparation of the FY 2001 financial statementscreated a $239,508 thousand decrease in Financing Sources, creating the apparent decrease in Net Costcompared to the Statement of Changes in Net Position and the Statement of Net Cost. Specifically,differences related to the unfunded annual leave were in the amount of $65,072 thousand, Unfunded FECAliability were $35,353 thousand, and $139,083 thousand for the FECA Actuarial liability. These decreasesaffect the following three lines: Resources that fund expenses recognized in prior periods, Other resources oradjustments to net obligated resources that do not affect net cost of operations (Other), and Other componentsof the net cost of operations that will not require or generate resources in the current period. DoD policy onthis change was to footnote the differences rather than to correct the comparative statements.
Budgetary data is not in agreement with Proprietary Expenses and Asset Capitalized. This causes a

Notes to Principal Statements
277
fy02
difference in Net Cost between the Statement of Net Cost and the Statement of Financing. "Resources thatFinance the Acquisition of Assets" was adjusted by negative $338,260.1 thousand in order to bring thestatements into balance. Differences between budgetary and proprietary data for the AWCF are a previouslyidentified deficiency.
Other Material ChangesOther Resources Used to Finance Items not Part of the Net Cost of Operations has decreased from $71,151.6thousand to $0, or 100%. This is due to the fact that, in FY 2001, Accrued Annual Leave was reclassified asUnfunded. In prior years, it had been classified as funded. In FY 2001, this reclassification wasaccomplished by use of a Prior Period Adjustment. In FY 2002, no such adjustment was required.
Other Components of the Net Cost of Operations that will not Require or Generate Resources in the CurrentPeriod has decreased by $15,547.1 thousand, or 93.24%. This is due to the recording of FECA ActuarialLiability. The Actuarial Liability is computed based on the FECA current and noncurrent liability. In FY2001, the FECA current and noncurrent liability had increased from FY 2000. Therefore, the FECAActuarial Liability booked for FY 2001 $12,297.9 thousand was an increase from the preceding balance. InFY 2002, the FECA current and noncurrent liability had decreased from FY 2001. Therefore, the ActuarialLiability to be booked in FY 2002 (negative $4,132.9 thousand) was a reduction from the preceding balance.
Other Components of the Net Cost of Operations that will not Require or Generate Resources in the CurrentPeriod have decreased by $481,284.4 thousand, or 93.24%. This is due to the fact that the SupplyManagement business area had recorded $484,560.3 thousand of Gains on Dispositions of Assets during FY2001. During FY 2002, the Supply Management business area booked no Gains on Disposal of Assets.Instead, a Loss on Disposal of Assets of $432,613.6 thousand was incurred.
Liabilities Not Covered by Budgetary ResourcesThe Army Working Capital Fund (WCF) has a NonCurrent Unfunded FECA Liability of $28,336.5 thousand.This is for FECA bills due in FY 2004. The Army WCF also has an Unfunded FECA Actuarial Liability of$304,523.9 thousand. Both liabilities will be obligated when due and funded with future revenues. Bothliabilities relate to the Depot Maintenance and Ordnance business areas only.
Intra-entity TransactionIntra-entity transactions have not been eliminated because the statements are presented as combined andcombining.
Note 23. Disclosures Related to the Statement of Custodial ActivityNot applicable
Note 24.A. Other Disclosures Not Applicable
Note 24.B. Other Disclosures Not Applicable

Wor
king
Cap
ital F
und
FY02
Uni
ted
Sta
tes
Arm
y A
nnua
l Fin
anci
al S
tate
men
t
278
Consolidating Balance SheetT
he a
ccom
pany
ing
note
s ar
e an
inte
gral
par
t of t
hese
sta
tem
ents
.
Department of Defense • Department of the Army As of September 30, 2002 and 2001 ($ in thousands)
Depot Maintenance
$0 0
53,588 10,843
$64,431
$0 $2,381
0102,730
623,970 972
$794,484
$15,832 00
91,079 $106,911 $62,760
181,582 00
93,311
$444,564
$0 349,920
$349,920
$794,484
SupplyManagement
$0 0
108,047 9,276
$117,323
$0 12,441
011,175,765
135,531 249,921
$11,690,981
$79,558 00
13,449 $93,207
$489,744
000
65,440
$648,391
$30,043 11,012,547
$11,042,590
$11,690,981
Information Services
$00
5,294 0
$5,294
$0 000
150 0
$5,444
$472 00
142 $614
$10,308
000
3,492
$14,414
$0 (8,970)
($8,970)
$5,444
1. ASSETS (Note 2)A. Intragovernmental:
1. Fund Balance with Treasury(Note 3)
2. Investments (Note 4)3. Accounts Receivable (Note 5)4. Other Assets (Note 6)5. Total Intragovernmental Assets
B. Cash and Other Monetary Assets(Note 7)
C. Accounts Receivable (Note 5)D. Loans Receivable (Note 8)E. Inventory and Related Property (Note 9)F. General Property, Plant and Equipment
(Note 10)G. Other Assets (Note 6)
2. TOTAL ASSETS
3. LIABILITIES (Note 11)A. Intragovernmental:
1. Accounts Payable (Note 12)2. Debt (Note 13)3. Environmental Liabilities (Note 14)4. Other Liabilities (Notes 15 and 16)5. Total Intragovernmental Liabilities
B. Accounts Payable (Note 12)C. Military Retirement Benefits and
Other Employment-Related ActuarialLiabilities (Note 17)
D. Environmental Liabilities (Note 14)E. Loan Guarantee Liability (Note 8)F. Other Liabilities (Notes 15 and 16)
4. TOTAL LIABILITIES
5. NET POSITIONA. Unexpended Appropriations (Note 18)B. Cumulative Results of Operations
6. TOTAL NET POSITION
7. TOTAL LIABILITIES AND NETPOSITION
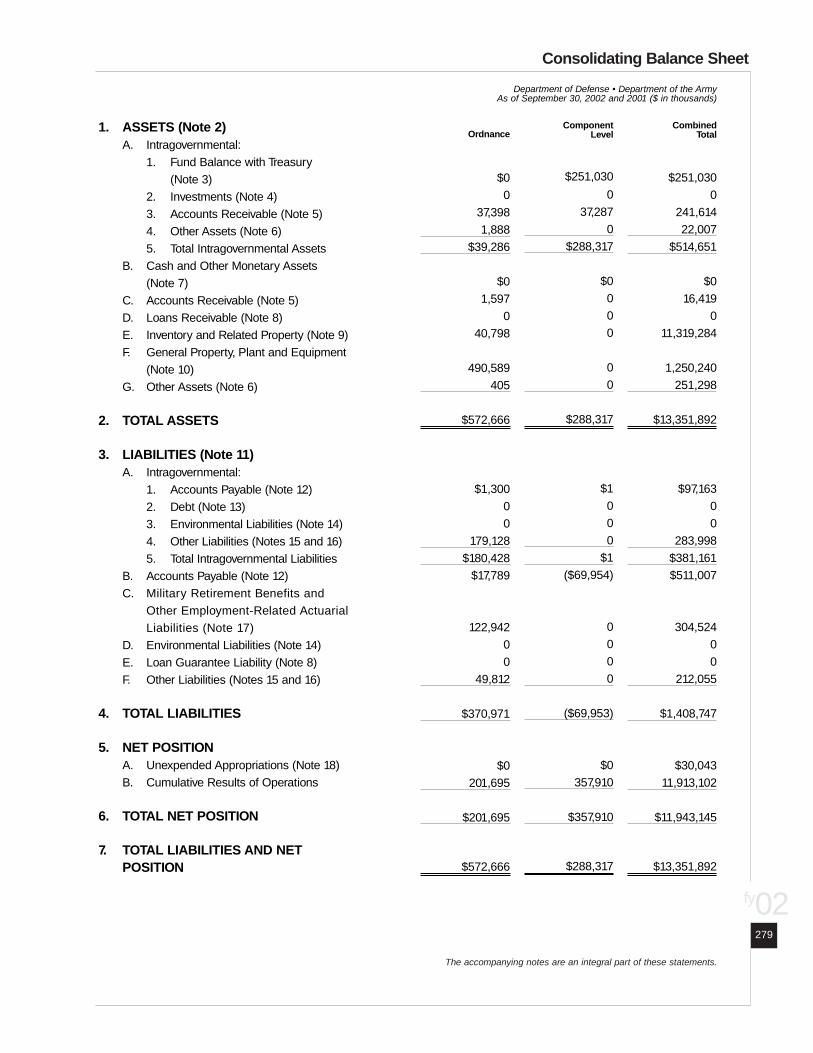
Consolidating Balance Sheet
The accompanying notes are an integral part of these statements.
279
fy02
Department of Defense • Department of the Army As of September 30, 2002 and 2001 ($ in thousands)
Ordnance
$0 0
37,398 1,888
$39,286
$0 1,597
040,798
490,589 405
$572,666
$1,300 00
179,128 $180,428
$17,789
122,942 00
49,812
$370,971
$0 201,695
$201,695
$572,666
ComponentLevel
$251,030
037,287
0$288,317
$0 000
00
$288,317
$1 000
$1 ($69,954)
0000
($69,953)
$0 357,910
$357,910
$288,317
CombinedTotal
$251,030 0
241,614 22,007
$514,651
$0 16,419
011,319,284
1,250,240 251,298
$13,351,892
$97,163 00
283,998 $381,161 $511,007
304,524 00
212,055
$1,408,747
$30,043 11,913,102
$11,943,145
$13,351,892
1. ASSETS (Note 2)A. Intragovernmental:
1. Fund Balance with Treasury(Note 3)
2. Investments (Note 4)3. Accounts Receivable (Note 5)4. Other Assets (Note 6)5. Total Intragovernmental Assets
B. Cash and Other Monetary Assets(Note 7)
C. Accounts Receivable (Note 5)D. Loans Receivable (Note 8)E. Inventory and Related Property (Note 9)F. General Property, Plant and Equipment
(Note 10)G. Other Assets (Note 6)
2. TOTAL ASSETS
3. LIABILITIES (Note 11)A. Intragovernmental:
1. Accounts Payable (Note 12)2. Debt (Note 13)3. Environmental Liabilities (Note 14)4. Other Liabilities (Notes 15 and 16)5. Total Intragovernmental Liabilities
B. Accounts Payable (Note 12)C. Military Retirement Benefits and
Other Employment-Related ActuarialLiabilities (Note 17)
D. Environmental Liabilities (Note 14)E. Loan Guarantee Liability (Note 8)F. Other Liabilities (Notes 15 and 16)
4. TOTAL LIABILITIES
5. NET POSITIONA. Unexpended Appropriations (Note 18)B. Cumulative Results of Operations
6. TOTAL NET POSITION
7. TOTAL LIABILITIES AND NETPOSITION

Consolidating Balance SheetT
he a
ccom
pany
ing
note
s ar
e an
inte
gral
par
t of t
hese
sta
tem
ents
.
Department of Defense • Department of the Army As of September 30, 2002 and 2001 ($ in thousands)
Eliminations
$0 0
19,636 21,959
$41,595
$0 000
00
$41,595
$19,636 00
21,959 $41,595
$0
0000
$41,595
$0 0
$0
$41,595
FY 2002Consolidated
$251,030 0
221,978 48
$473,056
$0 16,419
011,319,284
1,250,240 251,298
$13,310,297
$77,527 00
262,039 $339,566 $511,007
304,524 00
212,055
$1,367,152
$30,043 11,913,102
$11,943,145
$13,310,297
FY 2001Consolidated
$325,682 0
276,355 27,006
$629,043
$0 22,622
010,791,280
1,149,629 274,330
$12,866,904
$67,184 00
118,906 $186,090 $355,452
308,657 00
209,928
$1,060,127
$38,860 11,767,917
$11,806,777
$12,866,904
1. ASSETS (Note 2)A. Intragovernmental:
1. Fund Balance with Treasury(Note 3)
2. Investments (Note 4)3. Accounts Receivable (Note 5)4. Other Assets (Note 6)5. Total Intragovernmental Assets
B. Cash and Other Monetary Assets(Note 7)
C. Accounts Receivable (Note 5)D. Loans Receivable (Note 8)E. Inventory and Related Property (Note 9)F. General Property, Plant and Equipment
(Note 10)G. Other Assets (Note 6)
2. TOTAL ASSETS
3. LIABILITIES (Note 11)A. Intragovernmental:
1. Accounts Payable (Note 12)2. Debt (Note 13)3. Environmental Liabilities (Note 14)4. Other Liabilities (Notes 15 and 16)5. Total Intragovernmental Liabilities
B. Accounts Payable (Note 12)C. Military Retirement Benefits and
Other Employment-Related ActuarialLiabilities (Note 17)
D. Environmental Liabilities (Note 14)E. Loan Guarantee Liability (Note 8)F. Other Liabilities (Notes 15 and 16)
4. TOTAL LIABILITIES
5. NET POSITIONA. Unexpended Appropriations (Note 18)B. Cumulative Results of Operations
6. TOTAL NET POSITION
7. TOTAL LIABILITIES AND NETPOSITION
FY02
Uni
ted
Sta
tes
Arm
y A
nnua
l Fin
anci
al S
tate
men
t
Wor
king
Cap
ital F
und
280

Consolidating Statement of Net Cost
The accompanying notes are an integral part of these statements.
281
fy02
Department of Defense • Department of the Army For the years ended September 30, 2002 and 2001 ($ in thousands)
1. Program CostsA. Component Level
1. Intragovernmental Gross Costs2. (Less: Intragovernmental Earned
Revenue)3. Intragovernmental Net Costs4. Gross Costs With the Public5. (Less: Earned Revenue From the
Public)6. Net Costs With the Public7. Total Net Cost
B. Depot Maintenance1. Intragovernmental Gross Costs2. (Less: Intragovernmental Earned
Revenue)3. Intragovernmental Net Costs4. Gross Costs With the Public5. (Less: Earned Revenue From the
Public)6. Net Costs With the Public7. Total Net Cost
C. Information Service1. Intragovernmental Gross Costs2. (Less: Intragovernmental Earned
Revenue)3. Intragovernmental Net Costs4. Gross Costs With the Public5. (Less: Earned Revenue From the
Public)6. Net Costs With the Public7. Total Net Cost
D. Ordnance1. Intragovernmental Gross Costs2. (Less: Intragovernmental Earned
Revenue)3. Intragovernmental Net Costs4. Gross Costs With the Public5. (Less: Earned Revenue From the
Public)6. Net Costs With the Public7. Total Net Cost
Component Level
$0
0 $0
$506
0$506 $506
$1,026,249
(1,610,727)($584,478)
$856,033
(41,331)$814,702 $230,224
$11,243
(97,003)($85,760)
$80,279
(1,675)$78,604 ($7,156)
$110,002
(581,305)($471,303)
613,539
(82,203)$531,336 $60,033
DepotMaintenance
$0
0 $0 $0
0$0 $0
$460,142
(629,911)($169,769)
$0
0$0
($169,769)
$717
(52,803)($52,086)
$0
0$0
($52,086)
$23,663
(66,480)($42,817)
0
0$0
($42,817)
Information Service
$0
0 $0
$506
0$506 $506
$566,107
(980,816)($414,709)
$856,033
(41,331)$814,702 $399,993
$10,526
(44,200)($33,674)$80,279
(1,675)$78,604 $44,930
$86,339
(514,825)($428,488)
613,539
(82,203)$531,336 $102,850
Ordnance
$0
0 $0
($362)
0($362)($362)
$614,832
(853,853)($239,021)
$232,887
(33,745)$199,142 ($39,879)
$16,857
(57,075)($40,218)
$84,180
3,224 $80,956 $40,738
$188,675
(502,785)($314,110)
462,950
(105,090)$357,880 $43,750

Wor
king
Cap
ital F
und
FY02
Uni
ted
Sta
tes
Arm
y A
nnua
l Fin
anci
al S
tate
men
t
282
Consolidating Statement of Net CostT
he a
ccom
pany
ing
note
s ar
e an
inte
gral
par
t of t
hese
sta
tem
ents
.
Department of Defense • Department of the Army For the years ended September 30, 2002 and 2001 ($ in thousands)
1. Program CostsE. Supply Management
1. Intragovernmental Gross Costs2. (Less: Intragovernmental Earned
Revenue)3. Intragovernmental Net Costs4. Gross Costs With the Public5. (Less: Earned Revenue From the
Public)6. Net Costs With the Public7. Total Net Cost
F. Total Program Costs1. Intragovernmental Gross Costs2. (Less: Intragovernmental Earned
Revenue)3. Intragovernmental Net Costs4. Gross Costs With the Public5. (Less: Earned Revenue From the
Public)6. Net Costs With the Public7. Total Net Cost
2. Cost Not Assigned to Programs
3. (Less:Earned Revenue Not Attributable to Programs)
4. Net Cost of Operations
Combined Total
$1,464,865
(5,748,765)($4,283,900)
$4,808,356
(219,962)$4,588,394
$304,494
$2,612,359
(8,037,800)($5,425,441)
$6,358,713
(345,171)$6,013,542
$588,101
0
0
$588,101
Eliminations
$703,371
(438,700)$264,671
$0
0$0
$264,671
$1,187,893
(1,187,894)($1)
$0
0 $0
($1)
0
0
($1)
FY 2002
$761,494
(5,310,065)($4,548,571)
$4,808,356
(219,962)$4,588,394
$39,823
$1,424,466
(6,849,906)($5,425,440)
$6,358,713
($345,171)$6,013,542
$588,102
0
0
$588,102
FY 2001
$1,101,544
(4,326,754)($3,225,210)
$3,524,580
(217,143)$3,307,437
$82,227
$1,921,908
(5,740,467)($3,818,559)
$4,304,235
(359,202)$3,945,033
$126,474
0
0
$126,474

Consolidating Statement of Changes in Net Position
The accompanying notes are an integral part of these statements.
283
fy02
Department of Defense • Department of the Army For the years ended September 30, 2002 and 2001 ($ in thousands)
Depot Maintenance
$330,901 0
$330,901
0 0 0
2,300 7,793
0 0
143,937
0 25,942 69,270
0
$249,242 230,224
$349,919
$0 0
$0
2,300
0
0
(2,300)
0
0
0
0
0 0 0 0
$0 0
$0
Supply Management
$10,615,159 0
$10,615,159
0 0 0
172,417 0 0 0
113,295
0 400,902
15,268 0
$701,882 304,494
$11,012,547
$38,860 0
$38,860
163,600
0
0
(172,417)
0
0
0
0
0 0 0 0
($8,817)0
$30,043
Information Service
($19,545)0
($19,545)
0 0 0
100 0 0 0 0
0 625
2,694 0
$3,419 (7,156)
($8,970)
$0 0
$0
100
0
0
(100)
0
0
0
0
0 0 0 0
$0 0
$0
CUMULATIVE RESULTS OF OPERATIONSBeginning BalancesPrior period adjustments (+/-)Beginning Balances, as adjusted
Budgetary Financing Sources:Appropriations receivedAppropriations transferred-in/out (+/-)Other adjustments (rescissions, etc) (+/-)Appropriations usedNonexchange revenueDonations and forfeitures of cash and cash equivalentsTransfers-in/out without reimbursement (+/-)Other budgetary financing sources (+/-)
Other Financing Sources:Donations and forfeitures of propertyTransfers-in/out without reimbursement (+/-)Imputed financing from costs absorbed by othersOther (+/-)
Total Financing SourcesNet Cost of Operations (+/-)Ending Balances
UNEXPENDED APPROPRIATIONSBeginning BalancesPrior period adjustments (+/-)Beginning Balances, as adjusted
Budgetary Financing Sources:Appropriations receivedAppropriations transferred-in/out (+/-)Other adjustments (rescissions, etc) (+/-)Appropriations usedNonexchange revenueDonations and forfeitures of cash and cash equivalentsTransfers-in/out without reimbursement (+/-)Other budgetary financing sources (+/-)
Other Financing Sources:Donations and forfeitures of propertyTransfers-in/out without reimbursement (+/-)Imputed financing from costs absorbed by othersOther (+/-) total Financing Sources
Total Financing SourcesNet Cost of Operations (+/-)Ending Balances

Wor
king
Cap
ital F
und
FY02
Uni
ted
Sta
tes
Arm
y A
nnua
l Fin
anci
al S
tate
men
t
284
The
acc
ompa
nyin
g no
tes
are
an in
tegr
al p
art o
f the
se s
tate
men
ts.
Consolidating Statement of Changes in Net Position
Department of Defense • Department of the Army For the years ended September 30, 2002 and 2001 ($ in thousands)
Ordnance
$405,745 0
$405,745
0 0 0
1,400 162,246
0 0
(54,433)
0 (275,880)
22,652 0
($144,015)60,033
$201,697
$0 0
$0
1,400 0 0
(1,400)0 0 0 0
0 0 0 0
$0 0
$0
Component Level
$435,657 0
$435,657
0 0 0 0 0 0 0 0
0 (77,241)
0 0
($77,241)506
$357,910
$0 0
$0
0 0 0 0 0 0 0 0
0 0 0 0
$0 0
$0
Combined Total
$11,767,917 0
$11,767,917
0 0 0
176,217 170,039
0 0
202,799
0 74,348
109,884 0
$733,287 588,101
$11,913,103
$38,860 0
$38,860
167,400 0 0
(176,217)0 0 0 0
0 0 0 0
($8,817)0
$30,043
CUMULATIVE RESULTS OF OPERATIONSBeginning BalancesPrior period adjustments (+/-)Beginning Balances, as adjusted
Budgetary Financing Sources:Appropriations receivedAppropriations transferred-in/out (+/-)Other adjustments (rescissions, etc) (+/-)Appropriations usedNonexchange revenueDonations and forfeitures of cash and cash equivalentsTransfers-in/out without reimbursement (+/-)Other budgetary financing sources (+/-)
Other Financing Sources:Donations and forfeitures of propertyTransfers-in/out without reimbursement (+/-)Imputed financing from costs absorbed by othersOther (+/-)
Total Financing SourcesNet Cost of Operations (+/-)Ending Balances
UNEXPENDED APPROPRIATIONSBeginning BalancesPrior period adjustments (+/-)Beginning Balances, as adjusted
Budgetary Financing Sources:Appropriations receivedAppropriations transferred-in/out (+/-)Other adjustments (rescissions, etc) (+/-)Appropriations usedNonexchange revenueDonations and forfeitures of cash and cash equivalentsTransfers-in/out without reimbursement (+/-)Other budgetary financing sources (+/-)
Other Financing Sources:Donations and forfeitures of propertyTransfers-in/out without reimbursement (+/-)Imputed financing from costs absorbed by othersOther (+/-) total Financing Sources
Total Financing SourcesNet Cost of Operations (+/-)Ending Balances
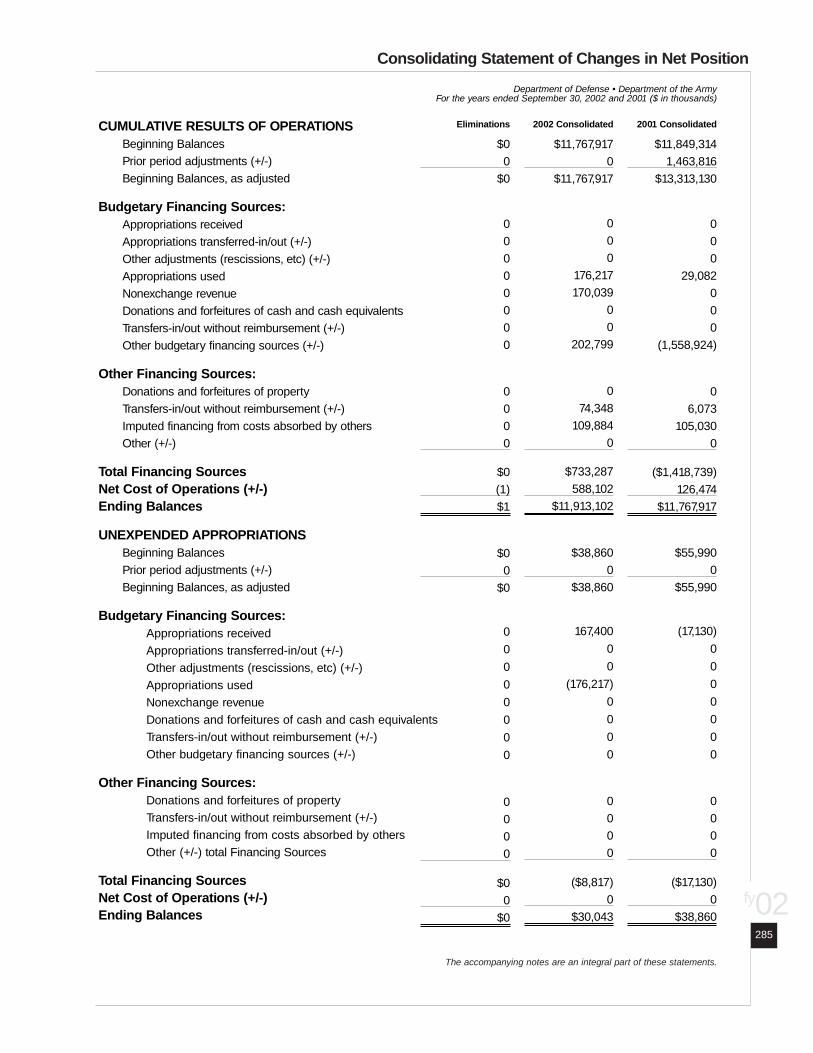
Consolidating Statement of Changes in Net Position
The accompanying notes are an integral part of these statements.
285
fy02
Department of Defense • Department of the Army For the years ended September 30, 2002 and 2001 ($ in thousands)
Eliminations
$0 0
$0
0 0 0 0 0 0 0 0
0 0 0 0
$0 (1)$1
$0 0
$0
0
0
0
0
0
0
0
0
0 0 0 0
$0 0
$0
2002 Consolidated
$11,767,917 0
$11,767,917
0 0 0
176,217 170,039
0 0
202,799
0 74,348
109,884 0
$733,287 588,102
$11,913,102
$38,860 0
$38,860
167,400
0
0
(176,217)
0
0
0
0
0 0 0 0
($8,817)0
$30,043
2001 Consolidated
$11,849,314 1,463,816
$13,313,130
0 0 0
29,082 0 0 0
(1,558,924)
0 6,073
105,030 0
($1,418,739)126,474
$11,767,917
$55,990 0
$55,990
(17,130)
0
0
0
0
0
0
0
0 0 0 0
($17,130)0
$38,860
CUMULATIVE RESULTS OF OPERATIONSBeginning BalancesPrior period adjustments (+/-)Beginning Balances, as adjusted
Budgetary Financing Sources:Appropriations receivedAppropriations transferred-in/out (+/-)Other adjustments (rescissions, etc) (+/-)Appropriations usedNonexchange revenueDonations and forfeitures of cash and cash equivalentsTransfers-in/out without reimbursement (+/-)Other budgetary financing sources (+/-)
Other Financing Sources:Donations and forfeitures of propertyTransfers-in/out without reimbursement (+/-)Imputed financing from costs absorbed by othersOther (+/-)
Total Financing SourcesNet Cost of Operations (+/-)Ending Balances
UNEXPENDED APPROPRIATIONSBeginning BalancesPrior period adjustments (+/-)Beginning Balances, as adjusted
Budgetary Financing Sources:Appropriations receivedAppropriations transferred-in/out (+/-)Other adjustments (rescissions, etc) (+/-)Appropriations usedNonexchange revenueDonations and forfeitures of cash and cash equivalentsTransfers-in/out without reimbursement (+/-)Other budgetary financing sources (+/-)
Other Financing Sources:Donations and forfeitures of propertyTransfers-in/out without reimbursement (+/-)Imputed financing from costs absorbed by othersOther (+/-) total Financing Sources
Total Financing SourcesNet Cost of Operations (+/-)Ending Balances

Wor
king
Cap
ital F
und
FY02
Uni
ted
Sta
tes
Arm
y A
nnua
l Fin
anci
al S
tate
men
t
286
The
acc
ompa
nyin
g no
tes
are
an in
tegr
al p
art o
f the
se s
tate
men
ts.
Combining Statement of Budgetary Resources
Department of Defense • Department of the Army For the years ended September 30, 2002 and 2001 ($ in thousands)
Budgetary Resources:A. Budget Authority:
Appropriations receivedBorrowing authorityContract authorityNet transfers (+/-)Other
B. Unobligated balance:Beginning of periodNet transfers, actual (+/-)Anticipated Transfers Balances
C. Spending authority from offsetting collections:Earned
CollectedReceivable from Federal sources
Change in unfilled customer ordersAdvance receivedWithout advance from Federal sources
Anticipated for the rest of year, without advancesTransfers from trust fundsSubtotal
D. Recoveries of prior year obligationsE. Temporarily not available pursuant to Public LawF Permanently not availableG Total Budgetary Resources
Status of Budgetary Resources:H. Obligations incurred:
DirectReimbursableSubtotal
I. Unobligated balance:ApportionedExempt from apportionmentOther available
J. Unobligated Balances Not AvailableK. Total, Status of Budgetary Resources
Relationship of Obligations to Outlays:L. Obligated Balance, Net - beginning of periodM. Obligated Balance transferred, net (+/-)N. Obligated Balance, Net - end of period:
Accounts receivableUnfilled customer order from Federal sourcesUndelivered ordersAccounts payable
O. Outlays:DisbursementsCollectionsSubtotal
P. Less: Offsetting receiptsQ. Net Outlays
DepotMaintenance
Budgetary
$2,300 0
704 00
1,029,150 00
1,743,501 (69,580)
(8,915)22,674
00
$1,687,680 5,539
00
$2,725,373
$2,300 1,739,157 1,741,457
983,916 000
$2,725,373
($317,292)0
(61,487)(640,470)
268,603 136,057
1,762,828 (1,734,586)
$28,242 0
$28,242
SupplyManagement
Non-BudgetaryCredit Program
FinancingAccounts
$0 0000
000
00
0000
$0000
$0
$0 00
0000
$0
$00
0 000
00
$00
$0
SupplyManagement
Budgetary
$163,600 0
63,691 00
6,765 00
3,465,603 14,913
(980)214,571
00
$3,694,107 389,249
00
$4,317,412
$167,852 4,148,454 4,316,306
1,106 000
$4,317,412
$1,805,600 0
(133,787)(1,297,222)2,375,733
603,675
3,954,775 (3,464,623)
$490,152 0
$490,152
DepotMaintenance
Non-BudgetaryCredit Program
FinancingAccounts
$0 0000
000
00
0000
$0000
$0
$0 00
0000
$0
$00
0 000
00
$00
$0

The accompanying notes are an integral part of these statements.
287
fy02
Combining Statement of Budgetary Resources
Department of Defense • Department of the Army For the years ended September 30, 2002 and 2001 ($ in thousands)
Budgetary Resources:A. Budget Authority:
Appropriations receivedBorrowing authorityContract authorityNet transfers (+/-)Other
B. Unobligated balance:Beginning of periodNet transfers, actual (+/-)Anticipated Transfers Balances
C. Spending authority from offsetting collections:Earned
CollectedReceivable from Federal sources
Change in unfilled customer ordersAdvance receivedWithout advance from Federal sources
Anticipated for the rest of year, without advancesTransfers from trust fundsSubtotal
D. Recoveries of prior year obligationsE. Temporarily not available pursuant to Public LawF Permanently not availableG Total Budgetary Resources
Status of Budgetary Resources:H. Obligations incurred:
DirectReimbursableSubtotal
I. Unobligated balance:ApportionedExempt from apportionmentOther available
J. Unobligated Balances Not AvailableK. Total, Status of Budgetary Resources
Relationship of Obligations to Outlays:L. Obligated Balance, Net - beginning of periodM. Obligated Balance transferred, net (+/-)N. Obligated Balance, Net - end of period:
Accounts receivableUnfilled customer order from Federal sourcesUndelivered ordersAccounts payable
O. Outlays:DisbursementsCollectionsSubtotal
P. Less: Offsetting receiptsQ. Net Outlays
InformationService Guard
Budgetary
$100 0000
5,454 0 0
100,908 4,339
24 (5,326)
00
99,945 00 0
$105,499
$100 65,433
$65,533
39,966 000
$105,499
$6,291 0
(9,234)(37,885)
2,260 16,035
101,633 (100,931)
$702 0
$702
Ordnance Non-BudgetaryCredit Program
FinancingAccounts
$0 0000
000
00
00000000
$0
$0 0
$0
0000
$0
$00
0 000
00
$00
$0
OrdnanceBudgetary
$1,400 0
2,212 00
364,078 00
835,668 (4,983)
138,777 (54,686)
00
914,776 9,111
00
$1,291,577
$1,400 706,917
$708,317
583,260 000
$1,291,577
($255,641)0
(38,410)(324,885)
123,406 43,158
699,966 (974,445)
($274,479)0
($274,479)
InformationService Guard
Non-BudgetaryCredit Program
FinancingAccounts
$0 0000
000
00
00000000
$0
$0 0
$0
0000
$0
$00
0 000
00
$00
$0

Wor
king
Cap
ital F
und
FY02
Uni
ted
Sta
tes
Arm
y A
nnua
l Fin
anci
al S
tate
men
t
288
The
acc
ompa
nyin
g no
tes
are
an in
tegr
al p
art o
f the
se s
tate
men
ts.
Combining Statement of Budgetary Resources
Department of Defense • Department of the Army For the years ended September 30, 2002 and 2001 ($ in thousands)
Budgetary Resources:A. Budget Authority:
Appropriations receivedBorrowing authorityContract authorityNet transfers (+/-)Other
B. Unobligated balance:Beginning of periodNet transfers, actual (+/-)Anticipated Transfers Balances
C. Spending authority from offsetting collections:Earned
CollectedReceivable from Federal sources
Change in unfilled customer ordersAdvance receivedWithout advance from Federal sources
Anticipated for the rest of year, without advancesTransfers from trust fundsSubtotal
D. Recoveries of prior year obligationsE. Temporarily not available pursuant to Public LawF Permanently not availableG Total Budgetary Resources
Status of Budgetary Resources:H. Obligations incurred:
DirectReimbursableSubtotal
I. Unobligated balance:ApportionedExempt from apportionmentOther available
J. Unobligated Balances Not AvailableK. Total, Status of Budgetary Resources
Relationship of Obligations to Outlays:L. Obligated Balance, Net - beginning of periodM. Obligated Balance transferred, net (+/-)N. Obligated Balance, Net - end of period:
Accounts receivableUnfilled customer order from Federal sourcesUndelivered ordersAccounts payable
O. Outlays:DisbursementsCollectionsSubtotal
P. Less: Offsetting receiptsQ. Net Outlays
FY 2002 CombinedBudgetary
$167,400 0
66,607 00
1,505,447 00
6,145,494 (55,125)
128,906 177,233
00
$6,396,508 403,899
00
$8,539,861
$171,652 6,659,961
$6,831,613
1,708,248 000
$8,539,861
$1,129,489 0
(280,204)(2,300,462)
2,770,002 729,331
6,516,428 (6,274,399)
$242,029 0
$242,029
Component LevelNon-BudgetaryCredit Program
Financing Accounts
$0 0000
000
00
0000
$0000
$0
$0 0
$0
0000
$0
$00
0 000
00
$00
$0
Component LevelBudgetary
$0 0000
100,000 00
(186)186
0000
$0000
$100,000
$0 0
$0
100,000 000
$100,000
($109,469)0
(37,286)00
(69,594)
(2,774)186
($2,588)0
($2,588)

The accompanying notes are an integral part of these statements.
289
fy02
Combining Statement of Budgetary Resources
Department of Defense • Department of the Army For the years ended September 30, 2002 and 2001 ($ in thousands)
Budgetary Resources:A. Budget Authority:
Appropriations receivedBorrowing authorityContract authorityNet transfers (+/-)Other
B. Unobligated balance:Beginning of periodNet transfers, actual (+/-)Anticipated Transfers Balances
C. Spending authority from offsetting collections:Earned
CollectedReceivable from Federal sources
Change in unfilled customer ordersAdvance receivedWithout advance from Federal sources
Anticipated for the rest of year, without advancesTransfers from trust fundsSubtotal
D. Recoveries of prior year obligationsE. Temporarily not available pursuant to Public LawF Permanently not availableG Total Budgetary Resources
Status of Budgetary Resources:H. Obligations incurred:
DirectReimbursableSubtotal
I. Unobligated balance:ApportionedExempt from apportionmentOther available
J. Unobligated Balances Not AvailableK. Total, Status of Budgetary Resources
Relationship of Obligations to Outlays:L. Obligated Balance, Net - beginning of periodM. Obligated Balance transferred, net (+/-)N. Obligated Balance, Net - end of period:
Accounts receivableUnfilled customer order from Federal sourcesUndelivered ordersAccounts payable
O. Outlays:DisbursementsCollectionsSubtotal
P. Less: Offsetting receiptsQ. Net Outlays
FY 2001 CombinedNon-BudgetaryCredit Program
Financing Accounts
$0 0000
000
00
00000000
$0
$0 0
$0
0000
$0
00
0 000
00
$00
$0
FY 2001 CombinedBudgetary
$11,952 0
809,853 00
1,352,632 6,100
0
5,920,104 (88,265)
24,505 (721,912)
00
5,134,432 196,060
00
$7,511,059
($717,549)6,723,163
$6,005,614
1,505,447 0
(2)0
$7,511,059
821,673 0
(335,328)(2,123,227)
2,995,646 592,401
6,311,883 (5,944,608)
$367,275 0
$367,275
FY 2002 CombinedNon-BudgetaryCredit Program
Financing Accounts
$0 0000
000
00
00000000
$0
$0 0
$0
0000
$0
00
0 000
00
$00
$0

Wor
king
Cap
ital F
und
FY02
Uni
ted
Sta
tes
Arm
y A
nnua
l Fin
anci
al S
tate
men
t
290
The
acc
ompa
nyin
g no
tes
are
an in
tegr
al p
art o
f the
se s
tate
men
ts.
Combining Statement of Financing
Department of Defense • Department of the Army For the years ended September 30, 2002 and 2001 ($ in thousands)
InformationService
$65,533
(99,945)
($34,412)0
($34,412)
0 0
2,694 $0
$2,694
($31,718)
26,895 (5,302)
0
0
0
00
$21,593
($10,125)
SupplyManagement
$4,316,306
(4,083,355)
$232,951 0
$232,951
00
15,268 $0
$15,268
$248,219
201,079 213,590
0
0
(686,348)
00
($271,629)
($23,460)
DepotMaintenance
$1,741,457
(1,693,220)
$48,237 0
$48,237
00
69,270 $0
$69,270
$117,507
33,920 13,760
(2,484)
0
157,287
00
$202,483
$319,990
Ordnance
$708,317
(923,887)
($215,570)0
($215,570)
00
22,652 $0
$22,652
($192,918)
(2,688)84,091 (1,649)
0
190,803
00
$270,557
$77,639
Resources Used to Finance Activities:
Budgetary Resources Obligated1. Obligations incurred2. Less: Spending authority from offsetting
collections and recoveries (-)3. Obligations net of offsetting collections and
recoveries4. Less: Offsetting receipts (-)5. Net obligations
Other Resources6. Donations and forfeitures of property7. Transfers in/out without reimbursement (+/-)8. Imputed financing from costs absorbed
by others9. Other (+/-)10. Net other resources used to finance activities
11. Total resources used to finance activities
Resources Used to Finance Items not Part ofthe Net Cost of Operations
12. Change in budgetary resources obligated forgoods, services and benefits ordered but notyet providedUndelivered Orders (-)Unfilled Customer Orders
13. Resources that fund expenses recognized inprior periods
14. Budgetary offsetting collections and receiptsthat do not affect net cost of operations
15. Resources that finance the acquisition ofassets
16. Other resources or adjustments to netobligated resources that do not affect netcost of operationsLess: Trust or Special Fund ReceiptsRelated to Exchange in the Entity's Budget (-)Other (+/-)
17. Total resources used to finance itemsnot part of the net cost of operations
18. Total resources used to finance the netcost of operations

The accompanying notes are an integral part of these statements.
291
fy02
Combining Statement of Financing
Department of Defense • Department of the Army For the years ended September 30, 2002 and 2001 ($ in thousands)
InformationService
(57)
0
0
00
($57)
127 0
2,899
$3,026
$2,969
($7,156)
SupplyManagement
0
0
0
00
$0
25,808 302,148
0
$327,956
$327,956
$304,496
DepotMaintenance
1,420
0
0
0910
$2,330
54,332 (150,973)
4,546
($92,095)
($89,765)
$230,225
Ordnance
848
0
0
0218
$1,066
24,798 (43,472)
0
($18,674)
($17,608)
$60,031
Components of the Net Cost of Operationsthat will not Require or Generate Resourcesin the Current Period:
Components Requiring or GeneratingResources in Future Periods:
19. Increase in annual leave liability20. Increase in environmental and disposal
liability21. Upward/Downward reestimates of credit
subsidy expense (+/-)22. Increase in exchange revenue receivable
from the public (-)23. Other (+/-)24. Total components of Net Cost of Operations
that will require or generate resources infuture periods
Components not Requiring or GeneratingResources:
25. Depreciation and amortization26. Revaluation of assets or liabilities (+/-)27. Other (+/-)28. Total components of Net Cost of Operations
that will not require or generate resources
29. Total components of net cost ofoperations that will not require orgenerate resources in the current period
30. Net Cost of Operations

Wor
king
Cap
ital F
und
FY02
Uni
ted
Sta
tes
Arm
y A
nnua
l Fin
anci
al S
tate
men
t
292
The
acc
ompa
nyin
g no
tes
are
an in
tegr
al p
art o
f the
se s
tate
men
ts.
Combining Statement of Financing
Department of Defense • Department of the Army For the years ended September 30, 2002 and 2001 ($ in thousands)
FY 2001Combined
$6,005,613
(5,330,521)
$675,092 0
$675,092
00
105,030 0
$105,030
$780,122
365,539 (697,406)
(4,377)
0
(2,660,662)
0 (71,152)
($3,068,058)
($2,287,936)
FY 2002Combined
$6,831,613
(6,800,407)
$31,206 0
$31,206
00
109,884 0
$109,884
$141,090
259,206 306,139
(4,133)
0
(338,258)
00
$222,954
$364,044
ComponentLevel
$0
0
$00
$0
00
00
$0
$0
00
0
0
0
00
$0
$0
Resources Used to Finance Activities:
Budgetary Resources Obligated1. Obligations incurred2. Less: Spending authority from offsetting
collections and recoveries (-)3. Obligations net of offsetting collections and
recoveries4. Less: Offsetting receipts (-)5. Net obligations
Other Resources6. Donations and forfeitures of property7. Transfers in/out without reimbursement (+/-)8. Imputed financing from costs absorbed by
others9. Other (+/-)10. Net other resources used to finance activities
11. Total resources used to finance activities
Resources Used to Finance Items not Part ofthe Net Cost of Operations
12. Change in budgetary resources obligated forgoods, services and benefits ordered but notyet providedUndelivered Orders (-)Unfilled Customer Orders
13. Resources that fund expenses recognized inprior periods
14. Budgetary offsetting collections and receiptsthat do not affect net cost of operations
15. Resources that finance the acquisition ofassets
16. Other resources or adjustments to net obligatedresources that do not affect net cost ofoperationsLess: Trust or Special Fund Receipts Relatedto Exchange in the Entity's Budget (-)Other (+/-)
17. Total resources used to finance items notpart of the net cost of operations
18. Total resources used to finance the netcost of operations

The accompanying notes are an integral part of these statements.
293
fy02
Combining Statement of Financing
Department of Defense • Department of the Army For the years ended September 30, 2002 and 2001 ($ in thousands)
FY 2001Combined
00
0
016,675
$16,675
$85,460 1,588,075
484,690
$2,158,225
$2,174,900
($113,036)
FY 2002Combined
2,211 0
0
01,128
$3,339
$105,065 107,703
7,951
$220,719
$224,058
$588,102
ComponentLevel
00
0
00
$0
$00
506
$506
$506
$506
Components of the Net Cost of Operations thatwill not Require or Generate Resources in theCurrent Period:
Components Requiring or GeneratingResources in Future Periods:
19. Increase in annual leave liability20. Increase in environmental and disposal liability21. Upward/Downward reestimates of credit
subsidy expense (+/-)22. Increase in exchange revenue receivable from
the public (-)23. Other (+/-)24. Total components of Net Cost of Operations
that will require or generate resources in futureperiods
Components not Requiring or GeneratingResources:
25. Depreciation and amortization26. Revaluation of assets or liabilities (+/-)27. Other (+/-)28. Total components of Net Cost of Operations
that will not require or generate resources
29. Total components of net cost of operationsthat will not require or generate resourcesin the current period
30. Net Cost of Operations

Wor
king
Cap
ital F
und
FY02
Uni
ted
Sta
tes
Arm
y A
nnua
l Fin
anci
al S
tate
men
t
294
The
acc
ompa
nyin
g no
tes
are
an in
tegr
al p
art o
f the
se s
tate
men
ts.
Department of Defense • Department of the Army For the years ended September 30, 2002 and 2001 ($ in thousands) Budgetary Financing Accounts
Statement of Disaggregated Budgetary Resources
BUDGETARY RESOURCESA. Budget Authority:
1. Appropriations received2. Borrowing authority3. Contract authority4. Net transfers (+/-)5. Other
B. Unobligated balance:4. Beginning of period5. Net transfers, actual (+/-)6. Anticipated Transfers Balances
C. Spending authority from offsettingcollections:7. Earned8. Collected9. Receivable from Federal sources10. Change in unfilled customer orders11. Advance received12. Anticipated for the rest of year, without advances13. Transfers from trust funds14. Subtotal
D. Recoveries of prior year obligations
E. Temporarily not available pursuant to PublicLaw
F. Permanently not available
G. Total Budgetary Resources
STATUS OF BUDGETARY RESOURCESA. Obligations incurred:
15. Direct16. Reimbursable17 Subtotal
B. Unobligated balance:18. Apportioned19. Exempt from apportionment20. Other available
C. Unobligated Balances Not Available
D. Total, Status of Budgetary Resources
Working CapitalFunds
$167,400 0
66,608 0 0
1,505,446 0 0 0
0 6,145,494
(55,125)0
128,906 177,233
0 0
$6,396,508
403,899
0
0
$8,539,861
$171,652 6,659,961
$6,831,613
1,708,248 0 0
0
$8,539,861
FY 2001 Combined
$11,952 0
809,853 0 0
1,352,634 6,100
0 0
0 5,920,103
(88,266)0
24,506 (721,912)
0 0
$5,134,431
196,089
0
0
$7,511,059
($717,550)6,723,162
$6,005,613
1,505,446 0 0
0
$7,511,059
FY 2002 Combined
$167,400 0
66,608 0 0
1,505,446 0 0 0
0 6,145,494
(55,125)0
128,906 177,233
0 0
$6,396,508
403,899
0
0
$8,539,861
$171,652 6,659,961
$6,831,613
1,708,248 0 0
0
$8,539,861

The accompanying notes are an integral part of these statements.
295
fy02
Statement of Disaggregated Budgetary Resources
Department of Defense • Department of the Army For the years ended September 30, 2002 and 2001 ($ in thousands)
Relationship of Obligations to Outlays:A. Obligated Balance, Net beginning of period
B. Obligated Balance transferred, net (+/-)
C. Obligated Balance, Net end of period:21. Accounts receivable22. Unfilled customer order from Federal sources23. Undelivered orders24. Accounts payable
D. Outlays:25. Disbursements26. Collections27. Subtotal
E. Less: Offsetting receipts
F. Net Outlays
Working CapitalFunds
$1,129,490
0
(280,204)(2,300,462)
2,770,002 729,330
6,516,428 (6,274,400)
$242,028
0
$242,028
FY 2001 Combined
$821,672
0
(335,329)(2,123,229)
2,995,646 592,4001
6,311,883(5,944,609)
$367,275
0
$367,275
FY 2002 Combined
$1,129,490
0
(280,204)(2,300,462)
2,770,002 729,330
6,516,428 (6,274,400)
$242,028
0
$242,028
Budgetary Financing Accounts

Wor
king
Cap
ital F
und
FY02
Uni
ted
Sta
tes
Arm
y A
nnua
l Fin
anci
al S
tate
men
t
296
The
acc
ompa
nyin
g no
tes
are
an in
tegr
al p
art o
f the
se s
tate
men
ts.
Statement of Disaggregated Budgetary Resources
Department of Defense • Department of the Army For the years ended September 30, 2002 and 2001 ($ in thousands) Non-Budgetary Financing Accounts
BUDGETARY RESOURCESA. Budget Authority:
1. Appropriations received2. Borrowing authority3. Contract authority4. Net transfers (+/-)5. Other
B. Unobligated balance:4. Beginning of period5. Net transfers, actual (+/-)6. Anticipated Transfers Balances
C. Spending authority from offsettingcollections:7. Earned8. Collected9. Receivable from Federal sources10. Change in unfilled customer orders11. Advance received12. Anticipated for the rest of year, without advances13. Transfers from trust funds14. Subtotal
D. Recoveries of prior year obligations
E. Temporarily not available pursuant to PublicLaw
F. Permanently not available
G. Total Budgetary Resources
STATUS OF BUDGETARY RESOURCESA. Obligations incurred:
15. Direct16. Reimbursable17 Subtotal
B. Unobligated balance:18. Apportioned19. Exempt from apportionment20. Other available
C. Unobligated Balances Not Available
D. Total, Status of Budgetary Resources
WorkingCapital Funds
$0 0 0 0 0
0 0 0 0
0 0 0 0 0 0 0 0
$0
0
0
0
$0
$0 0
$0
0 0 0
0
$0
FY 2001Combined
$0 0 0 0 0
0 0 0 0
0 0 0 0 0 0 0 0
$0
0
0
0
$0
$0 0
$0
0 0 0
0
$0
FY 2002Combined
$0 0 0 0 0
0 0 0 0
0 0 0 0 0 0 0 0
$0
0
0
0
$0
$0 0
$0
0 0 0
0
$0

The accompanying notes are an integral part of these statements.
297
fy02
Statement of Disaggregated Budgetary Resources
Department of Defense • Department of the Army For the years ended September 30, 2002 and 2001 ($ in thousands)Non-Budgetary Financing Accounts
Relationship of Obligations to Outlays:A. Obligated Balance, Net beginning of period
B. Obligated Balance transferred, net (+/-)
C. Obligated Balance, Net end of period:21. Accounts receivable22. Unfilled customer order from Federal sources23. Undelivered orders24. Accounts payable
D. Outlays:25. Disbursements26. Collections27. Subtotal
E. Less: Offsetting receipts
F. Net Outlays
WorkingCapital Funds
$0
0
0 0 0 0
0 0
$0
0
$0
FY 2001Combined
$0
0
0 0 0 0
0 0
$0
0
$0
FY 2002Combined
$0
0
0 0 0 0
0 0
$0
0
$0

Wor
king
Cap
ital F
und
298
FY02
Con
solid
ated
Arm
y A
nnua
l Fin
anci
al S
tate
men
ts
Schedule, Part A DoD Intra-governmental� Treasury� Fund Balance� Accounts� Loans�Asset Balances ($ Amounts in Thousands)� Index� with Treasury� Receivable� Receivable� Investments� Other�
Department of Agriculture 12 $200
Department of the Interior 14 $12
Department of Justice 15 $69
Navy General Fund 17 $4,802
US Postal Service 18 $1
Department of State 19 $102
Department of the Treasury 20 $251,030 $14
Army General Fund 21 $197,098 $48
General Service Administration 47 $1,423
Air Force General Fund 57 $1,004
Federal Emergency Management Agency 58 $1,156
Department of Transportation 69 $97
Department of Health and Human Services 75 $98
National Aeronautics and Space Administration 80 $167
Department of Energy 89 $29
US Army Corps of Engineers 96 $80
Other Defense Organizations General Funds 97 $8,425
Other Defense Organizations Working Capital Funds 97-4930 $1,111
Army Working Capital Fund 97-4930.001
Navy Working Capital Fund 97-4930.002 $1,823
Air Force Working Capital Fund 97-4930.003 $4,269
Total $251,030 $221,980 $48

299
fy02
Required Supplementary Information
Schedule, Part B DoD Intra-governmental Entity� Treasury� Accounts� Debts/Borrowings� �Liabilities ($ Amounts in Thousands)� Index� Payable� From Other Agencies� Other�
Department of Labor 16 $50,126
Navy General Fund 17 $5,158 $576
Department of the Treasury 20 $1
Army General Fund 21 $30,466 $202,742
Office of Personnel Management 24 $7,165
General Service Administration 47 $5
Air Force General Fund 57 $833 $45
US Army Corps of Engineers 96 $38
Other Defense Organizations General Funds 97 $6,352 $1,229
Other Defense Organizations Working CapitalFunds 97-4930 $33,784 $8
Navy Working Capital Fund 97-4930.002 $843 $142
Air Force Working Capital Fund 97-4930.003 $53
Total $77,527 $262,029
Governmental Transactions from the Consolidating Trial Balance

Wor
king
Cap
ital F
und
300
FY02
Con
solid
ated
Arm
y A
nnua
l Fin
anci
al S
tate
men
ts
Schedule, Part C DoD Intra-governmental Revenue and Related� �Costs ($ Amounts in Thousands)� Treasury Index� Earned Revenue�
Department of Agriculture 12 $43
Department of the Interior 14 $40
Department of Justice 15 $3,607
Navy General Fund 17 $231,020
US Postal Service 18 $13
Department of State 19 $125
Department of the Treasury 20 $973
Army General Fund 21 $5,333,409
Department of Veterans Affairs 36 $13
General Service Administration 47 $2,319
Air Force General Fund 57 $449,064
Department of Transportation 69 $1,037
Department of Health and Human Services 75 $259
National Aeronautics and Space Administration 80 $192
Department of Energy 89 $28
US Army Corps of Engineers 96 $835
Other Defense Organizations General Funds 97 $216,376
Other Defense Organizations Working Capital Funds 97-4930 $36,391
Navy Working Capital Fund 97-4930.002 $157,642
Air Force Working Capital Fund 97-4930.003 $416,518
Total $6,849,904
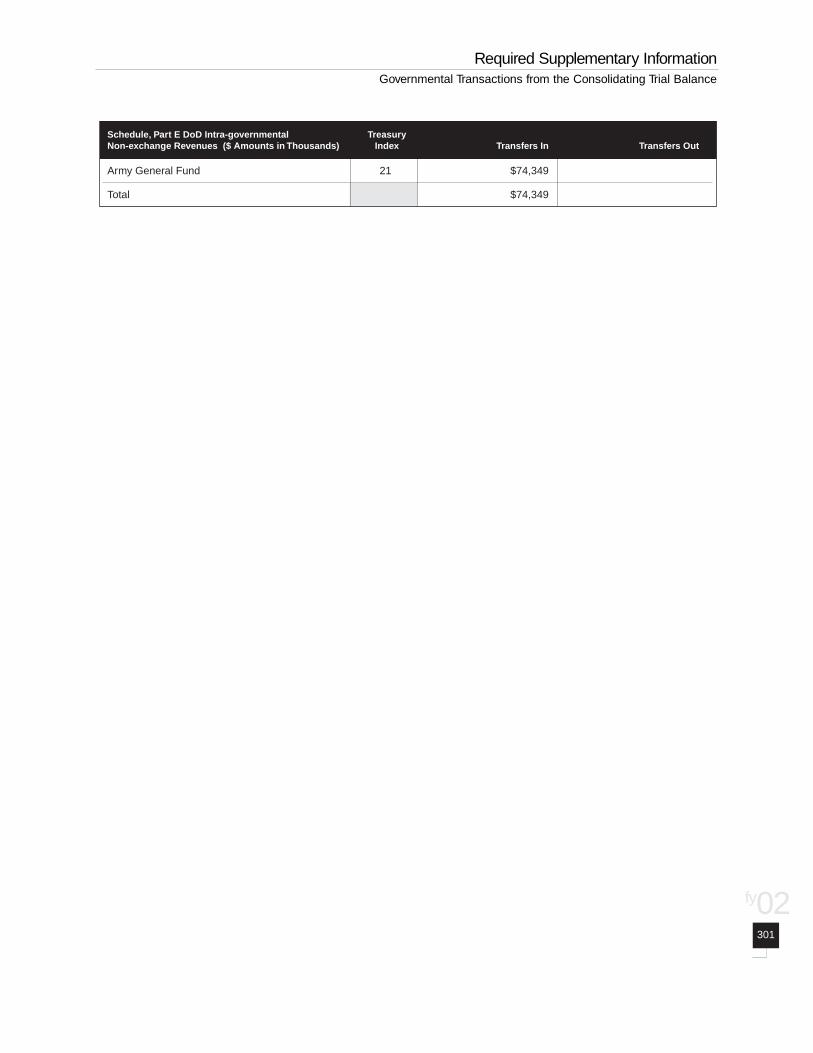
301
fy02
Required Supplementary Information
Schedule, Part E DoD Intra-governmental� Treasury�� �Non-exchange Revenues ($ Amounts in Thousands)� Index� Transfers In� Transfers Out�
Army General Fund 21 $74,349
Total $74,349
Governmental Transactions from the Consolidating Trial Balance

Wor
king
Cap
ital F
und
302
FY02
Con
solid
ated
Arm
y A
nnua
l Fin
anci
al S
tate
men
ts

303
fy02
January 8, 2003
MEMORANDUM FOR ASSISTANT SECRETARY OF THE ARMY (FINANCIALMANAGEMENT AND COMPTROLLER)
SUBJECT: Independent Auditor's Report on the Army Working Capital Fund Fiscal Year 2002 Principal Financial Statements (Report No. D-2003-0046)
The Chief Financial Officers (CFO) Act of 1990, as amended, requires the Inspector General of theDepartment of Defense to audit the accompanying Consolidated Balance Sheet of the Army Working CapitalFund as of September 30, 2002, and the related Consolidated Statements of Net Cost and Changes in NetPosition and the Combined Statements of Financing and Budgetary Resources for the fiscal years then ended.These financial statements are the responsibility of Army Working Capital Fund management. The ArmyWorking Capital Fund is also responsible for implementing effective internal control and for complying withlaws and regulations. In addition to our disclaimer of opinion on the financial statements, we are includingthe required reports on internal control and compliance with laws and regulations. The Army did not prepareFY 2001 Army Working Capital Fund Financial Statements due to the loss of financial managementpersonnel during the September 11, 2001, terrorist attack. Because the Army did not prepare FY 2001financial statements, an audit was not performed.
Disclaimer of Opinion on the Financial Statements The Assistant Secretary of the Army (Financial Management and Comptroller) acknowledged to us that thefinancial management and feeder systems that DoD relies on to provide evidence supporting the ArmyWorking Capital Fund financial statements do not comply with Federal financial management systemrequirements, generally accepted accounting principles, and the U.S. Government Standard General Ledger atthe transaction level. The Army also acknowledged that the previously reported material weaknesses related tofinancial management systems and inventories were applicable to the FY 2002 Army Working Capital FundFinancial Statements. Therefore, we did not perform auditing procedures to support material amounts on thefinancial statements. In addition, other auditing procedures were not performed because Section 1008(d) ofthe FY 2002 National Defense Authorization Act requires the Inspector General of the Department of Defenseto perform only audit procedures required by generally accepted government auditing standards that areconsistent with the representations made by management. These material deficiencies also affect the reliabilityof certain information contained in the accompanying Management's Discussion and Analysis and certainother information-much of which is taken from the same data sources as the principal financial statements.1
INSPECTOR GENERALDEPARTMENT OF DEFENSE
400 ARMY NAVY DRIVEARLINGTON, VIRGINIA 22202-4704
A Regular Statement and Account of the Receipts and Expenditures of all public Money shall be publishedfrom time to time. —Constitution of the United States Article I, Section 9
1 Other information includes the Supporting Consolidating and Combining Financial Statements and Required Supplementary Information.

Wor
king
Cap
ital F
und
304
FY02
Con
solid
ated
Arm
y A
nnua
l Fin
anci
al S
tate
men
ts
These deficiencies would have precluded an audit opinion. As described above, we are unable to express, andwe do not express, an opinion on the financial statements and the accompanying information.
Summary of Internal Control In planning and performing our audit, we considered the Army Working Capital Fund's internal control overfinancial reporting and compliance. We did this to determine our procedures for auditing the financialstatements and to comply with Office of Management and Budget guidance but not to express an opinion oninternal control. Accordingly, we do not express an opinion on internal control over financial reporting andcompliance because previously identified reportable conditions,2 all of which are material, continue to exist inthe following areas:
financial management systems and processes;
Inventory and Related Property;
General Property, Plant, and Equipment;
Accounts Payable;
intragovernmental eliminations;
Statement of Net Cost; and
Statement of Financing.
A material weakness is a condition that precludes the entity's internal control from providing reasonableassurance that misstatements, losses, or noncompliance that are material in relation to the financial statementswould be prevented or detected on a timely basis. Our internal control work would not necessarily discloseall material weaknesses. See the Attachment for additional details on material internal control weaknesses.
Summary of Compliance with Laws and Regulations Our work to determine compliance with selected provisions of the applicable laws and regulations waslimited because management acknowledged instances of noncompliance, and previously reported instancesof noncompliance continue to exist. The Army was unable to comply with the requirements of the CFO Actof 1990 as amended. The Assistant Secretary of the Army (Financial Management and Comptroller)
A Regular Statement and Account of the Receipts and Expenditures of all public Money shall be publishedfrom time to time. —Constitution of the United States Article I, Section 9
2 Reportable conditions are matters coming to the auditor's attention that, in his or her judgment, should be communicated to management because theyrepresent significant deficiencies in the design or operation of internal control, which could adversely affect the organization's ability to initiate, record,process, and report financial data consistent with the assertions of management in financial statements.

305
fy02
acknowledged that many of its critical financial management and feeder systems did not comply with therequirements of the Federal Financial Management Information Act of 1996 (the FFMIA). Therefore, we didnot determine whether the Army Working Capital Fund was in compliance with all applicable laws andregulations related to financial reporting. See the Attachment for additional details on compliance with lawsand regulations.
In order for DoD to comply with statutory reporting requirements and applicable financial systemsrequirements, the Under Secretary of Defense (Comptroller)\Chief Financial Officer is developing the DoD-wide financial management enterprise architecture. The DoD anticipates developing and implementing thefinancial management enterprise architecture by 2007. The Army is also working to reengineer andmodernize wholesale logistics processes and has contracted for modernizing Army logistics functionsthrough the Logistics Modernization Program. However, until the architecture is developed andimplemented, the Army Working Capital Fund will be unable to fully comply with the statutory reportingrequirements.
We caution that other noncompliance may have occurred and not been detected. Further, the results of ourlimited procedures may not be sufficient for other purposes. Our objective was not to express an opinion oncompliance with applicable laws and regulations.
Management ResponsibilityManagement is responsible for:
preparing the financial statements in conformity with generally accepted accounting principles;
establishing, maintaining, and assessing internal control to provide reasonable assurance that the broadcontrol objectives of the Federal Managers' Financial Integrity Act of 1982 are met;
ensuring that the Army Working Capital Fund's financial management systems substantially complywith FFMIA requirements; and
complying with applicable laws and regulations.
David K. SteensmaDeputy Assistant Inspector General
for Auditing
Opinion Report
A Regular Statement and Account of the Receipts and Expenditures of all public Money shall be publishedfrom time to time. —Constitution of the United States Article I, Section 9

Wor
king
Cap
ital F
und
306
FY02
Con
solid
ated
Arm
y A
nnua
l Fin
anci
al S
tate
men
ts
Reports on Internal Control and Compliance with Laws andRegulations
Internal ControlManagement is responsible for implementing effective internal control and for providing reasonableassurance that accounting data is accumulated, recorded, and reported properly; and that assets aresafeguarded. We did not perform tests of Army Working Capital Fund internal control over financialreporting and we did not obtain sufficient evidence to support or express an opinion on internal controlbecause the following previously identified reportable conditions, all of which are material, continue to exist.The following material internal control weaknesses precluded an audit opinion of the FY 2002 ArmyWorking Capital Fund Financial Statements and significantly impair the ability of DoD to detect andinvestigate fraud or theft of assets. A high risk of material misstatements will continue to exist until theinternal control deficiencies are corrected.
Financial Management Systems and Processes. The Army Working Capital Fund's systems are unable tomeet all of the requirements for full accrual accounting because the systems used were not designed tocollect and record financial information as required by generally accepted accounting principles. Financialand non-financial feeder systems are not integrated and do not contain an audit trail for the proprietary andbudgetary accounts. The Army Working Capital Fund derives its financial information for major asset andliability accounts from noncompliant financial systems, such as the Commodity Command Standard System.The Army Working Capital Fund disclosed financial management system deficiencies in the footnotes to theFY 2002 financial statements. Until such time as all of the processes are updated to collect and reportfinancial information as required by generally accepted accounting principles, some of the Army WorkingCapital Fund's financial data will be based on budgetary transactions (obligations, disbursements, andcollections) and non-financial feeder systems. The DoD-wide systemic deficiencies in financial managementsystems and business processes result in the inability to collect and report financial and performanceinformation that is accurate, reliable, and timely.
Inventory and Related Property. The existing inventory valuation method does not produce an auditableapproximation of historical cost because the associated gains and losses cannot be accurately tracked tospecific items or purchases. The Army Working Capital Fund uses the latest acquisition cost method ofvaluing inventory because its inventory systems were designed for materiel management rather thanaccounting. The systems provide accountability and visibility over inventory items. However, they did notmaintain the historical cost data necessary to comply with Statement of Federal Financial AccountingStandards (SFFAS) No. 3, "Accounting for Inventory and Related Property," and could not directly producefinancial transactions using the U.S. Government Standard General Ledger. In addition, neither the DefenseFinance and Accounting Service (DFAS) nor the Army reconciled differences between the accountingrecords and the logistical records. Instead, they accepted the data from the logistical records and adjusted theaccounting records. Further, physical inventories have not been completed and adequate controls had notbeen established over items in transit.

307
fy02
General Property, Plant, and Equipment. The value of Army Working Capital Fund General Property,Plant, and Equipment is not reliably reported due to the lack of supporting documentation, the failure tocorrectly compute depreciation, and the value of property in the possession of contractors was not fullyreported. Information on the acquisition date and cost was not always available and was sometimes recordedincorrectly. In addition, the system that provides real property information to the Defense PropertyAccountability System was a noncompliant system.
Accounts Payable. DFAS Indianapolis made significant adjustments to the accounts payable balances toderive the reported balances. DFAS Indianapolis adjusted accounts payable with the public downward by$124.7 million for undistributed disbursements. Also, the Army Working Capital Fund was unable toreconcile intragovernmental accounts payable to the related intragovernmental accounts receivable thatgenerated the payable. As a result, DFAS made $61.7 million in unsupported adjustments to increaseintragovernmental accounts payable for the Supply Management activity group and made $57.1 million inunsupported adjustments to decrease intragovernmental accounts payable in the other three activity groups inorder to force the amounts to agree with Army trading partners. In addition, accounts payable in the SupplyManagement activity group were not established in accordance with SFFAS No. 1, "Accounting for SelectedAssets and Liabilities."
Intragovernmental Eliminations. The inability to reconcile most intragovernmental transactions results inadjustments that cannot be verified. DoD and Army accounting systems were not capable of capturingtrading partner data at the transaction level in a manner that facilitated trading partner reconciliations andDoD guidance did not require adequate support for intragovernmental eliminations. As a result, DoD did notrequire trading partner reconciliations, but required that buyer-side transaction data be forced to agree withseller-side transaction data without performing proper reconciliations. DFAS Indianapolis made $7.7 billionin adjustments to intragovernmental accounts to force the accounts to agree with the records of ArmyWorking Capital Fund trading partners.
Statement of Net Cost. The Statement of Net Cost was not presented by responsibility segments that wereconsistent with DoD performance goals and measures. Accounting systems were unable to accuratelycapture costs for Army Working Capital Fund programs and properly account for intragovernmentaltransactions and related eliminations. In addition, some of the Army Working Capital Fund's financial datapresented on the Statement of Net Cost were based on budgetary transactions. DFAS Indianapolis made $1.1billion in unsupported adjustments to decrease intragovernmental costs and $1.2 billion in unsupportedadjustments to increase costs with the public in order to force buyer-side transaction data to agree with seller-side transaction data.
Statement of Financing. The Army cannot reconcile budgetary obligations to net cost without makingadjustments. The Statement of Financing was prepared on a combined basis, while the Statement of NetCost was prepared on a consolidated basis. As a result, the Army Working Capital Fund made $338.3million in unsupported adjustments to force the Statement of Financing to reconcile with information on theStatement of Net Cost.
Opinion Report

Wor
king
Cap
ital F
und
308
FY02
Con
solid
ated
Arm
y A
nnua
l Fin
anci
al S
tate
men
ts
Compliance with Laws and RegulationsManagement is responsible for compliance with existing laws and regulations related to financial reporting.Our work to determine compliance with selected provisions of the applicable laws and regulations waslimited because management acknowledged instances of noncompliance, and previously reported instancesof noncompliance continue to exist. Therefore, we did not determine whether the Army Working Capital Fund was in compliance with significant provisions of all applicable laws and regulations related to financialreporting. Our objective was not to express an opinion on compliance with applicable laws and regulations.
Statutory Financial Management Systems Reporting Requirements. The Army Working Capital Fund isrequired to comply with the following financial management systems reporting requirements.
The FFMIA requires DoD to establish and maintain financial management systems that comply substantiallywith the Federal financial management system requirements, applicable Federal accounting standards, andthe U.S. Government Standard General Ledger at the transaction level. In addition, the Federal Managers'Financial Integrity Act of 1982 requires DoD to evaluate its systems and to annually report whether thosesystems are in compliance with applicable requirements. The CFO Act of 1990 requires that each agencydevelop and maintain an integrated agency accounting and financial management system, including financialreporting and internal control. The system should comply with internal control standards, applicableaccounting principles, standards, and requirements, and provide complete, reliable, consistent, and timelyinformation.
The Assistant Secretary of the Army (Financial Management and Comptroller) acknowledged that many ofits critical financial management and feeder systems did not substantially comply with Federal financialmanagement systems requirements, Federal accounting standards, and the U.S. Government StandardGeneral Ledger at the transaction level. The Army was also unable to comply with the CFO Act, whichrequires agencies to develop and maintain integrated agency accounting and financial systems.
In an attempt to comply with statutory reporting requirements and applicable financial systems requirements,DoD plans to develop a DoD-wide financial management enterprise architecture. The architecture isintended to provide a "blueprint" of the Department's financial management systems and processes to initiatea comprehensive financial management reform effort. Until the architecture is developed, the Army WorkingCapital Fund will be unable to fully comply with the statutory reporting requirements. Therefore, we did notperform tests of compliance for these requirements.
Audit Disclosures The Assistant Secretary of the Army (Financial Management and Comptroller) acknowledged to us that theArmy and DFAS financial management systems could not provide adequate evidence supporting variousmaterial amounts on the financial statements. As a result, we were unable to obtain adequate evidentialmatter to form or express an opinion on the financial statements, internal control, and compliance with lawsand regulations.
Our review of internal control was limited to followup work on deficiencies identified in previous auditreports. We primarily focused on the deficiencies related to the material weaknesses reported in the audits of

309
fy02
the FY 2000 Army Working Capital Fund Financial Statements and the FY 2001 DoD Agency-WideFinancial Statements associated with the Army Working Capital Fund.
We performed limited tests of Army Working Capital Fund compliance with other laws and regulations thathave a direct and material effect on the financial statement information. We recognize that there wereadditional laws and regulations pertinent to the Army Working Capital Fund financial operations during FY2002. However, in accordance with Section 1008(d) of the FY 2002 National Defense Authorization Act, welimited our audit scope and only performed audit procedures required by generally accepted governmentauditing standards that were consistent with the representations made by the Assistant Secretary of the Army(Financial Management and Comptroller) in the engagement memorandum signed on August 21, 2002.Therefore, we did not perform tests of compliance for these requirements.
Anti-Deficiency Act.
Provisions Governing Claims of the United States Government.
Federal Credit Reform Act of 1990.
Pay and Allowance System for Civilian Employees.
Prompt Payment Act.
Opinion Report

Wor
king
Cap
ital F
und
310
FY02
Con
solid
ated
Arm
y A
nnua
l Fin
anci
al S
tate
men
ts

1. ASSETS (Note 2)A. Intragovernmental:
1. Fund Balance with Treasury (Note 3)2. Investments (Note 4)3. Accounts Receivable (Note 5)4. Other Assets (Note 6)5. Total Intragovernmental Assets
B. Cash and Other Monetary Assets (Note 7)C. Accounts Receivable (Note 5)D. Loans Receivable (Note 8)E. Inventory and Related Property (Note 9)F. General Property, Plant and Equipment (Note 10)G. Other Assets (Note 6)
2. TOTAL ASSETS
3. LIABILITIES (Note 11)A. Intragovernmental:
1. Accounts Payable (Note 12)2. Debt (Note 13)3. Environmental Liabilities (Note 14)4. Other Liabilities (Notes 15 and 16)5. Total Intragovernmental Liabilities
B. Accounts Payable (Note 12)C. Military Retirement Benefits and Other Employment-
Related Actuarial Liabilities (Note 17)D. Environmental Liabilities (Note 14)E. Loan Guarantee Liability (Note 8)F. Other Liabilities (Notes 15 and 16)
4. TOTAL LIABILITIES
5. NET POSITIONA. Unexpended Appropriations (Note 18)B. Cumulative Results of Operations
6. TOTAL NET POSITION
7. TOTAL LIABILITIES AND NET POSITION
See Note 1 and Note 2.
Consolidated Balance Sheet
The accompanying notes are an integral part of these statements.
311
fy02
Department of Defense • Department of the Army As of September 30, 2002 and 2001 ($ in thousands)
FY 2001
$2,537,990 2,255,539
476,541 0
$5,270,070 $3,990
1,028,288 0
54,719 34,818,281
16,190
$41,191,538
$92,727 30,512
01,167,318
$1,290,557 $505,328
000
576,523
$2,372,408
$1,214,901 37,604,229
$38,819,130
$41,191,538
FY 2002
$2,543,957 2,269,086
528,149 0
$5,341,192 $817
922,931 0
63,139 36,873,953
77
$43,202,109
$83,814 24,667
01,146,944
$1,255,425 $595,952
000
590,776
$2,442,153
$1,064,864 39,695,092
$40,759,956
$43,202,109

1. Program CostsA. Intragovernmental Gross CostsB. (Less: Intragovernmental Earned Revenue)C. Intragovernmental Net CostsD. Gross Costs With the PublicE. (Less: Earned Revenue From the Public)F. Net Costs With the PublicG. Total Net Cost
2. Cost Not Assigned to Programs
3. (Less:Earned Revenue Not Attributable to Programs)
4. Net Cost of Operations
See Note 1 and Note 19.
Civ
il W
orks
Fun
dFY
02 U
nite
d S
tate
s A
rmy
Ann
ual F
inan
cial
Sta
tem
ent
312
Consolidated Statement of Net CostT
he a
ccom
pany
ing
note
s ar
e an
inte
gral
par
t of t
hese
sta
tem
ents
.
Department of Defense • Department of the Army For the years ended September 30, 2002 and 2001 ($ in thousands)
FY 2001
$1,105,529 (483,102)$622,427
$3,768,681 (102,129)
$3,666,552 $4,288,979
$0
0
$4,288,979.00
FY 2002
$786,630 (616,437)$170,193
$3,645,278 (121,740)
$3,523,538 $3,693,731
$0
0
$3,693,731.00

Consolidated Statement of Changes in Net Position
The accompanying notes are an integral part of these statements.
313
fy02
Department of Defense • Department of the Army For the years ended September 30, 2002 and 2001 ($ in thousands)
CUMULATIVE RESULTS OF OPERATIONS
Beginning Balances
Prior period adjustments (+/-)
Beginning Balances, as adjusted
Budgetary Financing Sources:Appropriations receivedAppropriations transferred-in/out (+/-)Other adjustments (rescissions, etc) (+/-)Appropriations usedNonexchange revenueDonations and forfeitures of cash and cash
equivalentsTransfers-in/out without reimbursement (+/-)Other budgetary financing sources (+/-)
Other Financing Sources:Donations and forfeitures of propertyTransfers-in/out without reimbursement (+/-)Imputed financing from costs absorbed by
othersOther (+/-)
Total Financing Sources
Net Cost of Operations (+/-)
Ending Balances
See Note 1 and Note 20.
2002 UnexpendedAppropriations
$1,214,901
0
$1,214,901
4,324,965 198,408
(153,374)(4,520,036)
000
0
000
0
($150,037)
0
$1,064,864
FY 2001
$36,999,464
(846,130)
$36,153,334
000
4,310,085 919,800
0(445,585)
(8,859)
275 752,563 211,595
0
$5,739,874
4,288,979
$37,604,229
2001 UnexpendedAppropriations
$1,004,640
0
$1,004,640
210,262 000000
0
000
0
$210,262
0
$1,214,902
FY 2002
$37,604,229
0
$37,604,229
000
4,704,846 835,997
0(706,651)
(3,166)
303 744,279 208,986
0
$5,784,594
3,693,731
$39,695,092

Civ
il W
orks
Fun
dFY
02 U
nite
d S
tate
s A
rmy
Ann
ual F
inan
cial
Sta
tem
ent
314
Combined Statement of Budgetary ResourcesT
he a
ccom
pany
ing
note
s ar
e an
inte
gral
par
t of t
hese
sta
tem
ents
.
Department of Defense • Department of the Army For the years ended September 30, 2002 and 2001 ($ in thousands)
Budgetary Resources:A. Budget Authority:
Appropriations receivedBorrowing authorityContract authorityNet transfers (+/-)Other
B. Unobligated balance:Beginning of periodNet transfers, actual (+/-)Anticipated Transfers Balances
C. Spending authority from offsetting collections:Earned
CollectedReceivable from Federal sources
Change in unfilled customer ordersAdvance receivedWithout advance from Federal sources
Anticipated for the rest of year, without advancesTransfers from trust fundsSubtotal
D. Recoveries of prior year obligationsE. Temporarily not available pursuant to Public LawF Permanently not availableG Total Budgetary Resources
Status of Budgetary Resources:H. Obligations incurred:
DirectReimbursableSubtotal
I. Unobligated balance:ApportionedExempt from apportionmentOther available
J. Unobligated Balances Not AvailableK. Total, Status of Budgetary Resources
Relationship of Obligations to Outlays:L. Obligated Balance, Net - beginning of periodM. Obligated Balance transferred, net (+/-)N. Obligated Balance, Net - end of period:
Accounts receivableUnfilled customer order from Federal sourcesUndelivered ordersAccounts payable
O. Outlays:DisbursementsCollectionsSubtotal
P. Less: Offsetting receiptsQ. Net Outlays
See Note 1 and Note 21.
FY 2001
$3,974,001 00
1,544,283 0
1,638,978 (491)
000
4,216,800 56,628
034
231,286 00
$4,504,748 00
(17,545)$11,643,974.00
$8,478,611 1,120,752
$9,599,363
1,435,403 608,718
1 489
$11,643,974
$797,587 0
(262,026)(1,257,500)1,492,092
771,210
9,365,262 (4,216,835)$5,148,427
0$5,148,427
FY 2002
$4,324,965 00
1,006,223 0
1,713,303 (23,140)
000
4,837,613 (53,523)
037,345
115,628 00
$4,937,063 00
(16,515)$11,941,899.00
$5,415,360 4,785,522
$10,200,882
1,246,051 494,957
09
$11,941,899
$1,097,971 0
(235,443)(1,373,128)
1,475,183 1,180,711
10,189,428 (4,874,959)$5,314,469
(819,255)$4,495,214

Combined Statement of Financing
The accompanying notes are an integral part of these statements.
315
fy02
Department of Defense • Department of the Army For the years ended September 30, 2002 and 2001 ($ in thousands)
2002 Combined
$10,200,882
(4,937,063)$5,263,819
(819,255)$4,444,564
305 1,171
208,986 16,743
$227,205
$4,671,769
(2,705)152,974
0
819255
(2,461,629)
0 0
($1,492,105)
$3,179,664
2001 Combined
$9,599,363
(4,504,749)$5,094,614
(43,761)$5,050,853
275 1,735
211,595 (26,044)$187,561
$5,238,414
(281,946)231,321
(169,635)
0
(1,540,367)
0 (390,870)
($2,151,497)
$3,086,917
Resources Used to Finance Activities:
Budgetary Resources Obligated1. Obligations incurred2. Less: Spending authority from offsetting collections and
recoveries (-)3. Obligations net of offsetting collections and recoveries4. Less: Offsetting receipts (-)5. Net obligations
Other Resources6. Donations and forfeitures of property7. Transfers in/out without reimbursement (+/-)8. Imputed financing from costs absorbed by others9. Other (+/-)10. Net other resources used to finance activities
11. Total resources used to finance activities
Resources Used to Finance Items not Part of the NetCost of Operations
12. Change in budgetary resources obligated for goods,services and benefits ordered but not yet providedUndelivered Orders (-)Unfilled Customer Orders
13. Resources that fund expenses recognized in prior periods14. Budgetary offsetting collections and receipts that do not
affect net cost of operations15. Resources that finance the acquisition of assets16. Other resources or adjustments to net obligated
resources that do not affect net cost of operationsLess: Trust or Special Fund Receipts Related to
Exchange in the Entity's Budget (-)Other (+/-)
17. Total resources used to finance items not part ofthe net cost of operations
18. Total resources used to finance the net cost ofoperations
See Note 1 and Note 22.
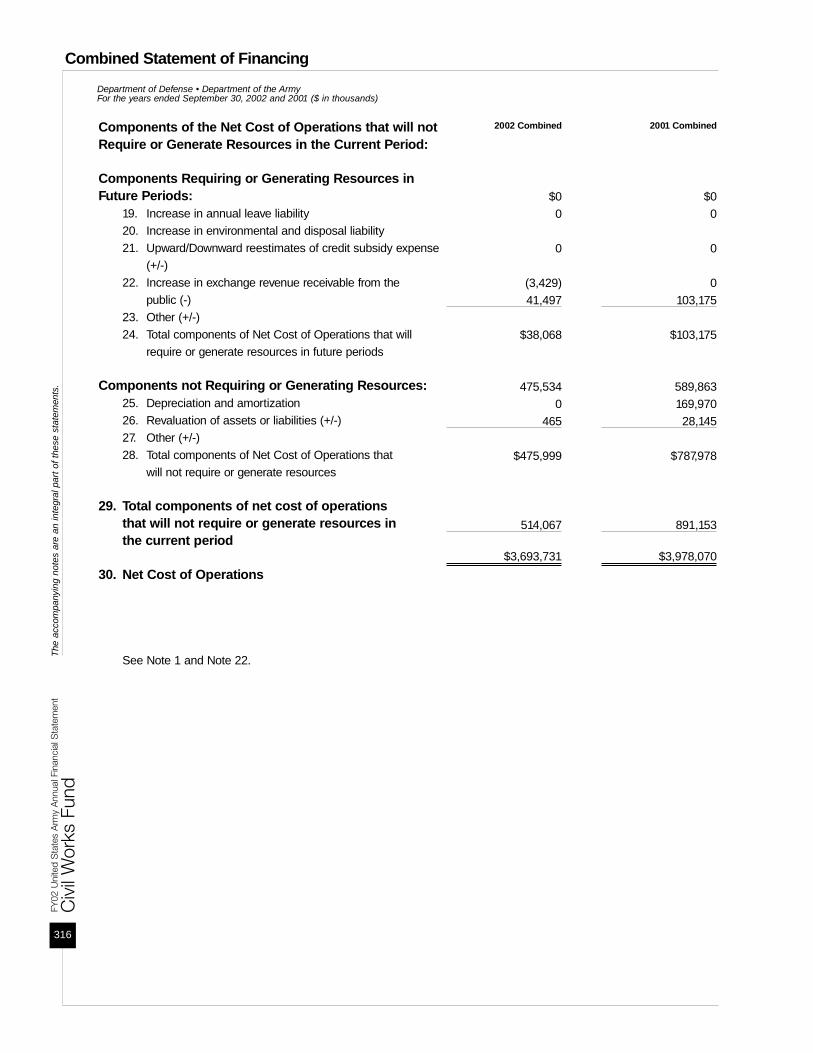
Civ
il W
orks
Fun
dFY
02 U
nite
d S
tate
s A
rmy
Ann
ual F
inan
cial
Sta
tem
ent
316
Combined Statement of FinancingT
he a
ccom
pany
ing
note
s ar
e an
inte
gral
par
t of t
hese
sta
tem
ents
.
Department of Defense • Department of the Army For the years ended September 30, 2002 and 2001 ($ in thousands)
2001 Combined
$00
0
0103,175
$103,175
589,863 169,970 28,145
$787,978
891,153
$3,978,070
2002 Combined
$00
0
(3,429)41,497
$38,068
475,534 0
465
$475,999
514,067
$3,693,731
Components of the Net Cost of Operations that will notRequire or Generate Resources in the Current Period:
Components Requiring or Generating Resources inFuture Periods:
19. Increase in annual leave liability20. Increase in environmental and disposal liability21. Upward/Downward reestimates of credit subsidy expense
(+/-)22. Increase in exchange revenue receivable from the
public (-)23. Other (+/-)24. Total components of Net Cost of Operations that will
require or generate resources in future periods
Components not Requiring or Generating Resources:25. Depreciation and amortization26. Revaluation of assets or liabilities (+/-)27. Other (+/-)28. Total components of Net Cost of Operations that
will not require or generate resources
29. Total components of net cost of operationsthat will not require or generate resources inthe current period
30. Net Cost of Operations
See Note 1 and Note 22.

317
fy02
Notes to the Principal Financial StatementsNote 1. Significant Accounting PoliciesA. Basis of Presentation
These financial statements have been prepared to report the financial position and results of operations of theU.S. Army Corps of Engineers Civil Works, as required by the Chief Financial Officers (CFO) Act of 1990,expanded by the Government Management Reform Act (GMRA) of 1994, and other appropriate legislation.The financial statements have been prepared from the books and records of the U.S. Army Corps ofEngineers (USACE) in accordance with the "Department of Defense Financial Management Regulation"("DoD FMR"), the Office of Management and Budget (OMB) Bulletin No. 01-09, "Form and Content ofAgency Financial Statements" and to the extent possible, generally accepted accounting principles (GAAP).The USACE's financial statements are in addition to the financial reports also prepared by the USACEpursuant to OMB directives that are used to monitor and control the USACE's use of budgetary resources.
The Corps of Engineers financial statements are prepared from the consolidation of general ledger financialdata reported from the Corps of Engineers Financial System (CEFMS) to the Corps of Engineers EnterpriseManagement Information System (CEEMIS).
General Ledger account balances have been validated to the year-end departmental budget execution andexpenditure reports. The Corps of Engineers Funds with Treasury balances have been adjusted to agree withTreasury's balances in accordance with Treasury policy.
A more detailed explanation of these financial statements elements is provided in the applicable footnote.
B. Mission of the Reporting EntitySome of the missions of the Corps of Engineers include maintaining navigation channels, reducing flooding,assisting during natural disasters and other emergencies and making waterways passable. The financialstatements are presented on the accrual basis of accounting as required by federal financial accountingstandards.
The asset accounts used to prepare the principal financial statements are categorized as entity/non-entity.Entity accounts consist of resources that the agency has the authority to use, or where management isobligated legally to use funds to meet entity obligations. Non-entity accounts are assets that are held by anentity but are not available for use in the operations of the entity.
The Corps of Engineers Civil Works Program receives Federal funding through annual Energy and WaterDevelopment Appropriations Acts. Program funding also is received from non-Federal project sponsors whoshare in project costs according to formulas established by project authorization acts. A third source offunding comes through the Support for Others Program, which is conducted under reimbursable agreementswith Federal agencies.

Civ
il W
orks
Fun
d
318
FY02
Uni
ted
Sta
tes
Arm
y A
nnua
l Fin
anci
al S
tate
men
t
Entity Accounts:
General Funds96X3112 Flood Control, Mississippi River and Tributaries96X3121 General Investigations96X3122 Construction, General96X3123 Operation and Maintenance, General963/73123 Operation and Maintenance, General (fiscal year)96X3124 General Expenses96953124 General Expenses (fiscal year)96X3125 Flood Control and Coastal Emergencies963/73125 Flood Control and Coastal Emergencies (fiscal year)96X3126 Regulatory Program96X3128 Washington Aqueduct Capital Improvements96003129 Payment to the South Dakota Terrestrial Wildlife Habitat Restoration Trust Fund 96X3130
FUSRAP
Revolving Funds96X4902 Revolving Fund
Special Funds96X5007 Special Recreation Use Fees96X5066 Hydraulic Mining in California, Debris96X5090 Payments to States, Flood Control Act of 195496X5125 Maintenance and Operation of Dams and Other Improvements of Navigable Waters96X5483 San Gabriel Basin Restoration Fund
Trust Funds96X8217 South Dakota Terrestrial Wildlife habitat Restoration Trust Fund96X8333 Coastal Wetlands Restoration Trust Fund96X8861 Inland Waterways Trust Fund96X8862 Rivers and Harbors Contributed and Advance Funds96X8868 Oil Spill Research
Transfer Funds96 12X1105 State and Private Forestry, Forest Service96 13X2050 Economic Development Administration96 14X1039 Construction National Park Service96 14X5035 Land Acquisition and State Assistance, National Park Service96 21X2020 OMA, American Samoa Projects96 89X4045 Bonneville Power Administration96 72 99/00 1021 Development Assistance, Agency for International Development96 69X8083 Federal Aid Highways

Non-Entity Accounts:
Deposit Funds96X6075 Withheld Allotment of Compensation for Payment of Employee Organization Dues96X6094 Advances from the District of Columbia96X6134 Amounts Withheld for Civilian Pay Allotments96X6145 Technical Assistance, United States Dollars Advanced from Foreign Government96X6302 Moneys Withheld from Contractors96X6500 Advances without Orders from Non-Federal Sources96X6501 Small Escrow Amounts96X6999 Accounts Payable, Check Issue Overdrafts
Clearing Accounts96F3875 Budget Clearing Account96F3880 Unavailable Check Cancellations and Overpayments96F3886 TSP
Receipt Accounts960891 Miscellaneous fees for regulatory and judicial services, not otherwise classified961099 Fines, Penalties, and forfeitures not otherwise classified961435 General Fund Proprietary Interest, Not Otherwise Classified963220 General Fund Proprietary Receipts. Not Otherwise Classified, All Other965007 Special Recreation Use Fees965066 Hydraulic Mining in California965090 Receipts from leases of lands acquired for flood control, navigation, and allied purposes965125 Licenses under Federal Power Act, Improvements of navigable water, maintenance and
operation of dams, etc., (50%)
C. Appropriations and Funds The Corps' appropriations and funds are divided into the general, working capital (revolving funds), trust,special and deposit funds. These appropriations and funds are used to fund and report how the resourceshave been used in the course of executing the Corps' missions.
The Civil Works Program receives Federal funding through annual Energy and Water DevelopmentAppropriations Acts. Program funding also comes from non-Federal project sponsors who share in projectcosts according to formulas established by project authorization acts. A third source of funding comesthrough the Support for Others Program, which is conducted under reimbursable agreements with Federalagencies.
In 1997, the Corps received borrowing authority from the Treasury for the next three years (1997 through1999) to finance capital improvements to the Washington Aqueduct. Appropriation 96X3128 was establishedto record financial transactions for these capital improvements.
Notes to Principal Statements
319
fy02

Civ
il W
orks
Fun
d
320
FY02
Uni
ted
Sta
tes
Arm
y A
nnua
l Fin
anci
al S
tate
men
t
General funds are used for financial transactions arising under congressional appropriations, includingpersonnel, operation and maintenance, research and development, procurement, and construction accounts.
Trust funds represent the receipt and expenditure of funds held in trust by the government for use in carryingout specific purposes or programs in accordance with the terms of the donor, trust agreement, or statute.
Special funds account for receipts of the government that are earmarked for a specific purpose.Deposit funds generally are used to (1) hold assets for which the Corps is acting as an agent or a custodian orwhose distribution awaits legal determination, or (2) account for unidentified remittances.
D. Basis of AccountingThe Corps' transactions generally are recorded on an accrual accounting basis and a budgetary basis as isrequired by GAAP. Under the accrual method, revenues are recognized when earned and expenses arerecognized when a liability is incurred without regard to receipt or payment of cash. Budgetary accounting isaccomplished through unique general ledger accounts to facilitate compliance with legal and internal controlrequirements associated with the use of federal funds.
During fiscal year 1998, the Corps completed the deployment of the Corps of Engineers FinancialManagement System (CEFMS) to all its divisions, districts, centers, laboratories and field offices. CEFMS isa fully automated, comprehensive financial management system that simplifies the management of allaspects of the Corps business, including civil, military revolving funds and reimbursable activity. Thegeneral ledger chart of accounts in CEFMS was modified during fiscal year 2001 to be in compliance withthe United States Government Standard General Ledger.
In addition, the Corps identified programs based upon the major appropriation groups provided by Congress.
E. Revenues and Other Financing SourcesFinancing sources for general funds are provided primarily through congressional appropriations that arereceived on both an annual and a multiyear basis. When authorized, these appropriations are supplementedby revenues generated by sales of goods or services through a reimbursable order process. The Corpsrecognizes revenue as a result of costs incurred or services performed on behalf of other federal agencies andthe public. Revenue is recognized when earned under the reimbursable order process.
F. Recognition of ExpensesFor financial reporting purposes, the DoD policy requires the recognition of operating expenses in the periodincurred. Expenditures for capital and other long-term assets are not recognized as expenses in the Corpsoperations until depreciated in the case of PP&E or consumed in the case of OM&S. Net increases ordecreases in unexpended appropriations are recognized as a change in the net position.
Certain expenses, such as annual and military leave earned but not taken, are financed in the period whenearned.
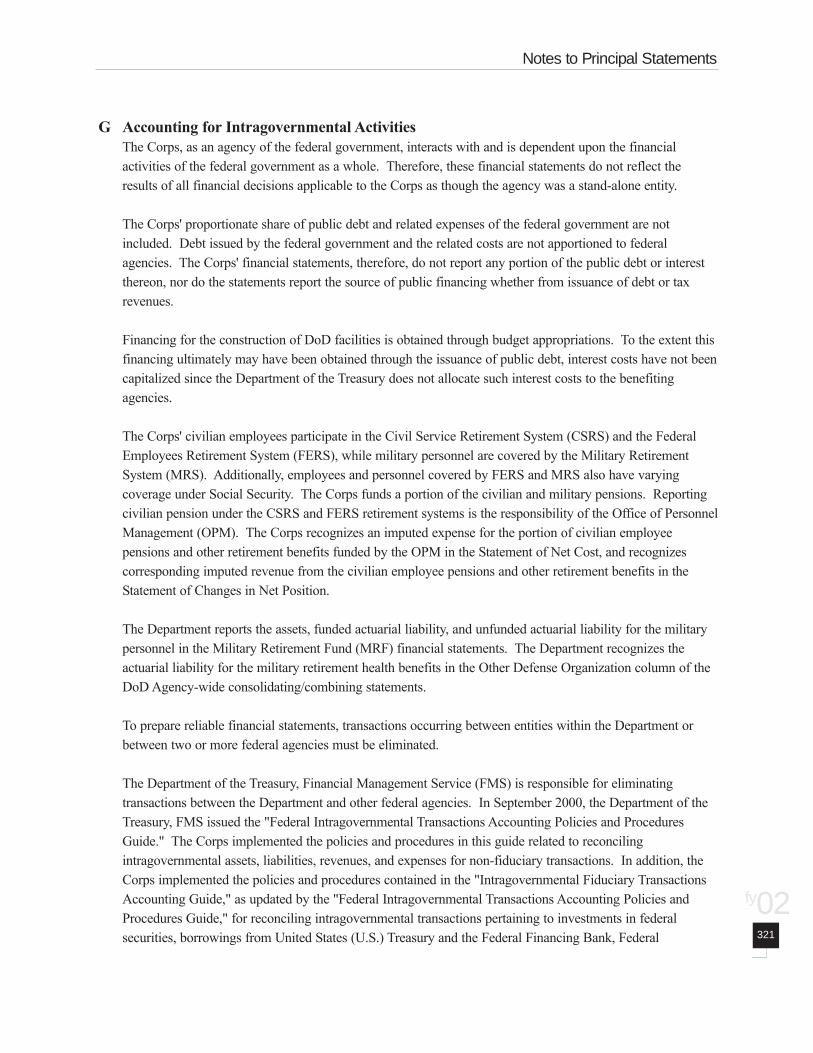
G Accounting for Intragovernmental ActivitiesThe Corps, as an agency of the federal government, interacts with and is dependent upon the financialactivities of the federal government as a whole. Therefore, these financial statements do not reflect theresults of all financial decisions applicable to the Corps as though the agency was a stand-alone entity.
The Corps' proportionate share of public debt and related expenses of the federal government are notincluded. Debt issued by the federal government and the related costs are not apportioned to federalagencies. The Corps' financial statements, therefore, do not report any portion of the public debt or interestthereon, nor do the statements report the source of public financing whether from issuance of debt or taxrevenues.
Financing for the construction of DoD facilities is obtained through budget appropriations. To the extent thisfinancing ultimately may have been obtained through the issuance of public debt, interest costs have not beencapitalized since the Department of the Treasury does not allocate such interest costs to the benefitingagencies.
The Corps' civilian employees participate in the Civil Service Retirement System (CSRS) and the FederalEmployees Retirement System (FERS), while military personnel are covered by the Military RetirementSystem (MRS). Additionally, employees and personnel covered by FERS and MRS also have varyingcoverage under Social Security. The Corps funds a portion of the civilian and military pensions. Reportingcivilian pension under the CSRS and FERS retirement systems is the responsibility of the Office of PersonnelManagement (OPM). The Corps recognizes an imputed expense for the portion of civilian employeepensions and other retirement benefits funded by the OPM in the Statement of Net Cost, and recognizescorresponding imputed revenue from the civilian employee pensions and other retirement benefits in theStatement of Changes in Net Position.
The Department reports the assets, funded actuarial liability, and unfunded actuarial liability for the militarypersonnel in the Military Retirement Fund (MRF) financial statements. The Department recognizes theactuarial liability for the military retirement health benefits in the Other Defense Organization column of theDoD Agency-wide consolidating/combining statements.
To prepare reliable financial statements, transactions occurring between entities within the Department orbetween two or more federal agencies must be eliminated.
The Department of the Treasury, Financial Management Service (FMS) is responsible for eliminatingtransactions between the Department and other federal agencies. In September 2000, the Department of theTreasury, FMS issued the "Federal Intragovernmental Transactions Accounting Policies and ProceduresGuide." The Corps implemented the policies and procedures in this guide related to reconcilingintragovernmental assets, liabilities, revenues, and expenses for non-fiduciary transactions. In addition, theCorps implemented the policies and procedures contained in the "Intragovernmental Fiduciary TransactionsAccounting Guide," as updated by the "Federal Intragovernmental Transactions Accounting Policies andProcedures Guide," for reconciling intragovernmental transactions pertaining to investments in federalsecurities, borrowings from United States (U.S.) Treasury and the Federal Financing Bank, Federal
Notes to Principal Statements
321
fy02

Civ
il W
orks
Fun
d
322
FY02
Uni
ted
Sta
tes
Arm
y A
nnua
l Fin
anci
al S
tate
men
t
Employees' Compensation Act transactions with the Department of Labor (DoL), and benefit programtransactions with the OPM.
H. Transactions with Foreign Governments and International OrganizationsEach year, the DoD Components sell defense articles and services to foreign governments and internationalorganizations, primarily under the provision of the "Arms Export Control Act of 1976." Under the provisionof the Act, the Department has authority to sell defense articles and services to foreign countries andinternational organizations, generally at no profit or loss to the U.S. Government. Customers may berequired to make payments in advance.
I. Funds with the U.S. Treasury The Corps' financial resources are maintained in U.S. Treasury accounts. The majority of cash collections,disbursements, and adjustments are processed worldwide at the Defense Finance and Accounting Service(DFAS), Military Services and the U.S. Army Corps of Engineers (USACE) disbursing stations, as well asthe Department of State financial service centers. Each disbursing station prepares monthly reports, whichprovide information to the U.S. Treasury on check issues, electronic transfers, interagency transfers anddeposits.
In addition, the DFAS centers and the USACE Finance Center submit reports to the Department of theTreasury, by appropriation, on interagency transfers, collections received and disbursements issued. TheDepartment of the Treasury then records this information to the applicable Fund Balance with Treasury(FBWT) account maintained in the Treasury's system. Differences between the Corps’ recorded balance inthe FBWT accounts and Treasury's FBWT accounts sometimes result and are reconciled subsequently.Material disclosures are provided at note 3. Differences between accounting offices' detail-level records andTreasury's FBWT accounts are disclosed in Note 21.B, specifically, differences caused by in-transitdisbursements and unmatched disbursements (which are not recorded in the accounting offices' detail-levelrecords).
J. Foreign CurrencyThe Corps conducts operations overseas. Foreign Currency fluctuations require adjustment to the originalobligation amount at the time of payment. These currency fluctuations are not identified separately.
K. Accounts ReceivableAs presented in the Balance Sheet statement, accounts receivable includes accounts, claims, and refundsreceivable from other federal entities or from the public. Allowances for uncollectible accounts due from thepublic are based upon analysis of collection experience by fund type. The Department does not recognize anallowance for estimated uncollectible amounts from other federal agencies. Claims against other federalagencies are to be resolved between the agencies. Material disclosures are provided at note 5.
L. Loans Receivable As ApplicableNot applicable

M. Inventories and Related PropertyInventories are reported at approximate historical cost based on a moving weighted average based on actualcost divided by quantity. A perpetual record of inventory is maintained to allow for recomputation of theaverage unit cost as new receipts are recorded.
The related property portion of the amount reported on the Inventory and Related Property line includesoperating materials and supplies (OM&S) and stockpile materials. The OM&S are valued at standardpurchase price. For the most part, the Department is using the consumption method of accounting forOM&S, as defined in the SFFAS No. 3, "Accounting for Inventory and Related Property" as material that hasnot been issued to the end user. Once OM&S is issued, the material is expensed. Material disclosuresrelated to inventory and related property are provided at Note 9.
N. Investments in U.S. Treasury SecuritiesInvestments in U.S. Government securities are reported at cost, net of unamortized premiums or discounts.Premiums or discounts are amortized into interest income over the term of the investment using the effectiveinterest rate method or other method if similar results are obtained. The Corps' intent is to hold investmentsto maturity, unless they are needed to finance claims or otherwise sustain operations. Consequently, aprovision is not made for unrealized gains or losses on these securities, because in the majority of cases, theyare held to maturity. Amounts reported reflect the value of investments in the South Dakota TerrestrialWildlife Habitat Restoration, Inland Waterways and Harbor Maintenance Trust Fund accounts, which aremanaged by the Treasury Department. Material disclosures are provided at Note 4.
O. General Property, Plant and EquipmentGeneral property, plant, and equipment (PP&E) assets are capitalized at historical acquisition cost pluscapitalized improvements when an asset has a useful life of 2 or more years, and when the acquisition costequals 1$ for real property and $25,000 for personal property. There has been much discussion in the pastthat the Corps of Engineers Civil Works should follow the DoD threshold of $100,000. Civil Works hasjustified its threshold amounts by explaining its policy is in line with Federal Energy Regulatory Commissionguidance and the negative impacts the increased threshold would cause its program. These impacts includethe effect of accelerating amortization expenses on customer rates and the fact that the lower thresholdamounts are in line with Government agencies with similar missions (Department of Interior, Department ofAgriculture, Environmental Protection Agency). Presently, DoD is considering the Corps of Engineersrequest for the Civil Works amounts to remain status quo.
All General PP&E, other than land, is depreciated on a straight-line basis. Land is not depreciated.
When it is in the best interest of the government, the Corps provides to contractors government propertynecessary to complete contract work. Such property is either owned or leased by the Corps, or purchaseddirectly by the contractor for the government based on contract terms. When the value of contractorprocured General PP&E exceeds the DoD capitalization threshold, such PP&E should be included in thevalue of General PP&E reported on the Corps' Balance Sheet. The Department completed a study thatindicates that the value of General PP&E above the DoD capitalization threshold and not older than the DoDStandard Recovery Periods for depreciation, and that is presently in the possession of contractors, is not
Notes to Principal Statements
323
fy02

Civ
il W
orks
Fun
d
324
FY02
Uni
ted
Sta
tes
Arm
y A
nnua
l Fin
anci
al S
tate
men
t
material to the Department's financial statements. Regardless, the Department is developing new policiesand a contractor reporting process that will provide appropriate General PP&E information for futurefinancial statement reporting purposes. Accordingly, the Corps currently reports only government property inthe possession of contractors that is maintained in the Corps property systems.
To bring the Corps into compliance with federal accounting standards, the Department has issued newproperty accountability and reporting regulations that require the DoD Components to maintain, in DoDComponent property systems, information on all property furnished to contractors. This action and otherDoD proposed actions are structured to capture and report the information necessary for compliance withfederal accounting standards.
Material disclosures are provided at Note 10.
P. Advances and PrepaymentsPayments in advance of the receipt of goods and services are recorded as advances or prepayments andreported as an asset on the Balance Sheet. Advances and prepayments are recognized as expenditures andexpenses when the related goods and services are received.
Q. LeasesGenerally, lease payments are for the rental of equipment, space, and operating facilities and are classified aseither capital or operating leases. When a lease is essentially equivalent to an installment purchase ofproperty (a capital lease) and the value equals or exceeds the current DoD capitalization threshold, theapplicable asset and liability are recorded. The amount recorded is the lesser of the present value of therental and other lease payments during the lease term, excluding that portion of the payments representingexecutory costs paid to the lessor, or the asset's fair value. Leases that do not transfer substantially all of thebenefits or risks of ownership are classified as operating leases and recorded as expenses as payments aremade over the lease terms.
R. Other Assets The Corps conducts business with commercial contractors under two primary types of contracts-fixed priceand cost reimbursable. To alleviate the potential financial burden on the contractor that long-term contractscan cause, the Corps provides financing payments. One type of financing payment that the Corps makes forreal property is based upon a percentage of completion. In accordance with the SFFAS No. 1, "Accountingfor Selected Assets and Liabilities," such payments are treated as construction in process and are reported onthe General PP&E line and in note 10, General PP&E, Net. In addition, based on the provision of theFederal Acquisition Regulation, the Corps makes financing payments under fixed price contracts that are notbased on a percentage of completion. The Corps reports these financing payments as advances orprepayments in the "Other Assets" line item. The Corps treats these payments as advances or prepaymentsbecause the Corps becomes liable only after the contractor delivers the goods in conformance with thecontract terms. If the contractor does not deliver a satisfactory product, the Corps is not obligated toreimburse the contractor for its costs and the contractor is liable to repay the Corps for the full amount of theadvance.

S. Contingencies and Other Liabilities The SFFAS No. 5, "Accounting for Liabilities of the Federal Government," defines a contingency as anexisting condition, situation, or set of circumstances that involves an uncertainty as to possible gain or loss tothe Corps. The uncertainty will be resolved when one or more future events occur or fail to occur. Acontingency is recognized as a liability when a past event or exchange transaction has occurred, a future lossis probable and the amount of loss can be reasonably estimated. Financial statement reporting is limited todisclosure when conditions for liability recognition do not exist, but there is at least a reasonable possibilitythat a loss or additional loss will be incurred. Examples of loss contingencies include the collectibility ofreceivables, pending or threatened litigation, possible claims and assessments. The Corps' loss contingenciesarising as a result of pending or threatened litigation or claims and assessments occur due to events such asship and vehicle accidents, property or environmental damages, and contract disputes.
T. Accrued LeaveCivilian annual leave and military leave are accrued as earned and the accrued amounts are reduced as leaveis taken. The balances for annual and military leave at the end of the fiscal year reflect current pay rates forthe leave that is earned, but not taken.
U. Net PositionNet Position consists of unexpended appropriations and cumulative results of operations. Unexpendedappropriations represent amounts of authority which are unobligated and have not been rescinded orwithdrawn, and amounts obligated, but for which legal liabilities for payments have not been incurred.
Cumulative results of operations represent the difference, since inception of an activity, between expensesand losses and financing sources including appropriations, revenue, and gains. Beginning with FY 1998, thisincluded the cumulative amount of donations and transfers of assets in and out without reimbursement.
V. Treaties for Use of Foreign Bases The Corps has no existing treaties for use of foreign bases.
W. Comparative Data Beginning in FY 2001, the U.S. Army Corps of Engineers will present the current and previous year'sfinancial data for comparative purposes. This data will be presented in the financial statements, as well as inthe notes to the principal statements.
In FY 2002, the Corps modified the financial statement presentation for the Statements of Net Cost, Changesin Net Position, and Financing. As a result, the Corps statements during this reporting period may not lendthemselves to comparative analysis. In some instances, amounts on the statements were reported on onefinancial line in FY 2001 and split into multiple financial lines for FY 2002, in accordance with OMB'sguidance.
X. Unexpended ObligationsThe Corps records obligations for goods and services that have been ordered but not yet received. No liabilityfor payment has been established in the financial statements because goods/services have yet to be delivered.
Notes to Principal Statements
325
fy02

Civ
il W
orks
Fun
d
326
FY02
Uni
ted
Sta
tes
Arm
y A
nnua
l Fin
anci
al S
tate
men
t
Note 2. Nonentity and Entity AssetsAs of September 30,(Amounts in thousands) 2002 2001
1. Intragovernmental Assets: Nonentity Entity Total
A. Fund Balance with Treasury $41,280 $2,502,677 $2,543,957 $2,537,990 B. Investments 0 2,269,086 2,269,086 2,255,539 C. Accounts Receivable 0 528,150 528,150 476,540 D. Other Assets 0 0 0 0 E. Total Intragovernmental Assets $41,280 $5,299,913 $5,341,193 $5,270,069
2. Non-Federal Assets:A. Cash and Other Monetary Assets $817 $0 $ 817 $3,990 B. Accounts Receivable 915,452 7,479 922,931 1,028,288 C. Loans Receivable 0 0 0 0 D. Inventory & Related Property 0 63,139 63,139 54,719 E. General Property, Plant and Equipment 0 36,873,952 36,873,952 34,818,280 F. Other Assets 0 77 77 16,190 G. Total Non-Federal Assets $916,269 $36,944,647 $37,860,916 $35,921,467
3. Total Assets: $957,549 $42,244,560 $43,202,109 $41,191,536
4. Other Information:
Assets are categorized as:Entity assets consist of resources that the Corps has the authority to use, or where management is obligatedlegally to use funds to meet entity obligations.
Nonentity assets are assets held by an entity, but are not available for use in the operations of the entity.
Composition of Other Nonentity AssetsNon-federal nonentity accounts receivable represents all current and noncurrent receivables due from non-federal sources, net of an allowance for estimated uncollectible accounts. Other nonentity receivablesinclude $860 million in long-term receivables due from state and local municipalities for water storagecontracts, $13.2 million in current receivables due from state and local municipalities for water storage, $12.5million in accrued interest receivable with the water storage contracts, $8.2 million in claims receivable and$1.7 million in long-term receivable for hydraulic mining. The additional $ .7 million represents amountsdue from the leasing of land acquired for flood control purposes. The allowance for doubtful accounts totals$ .7 million.
Federal Non-Entity Fund Balance with Treasury consists of amounts collected into deposit, suspense andbudget clearing accounts.
Note ReferenceFor Additional Line Item discussion, see

Note 3, Fund Balance with TreasuryNote 4, InvestmentsNote 5, Accounts ReceivableNote 6, Other Assets
Note 3. Fund Balance with TreasuryAs of September 30,(Amounts in thousands) 2002 2001
1. Fund Balances:A. Appropriated Funds $1,177,287 $1,351,271B. Revolving Funds 902,533 849,577C. Trust Funds 59,954 11,129D. Other Fund Types 404,183 326,013E. Total Fund Balances $2,543,957 $2,537,990
2. Fund Balances Per Treasury Versus Agency:A. Fund Balance per Treasury $2,484,784 $2,532,474B. Fund Balance per 2,543,957 2,537,990C. Reconciling Amount ($59,173) ($5,516)
3. Explanation of Reconciliation Amount:
Reconciling AmountFund Balance per USACE includes $6.3 million and $53.1 million cash reported by Treasury for InlandWaterways and Harbor Maintenance Trust Funds, for which the Corps is identified as the lead agency forreporting.
Fund Balance per Treasury includes funds available in appropriation 96X6094 in the amount of $20.7million. This account was established to record operating costs at the Washington Aqueduct which arereimbursed by local municipalities. Since funding is used in operations, the balance is included with entityassets. The amount reported is $.4 million greater than the Treasury's balance due to an unreconcileddifference between Washington Aqueduct and Treasury.
4. Other Information:Fund Balance per USACE includes $40 million in transfer appropriations that were not reported by the Corpson the FMS 2108. Those transfer appropriations are reported by the parent agencies on the FMS 2108. Theparent agencies are Department of Energy, Department of Transportation, and Department of Commerce.According to the Treasury Financial Manual, Part 2, Chapter 4000, Federal Agencies' Centralized Trial-Balance System, paragraph 4630.60, if an allocation transfer is material to the child's financial statements,the child should report the activity relating to the allocation in all of its financial statements, except theStatement of Budgetary Resources. The Corps has determined that these balances are material and haveincluded them in all of our financial statements except the Statement of Budgetary Resources.
Notes to Principal Statements
327
fy02

Civ
il W
orks
Fun
d
328
FY02
Uni
ted
Sta
tes
Arm
y A
nnua
l Fin
anci
al S
tate
men
t
Other Fund Types consists of $20.6 million in deposit, suspense and clearing accounts that are not availableto finance the Corps' activities, $.8 million in borrowing authority, $363 million in contributed funds and$(.7) million in Disbursing Officer's Cash transactions. The $20.7 million in the suspense accountestablished to finance Washington Aqueduct operations is included also in this balance.
Note ReferenceSee Note Disclosure 1.I. - Significant Accounting Policies for additional discussion on financial reportingrequirements and DoD policies governing Funds with the U.S. Treasury.
Note 4. InvestmentsAs of September 30,(Amounts in thousands) 2002 2001
Amor- Amortized Marketzation (Premium/ Investments, Value Investments,
1. Intragovernmental Securities: Cost Method Discount) Net Disclosure Net
A. Marketable $0 $0 $0 $0 $0B. Non-Marketable, Par Value 0 0 0 0 0C. Non-Marketable, Market-Based 2,289,045 (24,594) 2,264,451 2,264,452 2,250,847D. Subtotal $2,289,045 ($24,594) $2,264,451 $2,264,452 $2,250,847E. Accrued Interest $4,635 - 4,635 $4,635 4,693F. Total Intragovernmental Securities $2,293,6807 ($24,594) $2,269,086 $2,269,087 $2,255,540
2. Other Investments: $0 $0 $0 $0 $0
3. Other Information:Investments for the Inland Waterways, Harbor Maintenance, and South Dakota Terrestrial Wildlife HabitatRestoration Trust Funds are reported by the Treasury and included in U.S. Army Corps of Engineers'Financial Statements. Investment amounts include $406 million in Inland Waterways, $1,821 million inHarbor Maintenance and $42 million in the South Dakota Terrestrial Wildlife account.
It is the intent to hold investments until maturity unless they are needed to sustain operations. Provisions arenot made for unrealized gains or losses on these securities. The Trust Funds use the same method thatconforms to the prevailing practice in the financial community to determine the amortized book value ofinvestments currently held and the related effective interest yield on investments. These calculated yieldsagree with yields published in the security tables of U.S. Treasury securities.
These types of investments are recorded at cost, net of unamortized premiums or discounts. Premiums ordiscounts are amortized into interest income over the term of the investment. Investment decisions for thesefunds are made by the managing entity, in this case the Department of the Treasury. ·
Note ReferenceSee Note Disclosure 1.N. - Investments in U.S. Treasury for additional DoD policies governing Investmentsin U.S. Treasury Securities.

Note 5. Accounts ReceivableAs of September 30,(Amounts in thousands) 2002 2001
Gross Allowance For Accounts AccountsAmount Due Estimated Collectibles Receivable, Net Receivable, Net
1. Intragovernmental Receivables: $528,149 N/A $528,149 $476,540
2. Non-Federal Receivables(From the Public): 925,395 ($2,464) 922,931 1,028,288
3. Total Accounts Receivable: $1,453,544 ($2,464) $1,451,080 $1,504,828
4. Allowance method:Allowance MethodThe method of calculating the allowance for estimated uncollectibles is based on the cumulative balance ofdelinquent public receivables aged in accordance with current USACE policy. The calculation wasperformed automatically in the Corps of Engineers Financial Management System as part of the year-endclosing process. The Code of Federal Regulations (4CFR 101) prohibits the write-off of receivables fromanother federal agency. As such, no allowance for estimated uncollectible amounts is recognized for thesereceivables.
5. Other information:
Intragovernmental Account Receivable AdjustmentsElimination AdjustmentsThe Corps was able to compare its accounts receivable balances with the accounts payable balances of itsintragovernmental trading partners. No material differences were identified.
Intragovernmental Receivables Over 180 DaysThe amount of intragovernmental receivables over 180 days old is $24 million. No intragovernmentalreceivables have been submitted to the General Accounting Office for opinion.
Public Receivables Over 180 DaysThe amount of public receivables over 180 days old is $38 million. Receivables with the public include $1.6million in accrued interest on delinquent receivables.
Non-federal Refunds ReceivableThe amount of public receivables includes $1.5 million in refunds receivable.
Other DisclosuresPublic receivables include $20 million in current and $860 million in long-term accounts receivableassociated with water storage contracts.
The amount of Public Receivables on the Treasury Report on Receivables Due From the Public is $2.5million greater than the balance of public receivables reflected on the balance sheet. The difference is
Notes to Principal Statements
329
fy02

Civ
il W
orks
Fun
d
330
FY02
Uni
ted
Sta
tes
Arm
y A
nnua
l Fin
anci
al S
tate
men
t
attributed to the allowance for estimated uncollectibles not included on the Treasury report.
Intragovernmental receivables increased due primarily to an increase of $37.2 million in the receivable fortransfers of currently invested balances for the trust funds. The trust fund receivable includes $304 millionfor the Coastal Wetlands Restoration Trust Fund and $18.5 million for the Inland Waterways Trust Fund. Toaccommodate cash management practices, funds will remain invested until needed for disbursement. Thebudget authority is realized and obligations may be incurred before the actual transfer of funds.
Note ReferenceSee Note Disclosure 1.K. - Significant Accounting Policies for additional discussion on financial reportingrequirements and DoD policies governing Accounts Receivable.
Note 6. Other Assetss of September 30,2002(Amounts in thousands) 2002 2001
1. Intragovernmental Other Assets:A. Advances and Prepayments $0 $0 B. Other Assets 0 0 C. Total Intragovernmental Other Assets $0 $0
2. Non-Federal Other Assets:A. Outstanding Contract Financing Payments $0 $0 B. Other Assets (With the Public) 77 16,190C. Total Non-Federal Other Assets $77 $16,190
3. Total Other Assets: $77 $16,190
4. Other Information:Other assets have been reclassified and reported as other property, plant and equipment..Note ReferenceSee Note Disclosure 1. R. - Significant Accounting Policies for additional discussion on financial reportingrequirements and DoD policies governing Other Assets.
Note 7. Cash and Other Monetary AssetsAs of September 30,(Amounts in thousands) 2002 2001
1. Cash $654 $6222. Foreign Currency (non-purchased) 163 3,3683. Other Monetary Assets 0 04. Total Cash, Foreign Currency, & Other
Monetary Assets $817 $3,990

5. Other Information:The decrease of $3.2 million reflects a correction to erroneous reporting in FY 2001, which included themilitary portion of foreign currency.
DefinitionsCash - consists of the total of cash resources under the control of the Corps, which includes coin, papercurrency, purchased foreign currency, negotiable instruments, and amounts on deposit in banks and otherfinancial institutions. Cash available for agency use should include petty cash funds and cash held inrevolving funds which will not be transferred into the U.S. Government General Fund.
Foreign Currency - consists of the total U.S. dollar equivalent of non-purchased foreign currencies held inforeign currency fund accounts. Non-purchased foreign currency is limited to the Treasury Index 97X7000fund account (formerly called FT accounts).
Other Monetary Assets - includes gold, special drawing rights, and U.S. Reserves in the InternationalMonetary Fund. This category is principally for use by the Department of the Treasury.
Other Corps DisclosuresCash consists solely of Disbursing Officers' Cash and reconciles to Note 15A Disbursing Officer's Cash. Itdiffers from the Statement of Accountability by $992.80 due to erroneous reporting of the Statement ofAccountability.
The Corps translates foreign currency to U.S. dollars utilizing the Department of the Treasury Prevailing Rateof Exchange. This rate is the most favorable rate that would be available legally to the U.S. Government'sacquisition of foreign currency for its official disbursements and accommodation of exchange transactions.
Note ReferenceSee Note Disclosure 1. J. - Significant Accounting Policies for additional discussion on financial reportingrequirements and DoD policies governing Foreign Currency.
Note 8. A. Direct Loan and/or Loan Guarantee Programs1. Direct Loan and/or Loan Guarantee Programs: The entity operates the following direct loan
and/or Loan guarantee program(s):
The Corps participates in Military Housing Privatization Initiatives only from our military funded accounts.Therefore, these Civil Works Financial Statements reflect no activity in this area.
Notes to Principal Statements
331
fy02

Civ
il W
orks
Fun
d
332
FY02
Uni
ted
Sta
tes
Arm
y A
nnua
l Fin
anci
al S
tate
men
t
Note 8.B. Direct Loans Obligated After FY 1991Not Applicable
Note 8.C. Total Amount of Direct Loans DisbursedNot Applicable
Note 8.D. Subsidy Expense for Post-1991 Direct LoansNot Applicable
Note 8.E. Subsidy Rate for Direct Loans Not Applicable
Note 8.F. Schedule for Reconciling Subsidy Cost Allowance Balances for Post-1991 Direct Loans
Not Applicable
Note 8.G. Defaulted Guaranteed Loans from Post-1991 GuaranteesNot Applicable
Note 8.H. Guaranteed Loans OutstandingNot Applicable
Note 8.I. Liability for Post-1991 Loan Guarantees, Present ValueNot Applicable
Note 8.J. Subsidy Expense for Post-1991 Loan GuaranteesNot Applicable
Note 8.K. Subsidy Rate for Loan Guarantees Not Applicable

Note 8.L. Schedule for Reconciling Loan Guarantee Liability Balances for Post-1991 Loan Guarantees
Not Applicable
Note 8.M. Administrative ExpenseNot Applicable
Note 9. Inventory and Related PropertyAs of September 30, 2002 2001(Amounts in thousands)
1. Inventory, Net (Note 9.A.) $63,037 $54,4212. Operating Materials & Supplies, Net (Note 9.B.) 102 2993. Stockpile Materials, Net (Note 9.C.) 0 04. Total $63,139 $54,720
Note 9.A. Inventory, NetAs of September 30(Amounts in thousands) 2002 2001
Inventory, Revaluation Inventory, Inventory, Valuation1. Inventory Categories: Gross Value Allowance Net Net Method
A. Available and Purchased for Resale $87,245 ($46,697) $40,548 $47,343 OB. Held for Repair 0 0 0 0C. Excess, Obsolete, and Unserviceable 44 (44) 0 1 NRVD. Raw Materials 0 0 0 0E. Work in Process 22,489 0 22,489 7,077 OF. Total $109,778 ($46,741) $63,037 $54,421
Legend for Valuation Methods:Adjusted LAC = Latest Acquisition Cost, adjusted for holding gains and lossesNRV = Net Realizable ValueO = OtherSP = Standard PriceAC = Actual Cost
2. Restrictions of Inventory Use, Sale, or Disposition:Inventory may be sold to foreign, state and local governments, private parties and contractors in accordancewith current policies and guidance or at the direction of the U.S. President. Otherwise, there are norestrictions on the use, sale or disposition of inventory.
3. Other Information:
General Composition of InventoryInventory is tangible personal property that is: (1) held for sale, (2) in the process of production for sale or
Notes to Principal Statements
333
fy02

Civ
il W
orks
Fun
d
334
FY02
Uni
ted
Sta
tes
Arm
y A
nnua
l Fin
anci
al S
tate
men
t
(3) to be consumed in the production of goods for sale or in the provision of services for a fee. "Inventoryheld for Current Sale" is that which is expected to be sold in the normal course of operations. "ExcessInventory" is that which exceeds the demand expected in the normal course of operations and which does notmeet management's criteria to be held in reserve for future sale. "Obsolete Inventory" is that which no longeris needed due to changes in technology, laws, customs or operations. "Unserviceable Inventory" is damagedinventory that is more economical to dispose of than to repair.
The inventory data reported on the financial statements is derived from the Corps of Engineers FinancialManagement System (CEFMS). CEFMS is a comprehensive system that is designed to capture and maintainhistorical cost data necessary to comply fully with the Statement of Federal Financial Accounting StandardsNumber 3, "Accounting for Inventory and Related Property."
The inventory valuation method is based on a moving weighted average based on actual cost divided byquantity. A perpetual record of inventory is maintained to allow for recomputation of the average unit cost asnew receipts are recorded. The method of valuation was misstated in previous years' statements as LatestAcquisition Cost.
Inventory coded as excess, obsolete and unserviceable has been revalued to reflect a zero value.
The inventory increase in the Work in Process category is due to the mat casting process in support of theRevetment Program in the Lower Mississippi Valley Districts.
Note ReferenceSee Note Disclosure 1. M. - Significant Accounting Policies for additional discussion on financial reportingrequirements and DoD policies governing Inventory and related Property.
Note 9.B. Operating Materials and Supplies, NetAs of September 30,(Amounts in thousands) 2002 2001
Revaluation Valuation1. OM&S Categories: OM&S Gross Value Allowance OM&S, Net OM&S, Net Method
A. Held for Use $102 $0 $102 $299 OB. Held for Repair 0 0 0 0C. Excess, Obsolete, and Unserviceable 0 0 0 0D. Total $102 0 $102 $299
Legend for Valuation Methods:Adjusted LAC = Latest Acquisition Cost, adjusted for holding gains and lossesNRV = Net Realizable ValueO = OtherSP = Standard PriceAC = Actual Cost

2. Restrictions on OM&S:There are no restrictions on operating materials and supplies. The valuation method is based on a movingweighted averaged based on actual cost divided by quantity.
3. Other Information:
Note ReferenceSee Note Disclosure 1. M. - Significant Accounting Policies for additional discussion on financial reportingrequirements and DoD policies governing Inventory and Related Property.
Note 9.C. Stockpile Materials, NetNot Applicable
Note 10. General PP&E, NetAs of September 30,(Amounts in thousands) 2002 2001
Depreciation/ (AccumulatedAmortization Acquisition Depreciation/ Net Prior FY Net
1. Major Asset Classes: Method Service Life Value Amortization) Book Value Book Value
A. Land N/A N/A $8,045,799 N/A $8,045,799 $7,876,386B. Buildings, Structures and
Facilities S/L 20 Or 40 30,543,611 ($12,506,873) 18,036,738 17,228,056C. Leasehold Improvements S/L lease term 23,151 (4,552) 18,599 466D. Software S/L 2-5 Or 10 52,624 (574) 30,917 35,802E. Equipment S/L 5 Or 10 1,199,584 (21,707) 650,784 609,912F. Assets Under Capital Lease1 S/L lease term 0 0 0 0G. Construction-in-Progress N/A N/A 10,042,530 N/A 10,042,530 9,043,763H. Other 48,586 0 48,586 23,894I. Total General PP&E $49,955,885 ($13,081,932) $36,873,953 $34,818,279
1Note 15.B for additional information on Capital Leases
Legend for Valuation Methods:S/L = Straight Line N/A = Not Applicable
2. Other Information:
General PP&E - Significant Amount of AssetsThe $2.1 billion previously identified as intangible assets has been reclassified as land. These assets arecomprised of historical costs associated with the acquisition of land in conjunction with power projects.Costs originally were classified as intangible assets in order to comply with Federal Energy RegulatoryCommission guidelines on cost recovery. However, the decision was made that these costs were classifiedimproperly in accordance with SFFAS No. 6, "Accounting for Property, Plant and Equipment," as they werepart of the initial acquisition cost of the land and should have been classified as such. We have also made areversing entry for current year amortization in our fiscal year 2002 statements to reflect properly the effect
Notes to Principal Statements
335
fy02

Civ
il W
orks
Fun
d
336
FY02
Uni
ted
Sta
tes
Arm
y A
nnua
l Fin
anci
al S
tate
men
t
of the transfer into land (category 00) where accumulated depreciation is inappropriate.
The service lives for our multiple purpose project assets are derived from guidance provided by the FederalEnergy Regulatory Commission based on industry standards.
The $18.1 million increase in leasehold improvements from FY 2001 is attributed to new FY 2002 Corpspolicy requiring all capital improvements with a useful life of two or more years and cost of $25,000 orgreater will be capitalized as leasehold improvements.
Other assets include $11.7 million for archaeological and cultural resources reclassified from other assets toproperty, $7.3 million in deferred and undistributed items, $23.8 million in property awaiting disposal and$5.8 million in unidentified assets.
Note ReferenceSee Note Disclosure 1. N. - Significant Accounting Policies for additional discussion on financial reportingrequirements and DoD policies governing General Property, Plant and Equipment (PP&E).
Note 10.A. Assets Under Capital LeaseNot Applicable
Note 11. Liabilities Not Covered and Covered by Budgetary ResourcesAs of September 30,(Amounts in thousands) 2002 2001
Covered by Not Covered By1. Intragovernmental Liabilities: Budgetary Resources by Budgetary Total
A. Accounts Payable $83,815 $0 $83,815 $92,731B. Debt 554 24,113 24,667 30,512 C. Environmental Liabilities 0 0 0 0 D. Other 961,649 185,293 1,146,942 1,167,318 E. Total Intragovernmental Liabilities $1,046,018 $209,406 $1,255,424 $1,290,561
2. Non-Federal Liabilities:A. Accounts Payable $595,952 $0 $595,952 $505,326 B. Military Retirement Benefits and
Other Employment-RelatedActuarial Liabilities 0 0 0 0
C. Environmental Liabilities 0 0 0 0 D. Loan Guarantee Liability 0 0 0 0 E. Other Liabilities 590,777 0 590,777 576,522 F. Total Non-Federal Liabilities $1,186,729 $0 $1,186,729 $1,081,8483. Total Liabilities: $2,232,747 $209,406 $2,442,153 $2,372,409
4. Other Information:

Liabilities Not Covered and Covered by Budgetary ResourcesLiabilities Not Covered by Budgetary Resources are those liabilities which are not considered covered byrealized budgetary resources as of the balance sheet date.
Liabilities Covered by Budgetary Resources are those that are incurred by the reporting entity which arecovered by realized budget resources as of the balance sheet date. Budgetary resources encompass not onlynew budget authority, but also other resources available to cover liabilities for specified purposes in a givenyear. Available budgetary resources include: (1) new budget authority, (2) spending authority from offsettingcollections (credited to an appropriation or fund account), 3) recoveries of unexpired budget authoritythrough downward adjustments of prior year obligations, 4) unobligated balances of budgetary resources atthe beginning of the year or net transfers of prior year balances during the year, and 5) permanent indefiniteappropriations or borrowing authority, which have been enacted and signed into law as of the balance sheetdate, provided that the resources may be apportioned by the OMB without further action by the Congress orwithout a contingency first having to be met.
Other Corps InformationIntragovernmental other liabilities (not covered by budgetary resources) includes judgment fund liabilities inthe amount of $144.6 million and the FY 2002 Workmen's Compensation liabilities in the amount of $40.7million.
Intragovernmental other liabilities (covered) includes $880 million representing future revenue from longterm water storage contracts and $1.6 million representing future revenue from long term hydraulic miningcontracts. Once collected, these monies are returned to the Department of Treasury's general fund receiptaccount and have no budgetary impact. This category also includes $13.7 million in employer contributionsand payroll taxes, $.7 million in Disbursing Officer Cash, $33.6 million to offset interest and accountreceivables which, when collected, will be returned to Treasury, $14.4 million in the suspense account and$17.3 million in unearned advances.
The Actuarial Liability for Federal Employee's Compensation Act (FECA) is not included. The Departmentof Labor is unable to furnish a figure for FECA liability specific to the Corps of Engineers.
Non-federal other liabilities (covered) includes $388.4 million in accrued funded payroll and leave, $41.7million in contract holdbacks, $32.4 million in unearned advances, $80 million in contributed funds, mainlyfrom state and local municipalities for work to be done on a cost-share basis, $41.8 million maintained tofund contingent liabilities arising from casualty losses and $6.5 million in deposit fund and clearing accountliabilities.
Note ReferenceFor Additional Line Item discussion, see:Note 8, Direct Loans and/or Loan Guarantee ProgramsNote 12, Accounts PayableNote 13, Liabilities Not Covered and Covered by Budgetary ResourcesNote 14, Environmental Restoration Liabilities, and Environmental Disposal Liabilities
Notes to Principal Statements
337
fy02

Civ
il W
orks
Fun
d
338
FY02
Uni
ted
Sta
tes
Arm
y A
nnua
l Fin
anci
al S
tate
men
t
Note 15, Other LiabilitiesNote 16, Commitments and ContingenciesNote 17, Military Retirement Benefits and Other Employment Related Actuarial Liabilities
Note 12. Accounts PayableAs of September 30,(Amounts in thousands) 2002 2001
Interest, Penalties, andAccounts Payable Administrative Fees Total Total
1. Intragovernmental Payables: $83,814 N/A $83,814 $92,7312. Non-Federal Payables
(to the Public): 595,952 $0 595,952 505,3263. Total 679,766 $0 $679,766 $598,057
4. Other Information:Intragovernmental Accounts Payable consists of amounts owed to other federal agencies for goods orservices ordered and received, but not yet paid. Interest, penalties and administrative fees are not applicableto intragovernmental payables. Non-Federal Payables (to the Public) are payments to non-federalgovernment entities.
The reason for the variance in Accounts Payable from Fiscal Year (FY) 2001 is due largely to the fact thatAccounts Payable was reduced by $161 million in FY 2001 due to an Auditor recommended adjustmentbased on unsupported accruals. During FY 2002 USACE put out new policy to correct this matter and thusno adjustment was made.
The Corps has no known delinquent accounts payable, therefore no amount is reported for interest, penalties,and administrative fees. During FY 2002, the Corps paid $143 thousand in interest, from Civil Worksappropriations, on payments of $4.5 billion subject to the Prompt Payment Act (.003%).
Note ReferenceSee Note Disclosure 1. G. - Significant Accounting Policies for additional discussion on financial reportingrequirements and DoD policies governing accounting for Intragovernmental Activities.
Note 13. DebtAs of September 30,(Amounts in thousands) 2002 2001
1. Public Debt: Beginning Balance Net Borrowings Ending Balance Ending Balance
A. Held by Government Accounts N/A N/A N/A N/AB. Held by the Public N/A N/A N/A N/AC. Total Public Debt N/A N/A N/A N/A

As of September 30,(Amounts in thousands) 2002 2001
2. Agency Debt: Beginning Balance Net Borrowings Ending Balance Ending Balance
A. Debt to the Treasury $30,512 ($5,845) $24,667 $30,512B. Debt to the Federal Financing Bank 0 0 0 0C. Debt to Other Federal Agencies 0 0 0 0D. Total Agency Debt $30,512 ($5,845) $24,667 $30,512
3. Total Debt: $30,512 ($5,845) $24,667 $30,512
4. Classification of Debt:A. Intragovernmental Debt $24,667 $30,512B. Non-Federal Debt N/A N/AC. Total Debt $24,667 $30,512
5. Other Information:During fiscal years 1997, 1998, and 1999, the Corps of Engineers executed three promissory notes totaling$75 million with the Department of the Treasury. Funds provided were used for capital improvements to theWashington Aqueduct. Funding to repay the debt is provided by Arlington County and Falls Church,Virginia, and the District of Columbia. Actual draw down of funds has been made from the Treasury in theamount of $73.4 million. Principal repayments as of September 30, 2002 total $49.3 million. $553,901.68represents accrued interest payable at September 30, 2002.
During fiscal year 2002, actual draw down of funds from the Treasury totals $10.3 million. Principalrepayments during fiscal year 2002 total $16 million.
Note ReferenceSee Note Disclosure 1. G. - Significant Accounting Policies for additional discussion on financial reportingrequirements and DoD policies governing Accounting for Intragovernmental Activities, Public Debt.
Note 14. Environmental Liabilities and Disposal LiabilitiesNot Applicable
Notes to Principal Statements
339
fy02

Civ
il W
orks
Fun
d
340
FY02
Uni
ted
Sta
tes
Arm
y A
nnua
l Fin
anci
al S
tate
men
t
Note 15.A. Other Liabilities As of September 30,(Amounts in thousands) 2002 2001
1. Intragovernmental: Current Liability Noncurrent Liability Total TotalA. Advances from Others $17,312 $0 $17,312 $21,491 B. Deferred Credits 0 0 0 991,343 C. Deposit Funds and Suspense Account
Liabilities 14,413 0 14,413 0 D. Resources Payable to Treasury 33,642 0 33,642 0 E. Disbursing Officer Cash 653 0 653 649 F. Non-environmental Disposal Liabilities:
(1) National Defense PP&E (Non-nuclear) 0 0 0 0 (2) Excess/Obsolete Structures 0 0 0 0 (3) Conventional Munitions Disposal 0 0 0 0 (4) Other 0 0 0 0
G. Accounts Payable-- Cancelled Appropriations 0 0 0 0 H Judgment Fund Liabilities 144,641 0 144,641 103,618 I. FECA Reimbursement to the Department
of Labor 15,835 24,817 40,652 40,178 J. Capital Lease Liability 0 0 0 0 K. Other Liabilities 13,702 881,925 895,627 10,039 L. Total Intragovernmental Other Liabilities $240,198 $906,742 $1,146,940 $1,167,318
2. Non-Federal:A. Accrued Funded Payroll and Benefits $388,374 $0 $388,374 $353,706 B. Advances from Others 112,410 0 112,410 77,527 C. Deferred Credits 0 0 0 6 D. Loan Guarantee Liability 0 0 0 0 E. Liability for Subsidy Related to
Undisbursed Loans 0 0 0 0 F. Deposit Funds and Suspense Accounts 6,524 0 6,524 27,010 G. Temporary Early Retirement Authority 0 0 0 0 H. Non-environmental Disposal Liabilities:
(1) National Defense PP&E (Non-nuclear) 0 0 0 0 (2) Excess/Obsolete Structures 0 0 0 0 3) Conventional Munitions Disposal 0 0 0 0 (4) Other 0 0 0 0
I. Accounts Payable--Cancelled Appropriations 0 0 0 0 J. Accrued Unfunded Annual Leave 0 0 0 0 K. Accrued Entitlement Benefits for Military
Retirees and Survivors 0 0 0 0 L. Capital Lease Liability 0 0 0 0
M. Other Liabilities 83,468 0 83,468 118,272 N. Total Non-Federal Other Liabilities $590,776 $0 $590,776 $576,521
3. Total Other Liabilities: $830,974 $906,742 $1,737,716 $1,743,839

4. Other Information:
Other LiabilitiesThe Corps of Engineers Civil Works Directorate has recognized 28 unfunded liabilities arising from theJudgment Fund Contract Disputes Act settlement in accordance with the interpretation of Federal FinancialAccounting Standards Number 2, “Accounting for Treasury Judgment Fund Transactions.” The Corpsincluded $80.1 million in the FY 2003 Energy and Water Development Act Budget Submission. Congresshas not funded these liabilities in the past. The Corps did not request the entire $144.6 million in the FY2003 budget due to the fact that we have several Judgment Fund liabilities valued at $64.5 million whichwere associated with reimbursable work for local sponsors and these customers need to find appropriatefunding. Until this is accomplished, the Corps will report these liabilities.
Federal Employees' Workman's Compensation costs reflect cost incurred for income lost and medical costsfor federal civilian employees injured on the job, employees who have incurred a work-related occupationaldisease, and beneficiaries of employees whose death is attributable to a job-related injury or occupationaldisease. The costs are paid from the Federal Employees' Compensation Act (FECA). Fiscal year 2003 costsare reflected as a current liability.
Intragovernmental other liabilities (current) represent the liability for Employer Contributions and PayrollTaxes. Intragovernmental other liabilities (noncurrent) represent future revenue from long-term water storageand hydraulic mining contracts.
$80 million of the non-federal advances from others is for contributed funds, mainly from state and localmunicipalities for work to be done on a cost-share basis.
$33.6 million in Resources Payable to Treasury was reclassified from Custodial Liabilities due to restrictionsimposed on balances reported for Custodial Liabilities.
$882 million was reclassified from deferred credits to other liabilities for long-term water storage contracts,in accordance with DoD regulation.
$41.8 million of the non-federal other liabilities is maintained to fund contingent liabilities arising fromcasualty losses. An additional $41.7 million in contract holdbacks on construction-in-progress payments alsois included.
Note ReferenceSee Note Disclosure 1. S. - Significant Accounting Policies for additional discussion on financial reportingrequirements and DoD policies governing Contingencies and Other Liabilities.
Note 15.B. Capital Lease LiabilityNot Applicable
Notes to Principal Statements
341
fy02

Civ
il W
orks
Fun
d
342
FY02
Uni
ted
Sta
tes
Arm
y A
nnua
l Fin
anci
al S
tate
men
t
Note 16. Commitments and ContingenciesDisclosures Related to Commitments and Contingencies: Proprietary contingencies commonly are referred to as contingent liabilities. Although the Corps ofEngineers has cases pending litigation, they fail to satisfy the criteria to record a contingent liability inaccordance with the Federal Financial Accounting Standard Number 5, “Accounting for Liabilities of theFederal Government.” Therefore, no amount is included in our financial statements.
Note ReferenceSee Note Disclosure 1. S. - Significant Accounting Policies for additional discussion on financial reportingrequirements and DoD policies governing Contingencies and Other Liabilities.
Note 17. Military Retirement Benefits and Other Employment Related Actuarial Liabilities
Not Applicable
Note 18. Unexpended Appropriations As of September 30,(Amounts in Thousands) 2002 2001
1. Unexpended Appropriations:A. Unobligated, Available $694,450 $747,093 B. Unobligated, Unavailable 8 489 C. Unexpended Obligations 369,982 467,320 D. Total Unexpended Appropriations $1,064,440 $1,214,902
2. Other Information Pertaining to Unexpended Appropriations:Unexpended appropriations are the amount of budget authority remaining for disbursement against current orfuture obligations. Unobligated balances are classified as available or unavailable. Unobligated balancesassociated with appropriations expiring at fiscal year end remain available only for obligation adjustmentsuntil the account is closed. Unexpended obligations represent those goods and services that have not beenreceived/performed yet.
Unexpended appropriations is $.4 million less than the balance of unexpended appropriations reflected on theBalance Sheet due to an unreconciled difference in the Funds Balance between Washington Aqueduct andTreasury for appropriation 96X6094. Budgetary accounts were adjusted in order to reconcile with TreasuryFACTS II submission edits.
Note 19.A. General Disclosures Related to the Statement of Net CostNot Applicable

Note 19.B. Gross Cost and Earned Revenue by Budget FunctionalClassification
Not Applicable
Note 19.C. Gross Cost to Generate Intragovernmental Revenue and Earned Revenue (Transactions with Other Federal-Non-DoD-Entities) by Budget Functional Classification
Not Applicable
Note 19.D. Imputed Expenses As of September 30,(Amount in thousands) 2002 2001
1. Civilian (e.g.,CSRS/FERS) Retirement $81,319 $80,620 2. Civilian Health 102,986 99,996 3. Civilian Life Insurance 366 344 4. Military Retirement Pension 0 0 5. Military Retirement Health 0 0 6. Judgment Fund 24,316 30,635 7. Total Imputed Expenses $208,987 $211,595
Note 19.E. Benefit Program Expenses Not Applicable
Note 19. F. Exchange Revenue Disclosures Related to the Exchange Revenue: Exchange Revenue - arises when a Government entity provides goods and services to the public or to anotherGovernment entity for a price, - "earned revenue." Exchange revenue includes most user charges other thantaxes, i.e., regulatory user charges.
SFFAS No. 7 - Disclosures and Other Accompanying Information RequirementsGoods and services provided through reimbursable programs to the public or another U.S. Government entity(Intra-Corps, Intra-DoD, or other federal government entity) are provided at cost. Such reimbursable salesare reported as earned revenues. Costs are equal to the amount reported as earned.
Note ReferenceFor Regulatory Discussion on "Exchange Revenue" see, Department of Defense Financial ManagementRegulation, Volume 6B, Chapter 10, paragraph 102116.
Notes to Principal Statements
343
fy02

Civ
il W
orks
Fun
d
344
FY02
Uni
ted
Sta
tes
Arm
y A
nnua
l Fin
anci
al S
tate
men
t
Note 19.G. Amounts for Foreign Military Sales (FMS) Program Procurements from Contractors
Not Applicable
Note 19.H. Stewardship AssetsNot Applicable
Note 19.I. Intragovernmental Revenue and ExpenseDisclosures Related to Intragovernmental Revenue and Expense:
Intragovernmental RevenueThe Corps of Engineers Financial Management System (CEFMS) captures trading partner data at thetransaction level in a manner that facilitates trading partner reconciliation and elimination entries.
Note ReferenceFor Regulatory Discussion on "Intragovernmental Revenue and Expense" see, Department of DefenseFinancial Management Regulation, Volume 6B, Chapter 10, paragraph 102125.
Note 19.J. Suborganization Program CostsNot Applicable
Note 20. Disclosures Related to the Statement of Changes in Net PositionAs of September 30,(Amounts in thousands)
Cumulative Results of Unexpended Cumulative Results UnexpendedOperations 2002 Appropriations 2002 of Operations 2001 Appropriations 2001
1. Prior Period Adjustments Increases Decreases) to Net Position Beginning Balance:A. Changes in Accounting Standards $0 $0 $0 $0 B. Errors and Omissions in Prior Year
Accounting Reports 0 0 (846,196) 0 C. Other Prior Period Adjustments 0 0 67 0 D. Total Prior Period Adjustments $0 $0 ($846,129) $0

As of September 30,(Amounts in thousands)
Cumulative Results of Unexpended Cumulative Results UnexpendedOperations 2002 Appropriations 2002 of Operations 2001 Appropriations 2001
2. Imputed Financing:A. Civilian CSRS/FERS Retirement $81,319 $0 $80,620 $0 B. Civilian Health 102,986 0 99,996 0 C. Civilian Life Insurance 366 0 344 0 D. Military Retirement Pension 0 0 0 0 E. Military Retirement Health 0 0 0 0 F. Judgment Fund 24,316 0 30,635 0 G. Total Imputed Financing $208,987 $0 $211,595 $0
3. Other Information:
Other Corps DisclosuresTaxes and Other Non-exchange Revenue include $748 million in tax collections and $71.1 million in interestincome deposited into the trust fund accounts. $95.1 million was derived from excise taxes and wasdeposited into the Inland Waterways Trust Fund. $652.9 million was collected and deposited into TheHarbor Maintenance Trust Fund as tax collections. These taxes were derived from:
Tax on Domestics $27.8 millionTax on Exports 1.6 millionTax on Foreign Trade 69.1 millionTax on Imports 544.8 millionTax on Passengers 9.6 million
Transfers in include $10 million transferred into the South Dakota Terrestrial Wildlife Restoration Trust Fundand $63.9 million in budget authority which was transferred into the Coastal Wetlands Restoration TrustFund from the Aquatic Resources Trust Fund.
Transfers out to other government agencies include $3 million to the Customs Department, $13.3 million tothe Saint Lawrence Seaway Development Corporation, $1.4 million to the Department of Transportation,$103 thousand to the Department of the Interior, and $13 thousand to the Department of Agriculture.
Imputed financing reported on Line 2F includes $5.1 million for power plant fees paid to states ascompensation for "lost" property taxes on federally leased land leased to others. Line 2F also includes $25.5million for Judgment Fund liabilities for which the Corps is not responsible for reimbursement to theDepartment of the Treasury.
Note ReferenceFor Regulatory Disclosure Related to The Statement of Changes in Net Position see, Department of DefenseFinancial Management Regulation, Volume 6B, Chapter 10, paragraph 1022.
Notes to Principal Statements
345
fy02

Civ
il W
orks
Fun
d
346
FY02
Uni
ted
Sta
tes
Arm
y A
nnua
l Fin
anci
al S
tate
men
t
Note 21.A. Disclosures Related to the Statement of Budgetary ResourcesAs of September 30,(Amounts in thousands) 2002 2001
1. Net Amount of Budgetary Resources Obligated forUndelivered Orders at the End of the Period $1,368,628 $1,412,416
2. Available Borrowing and Contract Authority at theEnd of the Period $42,134 $42,167
3. Other Information:
Apportionment CategoriesDisclosure of apportionment categories for obligations incurred. OMB 01-09 section 9.27 specificallyrequires disclosure of the amount of direct and reimbursable obligations incurred against amountsapportioned under category A, B and exempt from apportionment. This disclosure should agree with theaggregate of the related information as reported on the agency's year-end SF 133s and lines 8A and 8B in theStatement of Budgetary Resources.
Intra-Corps transactions have not been eliminated because the Statement of Budgetary Resources is presentedas combined and combining.
Borrowing authority is for capital improvements to the Washington Aqueduct. Funding to repay the debt isprovided by Arlington County, Virginia, Falls Church, Virginia, and the District of Columbia.
The Statement of Budgetary Resources reflects a $354 million difference between the beginning and endingunobligated and obligated, net balances due to a correction of FY 2001 reporting in the revolving fundaccount. These amounts have been revised in accordance with OMB Circular No. A-11, Part 4, Instructionson Budget Execution, section 130.2, which requires any material errors in previously reported information tobe revised.
According to the Treasury Financial Manual, Part 2, Chapter 4000, Federal Agencies' Centralized Trial-Balance System, paragraph 4630.60, if an allocation transfer is material to the child's financial statements, thechild should report the activity relating to the allocation on all of its financial statements, except theStatement of Budgetary Resources. The Departments of Commerce, Energy and Transportation chose toreport their transfers to the Corps. Therefore, the Statement of Budgetary Resources will not reconcile to theStatement of Budget Execution, SF 133, which was reported by the Corps.
The format of the Statement of Budgetary Resources was modified for FY 2002 to include a new line (Line16) for reporting Offsetting Receipts. No Offsetting Receipts were reported in FY 2001.
Undelivered OrdersUndelivered Orders presented in the Statement of Budgetary Resources includes Undelivered Orders-Unpaidfor both direct and reimbursable funds.

Spending Authority from Offsetting CollectionsAdjustments in funds that temporarily are not available pursuant to Public Law, and those that permanentlyare not available (included in the "Adjustments" line on the Statement of Budgetary Resources), are notincluded in the "Spending Authority From Offsetting Collections and Adjustments" line on the Statement ofBudgetary Resources or the "Spending Authority for Offsetting Collections and Adjustments" line on theStatement of Financing.
Note ReferenceFor Regulatory Disclosure Related to The Statement of Budgetary Resources" see, Department of DefenseFinancial Management Regulation, Volume 6B, Chapter 10, paragraph 1023.
Note 21.B. Disclosures Related to Problem Disbursements, In-transit Disbursements and Suspense/Budget Clearing Accounts
As of September 30,(Amounts in thousands)
(Decrease)/Increase1. Total Problem Disbursement Sep 2000 Sep 2001 Sep 2002 from 2001 to 2002
A. Absolute Unmatched Disbursements $0 $0 $0 $0B. Negative Unliquidated Obligations 0 0 0 0
2. Total In-transit Disbursements, Net $0 $0 $0 $0
3. Other Information Related to Problem Disbursements and In-transit Disbursements:
4. Suspense/Budget Clearing Accounts, NetAccount Sep 2000 Sep 2001 Sep 2002 (Decrease)/Increase
F3875 $17,909 $17,422 $14,228 ($3,194)F3880 (5) (5) 0 5F3882 0 0 0 0F3885 0 0 0 0F3886 0 0 0 0Total $17,904 $17,417 $14,228 ($3,189)
5. Other Information Related to Suspense/Budget Clearing Accounts:
Other Corps DisclosuresF3875 includes a portion of receipts from leases of land to the public for flood control, navigation and alliedpurposes. The portion of lease receipts when the term of the lease extends into fiscal year 2003 is collectedinto F3875. The collections are transferred out in the year following collection. Also included arereceivables of $185 thousand that pertain to the leases of land.
Notes to Principal Statements
347
fy02
Civ
il W
orks
Fun
d
348
FY02
Uni
ted
Sta
tes
Arm
y A
nnua
l Fin
anci
al S
tate
men
t
F3875 includes a $13 million disputed collection on a water storage contract at the Tulsa District.
Note ReferenceFor Regulatory Disclosure Related to "Disclosures Related to Problem Disbursements, In-transitDisbursements and Suspense/Budget Clearing Accounts" see, Department of Defense Financial ManagementRegulation, Volume 6B, Chapter 10, paragraph 102305.
Note 22. Disclosures Related to the Statement of FinancingDisclosures Related to the Statement of Financing: Transfers to other government agencies include $1.4 million to the Department of Transportation, $103thousand to the Department of The Interior, and $13 thousand to the Department of Agriculture.
In FY 2002, the Department of Defense modified the financial statement presentation for the Statement ofFinancing, in accordance with Office of Management and Budget direction. As a result, the Statement ofFinancing will not lend itself always to comparative analysis. The Departmental Reporting System wasmodified to calculate the Net Cost using different accounts than had been used in past report submissions.Therefore, the FY 2001 Statement of Financing Net Cost Line 30 does not agree with FY 2001 Statement ofNet Cost Line 4.
Note ReferenceFor Regulatory Disclosure Related to The Statement of Financing see, Department of Defense FinancialManagement Regulation, Volume 6B, Chapter 10, paragraph 1024.
Note 23. Disclosures Related to the Statement of Custodial ActivityNot Applicable
Note 24.A. Other DisclosuresNot Applicable
Note 24.B. Other DisclosuresNot Applicable

Consolidating Balance Sheet
The accompanying notes are an integral part of these statements.
349
fy02
Department of Defense • Department of the Army As of September 30, 2002 and 2001 ($ in thousands)
1. ASSETS (Note 2)A. Intragovernmental:
1. Fund Balance with Treasury(Note 3)
2. Investments (Note 4)3. Accounts Receivable (Note 5)4. Other Assets (Note 6)5. Total Intragovernmental Assets
B. Cash and Other Monetary Assets(Note 7)
C. Accounts Receivable (Note 5)D. Loans Receivable (Note 8)E. Inventory and Related Property (Note 9)F. General Property, Plant and Equipment
(Note 10)G. Other Assets (Note 6)
2. TOTAL ASSETS
3. LIABILITIES (Note 11)A. Intragovernmental:
1. Accounts Payable (Note 12)2. Debt (Note 13)3. Environmental Liabilities (Note 14)4. Other Liabilities (Notes 15 and 16)5. Total Intragovernmental Liabilities
B. Accounts Payable (Note 12)C. Military Retirement Benefits and Other
Employment-Related Actuarial Liabilities(Note 17)
D. Environmental Liabilities (Note 14)E. Loan Guarantee Liability (Note 8)F. Other Liabilities (Notes 15 and 16)
4. TOTAL LIABILITIES
5. NET POSITIONA. Unexpended Appropriations (Note 18)B. Cumulative Results of Operations
6. TOTAL NET POSITION
7. TOTAL LIABILITIES AND NETPOSITION
Special Funds
$85 000
$85
$0 2,257
00
1,950 0
$4,292
$0 00
2,257 $2,257
$5
000 2
$2,264
$78 1,950
$2,028
$4,292
BorrowingAuthority
$773 0
(1)0
$772
$0 000
69,198 0
$69,970
$0 24,667
00
$24,667 $0
000
246
$24,913
$0 45,057
$45,057
$69,970
Transfer Funds
$45,492 000
$45,492
$0 000
218,068 0
$263,560
$855 000
$855 $6,220
000
1,336
$8,411
$37,081 218,068
$255,149
$263,560
Trust Funds
$59,954 2,269,086
322,728 0
$2,651,768
$0 000
759,935 0
$3,411,703
$159 00
6,000 $6,159
$15,978
000
873
$23,010
$0 3,388,693
$3,388,693
$3,411,703

Civ
il W
orks
Fun
dFY
02 U
nite
d S
tate
s A
rmy
Ann
ual F
inan
cial
Sta
tem
ent
350
Consolidating Balance SheetT
he a
ccom
pany
ing
note
s ar
e an
inte
gral
par
t of t
hese
sta
tem
ents
.
Department of Defense • Department of the Army As of September 30, 2002 and 2001 ($ in thousands)
1. ASSETS (Note 2)A. Intragovernmental:
1. Fund Balance with Treasury(Note 3)
2. Investments (Note 4)3. Accounts Receivable (Note 5)4. Other Assets (Note 6)5. Total Intragovernmental Assets
B. Cash and Other Monetary Assets(Note 7)
C. Accounts Receivable (Note 5)D. Loans Receivable (Note 8)E. Inventory and Related Property (Note 9)F. General Property, Plant and Equipment
(Note 10)G. Other Assets (Note 6)
2. TOTAL ASSETS
3. LIABILITIES (Note 11)A. Intragovernmental:
1. Accounts Payable (Note 12)2. Debt (Note 13)3. Environmental Liabilities (Note 14)4. Other Liabilities (Notes 15 and 16)5. Total Intragovernmental Liabilities
B. Accounts Payable (Note 12)C. Military Retirement Benefits and Other
Employment-Related Actuarial Liabilities(Note 17)
D. Environmental Liabilities (Note 14)E. Loan Guarantee Liability (Note 8)F. Other Liabilities (Notes 15 and 16)
4. TOTAL LIABILITIES
5. NET POSITIONA. Unexpended Appropriations (Note 18)B. Cumulative Results of Operations
6. TOTAL NET POSITION
7. TOTAL LIABILITIES AND NETPOSITION
RevolvingFunds
$902,533 0
3,159 0
$905,692
$0 849
046,171
875,412 42
$1,828,166
$41,239 00
14,192 $55,431 $67,830
000
455,481
$578,742
$0 1,249,424
$1,249,424
$1,828,166
FUSRAP
$39,917 0
(1)0
$39,916
$0 000
31 0
$39,947
$92 000
$92 $33,643
000
127
$33,862
$6,054 31
$6,085
$39,947
General Funds
$1,132,301 0
202,382 0
$1,334,683
$817 919,825
016,968
34,029,757 0
$36,302,050
$41,107 00
1,123,187 $1,164,294
$455,113
000
130,043
$1,749,450
$679,060 33,873,540
$34,552,600
$36,302,050
ContributedFunds
$362,902 0 00
$362,902
$0 000
919,602 35
$1,282,539
$480 00
1,308 $1,788 $17,163
000
2,668
$21,619
$342,591 918,329
$1,260,920
$1,282,539

Consolidating Balance Sheet
The accompanying notes are an integral part of these statements.
351
fy02
Department of Defense • Department of the Army As of September 30, 2002 and 2001 ($ in thousands)
1. ASSETS (Note 2)A. Intragovernmental:
1. Fund Balance with Treasury(Note 3)
2. Investments (Note 4)3. Accounts Receivable (Note 5)4. Other Assets (Note 6)5. Total Intragovernmental Assets
B. Cash and Other Monetary Assets(Note 7)
C. Accounts Receivable (Note 5)D. Loans Receivable (Note 8)E. Inventory and Related Property (Note 9)F. General Property, Plant and Equipment
(Note 10)G. Other Assets (Note 6)
2. TOTAL ASSETS
3. LIABILITIES (Note 11)A. Intragovernmental:
1. Accounts Payable (Note 12)2. Debt (Note 13)3. Environmental Liabilities (Note 14)4. Other Liabilities (Notes 15 and 16)5. Total Intragovernmental Liabilities
B. Accounts Payable (Note 12)C. Military Retirement Benefits and Other
Employment-Related Actuarial Liabilities(Note 17)
D. Environmental Liabilities (Note 14)E. Loan Guarantee Liability (Note 8)F. Other Liabilities (Notes 15 and 16)
4. TOTAL LIABILITIES
5. NET POSITIONA. Unexpended Appropriations (Note 18)B. Cumulative Results of Operations
6. TOTAL NET POSITION
7. TOTAL LIABILITIES AND NETPOSITION
Combined Total
$2,543,957 2,269,086
528,267 0
$5,341,310
$817 922,931
063,139
36,873,953 77
$43,202,227
$83,932 24,667
01,146,944
$1,255,543 $595,952
000
590,776
$2,442,271
$1,064,864 39,695,092
$40,759,956
$43,202,227
2001Consolidated
$2,537,990 2,255,539
476,541 0
$5,270,070
$3,990 1,028,288
054,719
34,818,281 16,190
$41,191,538
$92,727 30,512
01,167,318
$1,290,557 $505,328
000
576,523
$2,372,408
$1,214,901 37,604,229
$38,819,130
$41,191,538
2002Consolidated
$2,543,957 2,269,086
528,149 0
$5,341,192
$817 922,931
063,139
36,873,953 77
$43,202,109
$83,814 24,667
01,146,944
$1,255,425 $595,952
000
590,776
$2,442,153
$1,064,864 39,695,092
$40,759,956
$43,202,109
Eliminations
$0 0
118 0
$118
$0 000
00
$118
$118 000
$118 $0
0000
$118
$0 0
$0
$118

Civ
il W
orks
Fun
dFY
02 U
nite
d S
tate
s A
rmy
Ann
ual F
inan
cial
Sta
tem
ent
352
Consolidating Statement of Net CostT
he a
ccom
pany
ing
note
s ar
e an
inte
gral
par
t of t
hese
sta
tem
ents
.
Department of Defense • Department of the Army For the years ended September 30, 2002 and 2001 ($ in thousands)
1. Program CostsA. Borrowing Authority
1. Intragovernmental Gross Costs2. (Less: Intragovernmental Earned Revenue)3. Intragovernmental Net Costs4. Gross Costs With the Public5. (Less: Earned Revenue From the Public)6. Net Costs With the Public7. Total Net Cost
B. Contributed Funds1. Intragovernmental Gross Costs2. (Less: Intragovernmental Earned Revenue)3. Intragovernmental Net Costs4. Gross Costs With the Public5. (Less: Earned Revenue From the Public)6. Net Costs With the Public7. Total Net Cost
C. FUSRAP1. Intragovernmental Gross Costs2. (Less: Intragovernmental Earned Revenue)3. Intragovernmental Net Costs4. Gross Costs With the Public5. (Less: Earned Revenue From the Public)6. Net Costs With the Public7. Total Net Cost
D. General Funds1. Intragovernmental Gross Costs2. (Less: Intragovernmental Earned Revenue)3. Intragovernmental Net Costs4. Gross Costs With the Public5. (Less: Earned Revenue From the Public)6. Net Costs With the Public7. Total Net Cost
E. Revolving Funds1. Intragovernmental Gross Costs2. (Less: Intragovernmental Earned Revenue)3. Intragovernmental Net Costs4. Gross Costs With the Public5. (Less: Earned Revenue From the Public)6. Net Costs With the Public7. Total Net Cost
Eliminations
$0 0
$0 00
$0 $0
$0 0
$0 00
$0 $0
$0 0
$0 000
$0
$0 0
$0 00
$0 $0
$0 0
$0 00
$0 $0
Combined Total
$802 0
$802 $16,000 (16,940)
($940)($138)
$5,051 0
$5,051 $176,683
(2)$176,681 $181,732
$2,209 0
$2,209 $147,444
(600)$146,844 $149,053
$290,137 (604,225)
($314,088)$2,870,037
(88,170)$2,781,867 $2,467,779
$480,519 (12,212)
$468,307 ($227,050)
(16,028)($243,078)
$225,229

Consolidating Statement of Net Cost
The accompanying notes are an integral part of these statements.
353
fy02
Department of Defense • Department of the Army For the years ended September 30, 2002 and 2001 ($ in thousands)
1. Program CostsF. Special Funds
1. Intragovernmental Gross Costs2. (Less: Intragovernmental Earned Revenue)3. Intragovernmental Net Costs4. Gross Costs With the Public5. (Less: Earned Revenue From the Public)6. Net Costs With the Public7. Total Net Cost
G Transfer Funds1. Intragovernmental Gross Costs2. (Less: Intragovernmental Earned Revenue)3. Intragovernmental Net Costs4. Gross Costs With the Public5. (Less: Earned Revenue From the Public)6. Net Costs With the Public7. Total Net Cost
H. Trust Funds1. Intragovernmental Gross Costs2. (Less: Intragovernmental Earned Revenue)3. Intragovernmental Net Costs4. Gross Costs With the Public5. (Less: Earned Revenue From the Public)6. Net Costs With the Public7. Total Net Cost
I. Total Program Costs1. Intragovernmental Gross Costs2. (Less: Intragovernmental Earned Revenue)3. Intragovernmental Net Costs4. Gross Costs With the Public5. (Less: Earned Revenue From the Public)6. Net Costs With the Public7. Total Net Cost
2. Cost Not Assigned to Programs
3. (Less:Earned Revenue Not Attributable toPrograms)
4. Net Cost of Operations
Eliminations
$0 0
$0 00
$0 $0
$0 0
$0 00
$0 $0
$0 0
$0 00
$0 $0
$0 0
$0 00
$0 $0
0
0
$0
Combined Total
$0 0
$0 $12,290
0$12,290 $12,290
$224 0
$224 $2,569
0$2,569 $2,793
$7,688 0
$7,688 $647,305
0$647,305 $654,993
$786,630 (616,437)$170,193
$3,645,278 (121,740)
$3,523,538 $3,693,731
$0
0
$3,693,731

Civ
il W
orks
Fun
dFY
02 U
nite
d S
tate
s A
rmy
Ann
ual F
inan
cial
Sta
tem
ent
354
Consolidating Statement of Net CostT
he a
ccom
pany
ing
note
s ar
e an
inte
gral
par
t of t
hese
sta
tem
ents
.
Department of Defense • Department of the Army For the years ended September 30, 2002 and 2001 ($ in thousands)
1. Program CostsA. Borrowing Authority
1. Intragovernmental Gross Costs2. (Less: Intragovernmental Earned Revenue)3. Intragovernmental Net Costs4. Gross Costs With the Public5. (Less: Earned Revenue From the Public)6. Net Costs With the Public7. Total Net Cost
B. Contributed Funds1. Intragovernmental Gross Costs2. (Less: Intragovernmental Earned Revenue)3. Intragovernmental Net Costs4. Gross Costs With the Public5. (Less: Earned Revenue From the Public)6. Net Costs With the Public7. Total Net Cost
C. FUSRAP1. Intragovernmental Gross Costs2. (Less: Intragovernmental Earned Revenue)3. Intragovernmental Net Costs4. Gross Costs With the Public5. (Less: Earned Revenue From the Public)6. Net Costs With the Public7. Total Net Cost
D. General Funds1. Intragovernmental Gross Costs2. (Less: Intragovernmental Earned Revenue)3. Intragovernmental Net Costs4. Gross Costs With the Public5. (Less: Earned Revenue From the Public)6. Net Costs With the Public7. Total Net Cost
E. Revolving Funds1. Intragovernmental Gross Costs2. (Less: Intragovernmental Earned Revenue)3. Intragovernmental Net Costs4. Gross Costs With the Public5. (Less: Earned Revenue From the Public)6. Net Costs With the Public7. Total Net Cost
FY 2001
$1,310 0
$1,310 $8,239 (8,971)($732)
$578
$2,266 0
$2,266 $139,174
(5)$139,169 $141,435
$475 0
$475 $151,840
0$151,840 $152,315
$211,797 (452,951)
($241,154)$3,448,065
(75,484)$3,372,581 $3,131,427
$887,509 (30,151)
$857,358 ($660,624)
(17,668)($678,292)
$179,066
FY 2002
$802 0
$802 $16,000 (16,940)
($940)($138)
$5,051 0
$5,051 $176,683
(2)$176,681 $181,732
$2,209 0
$2,209 $147,444
(600)$146,844 $149,053
$290,137 (604,225)
($314,088)$2,870,037
(88,170)$2,781,867 $2,467,779
$480,519 (12,212)
$468,307 ($227,050)
(16,028)($243,078)
$225,229

Consolidating Statement of Net Cost
The accompanying notes are an integral part of these statements.
355
fy02
Department of Defense • Department of the Army For the years ended September 30, 2002 and 2001 ($ in thousands)
1. Program CostsF. Special Funds
1. Intragovernmental Gross Costs2. (Less: Intragovernmental Earned Revenue)3. Intragovernmental Net Costs4. Gross Costs With the Public5. (Less: Earned Revenue From the Public)6. Net Costs With the Public7. Total Net Cost
G Transfer Funds1. Intragovernmental Gross Costs2. (Less: Intragovernmental Earned Revenue)3. Intragovernmental Net Costs4. Gross Costs With the Public5. (Less: Earned Revenue From the Public)6. Net Costs With the Public7. Total Net Cost
H. Trust Funds1. Intragovernmental Gross Costs2. (Less: Intragovernmental Earned Revenue)3. Intragovernmental Net Costs4. Gross Costs With the Public5. (Less: Earned Revenue From the Public)6. Net Costs With the Public7. Total Net Cost
I. Total Program Costs1. Intragovernmental Gross Costs2. (Less: Intragovernmental Earned Revenue)3. Intragovernmental Net Costs4. Gross Costs With the Public5. (Less: Earned Revenue From the Public)6. Net Costs With the Public7. Total Net Cost
2. Cost Not Assigned to Programs
3. (Less:Earned Revenue Not Attributable toPrograms)
4. Net Cost of Operations
FY 2001
$4 0
$4 $16,037
(1)$16,036 $16,040
$68 0
$68 $14,580
0$14,580 $14,648
$2,100 0
$2,100 $651,370
0$651,370 $653,470
$1,105,529 (483,102)$622,427
$3,768,681 (102,129)
$3,666,552 $4,288,979
0
0
$4,288,979
FY 2002
$0 0
$0 $12,290
0$12,290 $12,290
$224 0
$224 $2,569
0$2,569 $2,793
$7,688 0
$7,688 $647,305
0$647,305 $654,993
$786,630 (616,437)$170,193
$3,645,278 (121,740)
$3,523,538 $3,693,731
0
0
$3,693,731

Civ
il W
orks
Fun
dFY
02 U
nite
d S
tate
s A
rmy
Ann
ual F
inan
cial
Sta
tem
ent
356
Consolidating Statement of Changes in Net PositionT
he a
ccom
pany
ing
note
s ar
e an
inte
gral
par
t of t
hese
sta
tem
ents
.
Department of Defense • Department of the Army For the years ended September 30, 2002 and 2001 ($ in thousands)
Beginning Balances
Prior period adjustments (+/-)
Beginning Balances, as adjusted
Budgetary Financing Sources:Appropriations receivedAppropriations transferred-in/out (+/-)Other adjustments (rescissions, etc) (+/-)Appropriations usedNonexchange revenueDonations and forfeitures of cash and cash
equivalentsTransfers-in/out without reimbursement (+/-)Other budgetary financing sources (+/-)
Other Financing Sources:Donations and forfeitures of propertyTransfers-in/out without reimbursement (+/-)Imputed financing from costs absorbed by
othersOther (+/-)
Total Financing Sources
Net Cost of Operations (+/-)
Ending Balances
SpecialFunds
CumulativeResults of
Operations
$24,879
0
$24,879
000
12,287 0
0(22,890)
0
0(36)
00
($10,639)
12,290
$1,950
Trust FundsUnexpended
Appropriations
$0
0
$0
000 00
000
00
00
$0
0
$0
Trust FundsCumulativeResults of
Operations
$3,157,181
0
$3,157,181
0000
819,255
0(683,761)
(3,111)
0754,122
00
$886,505
654,993
$3,388,693
Special FundsUnexpended
Appropriations
($1,536)
0
($1,536)
50,781 (36,880)
1,839 (14,126)
0
000
00
00
$1,614
0
$78

Consolidating Statement of Changes in Net Position
The accompanying notes are an integral part of these statements.
357
fy02
Department of Defense • Department of the Army For the years ended September 30, 2002 and 2001 ($ in thousands)
Beginning Balances
Prior period adjustments (+/-)
Beginning Balances, as adjusted
Budgetary Financing Sources:Appropriations receivedAppropriations transferred-in/out (+/-)Other adjustments (rescissions, etc) (+/-)Appropriations usedNonexchange revenueDonations and forfeitures of cash and cash
equivalentsTransfers-in/out without reimbursement (+/-)Other budgetary financing sources (+/-)
Other Financing Sources:Donations and forfeitures of propertyTransfers-in/out without reimbursement (+/-)Imputed financing from costs absorbed by
othersOther (+/-)
Total Financing Sources
Net Cost of Operations (+/-)
Ending Balances
TransferFunds
CumulativeResults of
Operations
$128,150
0
$128,150
000
93,011 0
000
0(300)
00
$92,711
2,793
$218,068
BorrowingAuthority
UnexpendedAppropriations
$15,436
0
$15,436
00
(15,436)00
000
00
00
($15,436)
0
$0
BorrowingAuthority
CumulativeResults of
Operations
$13,483
0
$13,483
000
15,436 16,000
000
00
00
$31,436
(138)
$45,057
Transfer FundsUnexpended
Appropriations
$54,303
0
$54,303
075,698 (6,057)
(86,863)0
000
00
00
($17,222)
0
$37,081

Civ
il W
orks
Fun
dFY
02 U
nite
d S
tate
s A
rmy
Ann
ual F
inan
cial
Sta
tem
ent
358
Consolidating Statement of Changes in Net PositionT
he a
ccom
pany
ing
note
s ar
e an
inte
gral
par
t of t
hese
sta
tem
ents
.
Department of Defense • Department of the Army For the years ended September 30, 2002 and 2001 ($ in thousands)
Beginning Balances
Prior period adjustments (+/-)
Beginning Balances, as adjusted
Budgetary Financing Sources:Appropriations receivedAppropriations transferred-in/out (+/-)Other adjustments (rescissions, etc) (+/-)Appropriations usedNonexchange revenueDonations and forfeitures of cash and cash
equivalentsTransfers-in/out without reimbursement (+/-)Other budgetary financing sources (+/-)
Other Financing Sources:Donations and forfeitures of propertyTransfers-in/out without reimbursement (+/-)Imputed financing from costs absorbed by
othersOther (+/-)
Total Financing Sources
Net Cost of Operations (+/-)
Ending Balances
RevolvingFunds
CumulativeResults of
Operations
$1,253,929
0
$1,253,929
000
36,176 0
00
(55)
13 (80)
184,670 0
$220,724
225,229
$1,249,424
ContributedFunds
UnexpendedAppropriations
$283,052
0
$283,052
394,039 0
(3,597)(330,903)
0
000
00
00
$59,539
0
$342,591
ContributedFunds
CumulativeResults of
Operations
$766,391
0
$766,391
000
334,500 0
000
0(830)
00
$333,670
181,732
$918,329
RevolvingFunds
UnexpendedAppropriations
$0
0
$0
00000
000
00
00
$0
0
$0

Consolidating Statement of Changes in Net Position
The accompanying notes are an integral part of these statements.
359
fy02
Department of Defense • Department of the Army For the years ended September 30, 2002 and 2001 ($ in thousands)
Beginning Balances
Prior period adjustments (+/-)
Beginning Balances, as adjusted
Budgetary Financing Sources:Appropriations receivedAppropriations transferred-in/out (+/-)Other adjustments (rescissions, etc) (+/-)Appropriations usedNonexchange revenueDonations and forfeitures of cash and cash
equivalentsTransfers-in/out without reimbursement (+/-)Other budgetary financing sources (+/-)
Other Financing Sources:Donations and forfeitures of propertyTransfers-in/out without reimbursement (+/-)Imputed financing from costs absorbed by
othersOther (+/-)
Total Financing Sources
Net Cost of Operations (+/-)
Ending Balances
General FundsCumulativeResults of
Operations
$32,260,196
0
$32,260,196
000
4,064,372 742
000
290 (8,597)
24,316 0
$4,081,123
2,467,779
$33,873,540
FUSRAPUnexpended
Appropriations
$15,117
0
$15,117
140,000 0
(7,887)(141,176)
0
000
00
00
($9,063)
0
$6,054
FUSRAPCumulativeResults of
Operations
$20
0
$20
000
149,064 0
000
00
00
$149,064
149,053
$31
General Funds Unexpended
Appropriations
$848,529
0
$848,529
3,740,145 159,590
(122,236)(3,946,968)
0
000
00
00
($169,469)
0
$679,060

Civ
il W
orks
Fun
dFY
02 U
nite
d S
tate
s A
rmy
Ann
ual F
inan
cial
Sta
tem
ent
360
Consolidating Statement of Changes in Net PositionT
he a
ccom
pany
ing
note
s ar
e an
inte
gral
par
t of t
hese
sta
tem
ents
.
Department of Defense • Department of the Army For the years ended September 30, 2002 and 2001 ($ in thousands)
Beginning Balances
Prior period adjustments (+/-)
Beginning Balances, as adjusted
Budgetary Financing Sources:Appropriations receivedAppropriations transferred-in/out (+/-)Other adjustments (rescissions, etc) (+/-)Appropriations usedNonexchange revenueDonations and forfeitures of cash and cash
equivalentsTransfers-in/out without reimbursement (+/-)Other budgetary financing sources (+/-)
Other Financing Sources:Donations and forfeitures of propertyTransfers-in/out without reimbursement (+/-)Imputed financing from costs absorbed by
othersOther (+/-)
Total Financing Sources
Net Cost of Operations (+/-)
Ending Balances
CombinedTotal
CumulativeResults of
Operations
$37,604,229
0
$37,604,229
000
4,704,846 835,997
0(706,651)
(3,166)
303 744,279
208,986 0
$5,784,594
3,693,731
$39,695,092
EliminationsUnexpended
Appropriations
$0
0
$0
00000
000
00
00
$0
0
$0
EliminationsCumulativeResults of
Operations
$0
0
$0
00000
000
00
00
$0
0
$0
CombinedTotal
UnexpendedAppropriations
$1,214,901
0
$1,214,901
4,324,965 198,408
(153,374)(4,520,036)
0
000
00
00
($150,037)
0
$1,064,864

Consolidating Statement of Changes in Net Position
The accompanying notes are an integral part of these statements.
361
fy02
Department of Defense • Department of the Army For the years ended September 30, 2002 and 2001 ($ in thousands)
Beginning Balances
Prior period adjustments (+/-)
Beginning Balances, as adjusted
Budgetary Financing Sources:Appropriations receivedAppropriations transferred-in/out (+/-)Other adjustments (rescissions, etc) (+/-)Appropriations usedNonexchange revenueDonations and forfeitures of cash and cash
equivalentsTransfers-in/out without reimbursement (+/-)Other budgetary financing sources (+/-)
Other Financing Sources:Donations and forfeitures of propertyTransfers-in/out without reimbursement (+/-)Imputed financing from costs absorbed by
othersOther (+/-)
Total Financing Sources
Net Cost of Operations (+/-)
Ending Balances
FY 2002Consolidated
CumulativeResults of
Operations
$37,604,229
0
$37,604,229
000
4,704,846 835,997
0(706,651)
(3,166)
303 744,279
208,986 0
$5,784,594
3,693,731
$39,695,092
FY 2001Trust Funds
UnexpendedAppropriations
$1,004,640
0
$1,004,640
210,262 0000
000
00
00
$210,262
0
$1,214,902
FY 2001Trust FundsCumulativeResults of
Operations
$36,999,464
(846,130)
$36,153,334
000
4,310,085 919,800
0(445,585)
(8,859)
275 752,563
211,595 0
$5,739,874
4,288,979
$37,604,229
FY 2002ConsolidatedUnexpended
Appropriations
$1,214,901
0
$1,214,901
4,324,965 198,408
(153,374)(4,520,036)
0
000
00
00
($150,037)
0
$1,064,864

Civ
il W
orks
Fun
dFY
02 U
nite
d S
tate
s A
rmy
Ann
ual F
inan
cial
Sta
tem
ent
362
Combining Statement of Budgetary ResourcesT
he a
ccom
pany
ing
note
s ar
e an
inte
gral
par
t of t
hese
sta
tem
ents
.
Department of Defense • Department of the Army For the years ended September 30, 2002 and 2001 ($ in thousands)
Budgetary Resources:A. Budget Authority:
Appropriations receivedBorrowing authorityContract authorityNet transfers (+/-)Other
B. Unobligated balance:Beginning of periodNet transfers, actual (+/-)Anticipated Transfers Balances
C. Spending authority from offsetting collections:Earned
CollectedReceivable from Federal sources
Change in unfilled customer ordersAdvance receivedWithout advance from Federal sources
Anticipated for the rest of year, without advancesTransfers from trust fundsSubtotal
D. Recoveries of prior year obligationsE. Temporarily not available pursuant to Public LawF Permanently not availableG Total Budgetary Resources
Status of Budgetary Resources:H. Obligations incurred:
DirectReimbursableSubtotal
I. Unobligated balance:ApportionedExempt from apportionmentOther available
J. Unobligated Balances Not AvailableK. Total, Status of Budgetary Resources
Relationship of Obligations to Outlays:L. Obligated Balance, Net - beginning of periodM. Obligated Balance transferred, net (+/-)N. Obligated Balance, Net - end of period:
Accounts receivableUnfilled customer order from Federal sourcesUndelivered ordersAccounts payable
O. Outlays:DisbursementsCollectionsSubtotal
P. Less: Offsetting receiptsQ. Net Outlays
Special FundsBudgetary
$50,781 00
(36,780)0
23,189 (22,990)
0
00
0000
$0000
$14,200
$14,139 0
14,139
61 000
$14,200
$1,348 0
00
17 7
15,463 0
$15,463 0
$15,463
Trust FundsNon-BudgetaryCredit Program
FinancingAccounts
$0 0000
000
00
0000
$0000
$0
$0 00
0000
$0
$00
0 000
00
$00
$0
Trust FundsBudgetary
$0 00
808,338 0
180,805 00
00
0000
$0000
$989,143
$789,011 0
789,011
0200,132
00
$989,143
$109,754 0
00
106,140 17,010
775,615 0
$775,615 (819,255)($43,640)
Special FundsNon-BudgetaryCredit Program
FinancingAccounts
$0 0000
000
00
0000
$0000
$0
$0 00
0000
$0
$00
0 000
00
$00
$0

Combining Statement of Budgetary Resources
The accompanying notes are an integral part of these statements.
363
fy02
Department of Defense • Department of the Army For the years ended September 30, 2002 and 2001 ($ in thousands)
Budgetary Resources:A. Budget Authority:
Appropriations receivedBorrowing authorityContract authorityNet transfers (+/-)Other
B. Unobligated balance:Beginning of periodNet transfers, actual (+/-)Anticipated Transfers Balances
C. Spending authority from offsetting collections:Earned
CollectedReceivable from Federal sources
Change in unfilled customer ordersAdvance receivedWithout advance from Federal sources
Anticipated for the rest of year, without advancesTransfers from trust fundsSubtotal
D. Recoveries of prior year obligationsE. Temporarily not available pursuant to Public LawF Permanently not availableG Total Budgetary Resources
Status of Budgetary Resources:H. Obligations incurred:
DirectReimbursableSubtotal
I. Unobligated balance:ApportionedExempt from apportionmentOther available
J. Unobligated Balances Not AvailableK. Total, Status of Budgetary Resources
Relationship of Obligations to Outlays:L. Obligated Balance, Net - beginning of periodM. Obligated Balance transferred, net (+/-)N. Obligated Balance, Net - end of period:
Accounts receivableUnfilled customer order from Federal sourcesUndelivered ordersAccounts payable
O. Outlays:DisbursementsCollectionsSubtotal
P. Less: Offsetting receiptsQ. Net Outlays
Transfer FundsBudgetary
$0 00
70,885 0
37,203 (150)
0
12 (2)
0(7)
003 000
$107,941
$86,650 7
86,657
21,276 008
$107,941
$24,194 0
0(4)
15,802 8,411
86,653 (12)
$86,641 0
$86,641
BorrowingAuthority
Non-BudgetaryCredit Program
FinancingAccounts
$0 0000
000
00
00000000
$0
$0 00
0000
$0
$00
0 000
00
$00
$0
BorrowingAuthority
Budgetary
$0 0000
3,893 00
16,940 0
0000
16,940 00
(16,033)$4,800
$3,223 940
4,163
0636
1 0
$4,800
$12,285 0
00
732 800
14,917 (16,940)($2,023)
0($2,023)
Transfer FundsNon-BudgetaryCredit Program
FinancingAccounts
$0 0000
000
00
00000000
$0
$0 00
0000
$0
$00
0 000
00
$00
$0

Civ
il W
orks
Fun
dFY
02 U
nite
d S
tate
s A
rmy
Ann
ual F
inan
cial
Sta
tem
ent
364
Combining Statement of Budgetary ResourcesT
he a
ccom
pany
ing
note
s ar
e an
inte
gral
par
t of t
hese
sta
tem
ents
.
Department of Defense • Department of the Army For the years ended September 30, 2002 and 2001 ($ in thousands)
Budgetary Resources:A. Budget Authority:
Appropriations receivedBorrowing authorityContract authorityNet transfers (+/-)Other
B. Unobligated balance:Beginning of periodNet transfers, actual (+/-)Anticipated Transfers Balances
C. Spending authority from offsetting collections:Earned
CollectedReceivable from Federal sources
Change in unfilled customer ordersAdvance receivedWithout advance from Federal sources
Anticipated for the rest of year, without advancesTransfers from trust fundsSubtotal
D. Recoveries of prior year obligationsE. Temporarily not available pursuant to Public LawF Permanently not availableG Total Budgetary Resources
Status of Budgetary Resources:H. Obligations incurred:
DirectReimbursableSubtotal
I. Unobligated balance:ApportionedExempt from apportionmentOther available
J. Unobligated Balances Not AvailableK. Total, Status of Budgetary Resources
Relationship of Obligations to Outlays:L. Obligated Balance, Net - beginning of periodM. Obligated Balance transferred, net (+/-)N. Obligated Balance, Net - end of period:
Accounts receivableUnfilled customer order from Federal sourcesUndelivered ordersAccounts payable
O. Outlays:DisbursementsCollectionsSubtotal
P. Less: Offsetting receiptsQ. Net Outlays
RevolvingFunds
Budgetary
$0 0000
73,615 00
3,675,810 (21,258)
8,127 (1,966)
00
$3,660,713 000
$3,734,328
$0 3,676,977 3,676,977
057,352
(1)0
$3,734,328
$775,963 0
(25,520)(29,959)337,544 563,116
3,630,982 (3,683,937)
($52,955)0
($52,955)
ContributedFunds Non-Budgetary
Credit ProgramFinancingAccounts
$0 0000
000
00
0000
$0000
$0
$0 00
0000
$0
$00
0 000
00
$00
$0
ContributedFunds
Budgetary
$394,039 0000
195,588 00
111 0
8 15 00
$134 000
$589,761
$338,691 125
338,816
23,784 227,161
00
$589,761
$103,137 0
0(19)
91,679 20,298
329,981 (120)
$329,861 0
$329,861
Revolving FundsNon-BudgetaryCredit Program
FinancingAccounts
$0 0000
000
00
0000
$0000
$0
$0 00
0000
$0
$00
0 000
00
$00
$0

Combining Statement of Budgetary Resources
The accompanying notes are an integral part of these statements.
365
fy02
Department of Defense • Department of the Army For the years ended September 30, 2002 and 2001 ($ in thousands)
Budgetary Resources:A. Budget Authority:
Appropriations receivedBorrowing authorityContract authorityNet transfers (+/-)Other
B. Unobligated balance:Beginning of periodNet transfers, actual (+/-)Anticipated Transfers Balances
C. Spending authority from offsetting collections:Earned
CollectedReceivable from Federal sources
Change in unfilled customer ordersAdvance receivedWithout advance from Federal sources
Anticipated for the rest of year, without advancesTransfers from trust fundsSubtotal
D. Recoveries of prior year obligationsE. Temporarily not available pursuant to Public LawF Permanently not availableG Total Budgetary Resources
Status of Budgetary Resources:H. Obligations incurred:
DirectReimbursableSubtotal
I. Unobligated balance:ApportionedExempt from apportionmentOther available
J. Unobligated Balances Not AvailableK. Total, Status of Budgetary Resources
Relationship of Obligations to Outlays:L. Obligated Balance, Net - beginning of periodM. Obligated Balance transferred, net (+/-)N. Obligated Balance, Net - end of period:
Accounts receivableUnfilled customer order from Federal sourcesUndelivered ordersAccounts payable
O. Outlays:DisbursementsCollectionsSubtotal
P. Less: Offsetting receiptsQ. Net Outlays
General FundsBudgetary
$3,740,145 00
163,780 0
1,195,565 00
1,132,137 (32,021)
29,210 119,827
00
$1,249,153 00
(482)$6,348,161
$4,042,663 1,097,316 5,139,979
1,198,505 9,676
01
$6,348,161
$33,425 0
(209,922)(1,340,520)
917,013 537,206
5,181,820 (1,161,347)$4,020,473
0$4,020,473
FUSRAP Non-BudgetaryCredit Program
FinancingAccounts
$0 0000
000
00
0000
$0000
$0
$0 00
0000
$0
$00
0 000
00
$00
$0
FUSRAPBudgetary
$140,000 0000
3,445 00
12,603 (242)
0(2,241)
00
$10,120 000
$153,565
$140,983 10,157
151,140
2,425 000
$153,565
$37,865 0
(1)(2,626)
6,256 33,863
153,997 (12,603)
$141,394 0
$141,394
General FundsNon-BudgetaryCredit Program
FinancingAccounts
$0 0000
000
00
0000
$0000
$0
$0 00
0000
$0
$00
0 000
00
$00
$0
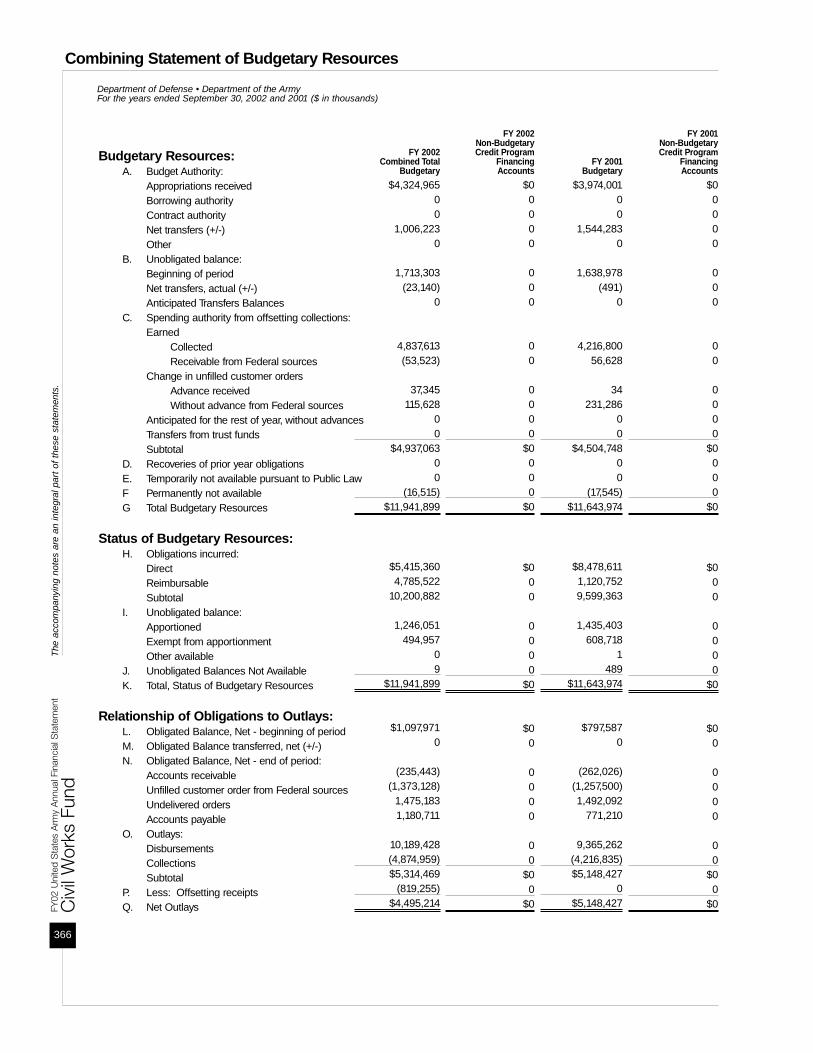
Civ
il W
orks
Fun
dFY
02 U
nite
d S
tate
s A
rmy
Ann
ual F
inan
cial
Sta
tem
ent
366
Combining Statement of Budgetary ResourcesT
he a
ccom
pany
ing
note
s ar
e an
inte
gral
par
t of t
hese
sta
tem
ents
.
Department of Defense • Department of the Army For the years ended September 30, 2002 and 2001 ($ in thousands)
Budgetary Resources:A. Budget Authority:
Appropriations receivedBorrowing authorityContract authorityNet transfers (+/-)Other
B. Unobligated balance:Beginning of periodNet transfers, actual (+/-)Anticipated Transfers Balances
C. Spending authority from offsetting collections:Earned
CollectedReceivable from Federal sources
Change in unfilled customer ordersAdvance receivedWithout advance from Federal sources
Anticipated for the rest of year, without advancesTransfers from trust fundsSubtotal
D. Recoveries of prior year obligationsE. Temporarily not available pursuant to Public LawF Permanently not availableG Total Budgetary Resources
Status of Budgetary Resources:H. Obligations incurred:
DirectReimbursableSubtotal
I. Unobligated balance:ApportionedExempt from apportionmentOther available
J. Unobligated Balances Not AvailableK. Total, Status of Budgetary Resources
Relationship of Obligations to Outlays:L. Obligated Balance, Net - beginning of periodM. Obligated Balance transferred, net (+/-)N. Obligated Balance, Net - end of period:
Accounts receivableUnfilled customer order from Federal sourcesUndelivered ordersAccounts payable
O. Outlays:DisbursementsCollectionsSubtotal
P. Less: Offsetting receiptsQ. Net Outlays
FY 2002Combined Total
Budgetary
$4,324,965 00
1,006,223 0
1,713,303 (23,140)
0
4,837,613 (53,523)
37,345 115,628
00
$4,937,063 00
(16,515)$11,941,899
$5,415,360 4,785,522
10,200,882
1,246,051 494,957
09
$11,941,899
$1,097,971 0
(235,443)(1,373,128)
1,475,183 1,180,711
10,189,428 (4,874,959)$5,314,469
(819,255)$4,495,214
FY 2001 Non-BudgetaryCredit Program
FinancingAccounts
$0 0000
000
00
0000
$0000
$0
$0 00
0000
$0
$00
0 000
00
$00
$0
FY 2001Budgetary
$3,974,001 00
1,544,283 0
1,638,978 (491)
0
4,216,800 56,628
34 231,286
00
$4,504,748 00
(17,545)$11,643,974
$8,478,611 1,120,752 9,599,363
1,435,403 608,718
1 489
$11,643,974
$797,587 0
(262,026)(1,257,500)1,492,092
771,210
9,365,262 (4,216,835)$5,148,427
0$5,148,427
FY 2002 Non-BudgetaryCredit Program
FinancingAccounts
$0 0000
000
00
0000
$0000
$0
$0 00
0000
$0
$00
0 000
00
$00
$0

Combining Statement of Financing
The accompanying notes are an integral part of these statements.
367
fy02
Department of Defense • Department of the Army For the years ended September 30, 2002 and 2001 ($ in thousands)
TransferFunds
$86,657
(3)
$86,654 0
$86,654
0(300)
00
($300)
$86,354
1,300 (7)
0
0
(86,156)
00
($84,863)
$1,491
Trust Funds
$789,011
0
$789,011 (819,255)($30,244)
011,014
00
$11,014
($19,230)
(17,465)00
819,255
(130,029)
00
$671,761
$652,531
Special Funds
$14,139
0
$14,139 0
$14,139
0(36)
00
($36)
$14,103
(1,852)00
0
31
00
($1,821)
$12,282
BorrowingAuthority
$4,164
(16,940)
($12,776)0
($12,776)
00
016,000
$16,000
$3,224
10,811 00
0
(14,173)
00
($3,362)
($138)
Resources Used to Finance Activities:
Budgetary Resources Obligated1. Obligations incurred2. Less: Spending authority from offsetting
collections and recoveries (-)3. Obligations net of offsetting collections and
recoveries4. Less: Offsetting receipts (-)5. Net obligations
Other Resources6. Donations and forfeitures of property7. Transfers in/out without reimbursement (+/-)8. Imputed financing from costs absorbed
by others9. Other (+/-)10. Net other resources used to finance
activities
11. Total resources used to finance activities
Resources Used to Finance Items not Part ofthe Net Cost of Operations
12. Change in budgetary resources obligated forgoods, services and benefits ordered but notyet providedUndelivered Orders (-)Unfilled Customer Orders
13. Resources that fund expenses recognized inprior periods
14. Budgetary offsetting collections and receiptsthat do not affect net cost of operations
15. Resources that finance the acquisition ofassets
16. Other resources or adjustments to netobligated resources that do not affect netcost of operationsLess: Trust or Special Fund ReceiptsRelated to Exchange in the Entity's Budget (-)Other (+/-)
17. Total resources used to finance itemsnot part of the net cost of operations
18. Total resources used to finance the netcost of operations

Civ
il W
orks
Fun
dFY
02 U
nite
d S
tate
s A
rmy
Ann
ual F
inan
cial
Sta
tem
ent
368
Combining Statement of FinancingT
he a
ccom
pany
ing
note
s ar
e an
inte
gral
par
t of t
hese
sta
tem
ents
.
Department of Defense • Department of the Army For the years ended September 30, 2002 and 2001 ($ in thousands)
TransferFunds
$0
0
00
$0
1,302 00
$1,302
$1,302
$2,793
Trust Funds
$0
0
0
00
$0
2,462 00
$2,462
$2,462
$654,993
Special Funds
$0
0
0
(7)0
($7)
15 00
$15
$8
$12,290
BorrowingAuthority
$0
0
0
00
$0
000
$0
$0
($138)
Components of the Net Cost of Operationsthat will not Require or Generate Resourcesin the Current Period:
Components Requiring or GeneratingResources in Future Periods:
19. Increase in annual leave liability20. Increase in environmental and disposal
liability21. Upward/Downward reestimates of credit
subsidy expense (+/-)22. Increase in exchange revenue receivable
from the public (-)23. Other (+/-)24. Total components of Net Cost of Operations
that will require or generate resources infuture periods
Components not Requiring or GeneratingResources:
25. Depreciation and amortization26. Revaluation of assets or liabilities (+/-)27. Other (+/-)28. Total components of Net Cost of Operations
that will not require or generate resources
29. Total components of net cost ofoperations that will not require orgenerate resources in the current period
30. Net Cost of Operations

Combining Statement of Financing
The accompanying notes are an integral part of these statements.
369
fy02
Department of Defense • Department of the Army For the years ended September 30, 2002 and 2001 ($ in thousands)
GeneralFunds
$5,139,977
(1,249,153)
$3,890,824 0
$3,890,824
292 (8,597)24,316
$743 $16,754
$3,907,578
41,842 149,037
0
0(2,092,171)
00
($1,901,292)
$2,006,286
ContributedFunds
$338,816
(135)
$338,681 0
$338,681
0 (830)
0
$0($830)
$337,851
(4,204)23
0
0(152,205)
00
($156,386)
$181,465
RevolvingFunds
$3,676,977
(3,660,713)
$16,264 0
$16,264
13 (80)
184,670
$0$184,603
$200,867
(43,420)6,162
0
013,085
00
($24,173)
$176,694
Resources Used to Finance Activities:
Budgetary Resources Obligated1. Obligations incurred2. Less: Spending authority from offsetting
collections and recoveries (-)3. Obligations net of offsetting collections and
recoveries4. Less: Offsetting receipts (-)5. Net obligations
Other Resources6. Donations and forfeitures of property7. Transfers in/out without reimbursement (+/-)8. Imputed financing from costs absorbed by
others9. Other (+/-)10. Net other resources used to finance activities
11. Total resources used to finance activities
Resources Used to Finance Items not Part of theNet Cost of Operations
12. Change in budgetary resources obligated forgoods, services and benefits ordered but not yetprovidedUndelivered Orders (-)Unfilled Customer Orders
13. Resources that fund expenses recognized in priorperiods
14. Budgetary offsetting collections and receipts thatdo not affect net cost of operations
15. Resources that finance the acquisition of assets16. Other resources or adjustments to net obligated
resources that do not affect net cost of operationsLess: Trust or Special Fund Receipts Related toExchange in the Entity's Budget (-)Other (+/-)
17. Total resources used to finance items not partof the net cost of operations
18. Total resources used to finance the net costof operations

Civ
il W
orks
Fun
dFY
02 U
nite
d S
tate
s A
rmy
Ann
ual F
inan
cial
Sta
tem
ent
370
Combining Statement of FinancingT
he a
ccom
pany
ing
note
s ar
e an
inte
gral
par
t of t
hese
sta
tem
ents
.
Department of Defense • Department of the Army For the years ended September 30, 2002 and 2001 ($ in thousands)
GeneralFunds
$00
0
(3,422)41,360
$37,938
423,090 0
465
$423,555
$461,493
$2,467,779
ContributedFunds
$00
0
0137
$137
130 00
$130
$267
$181,732
RevolvingFunds
$00
0
00
$0
48,535 00
$48,535
$48,535
$225,229
Components of the Net Cost of Operations thatwill not Require or Generate Resources in theCurrent Period:
Components Requiring or Generating Resourcesin Future Periods:
19. Increase in annual leave liability20. Increase in environmental and disposal liability21. Upward/Downward reestimates of credit subsidy
expense (+/-)22. Increase in exchange revenue receivable from the
public (-)23. Other (+/-)24. Total components of Net Cost of Operations that
will require or generate resources in future periods
Components not Requiring or GeneratingResources:
25. Depreciation and amortization26. Revaluation of assets or liabilities (+/-)27. Other (+/-)28. Total components of Net Cost of Operations that
will not require or generate resources
29. Total components of net cost of operationsthat will not require or generate resources inthe current period
30. Net Cost of Operations

Combining Statement of Financing
The accompanying notes are an integral part of these statements.
371
fy02
Department of Defense • Department of the Army For the years ended September 30, 2002 and 2001 ($ in thousands)
FY 2001Combined
$9,599,363
(4,504,749)
$5,094,614 (43,761)
$5,050,853
275 1,735
211,595
(26,044)$187,561
$5,238,414
(281,946)231,321
(169,635)
0 (1,540,367)
0(390,870)
($2,151,497)
$3,086,917
FY 2002Combined
$10,200,882
(4,937,063)
$5,263,819 (819,255)
$4,444,564
305 1,171
208,986
16,743 $227,205
$4,671,769
(2,705)152,974
0
819,255 (2,461,629)
00
($1,492,105)
$3,179,664
FUSRAP
$151,141
(10,119)
$141,022 0
$141,022
000
0$0
$141,022
10,283 (2,241)
0
0(11)
00
$8,031
$149,053
Resources Used to Finance Activities:
Budgetary Resources Obligated1. Obligations incurred2. Less: Spending authority from offsetting
collections and recoveries (-)3. Obligations net of offsetting collections and
recoveries4. Less: Offsetting receipts (-)5. Net obligations
Other Resources6. Donations and forfeitures of property7. Transfers in/out without reimbursement (+/-)8. Imputed financing from costs absorbed by
others9. Other (+/-)10. Net other resources used to finance activities
11. Total resources used to finance activities
Resources Used to Finance Items not Part of theNet Cost of Operations
12. Change in budgetary resources obligated forgoods, services and benefits ordered but not yetprovidedUndelivered Orders (-)Unfilled Customer Orders
13. Resources that fund expenses recognized in priorperiods
14. Budgetary offsetting collections and receipts thatdo not affect net cost of operations
15. Resources that finance the acquisition of assets16. Other resources or adjustments to net obligated
resources that do not affect net cost of operationsLess: Trust or Special Fund Receipts Related toExchange in the Entity's Budget (-)Other (+/-)
17. Total resources used to finance items not partof the net cost of operations
18. Total resources used to finance the net costof operations

Civ
il W
orks
Fun
dFY
02 U
nite
d S
tate
s A
rmy
Ann
ual F
inan
cial
Sta
tem
ent
372
Combining Statement of FinancingT
he a
ccom
pany
ing
note
s ar
e an
inte
gral
par
t of t
hese
sta
tem
ents
.
Department of Defense • Department of the Army For the years ended September 30, 2002 and 2001 ($ in thousands)
FY 2001Combined
$00
0
0103,175
$103,175
589,863 169,970 28,145
$787,978
$891,153
$3,978,070
FY 2002Combined
$00
0
(3,429)41,497
$38,068
475,534 0
465
$475,999
$514,067
$3,693,731
ComponentLevel
$00
0
00
$0
000
$0
$0
$149,053
Components of the Net Cost of Operations thatwill not Require or Generate Resources in theCurrent Period:
Components Requiring or Generating Resourcesin Future Periods:
19. Increase in annual leave liability20. Increase in environmental and disposal liability21. Upward/Downward reestimates of credit subsidy
expense (+/-)22. Increase in exchange revenue receivable from the
public (-)23. Other (+/-)24. Total components of Net Cost of Operations that
will require or generate resources in future periods
Components not Requiring or GeneratingResources:
25. Depreciation and amortization26. Revaluation of assets or liabilities (+/-)27. Other (+/-)28. Total components of Net Cost of Operations that
will not require or generate resources
29. Total components of net cost of operationsthat will not require or generate resources inthe current period
30. Net Cost of Operations
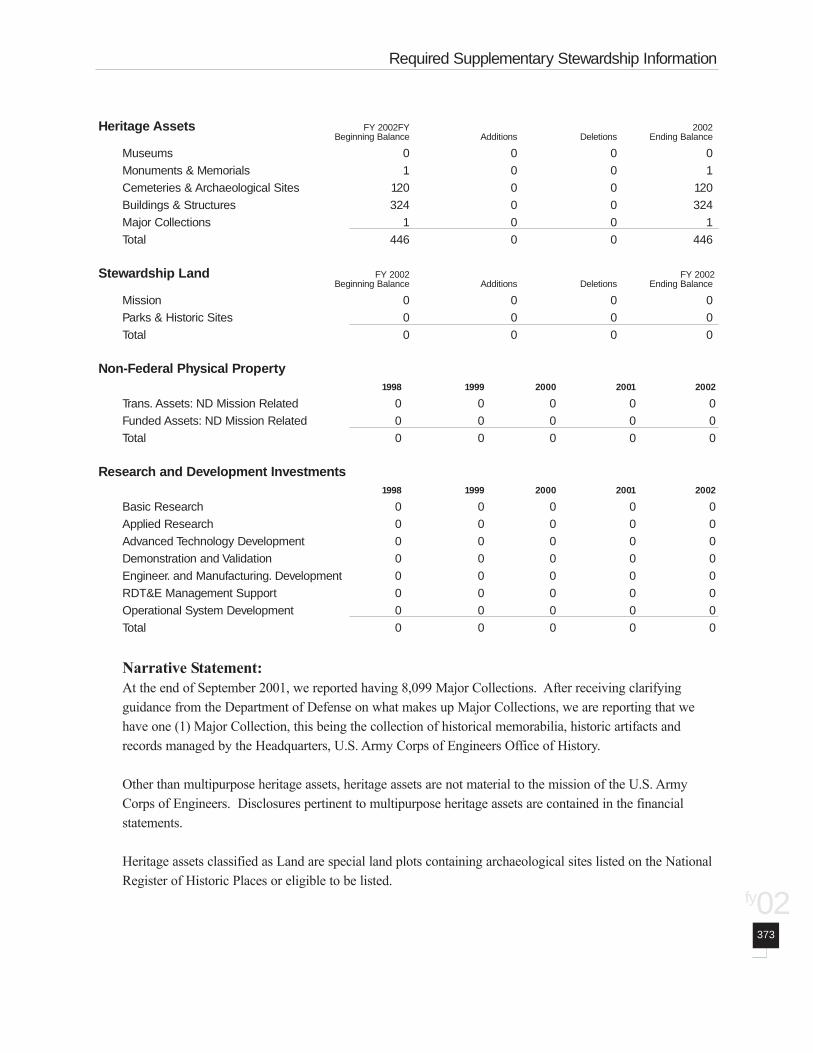
Heritage Assets FY 2002FY 2002Beginning Balance Additions Deletions Ending Balance
Museums 0 0 0 0Monuments & Memorials 1 0 0 1Cemeteries & Archaeological Sites 120 0 0 120Buildings & Structures 324 0 0 324Major Collections 1 0 0 1Total 446 0 0 446
Stewardship Land FY 2002 FY 2002Beginning Balance Additions Deletions Ending Balance
Mission 0 0 0 0Parks & Historic Sites 0 0 0 0Total 0 0 0 0
Non-Federal Physical Property1998 1999 2000 2001 2002
Trans. Assets: ND Mission Related 0 0 0 0 0Funded Assets: ND Mission Related 0 0 0 0 0Total 0 0 0 0 0
Research and Development Investments1998 1999 2000 2001 2002
Basic Research 0 0 0 0 0Applied Research 0 0 0 0 0Advanced Technology Development 0 0 0 0 0Demonstration and Validation 0 0 0 0 0Engineer. and Manufacturing. Development 0 0 0 0 0RDT&E Management Support 0 0 0 0 0Operational System Development 0 0 0 0 0Total 0 0 0 0 0
Narrative Statement:At the end of September 2001, we reported having 8,099 Major Collections. After receiving clarifyingguidance from the Department of Defense on what makes up Major Collections, we are reporting that wehave one (1) Major Collection, this being the collection of historical memorabilia, historic artifacts andrecords managed by the Headquarters, U.S. Army Corps of Engineers Office of History.
Other than multipurpose heritage assets, heritage assets are not material to the mission of the U.S. ArmyCorps of Engineers. Disclosures pertinent to multipurpose heritage assets are contained in the financialstatements.
Heritage assets classified as Land are special land plots containing archaeological sites listed on the NationalRegister of Historic Places or eligible to be listed.
Required Supplementary Stewardship Information
373
fy02

Civ
il W
orks
Fun
d
374
FY02
Uni
ted
Sta
tes
Arm
y A
nnua
l Fin
anci
al S
tate
men
t
Heritage assets on display are assumed to be in adequate condition for display purposes, consistent with theirorigins, unless otherwise noted. Reported heritage assets are free of material conditions that are counter tosafeguarding, adequately protecting, and properly managing those assets; they have not degraded materiallywhile under the care of the U.S. Army Corps of Engineers. The existence of most of the un-categorizedheritage assets is known informally to be adequate for display purposes; however, the condition of many un-categorized assets are unknown.
Cemeteries and Archeological Sites are archeological properties listed on, or eligible for, the NationalRegister of Historic Places. These archeological assets cover almost the entire range of human occupation ofthe Continental United States beginning with the Kennewick Man Discovery Site in Washington State, datingto approximately 10,000 years before present, to archeological remains of early European-Americansettlements such as Fort Independence in Georgia.
Buildings and Structures include a range of historic resources from a covered bridge in the SacramentoDistrict to early farming structures in the Savannah District. It also includes some non-traditional structuressuch as a snag boat that operated on the Mississippi River.

Deferred Maintenance$ in thousands
Real Property Annual Deferred SustainmentRequired Actual Difference
Buildings, Structures, and Utilities $702,000 $702,000 $0
Annual Deferred Sustainment TrendFY 2000 FY 2001 FY 2002 FY 2003 FY 2004
Buildings and Structures $329,000 $415,000 $702,000 $884,000 Not Available
Real Property Restoration and Modernization RequirementsEnd FY 2001 End FY 2002 Change
Buildings, Structures, and Utilities $415,000 $702,000 $287,000
Military Equipment Deferred Maintenance AmountsFY 2002Aircraft 0Ships 0Missiles 0Combat Vehicles 0Other Weapons Systems 0Total 0
Narrative Statement: Deferred maintenance at Civil Works water resources projects operated andmaintained by the U.S. Army Corps of Engineers was determined through the budget development processwhereby operations managers identify the operation and maintenance (O&M) needs at each project in theCivil Works inventory. O&M needs are based on inspections of project features, engineering analyses andhistorical experience.
Required Supplementary Information
375
fy02

Civ
il W
orks
Fun
d
376
FY02
Uni
ted
Sta
tes
Arm
y A
nnua
l Fin
anci
al S
tate
men
t
Schedule, Part A DoD Intra-governmental Treasury Fund Balance Accounts LoansAsset Balances ($ Amounts in Thousands) Index with Treasury Receivable Receivable Investments Other
Unidentifiable Federal Agency Entity (Other than DoD entities) 0 $0
The Judiciary 10 $16
Department of Agriculture 12 $2,842
Department of Commerce 13 $3,350
Department of the Interior 14 $304,811
Department of Justice 15 $18,159
Department of Labor 16 $4
Navy General Fund 17 $2,073
United State Postal Service 18 $703
Department of State 19 $847
Department of the Treasury 20 $2,543,957 $18,810 $2,269,086
Army General Fund 21 $1,077
Office of Personnel Management 24 $0
Social Security Administration 28 $3
Library of Congress 3 ($2)
Nuclear Regulatory Commission 31 $14
Smithsonian Institution 33 $181
Department of Veterans Affairs 36 $20
Government Printing Office 4 $0
U.S. Equal Employment Opportunity Commission 45 $0
General Service Administration 47 $333
National Science Foundation 49 ($126)
General Printing Office 5 $9
Air Force General Fund 57 $42
Federal Emergency Management Agency 58 $29,552
Railroad Retirement Board 60 $10
Tennessee Valley Authority 64 $256
Environmental Protection Agency 68 $28,442
Department of Transportation 69 $13,970
Agency for International Development 72 $1,802
American Battle Monuments 74 $31
Department of Health and Human Services 75 $611
National Aeronautics and Space Administration 80 $1,757
Department of Housing and Urban Development 86 $5
Department of Energy 89 $260
Independent Agencies 95 $98,009
US Army Corps of Engineers 96
Other Defense Organizations General Funds 97 $98
Other Defense Organizations Working Capital Funds 97-4930 $60
Army Working Capital Fund 97-4930.001 $38
Navy Working Capital Fund 97-4930.002 $84
Totals: $2,543,957 $528,151 $2,269,086

Required Supplementary Information
377
fy02
Schedule, Part B DoD Intra-governmental Entity Treasury Accounts Debts/BorrowingsLiabilities ($ Amounts in Thousands) Index Payable From Other Agencies Other
Department of Agriculture 12 $1,394 $321
Department of Commerc 13 $4,969 $142
Department of the Interior 14 $14,819 $4,812
Department of Justice 15 $397 $7
Department of Labor 16 $54 $40,652
Navy General Fund 17 $1,777
United States Postal Service 18 $1 $31
Department of State 19 $482 $256
Department of the Treasury 20 $1,235 $24,667 $1,075,277
Army General Fund 21 $5,616 $118
Office of Personnel Management 24 $145 $13,702
Social Security Administration 28 $30
Library of Congress 3 $65
Department of Veterans Affairs 36 $37
Government Printing Office 4 $109
U.S. Equal Employment Opportunity Commission 45 $3
General Service Administration 47 $35,950 $110
Air Force General Fund 57 $89
Federal Emergency Management Agency 58 $11 $19
Tenessee Valley Authority 64 $2,902 $0
Environmental Protection Agency 68 $263 $4
Department of Transportation 69 $210 $29
Small Business Administration 73 $1
Department of Health and Human Services 75 $353 $58
Department of Housing and Urban Development 86 $6,163
Narional Archives and Records Administration 88 $2
Department of Energy 89 $2,782 $1,917
Department of Education 91 $2,563
Independent Agencies 95 $724
Other Defense Organizations General Funds 97 $1,738
Other Defense Organizations Working Capital Funds 97-4930 $8,328
Army Working Capital Fund 97-4930.001 $80
Navy Working Capital Fund 97-4930.002 $608
Air Force Working Capital Fund 97-4930.003 $3
Totals: $84,413 $24,667 $1,146,943
Governmental Transactions from the Consolidating Trial Balance

Civ
il W
orks
Fun
d
378
FY02
Uni
ted
Sta
tes
Arm
y A
nnua
l Fin
anci
al S
tate
men
t
Schedule, Part C DoD Intra-governmental Revenue and RelatedCosts ($ Amounts in Thousands) Treasury Index Earned Revenue
The Judiciary 10 $35
Executive Office of the President 11 $4
Department of Agriculture 12 $9,743
Department of Commerce 13 $5,531
Department of the Interior 14 $36,899
Department of Justice 15 $80,980
Department of Labor 16 $7
Navy General Fund 17 $2,224
United States Postal Service 18 $3,043
Department of State 19 $8,240
Department of the Treasury 20 $4,571
Army General Fund 21 $4,017
Office of Personnel Management 24 $0
Social Security Administration 28 $8
Nuclear Regulatory Commission 31 $159
Smithsonian Institution 33 $762
Department of Veterans Affairs 36 $2,266
Government Printing Office 4 $0
U.S. Equal Employment Opportunity Commission 45 $4
General Service Administration 47 $773
National Science Foundation 49 $1,839
General Printing Office 5 $1,384
Air Force General Fund 57 $689
Federal Emergency Management Agency 58 $92,168
Railroad Retirement Board 60 $25
Tennessee Valley Authority 64 $369
Environmental Protection Agency 68 $134,102
Department of Transportation 69 $28,236
Agency for International Development 72 $4,661
Small Business Administration 73 $3
American Battle Monuments 74 $144
Department of Health and Human Services 75 $6,470
National Aeronautics and Space Administration 80 $8,930
Department of Housing and Urban Development 86 $121
Department of Energy 89 $13,355
Department of Education 91 $37
Independent Agencies 95 $163,321
Other Defense Organizations General Funds 97 $1,671
Other Defense Organizations Working Capital Funds 97-4930 ($396)
Army Working Capital Fund 97-4930.001 $64
Navy Working Capital Fund 97-4930.002 ($24)
Totals: $616,435

Required Supplementary Information
379
fy02
Schedule, Part E DoD Intra-governmental TreasuryNon-exchange Revenues ($ Amounts in Thousands) Index Transfers In Transfers Out
Department of Agriculture 12 $13
Department of the Interior 14 $63,941 $103
Department of Justice 15 $1
Department of the Treasury 20 $756,107 $770,287
Army General Fund 21 $0
General Service Administration 47 $55
Tennessee Valley Authority 64 $61
Department of Transportation 69 $1,406 $13,305
Totals: $821,467 $783,812
Governmental Transactions from the Consolidating Trial Balance

Civ
il W
orks
Fun
d
380
FY02
Uni
ted
Sta
tes
Arm
y A
nnua
l Fin
anci
al S
tate
men
t

381
fy02
January 6, 2003
MEMORANDUM FOR COMMANDER, U.S. ARMY CORPS OF ENGINEERSSUBJECT: Independent Auditor's Report on the U.S. Army Corps of Engineers, Civil Works, Fiscal
Year 2002 Principal Financial Statements (Report No. D-2003-043)
The Office of Management and Budget (OMB) in implementing the Chief Financial Officers (CFO) Act of1990, as amended, has required the Office of the Inspector General of the Department of Defense to audit theaccompanying Consolidated Balance Sheet of the U.S. Army Corps of Engineers, Civil Works, (Corps ofEngineers) as of September 30, 2002 and 2001, the related Consolidated Statements of Net Cost and Changesin Net Position, and the Combined Statements of Financing and Budgetary Resources for the fiscal yearsthen ended. The financial statements are the responsibility of the Corps of Engineers management. TheCorps of Engineers management is also responsible for implementing effective internal control and forcomplying with laws and regulations. We are also including the required reports on internal control andcompliance with laws and regulations.
Disclaimer of Opinion on the Financial Statements Our audit of the Corps of Engineers FY 2002 Financial Statements was limited to the Consolidated BalanceSheet. Time constraints precluded the Corps of Engineers from providing sufficient audit-ready evidentialmaterial for the auditors to complete the audit. Therefore, we are unable to express, and we do not express,an opinion on the Corps of Engineers FY 2002 Consolidated Balance Sheet. We did not audit the Corps ofEngineers FY 2002 Consolidated Statements of Net Cost and Changes in Net Position and the CombinedStatements of Financing and Budgetary Resources; therefore, we do not express an opinion on thosestatements.
Although we were not able to complete the audit of the Corps of Engineers FY 2001 Consolidated BalanceSheet, our limited review identified material internal control weaknesses related to General Property, Plant,and Equipment; Accounts Payable - Public; and general and application controls. Therefore, we are unableto express an opinion on the Corps of Engineers FY 2001 financial statements.
Summary of Internal Control In planning and performing our audit, we considered the Corps of Engineers internal control over financialreporting and compliance. We did this to determine our procedures for auditing the financial statements andto comply with OMB guidance, but not to express an opinion on internal control. Accordingly, we do notexpress an opinion on internal control over financial reporting and compliance because time constraintsprecluded the Corps of Engineers from providing sufficient audit-ready evidential material for the auditors toassess internal control over financial reporting and compliance or to follow up on previously identified
INSPECTOR GENERALDEPARTMENT OF DEFENSE
400 ARMY NAVY DRIVEARLINGTON, VIRGINIA 22202-4704
A Regular Statement and Account of the Receipts and Expenditures of all public Money shall be publishedfrom time to time. —Constitution of the United States Article I, Section 9

Civ
il W
orks
Fun
d
382
FY02
Uni
ted
Sta
tes
Arm
y A
nnua
l Fin
anci
al S
tate
men
t
reportable conditions1 related to: General Property, Plant, and Equipment and general and applicationcontrols of the Corps of Engineers Financial Management System (CEFMS). However, possible materialinternal control weaknesses were identified in the Compilation of the Financial Statements, CapitalizedEquipment, and Accounts Payable-Public.
A material weakness is a condition that precludes the entity's internal control from providing reasonableassurance that misstatements, losses, or noncompliance that are material in relation to the financial statementswould be prevented or detected on a timely basis. Our internal control work would not necessarily discloseall material weaknesses. See the Attachment for additional details on possible material internal controlweaknesses identified during the FY 2002 CFO audit and other previously identified material internal controlweaknesses.
Summary of Compliance With Laws and RegulationsOur work to determine compliance with selected provisions of the applicable laws and regulations waslimited because time constraints precluded the Corps of Engineers from providing sufficient audit-readyevidential material for the auditors to complete the review. However, our limited review of the FY 2002Balance Sheet revealed that the Corps of Engineers was not compliant with the Federal AccountingStandards Advisory Board's Statement of Federal Financial Accounting Standard No. 6, "Accounting forProperty, Plant, and Equipment," and the Department of Defense Federal Management Regulation, volume 4,chapter 12, "Unearned Revenue and Other Liabilities." In previously issued audit reports, the GeneralAccounting Office (GAO) and the Army Audit Agency (AAA) noted instances of noncompliance with theFederal Managers' Financial Integrity Act of 1982; OMB Circular A-123, "Management Accountability andControl;" OMB Circular A-130, "Management of Federal Information Resources;" OMB Circular A-127,"Federal Management Systems;" and the Federal Financial Management Improvement Act of 1996. Due totime constraints, we were unable to follow up on instances of noncompliance. Therefore, we did notdetermine whether the Corps of Engineers was in compliance with all applicable laws and regulations relatedto financial reporting. See the Attachment for additional details on compliance with laws and regulations. We caution that other noncompliance may have occurred and not been detected. Further, the results of ourlimited procedures may not be sufficient for other purposes. Our objective was not to express an opinion oncompliance with applicable laws and regulations.
1 Reportable conditions are matters coming to the auditor's attention that, in his or her judgment, should be communicated to management because theyrepresent significant deficiencies in the design or operation of internal control, which could adversely affect the organization's ability to initiate, record,process, and report financial data consistent with the assertions of management in financial statements.
A Regular Statement and Account of the Receipts and Expenditures of all public Money shall be publishedfrom time to time. —Constitution of the United States Article I, Section 9

Opinion Report
383
fy02
Management ResponsibilityManagement is responsible for:
preparing the financial statements in conformity with generally accepted accounting principles;
establishing, maintaining, and assessing internal control to provide reasonable assurance that the broadcontrol objectives of the Federal Managers' Financial Integrity Act of 1982 are met;
ensuring that the Corps of Engineers financial management systems substantially comply with the FederalFinancial Management Improvement Act of 1996 requirements; and
complying with applicable laws and regulations.
David K. SteensmaDeputy Assistant Inspector General
for Auditing
A Regular Statement and Account of the Receipts and Expenditures of all public Money shall be publishedfrom time to time. —Constitution of the United States Article I, Section 9

Civ
il W
orks
Fun
d
384
FY02
Uni
ted
Sta
tes
Arm
y A
nnua
l Fin
anci
al S
tate
men
t
Reports on Internal Control and Compliance with Laws andRegulations
Internal ControlManagement is responsible for implementing effective internal control and for providing reasonableassurance that accounting data are accumulated, recorded, and reported properly; and that assets aresafeguarded. We did not perform tests of the Corps of Engineers internal control over financial reporting andwe did not obtain sufficient evidence to support or express an opinion on internal control because timeconstraints precluded the Corps of Engineers from providing sufficient audit-ready evidential matter for theauditors to assess internal control on financial reporting and compliance or to follow up on previouslyidentified reportable conditions. However, our limited review of the Corps of Engineers FY 2002 BalanceSheet revealed material internal control deficiencies in the Compilation of the Financial Statements,Capitalized Equipment, Accounts Payable-Public, and general and application controls.
Compilation of the Financial Statements. The Corps of Engineer’s processes and financial managementsystems used to compile the FY 2002 Financial Statements were substantially in compliance with the U.S.Government Standard General Ledger. However, the controls over the process used to compile the financialstatements were not adequate, resulting in undocumented modifications to the financial data used to preparethe FY 2002 financial statements. In addition, journal vouchers used to make accounting adjustments wereunsupported and inadequately controlled.
Equipment. The Corps of Engineers was unable to adequately explain approximately $49 million ofdifferences between the equipment universe and the amount reported in the FY 2002 financial statements.Internal control over equipment was not adequate to ensure that Corps of Engineers districts maintainsupporting documentation throughout a capitalized asset's entire useful or depreciable life.
Accounts Payable - Public. During the FY 2001 and FY 2002 CFO audits, the Corps of Engineers couldnot demonstrate that CEFMS captured and reported accounts payable transactions in the proper period. Inaddition, CEFMS does not recognize liabilities in accordance with Statement of Federal FinancialAccounting Standards No. 1, "Accounting for Selected Assets and Liabilities," which requires that an accountpayable be established when goods or services are received. Instead, CEFMS does not allow an accountpayable to be recognized until an obligating document is entered into the system, regardless of when thegoods or services were received. As a result, the Corps of Engineers could not ensure that its accountspayable were not materially misstated.
General and Application Controls. The General Accounting Office (GAO) Report, GAO-01-89, "FinancialManagement: Significant Weaknesses in Corps of Engineers Computer Controls," dated October 11, 2000,identified significant vulnerabilities and risks associated with CEFMS and its applications. GAO performedfollowup tests of the general and application controls and issued a report, GAO-02-589, "Corps of EngineersMaking Improvements, But Weaknesses Continue," dated June 10, 2002. GAO stated that continuing andnewly identified vulnerabilities involving general and application computer controls continue to impair the

Opinion Report
385
fy02
Corps of Engineers' ability to ensure the reliability, confidentiality, and availability of financial and sensitivedata. GAO also stated that such vulnerabilities increased risks to other Department of Defense networks andsystems to which the Corps of Engineers' network was linked.
The Army Audit Agency (AAA) Report, AA 01-319, "Corps of Engineers Financial Management SystemGeneral and Applications Controls," dated June 26, 2001, stated that the Corps of Engineers did notimplement an effective security management program or service continuity controls to ensure that critical andsensitive data are protected, and critical operations continue without interruption when unexpected eventshappen. The AAA also stated that CEFMS internal control was not adequate for financial statementsauditing purposes. In AAA Report, A-2002-0610-FFC, "Corps of Engineers Financial Management SystemGeneral and Applications Controls," dated September 30, 2002, AAA again cited weaknesses in the computergeneral control areas of entity-wide security and service continuity and stated that these areas continue toimpair the ability of the Corps of Engineers to ensure the reliability, confidentiality, and availability offinancial and sensitive data contained in the system.
Indicators of Fraud and Illegal Acts. The American Institute of Certified Public Accountants Statement ofAuditing Standard No. 82, "Consideration of Fraud in a Financial Statement Audit," December 1997, requiresauditors to assess the risk of material misstatement due to fraud or illegal acts in order to provide reasonableassurance that fraud or illegal acts material to the financial statements are detected.
Our audit procedures were limited due to the Corps of Engineer’s deficiencies in financial management andaccounting systems, audit trails, and control over assets. Therefore, we were not able to obtain sufficientevidence to provide reasonable assurance that fraud or illegal acts were detected. We are unable to report theeffect that fraud risk factors had on the FY 2002 Corps of Engineers Financial Statements. Nonetheless, theCorps of Engineers financial management deficiencies are indications of internal control weaknesses thatcould impact the ability of the Corps of Engineers to monitor, detect, and investigate fraud or theft of assets.A risk of material misstatements due to fraud or illegal acts will continue to be present until internal controldeficiencies within the Corps of Engineers are remedied.
Report on Compliance with Laws and RegulationsManagement is responsible for compliance with existing laws and regulations related to financial reporting.Our work to determine compliance with selected provisions of the applicable laws and regulations waslimited because time constraints precluded the Corps of Engineers from providing sufficient audit-readyevidential material for the auditors to complete the review of compliance with laws and regulations.However, our limited review of the FY 2002 Balance Sheet revealed instances of noncompliance, and GAOand AAA noted instances of noncompliance in previously issued audit reports. Due to time constraints, wewere unable to complete our review of previously identified noncompliances. Therefore, we did notdetermine whether the Corps of Engineers was in compliance with all applicable laws and regulations relatedto financial reporting. Our objective was not to express, and we do not express, an opinion on compliancewith applicable laws and regulations.
The Corps of Engineers did not classify and report Construction in Progress costs in accordance with theFederal Accounting Standards Advisory Board's Statement of Federal Financial Accounting Standard No. 6.

Civ
il W
orks
Fun
d
386
FY02
Uni
ted
Sta
tes
Arm
y A
nnua
l Fin
anci
al S
tate
men
t
The auditors identified 76 sample items, valued at $669 million, that should not have been reported inConstruction in Progress. The charges represented items that should have been expensed or that had beencompleted prior to September 30, 2002, and should have been transferred to other accounts.
CEFMS does not recognize liabilities in accordance with Statement of Federal Financial AccountingStandards No. 1, "Accounting for Selected Assets and Liabilities," which requires that an account payable beestablished when goods or services are received.
Auditors also noted that the Corps of Engineers was not reporting Other Liabilities in accordance with theDepartment of Defense Financial Management Regulation, volume 4, chapter 12, which requires that theDeferred Credit account be used only with the permission of the Office of the Under Secretary of Defense(Comptroller)/Chief Financial Officer and to represent revenue received from others, but not yet earned. TheCorps of Engineers did not have permission to use the Deferred Credit account and had not received therevenue when the account was used. Therefore, in FY 2002, the Corps of Engineers reclassified about $800million to the Other Liabilities account and disclosed the adjustment in the FY 2002 Notes to the FinancialStatements. But the Corps of Engineers did not adjust the FY 2001 Deferred Credit account or revise the FY2001 Notes to the Financial Statements for comparative purposes.
The Corps of Engineers is required to comply with the following financial management systems reportingrequirements.
The Federal Financial Management Improvement Act of 1996 is intended to advance Federal financialmanagement by ensuring that the Federal financial management systems can and do provide reliable,consistent disclosure of financial data that is uniform across the Federal Government from year to year,consistently using professionally-accepted accounting standards. It is also intended to provide the basisfor ongoing use of reliable financial information in program management and in oversight by thePresident, the Congress, and the public. The Federal Financial Management Improvement Act requireseach agency to implement and maintain systems that comply substantially with Federal financialmanagement systems requirements, applicable Federal accounting standards, and the U.S. GovernmentStandard General Ledger at the transaction level; requires auditors to report on the agency compliancewith the Federal Financial Management Improvement Act; and requires agency heads to determinewhether their financial management systems comply with the Federal Financial ManagementImprovement Act based on audit reports and other information and to develop remediation plans and filethem with OMB if the financial management systems do not comply with Federal Financial ManagementImprovement Act.
The Federal Managers' Financial Integrity Act of 1982 requires agencies to evaluate the systems and toannually report whether those systems are in compliance with applicable requirements. When systems arenot in compliance, the statement must include a report of internal accounting and administrative controlmaterial weaknesses and plans and a schedule for correcting the material weaknesses.
OMB Circular A-123, revised June 21, 1995, requires agencies and individual Federal managers to takesystematic and proactive measures to: assess the adequacy of management controls in Federal programsand operations, identify needed improvements, take corresponding corrective actions, and report annuallyon management control.

Opinion Report
387
fy02
OMB Circular A-130, Appendix III, establishes a minimum set of controls to be included in Federalautomated information security programs, assigns Federal agency responsibilities for the security ofautomated information, and links agency information security programs and agency management controlsystems established in accordance with OMB Circular A-123. Agencies should implement and maintaintheir automated security programs to ensure that adequate security is provided for all agency informationcollected, processed, transmitted, stored, or disseminated in general support systems and majorapplications.
OMB Circular A-127, revised July 23, 1993, requires agencies to develop, operate, evaluate, and reporton financial management systems. It also requires that financial management systems provide complete,reliable, consistent, timely, and useful information.
According to prior GAO and AAA audit reports, the Corps of Engineers did not fully comply with theFederal Managers' Financial Integrity Act and OMB Circulars A-123 and A-130 requirements to protect theintegrity of its financial management systems, identify needed improvements, and take correspondingcorrective actions. According to AAA, the Corps of Engineers does not comply with the Federal FinancialManagement Improvement Act because the lack of computer controls impairs the Corps of Engineers' abilityto ensure the reliability, confidentiality, and availability of financial and sensitive data. The Corps ofEngineers' remediation plan has been requested but not received as of December 2002. According to GAOand AAA, the continued CEFMS general and application computer controls vulnerabilities impair the abilityof the Corps of Engineers to ensure reliability, confidentiality, and availability of financial and sensitive data,as required by OMB Circular A-127.
Federal agencies reporting under the Government Management Reform Act of 1994 are to follow accountingstandards and concepts adopted by OMB, Department of the Treasury, and GAO. OMB Bulletin 01-09,"Form and Content of Agency Financial Statements," requires the Statement of Net Cost to present costs bymajor programs. However, the Corps did not fully implement the requirements established by OMB for itsFY 2002 Statement of Net Cost. Instead, the Corps presented the statement by appropriation as required bythe DoD Financial Management Regulation. The DoD Financial Management Regulation, whichimplements the OMB bulletins for DoD, requires the Statement of Net Cost to be presented by program unitsor appropriation groupings.
Audit DisclosuresWe did not conduct followup work related to the deficiencies identified in the FY 2002 Corps of Engineersfinancial statement audit related to General Property, Plant, and Equipment. Time constraints precluded theCorps of Engineers from providing sufficient audit-ready evidential material for the auditors to complete theaudit. Unfinished audit work will be completed as other agreed-upon procedures.

Civ
il W
orks
Fun
d
388
FY02
Uni
ted
Sta
tes
Arm
y A
nnua
l Fin
anci
al S
tate
men
t

fy02United States Army Annual Financial StatementTr a n s f o r m i n g t h e A r m y : I m a g i n a t i o n • I n n o v a t i o n • I n i t i a t i v e