Embed Size (px)
Citation preview
VOL. 2, NO. 3, March 2012 ISSN 2222-9833
ARPN Journal of Systems and Software ©2009-2011 AJSS Journal. All rights reserved
http://www.scientific-journals.org
84
A Novel Approach for Evaluating Software Testing Techniques for Reliability
1 Sheikh Umar Farooq , 2 S. M. K Quadri 1 Ph. D. Candidate, Department of Computer Sciences, University of Kashmir, Srinagar, India
2 Director Department of Computer Sciences, University of Kashmir, Srinagar, India 1 [email protected], [email protected]
ABSTRACT
One of the major goals of software testing is to increase reliability of the software. As pointed out by many studies, fault detection does not necessarily increase the reliability of the software when all failures are considered to be equivalent to one another. Accordingly, we need to evaluate software testing techniques to check which technique is more suitable and effective in terms of increasing confidence by reducing risk (by detecting and isolating faults which affect reliability most). We here present a novel experiment which compares three defect detection techniques for reliability. Preliminary results suggest that testing techniques differ in terms of their ability to reduce risk in the software.
Keywords: Software Testing Techniques, Software Reliability, Software Risk.
1. INTRODUCTION
Software reliability is a quantitative measure used in accessing the quality of software and is significantly considered in software development. Software reliability is a key quality attribute as identified by quality models like ISO, McCall, and FURPS etc. It is a user-oriented view of software quality and is also most readily quantified and measured. Software reliability is defined as the probability of software to perform its required functions (output that agrees with specifications) without failure under stated conditions (specified environment) for a specified period of time. Developing reliable software is one of the most difficult problems facing the software industry. Schedule pressure, resource limitations, unrealistic requirements and many other factors can all negatively impact software reliability [18]. To achieve reliability, we should use software reliability engineering techniques. Having attracted major attentions in past years from academic circles as well as industry, software reliability engineering techniques are classified into following areas: fault avoidance, fault removal, fault tolerance, and fault prediction [12].
Traditionally, software reliability is achieved by fault removal techniques (verification and validation techniques) which include software testing, to detect and eliminate software faults. As the main fault removal technique, software testing is one of the most effort intensive and time consuming activity during software development [2]. One way to achieve 100% reliability in software is to go for exhaustive testing. Exhaustive testing which tests a system with all possible inputs (valid as well as invalid), is generally not applicable, as the input domain
is usually very large, even infinite. So we have to use other testing methods in order to bring the software to an acceptable level of quality. We would like to select a testing technique that will detect maximum possible detects in an efficient manner. However, fault finding ability measure is only useful for evaluating testing techniques when the goal of testing is to gain confidence that the program is free from faults. Fault detection does not necessarily inspire confidence. It is not necessary that a software testing method which will find most faults in the software will also increase the reliability more than other methods. The impact of the failure should be taken into account. Most previous evaluations of the effectiveness of software testing techniques have considered all failures to be equivalent to one another, regardless of their severity. We all know that one important goal of software testing should be to measure the dependability of tested software and also to increase it. Alternatively, another main objective of testing is to increase our confidence in the software. So there are two main goals in testing software: To achieve adequate quality (systematic testing/debug testing); the objective is to probe the software for defects so that these can be removed and to assess existing quality (statistical testing); the objective is to gain confidence that the software is reliable. The names are arbitrary, and most testing techniques address both goals to some degree [8]. So it is evident that debug testing also has the ability to reduce the risk in software by increasing the reliability of the software under test. In order to increase reliability, we
VOL. 2, NO. 3, March 2012 ISSN 2222-9833
ARPN Journal of Systems and Software ©2009-2011 AJSS Journal. All rights reserved
http://www.scientific-journals.org
85
should not only strive to discover maximum defects possible, we should also strive to expose those faults which affect reliability most. One sure thing is that we have to do systematic testing for testing software as it is necessary for things like functionality, correctness etc. There is multitude of software testing techniques which can be used in systematic testing. Our approach should be to select a technique which has the maximum potential to increase the confidence in the software. We do not have adequate knowledge about their relative quantitative and qualitative statistics. Therefore, it will be interesting to evaluate effectiveness of different testing techniques for reliability. In other words, testing techniques should be evaluated and compared in terms of effectiveness in detecting different failures types, and then checking the reliability increase. Techniques are equally effective at observing faults and isolating failures. But that does not mean that they find same types of failures. We are unaware of their capability of increasing the confidence in the software. We would like to be able to compare testing strategies in a way that allows us to say that if a system has been tested using technique T1, it is likely to have less risk (more reliable) associated with its use than if it has been tested using technique T2. This will also help us to understand what types of faults are mostly targeted by a particular testing technique. So basically we will try to find answers to following research questions:
RQ1: Does testing methods differ from each other in terms of reliability improvement? RQ2: If yes, which methods among them enhance reliability the most (based on RQ1)?
This paper is organized as follows: Section 2 presents the background and related work, Section 3 discusses statistical and systematic testing, Section 4 gives the description of the experiment which includes testing techniques, programs and faults and methodology used in the experiment which are presented in subsections 4.1, 4.2 and 4.3 respectively. Section 5 presents the experiment procedure and the results. Threats to validity are discussed in section 6. Section 7 discusses the experiment and results and Section 8 presents conclusion and future work of the experiment. 2. BACKGROUND AND RELATED WORK
An important aspect of testing is to make software quality and its characteristics visible which include the reliability of the software. Software testing has been widely used to improve software reliability, not only because verification is not practical yet at this stage, but
also because sophisticated testing techniques have been developed to meet different levels of reliability requirements. As we already know software testing has many goals which include the goal of increasing confidence (reducing risk) in the software. Different goals of testing to assess risk can be distinguished as [7]: 1. Testing to detect risk: In addition to counting the number of failures that occur during testing, one keeps track of the cost of those failures. Testing technique A will be considered more effective than testing technique B if the (expected) total cost of failures detected during test is higher for A than for B. 2. Testing and debugging to reduce risk: It is further assumed that each failure that occurs leads to the correction of the fault that caused that failure, thereby reducing the risk associated with the corrected software and results in the increase of software reliability. Testing technique A will be considered more effective than testing technique B if A reduces the risk more than B does, thus resulting in less risky software. 3. Testing to estimate risk: In estimating software reliability, it is assumed that some faults will remain in the software. The goal is to estimate the probability that the software will fail after deployment (during some specified time). Here, we will say that testing technique A is better than testing technique B (for a given technique of estimating risk) if A provides more accurate estimates of risk than B.
We are interested in evaluating software testing techniques for their ability to detect and reduce the risk. It is not sufficient to detect the failures to reduce risk, as only by removing root cause of the failures (faults) we can reduce the risk in the program.
Most previous studies of the effectiveness of testing methods used the probability of causing a failure, and thus finding a defect, as a measure of the effectiveness of a test series [15]. They have employed such measures of test effectiveness as the likelihood of discovering at least one fault (i.e., the likelihood of at least one failure occurring), the expected number of failures that occur during test, the number of seeded faults discovered during test, and the mean time until the first failure, or between failures. This seems inappropriate when considering testing as a means for improving confidence in the software: what really matters is the reliability of the delivered software, hence the improvement that is obtained by applying the given testing method. [11] [4] and [8] instead adopted a different measure of test effectiveness; the increment in reliability that would be obtained. Many studies in the past have incorporated the concept of weightage/cost into the evaluation of testing techniques. In the work of [16], [9] and [13] the input domain is divided, using some partition testing strategy, and a cost ci is associated a priori with each sub domain. A failure of any element of the ith sub domain is assumed to cost ci.
VOL. 2, NO. 3, March 2012 ISSN 2222-9833
ARPN Journal of Systems and Software ©2009-2011 AJSS Journal. All rights reserved
http://www.scientific-journals.org
86
However, this is not a realistic approximation of reality. In general, for the sub domains induced by the testing strategies commonly studied and in use, the consequences of failure for two different elements of the same sub domain may be very different. Furthermore, most sub domain testing strategies involve sub domains that intersect. [17] used cost/consequence of failure as the basis for an automatic test case generation algorithm, and to assess the reliability of the software that had been tested using this algorithm. In practice, some failures may represent inconsequential deviations from the specification, while others are more severe, and some may even be catastrophic. Therefore, in evaluating the risk associated with a program, one must distinguish between different failures in accordance with their importance. To do so, we associate a cost with each failure. Our work employs both concepts i.e. we also assign a cost to a failure and then evaluate testing techniques based on the increase in confidence in the program. 3. STATISTICAL TESTING VS. SYSTEMATIC TESTING
Testing is an essential activity for achieving adequate reliability. It aims to remove maximum defects before delivering a product, but it is an expensive activity. A well-known testing approach for reliability improvement is known as statistical testing/operational testing, where the software is subjected to the same statistical distribution of inputs that is expected in operation. Statistical testing is appealing as it offers a basis for assessing reliability; so we not only have the assurance of having tried to improve the software, but also an estimate of the reliability actually achieved. Statistical methods provide accurate assessment, but may not necessarily be as useful for achieving reliability. On the other hand, there is a great demand for systematic testing methods (i.e., criteria for choosing test cases and possibly stopping rules), giving some guarantee of thoroughness and cost-effectiveness. Systematic testing mostly employs techniques like boundary value analysis or any coverage testing technique. [4] [15] calls these methods, collectively, “debug" testing methods. So we will use both terms interchangeably.
As far as the reliability is concerned, removal of faults discovered in statistical testing will have a greater impact than removal of the faults discovered in systematic testing because it focuses on those failures which have more probability of appearing more frequently in actual operation. Statistical testing is easy to understand and easy to perform. If a test is successful, we will be able to assess the reliability achieved. On the other hand, if a test fails, we will be able to improve the reliability significantly by removing the fault revealed. Furthermore, it is applicable to any software system, large or small, regardless of the language and paradigm used in building the system. However, statistical testing is not always helpful in
practice, because in reality the whereabouts of failure points are unknown. For statistical testing to deliver on its promise, it is necessary for the testing profile to be truly representative of operational use. Otherwise, an operational test will become a debug test of arbitrary design. We should also be aware of the fact that operational profile of a software system often changes with time, which can create more problems for statistical testing.
Although statistical testing is a surprisingly good competitor for systematic testing, it is seldom better, and scenarios can be constructed (although their frequency of occurrence in practice is unknown) in which systematic testing is much better at failure exposure. Debug testers always have the potential advantage that by adjusting the test profile and sub domain definitions they might improve the behavior of debug methods. That is definitely problematic for statistical testing. Systematic testing is clearly better if the probability of selecting a failure point (i.e., an element of input domain that will cause the program to fail) in systematic testing is greater than the probability that the point will be used in actual operation. Moreover, a failure point in a safety-critical program may have an extremely low probability of being used in actual operation of the system but may produce catastrophic results. Such a failure point will never be selected as a test case in statistical testing. In that case, debug testing is clearly better. It should be remembered, however, that there is no guarantee that the fault will be discovered through debug testing, nor can we use debug testing to assert the absence of such a failure point in the input domain or to assess the level of reliability achieved.
A number of studies have compared statistical testing with systematic testing which include [3], [4], [5], [6], [8], [14] and [15]. The original motivation for these studies was a belief that statistical testing might be a real alternative to debug testing for finding failures. However, no such conclusive result was obtained. Is it better to test by probing for defects as in “debug" testing, or to assess reliability directly as in statistical testing, uncovering defects by accident, so to speak? There is no simple answer, as we do not have concrete evidence.
Using systematic testing techniques is necessary, as testing has many goals other than increasing software reliability. Besides being used for other purposes, systematic testing techniques undoubtedly contribute to the improvement of the reliability of the software under test. Software whose reliability must be high could be tested in a number of different ways, and because testing is an expensive and time-consuming activity, we would like to choose among alternatives, not use them all. We will prefer to select a technique that will achieve the goal in an effective and efficient manner. However, we have very limited knowledge of testing techniques in terms of their effectiveness and efficiency; we need to evaluate different
VOL. 2, NO. 3, March 2012 ISSN 2222-9833
ARPN Journal of Systems and Software ©2009-2011 AJSS Journal. All rights reserved
http://www.scientific-journals.org
87
systematic testing techniques for reliability. However, we should be aware of the potential confusion between detecting failures and achieving reliability, a confusion that occurs when testing finds only unimportant failures. Different failures may make vastly different contributions to the (un)reliability of the program. Thus, testing with a technique that readily detects small faults may result in a less reliable program than would the testing with a technique that less readily detects some large faults. If a systematic technique consistently turns up low-frequency problems, it may be counterproductive to use it. [4], [5] and [8] show that the choice between testing methods depends on rather subtle details of the assumed scenarios; and that debug testing methods that appear promising because of their ability to detect many faults may well be vastly inferior to statistical testing, unless they preferentially discover the more important faults.
We are interested in evaluating systematic testing methods for reliability of delivered software. Studies like this one can thus be viewed as a first step towards examining which testing technique to choose in systematic testing that will reduce more risk relative to other techniques in the software. 4. DESCRIPTION OF THE EXPERIMENT
We used GQM (Goal-Question-Metrics) approach to state the goals of our experiment. The GQM goal for our experiment is:
Analyze three defect detection techniques (systematic techniques) for the purpose of comparison with respect to their capability of increasing confidence (reliability) from the point of view of the researcher in the context of experiment using small C program.
The goal is to compare code reading, functional testing and structural testing techniques. The comparison has its focus on the improvement of reliability that is measured by number of defects detected and individual weights associated with each failure which is discussed in more detail in section 4.3. The main question this chapter tries to answer is: Which technique is more suitable and effective in terms of increasing confidence by reducing risk in the software under test? In other words we can state that which testing technique improves the reliability of the software by a greatest factor. 4.1 Overview of Testing Methods Used
Software testing techniques cover both static and dynamic testing techniques. We selected three software testing methods for this experiment: code reading, functional testing and structural testing. Code reading belongs to the static testing category and come under manual static testing approach whereas other two belong to dynamic testing and come under black box and white box testing approach respectively, as described in chapter 2. In this study, we applied code reading using stepwise
abstraction, functional testing using equivalence class partitioning and boundary value analysis and structural using 100% branch coverage. The reason to select these testing methods is that they are most widely used testing methods in the practice.
Code reading applied using stepwise abstraction requires the source code to be read. Then we write our own specification by identifying prime subroutines (consecutive lines of code), write a specification for the subroutines, as formally as possible, group subroutines and their specifications together, and repeat the process until all source code will be abstracted. After writing specifications we compare the official specification with our own specification to observe inconsistencies (failure observation) between specified and expected program behavior (analog to failures in the other techniques). Functional testing techniques are used to design test cases based on the functional requirements of the product. The goal of functional testing is to choose a set of inputs according to the specified functions of the program to test the program so that all functions and sub functions are tested at least once. Functional testing using boundary value analysis analyzes the specification to identify equivalence classes in the input data. Then we choose test cases based on that analysis by focusing on equivalence-class boundaries, run the test cases, and compare the actual output with the expected output to detect failures. Structural testing techniques are used to design test cases based on the internal structure of the component or system; most commonly internal structure is referred to as the structure of the code. Test cases are designed to get the required coverage for the specified coverage item. The goal of structural testing is to choose a set of inputs according to the structure of the program and aim that all parts (statements, branches or paths) are tested at least once. Structural testing using branch coverage analyzes a source-code listing to construct test cases that will lead to 100% branch coverage. After running the tests, we compare the actual output with the expected output to detect failures.
All techniques are applied in a two stage process: failure observation (observable differences between programs and the official specification) and fault isolation (identifying the exact location of the cause of the failure in program code).
4.2 Programs and Faults
The program used in this experiment is written in C language. The program (student.c) is used store data about students. The program contains approximately 100 lines of code. Choosing a program of this size was an obligation, as industrial or real programs were not readily available. To seed faults in the program, we firstly need a fault classification to decide which type of faults can be seeded in the program. Presently, there is no universal fault
VOL. 2, NO. 3, March 2012 ISSN 2222-9833
ARPN Journal of Systems and Software ©2009-2011 AJSS Journal. All rights reserved
http://www.scientific-journals.org
88
classification. We will use two-faceted fault-classification scheme from the [1]. Facet one (type) captures the absence of needed code or the presence of incorrect code (omission, commission). Facet two (class) partitions software faults into the six classes:
1. Initialization 2. Computation. 3. Control. 4. Interface. 5. Data. 6. Cosmetic.
Thus we can have following combinations of fault type and class.
1. Omission, Initialization 2. Commission, Initialization 3. Omission, Control 4. Commission, Control 5. Omission, Computation 6. Commission, Computation 7. Omission, Interface 8. Commission, Interface 9. Omission, Data 10. Commission, Data 11. Omission, Cosmetic 12. Commission, Cosmetic
On the basis of this classification, we manually seeded a total of 11 faults in the student program. Still, we cannot guarantee that program do not contain any other faults. All faults cause observable failures; no fault covers another. The failure might be a total failure (no output at all), a serious problem (incorrect output), or a minor problem (misspelled word in the output). No faults detected by the compiler are taken into consideration. Table 1classifies the faults in the programs used in experiment as per the above classification. The description of each fault along with fault type and failure description is given in Table 2.
Table 1: Count and Percentage of Faults.
Student.c Percentage of total faults
Omission Commission
3 8
27.27272727 72.72727273
Initialization Control Computation Interface Data Cosmetic
2 3 2 0 2 2
18.18181818 27.27272727 18.18181818 0 18.18181818 18.18181818
Total 11 100% 4.3 Methodology
We are interested in comparing testing criteria according to their ability to detect and reduce the risk. We cannot compare the techniques for reliability based on the number of failures detected alone. Some program failures
may be more important than the others, depending on the cost incurred by, or damages inflicted on, the user. For example, any failure that results from misspelling a word in the output might be considered minor, while a failure that results in the outputting of the wrong numerical value could be considered to have considerably more severe consequences. Even here, differences in the magnitude of the numerical discrepancy might lead to different failure modes. For example, the cost of outputting the wrong numerical value might be fixed or might depend on how far the incorrect value is from the correct one. We aim to evaluate the effectiveness of systematic software testing techniques in terms of increase in reliability. To do so, we assign a weight to each defect. This weight will approximately define the relative consequence or damage that will be caused if that failure will surface during execution of the system (the severity of the failure). Following categories of defect severity were taken into consideration: 1. Severity 1: Defects of this severity cause catastrophic consequences for the system. A defect of this level can cause program execution to abort and can result in critical loss of data, critical loss of system availability, critical loss of security, critical loss of safety, etc.
2. Severity 2: Defects of this level cause serious consequences for the system. Such types of defects usually cause a program not to perform properly or to produce unreliable results. We also do not find a workaround for this type of defects For example, a function is severely broken and cannot be used.
3. Severity 3: Defects of this level cause significant consequences for the system. There is usually a work around for such type of defects till they are fixed. For example, losing data from a serial device during heavy loads.
4. Severity 4: Defects of this level cause small or insignificant consequences for the system. Such defects are easily fixed and a workaround is available for them. For example, misleading error messages.
5. Severity 5: Defects of this level cause no negative consequences for the system. Such defects normally produce no erroneous outputs. For example, displaying output in a font other than what the customer desired.
Each defect was assigned a weight/cost of 1 to 5. A failure with a weight/cost of 5 will be a catastrophic one (severity one), while a failure with weight/cost of 1 will have no serious consequence (severity five). Based on the severity of the defects and the corresponding weight/cost assigned to them, we assigned following weights to the defects in student program as shown in Table 31. As can be observed from the weights assigned, it is not necessary that a fault of same type will have the same weight i.e. the same defect severity. E.g. in Table 2 fault number F6 and 1 The weights are only an approximation as they depend on our perspective of failure consequence.
VOL. 2, NO. 3, March 2012 ISSN 2222-9833
ARPN Journal of Systems and Software ©2009-2011 AJSS Journal. All rights reserved
http://www.scientific-journals.org
89
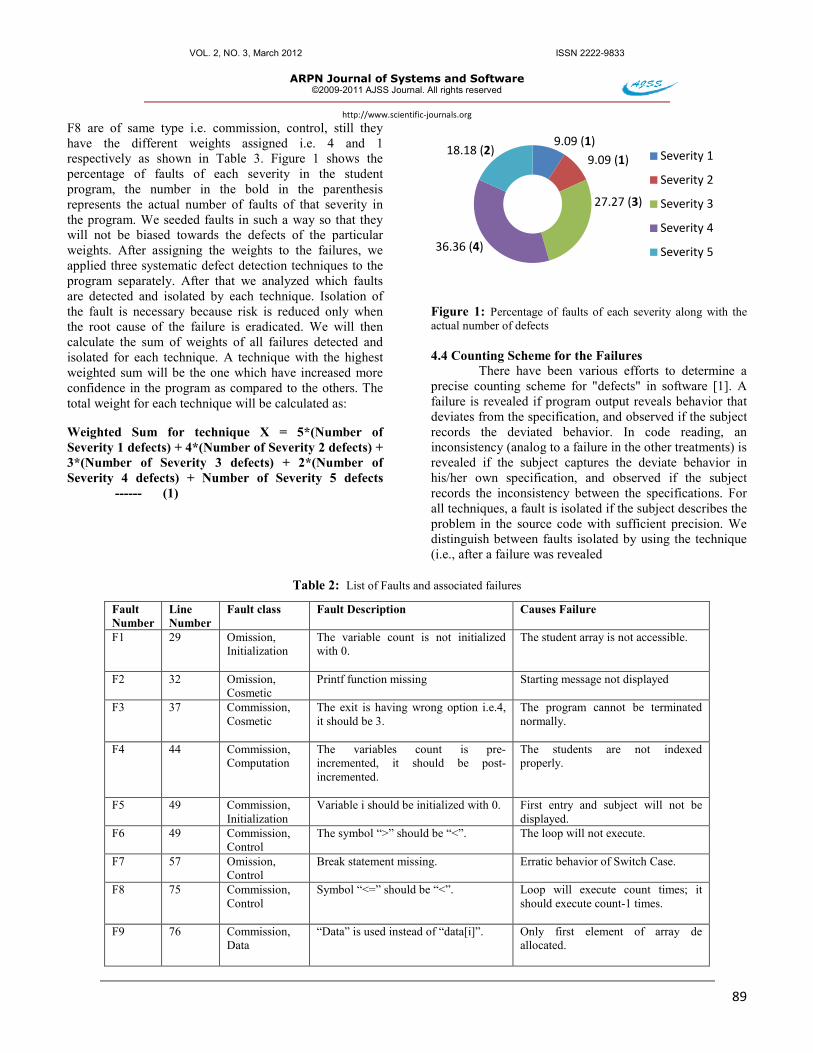
F8 are of same type i.e. commission, control, still they have the different weights assigned i.e. 4 and 1 respectively as shown in Table 3. Figure 1 shows the percentage of faults of each severity in the student program, the number in the bold in the parenthesis represents the actual number of faults of that severity in the program. We seeded faults in such a way so that they will not be biased towards the defects of the particular weights. After assigning the weights to the failures, we applied three systematic defect detection techniques to the program separately. After that we analyzed which faults are detected and isolated by each technique. Isolation of the fault is necessary because risk is reduced only when the root cause of the failure is eradicated. We will then calculate the sum of weights of all failures detected and isolated for each technique. A technique with the highest weighted sum will be the one which have increased more confidence in the program as compared to the others. The total weight for each technique will be calculated as:
Weighted Sum for technique X = 5*(Number of Severity 1 defects) + 4*(Number of Severity 2 defects) + 3*(Number of Severity 3 defects) + 2*(Number of Severity 4 defects) + Number of Severity 5 defects ------ (1)
Figure 1: Percentage of faults of each severity along with the actual number of defects 4.4 Counting Scheme for the Failures
There have been various efforts to determine a precise counting scheme for "defects" in software [1]. A failure is revealed if program output reveals behavior that deviates from the specification, and observed if the subject records the deviated behavior. In code reading, an inconsistency (analog to a failure in the other treatments) is revealed if the subject captures the deviate behavior in his/her own specification, and observed if the subject records the inconsistency between the specifications. For all techniques, a fault is isolated if the subject describes the problem in the source code with sufficient precision. We distinguish between faults isolated by using the technique (i.e., after a failure was revealed
Table 2: List of Faults and associated failures
9.09 (1)9.09 (1)
27.27 (3)
36.36 (4)
18.18 (2) Severity 1
Severity 2
Severity 3
Severity 4
Severity 5
Fault Number
Line Number
Fault class Fault Description Causes Failure
F1 29 Omission, Initialization
The variable count is not initialized with 0.
The student array is not accessible.
F2 32 Omission, Cosmetic
Printf function missing Starting message not displayed
F3 37 Commission, Cosmetic
The exit is having wrong option i.e.4, it should be 3.
The program cannot be terminated normally.
F4 44 Commission, Computation
The variables count is pre-incremented, it should be post-incremented.
The students are not indexed properly.
F5 49 Commission, Initialization
Variable i should be initialized with 0. First entry and subject will not be displayed.
F6 49 Commission, Control
The symbol “>” should be “<”.
The loop will not execute.
F7 57 Omission, Control
Break statement missing.
Erratic behavior of Switch Case.
F8 75 Commission, Control
Symbol “<=” should be “<”.
Loop will execute count times; it should execute count-1 times.
F9 76 Commission, Data
“Data” is used instead of “data[i]”.
Only first element of array de allocated.

VOL. 2, NO. 3, March 2012 ISSN 2222-9833
ARPN Journal of Systems and Software ©2009-2011 AJSS Journal. All rights reserved
http://www.scientific-journals.org
90
and observed) and faults isolated by chance (i.e., no failure was revealed or observed), as summarized in Table 4. During experiment, we can isolate fault by chance without really observing/revealing the corresponding failure. Even we can have poor cases of fault isolation. In our experiment, we only counted those faults detected by a technique in consideration where a failure is revealed, observed and then isolated (case 8). 5. THE EXPERIMENT
The experiment was run at the Department of Computer Science, University of Kashmir during the fall session of 2011. The experiment was conducted on a single day, as the program was very simple. Each technique was applied on the program in three parallel sessions at different locations by different subjects who were given a preliminary training of testing techniques. No subject had any previous practical experience of software testing; however, they had standard knowledge of computer science field. Subject and technique combination
was a purely random. They were given a total of 3 hours (180 minutes) to complete the experiment which include both defect detection and defect isolation task. They were not aware of the fact that techniques are being evaluated for reliability. Their focus was only on detecting and isolating defects, similar to what we did in the last chapter where we evaluated testing techniques for defect detection ability. The experiment results (raw data) were collected on forms specially designed for the experiment. After the conclusion of the experiment, the results were discussed with the subjects to avoid any sort of confusion during the analysis of the results. The results of the experiment and their analysis are as under: 5.1 Number of Faults Detected and Isolated
As mentioned earlier, only those defects were taken into account, which were revealed, observed and isolated by the subjects. Table 5 shows the number of defects detected and isolated and the time taken by
Table 3: List of failures and their corresponding weights.
F10 97 Commission, Data
Variable i used instead of i+1.
Wrong Subject ID displayed.
F11 98 Commission, Computation
Variable i should not be incremented again as it is already incremented in the loop.
Improper indexing.
Fault Number
Fault Description Causes Failure Weight/Cost Assigned
F1 The variable count is not initialized with 0.
The student array is not accessible. 5
F2 printf function missing. Starting program message not displayed 2 F3 The exit is having wrong option
i.e.4, it should be 3. The program cannot be terminated normally.
2
F4 The variables count is pre-incremented, it should be post-incremented.
The students are not indexed properly.
3
F5 Variable i should be initialized with 0.
First entry and subject will not be displayed. 3
F6 The symbol “>” should be “<”. The loop will not execute.
4
F7 Break statement missing. Erratic behavior of Switch Case.
2
F8 Symbol “<=” should be “<”. Loop will execute count times; it should execute count-1 times.
1
F9 “Data” is used instead of “data[i]”.
Only first element of array de allocated.
1
F10 Variable i used instead of i+1. Wrong Subject ID displayed.
2
F11 Variable i should not be incremented again as it is already incremented in the loop.
Improper indexing. 3
VOL. 2, NO. 3, March 2012 ISSN 2222-9833
ARPN Journal of Systems and Software ©2009-2011 AJSS Journal. All rights reserved
http://www.scientific-journals.org
91
Table 4: Explanations for failure and fault data.
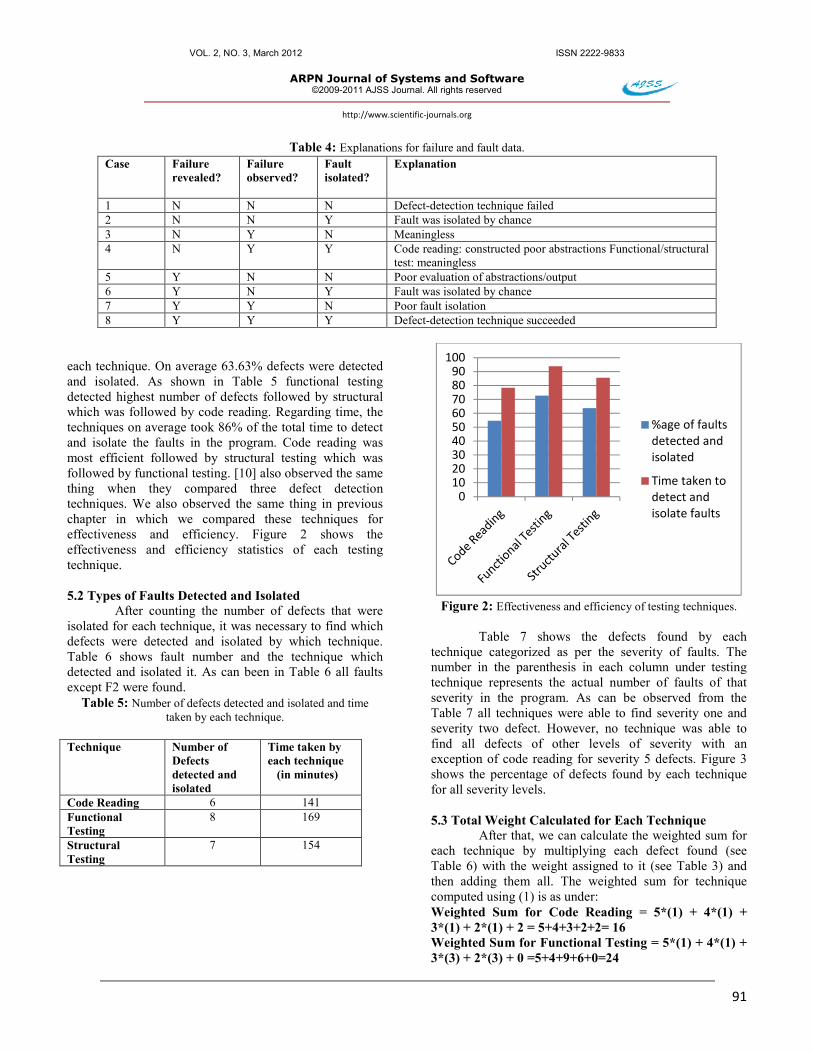
each technique. On average 63.63% defects were detected and isolated. As shown in Table 5 functional testing detected highest number of defects followed by structural which was followed by code reading. Regarding time, the techniques on average took 86% of the total time to detect and isolate the faults in the program. Code reading was most efficient followed by structural testing which was followed by functional testing. [10] also observed the same thing when they compared three defect detection techniques. We also observed the same thing in previous chapter in which we compared these techniques for effectiveness and efficiency. Figure 2 shows the effectiveness and efficiency statistics of each testing technique. 5.2 Types of Faults Detected and Isolated
After counting the number of defects that were isolated for each technique, it was necessary to find which defects were detected and isolated by which technique. Table 6 shows fault number and the technique which detected and isolated it. As can been in Table 6 all faults except F2 were found.
Table 5: Number of defects detected and isolated and time taken by each technique.
Technique Number of
Defects detected and isolated
Time taken by each technique (in minutes)
Code Reading 6 141 Functional Testing
8 169
Structural Testing
7 154
Figure 2: Effectiveness and efficiency of testing techniques.
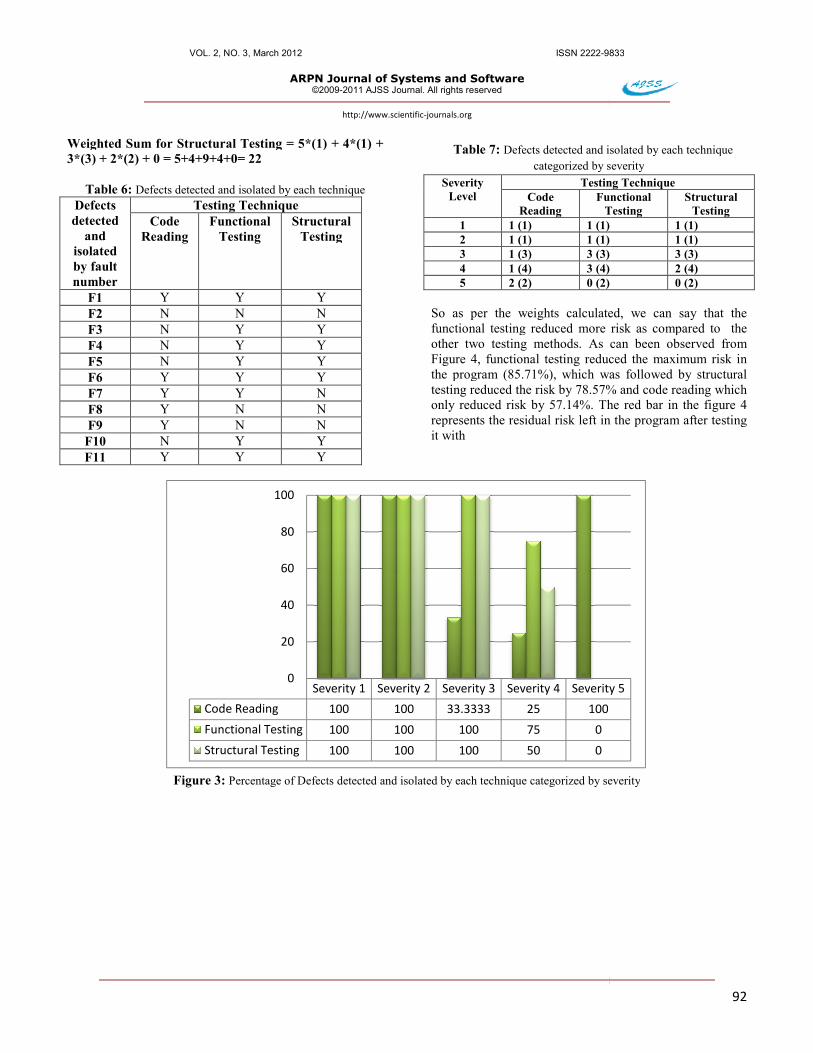
Table 7 shows the defects found by each technique categorized as per the severity of faults. The number in the parenthesis in each column under testing technique represents the actual number of faults of that severity in the program. As can be observed from the Table 7 all techniques were able to find severity one and severity two defect. However, no technique was able to find all defects of other levels of severity with an exception of code reading for severity 5 defects. Figure 3 shows the percentage of defects found by each technique for all severity levels. 5.3 Total Weight Calculated for Each Technique
After that, we can calculate the weighted sum for each technique by multiplying each defect found (see Table 6) with the weight assigned to it (see Table 3) and then adding them all. The weighted sum for technique computed using (1) is as under: Weighted Sum for Code Reading = 5*(1) + 4*(1) + 3*(1) + 2*(1) + 2 = 5+4+3+2+2= 16 Weighted Sum for Functional Testing = 5*(1) + 4*(1) + 3*(3) + 2*(3) + 0 =5+4+9+6+0=24
0102030405060708090
100
%age of faults detected and isolated
Time taken to detect and isolate faults
Case Failure revealed?
Failure observed?
Fault isolated?
Explanation
1 N N N Defect-detection technique failed 2 N N Y Fault was isolated by chance 3 N Y N Meaningless 4 N Y Y Code reading: constructed poor abstractions Functional/structural
test: meaningless 5 Y N N Poor evaluation of abstractions/output 6 Y N Y Fault was isolated by chance 7 Y Y N Poor fault isolation 8 Y Y Y Defect-detection technique succeeded
VOL. 2, NO. 3, March 2012
ARPN Journal of
Weighted Sum for Structural Testing = 5*(1) + 4*(1) + 3*(3) + 2*(2) + 0 = 5+4+9+4+0= 22
Table 6: Defects detected and isolated by each technique Defects detected
and isolated by fault number
Testing Technique Code
Reading Functional
Testing Structural
Testing
F1 Y Y F2 N N F3 N Y F4 N Y F5 N Y F6 Y Y F7 Y Y F8 Y N F9 Y N
F10 N Y F11 Y Y
Figure 3: Percentage of Defects detected and isolated by each technique categorized by severity
Code Reading
Functional Testing
Structural Testing
0
20
40
60
80
100
ISSN 2222-9833
ARPN Journal of Systems and Software ©2009-2011 AJSS Journal. All rights reserved
http://www.scientific-journals.org
Weighted Sum for Structural Testing = 5*(1) + 4*(1) +
and isolated by each technique
Structural Testing
Y N Y Y Y Y N N N Y Y
Table 7: Defects detected and isolated by each technique
categorized by severitySeverity
Level Testing Technique
Code Reading
Functional Testing
1 1 (1) 1 (1) 2 1 (1) 1 (1) 3 1 (3) 3 (3) 4 1 (4) 3 (4) 5 2 (2) 0 (2)
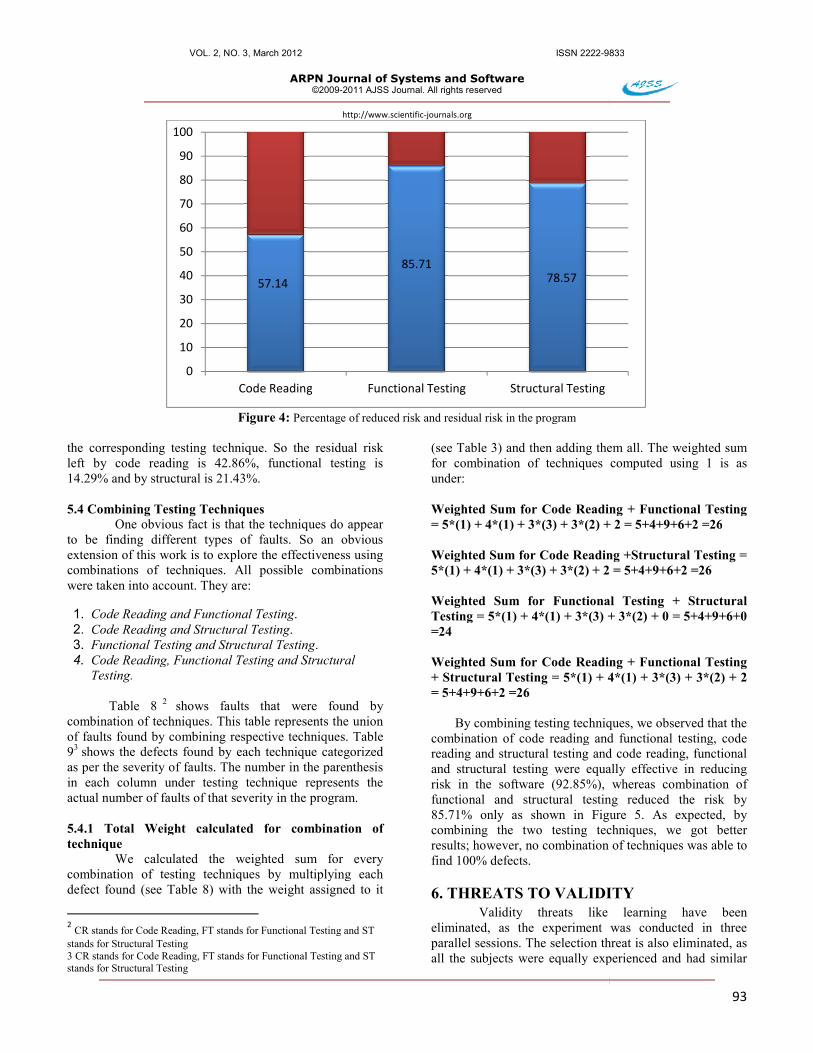
So as per the weights calculated, we can say that the functional testing reduced more risk as compared to other two testing methods. As can been observed from Figure 4, functional testing reduced the maximum risk in the program (85.71%), which was followed by structural testing reduced the risk by 78.57% and code reading which only reduced risk by 57.14%. The red bar in the figure 4 represents the residual risk left in the program after testing it with
Percentage of Defects detected and isolated by each technique categorized by severity
Severity 1 Severity 2 Severity 3 Severity 4 Severity 5
100 100 33.3333 25 100
100 100 100 75 0
100 100 100 50 0
9833
92
Defects detected and isolated by each technique categorized by severity
Testing Technique Functional
Testing Structural
Testing 1 (1) 1 (1) 3 (3) 2 (4) 0 (2)
So as per the weights calculated, we can say that the functional testing reduced more risk as compared to the other two testing methods. As can been observed from Figure 4, functional testing reduced the maximum risk in the program (85.71%), which was followed by structural testing reduced the risk by 78.57% and code reading which
The red bar in the figure 4 represents the residual risk left in the program after testing
Percentage of Defects detected and isolated by each technique categorized by severity
Severity 5
VOL. 2, NO. 3, March 2012
ARPN Journal of
Figure 4: Percentage of reduced risk and residual risk in the program
the corresponding testing technique. So the residual risk left by code reading is 42.86%, functional testing is 14.29% and by structural is 21.43%. 5.4 Combining Testing Techniques
One obvious fact is that the techniques do appear to be finding different types of faults. So an obvious extension of this work is to explore the effectiveness using combinations of techniques. All possible combinations were taken into account. They are:
1. Code Reading and Functional Testing. 2. Code Reading and Structural Testing. 3. Functional Testing and Structural Testing4. Code Reading, Functional Testing and Structural Testing.
Table 8 2 shows faults that were found by
combination of techniques. This table representsof faults found by combining respective techniques. 93 shows the defects found by each technique categorized as per the severity of faults. The number in the parenthesis in each column under testing technique represents the actual number of faults of that severity in the program. 5.4.1 Total Weight calculated for combination of technique
We calculated the weighted sum for every combination of testing techniques by multiplying each defect found (see Table 8) with the weight assigned to it
2 CR stands for Code Reading, FT stands for Functional Testing and ST stands for Structural Testing 3 CR stands for Code Reading, FT stands for Functional Testing and ST stands for Structural Testing
57.14
0
10
20
30
40
50
60
70
80
90
100
Code Reading
ISSN 2222-9833
ARPN Journal of Systems and Software ©2009-2011 AJSS Journal. All rights reserved
http://www.scientific-journals.org
Percentage of reduced risk and residual risk in the program
the corresponding testing technique. So the residual risk left by code reading is 42.86%, functional testing is
that the techniques do appear to be finding different types of faults. So an obvious extension of this work is to explore the effectiveness using combinations of techniques. All possible combinations
Functional Testing and Structural Testing. Code Reading, Functional Testing and Structural
shows faults that were found by combination of techniques. This table represents the union of faults found by combining respective techniques. Table
found by each technique categorized as per the severity of faults. The number in the parenthesis in each column under testing technique represents the
severity in the program.
Total Weight calculated for combination of
We calculated the weighted sum for every combination of testing techniques by multiplying each
) with the weight assigned to it
CR stands for Code Reading, FT stands for Functional Testing and ST
CR stands for Code Reading, FT stands for Functional Testing and ST
(see Table 3) and then adding them all. The weighted sum for combination of techniques computed using 1 is as under: Weighted Sum for Code Reading + Functional Testing = 5*(1) + 4*(1) + 3*(3) + 3*(2) + 2 = 5+4+9+6+2 =26 Weighted Sum for Code Reading 5*(1) + 4*(1) + 3*(3) + 3*(2) + 2 = 5+4+9+6+2 =26 Weighted Sum for Functional Testing + Structural Testing = 5*(1) + 4*(1) + 3*(3) + 3*(2) + 0 = 5+4+9+6+0 =24 Weighted Sum for Code Reading + Functional Testing + Structural Testing = 5*(1) + 4*(1) + 3*(3) + 3*(2) + 2 = 5+4+9+6+2 =26
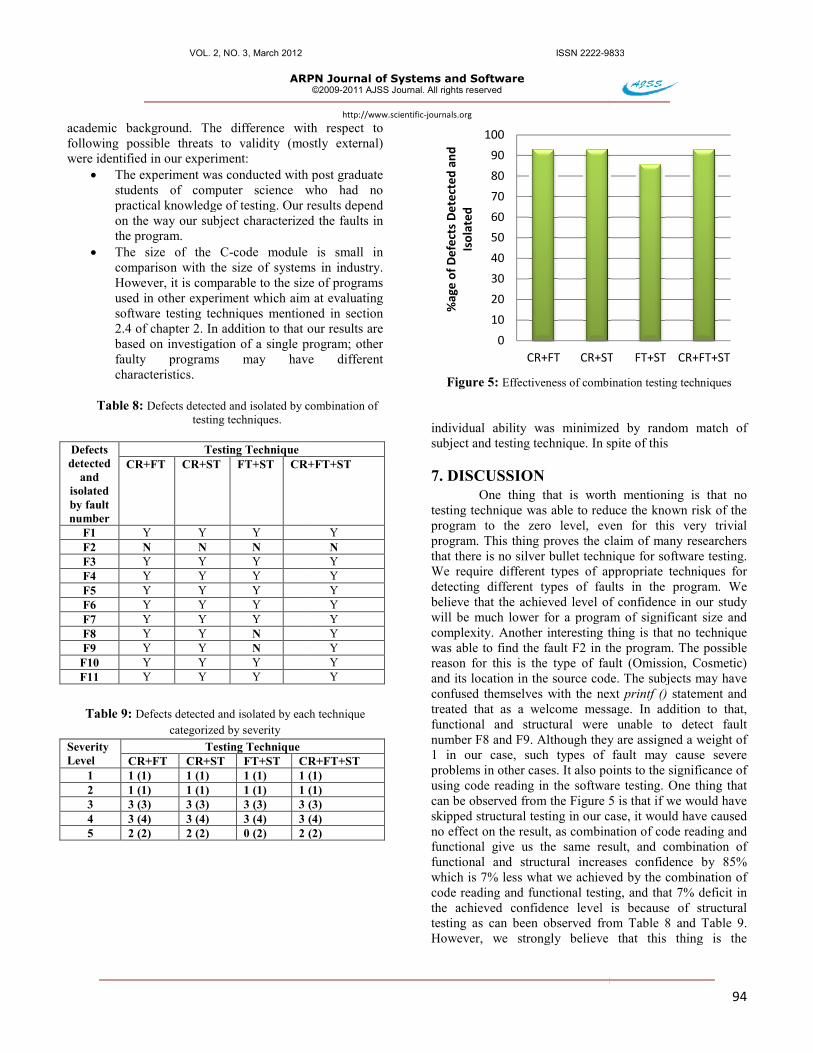
By combining testing techniques, we observed that the combination of code reading and functional testing, code reading and structural testing and code reading, functional and structural testing were equalrisk in the software (92.85%), whereas combination of functional and structural testing reduced the risk by 85.71% only as shown in Figure 5combining the two testing techniques, we got better results; however, no combination of techniques was able to find 100% defects. 6. THREATS TO VALIDITY
Validity threats like learning have been eliminated, as the experiment was conducted in three parallel sessions. The selection threat is also eliminated, as all the subjects were equally experienced and had similar
85.7178.57
Code Reading Functional Testing Structural Testing
9833
93
) and then adding them all. The weighted sum for combination of techniques computed using 1 is as
Weighted Sum for Code Reading + Functional Testing = 5*(1) + 4*(1) + 3*(3) + 3*(2) + 2 = 5+4+9+6+2 =26
Weighted Sum for Code Reading +Structural Testing = 5*(1) + 4*(1) + 3*(3) + 3*(2) + 2 = 5+4+9+6+2 =26
Weighted Sum for Functional Testing + Structural Testing = 5*(1) + 4*(1) + 3*(3) + 3*(2) + 0 = 5+4+9+6+0
Weighted Sum for Code Reading + Functional Testing 5*(1) + 4*(1) + 3*(3) + 3*(2) + 2
By combining testing techniques, we observed that the combination of code reading and functional testing, code reading and structural testing and code reading, functional and structural testing were equally effective in reducing risk in the software (92.85%), whereas combination of functional and structural testing reduced the risk by
Figure 5. As expected, by combining the two testing techniques, we got better
combination of techniques was able to
6. THREATS TO VALIDITY Validity threats like learning have been
eliminated, as the experiment was conducted in three parallel sessions. The selection threat is also eliminated, as all the subjects were equally experienced and had similar
VOL. 2, NO. 3, March 2012
ARPN Journal of
academic background. The difference with following possible threats to validity (mostly external) were identified in our experiment:
• The experiment was conducted with post graduate students of computer science who had no practical knowledge of testing. Our results depend on the way our subject characterized the faults in the program.
• The size of the C-code module is small in comparison with the size of systems in industry. However, it is comparable to the size of programs used in other experiment which aim at evaluating software testing techniques mentioned in section 2.4 of chapter 2. In addition to that our results are based on investigation of a single program; other faulty programs may have different characteristics.
Table 8: Defects detected and isolated by combination of
testing techniques. Defects detected
and isolated by fault number
Testing Technique CR+FT CR+ST FT+ST CR+FT+ST
F1 Y Y Y F2 N N N F3 Y Y Y F4 Y Y Y F5 Y Y Y F6 Y Y Y F7 Y Y Y F8 Y Y N F9 Y Y N
F10 Y Y Y F11 Y Y Y
Table 9: Defects detected and isolated by each technique
categorized by severity Severity Level
Testing Technique CR+FT CR+ST FT+ST CR+FT+ST
1 1 (1) 1 (1) 1 (1) 1 (1)2 1 (1) 1 (1) 1 (1) 1 (1)3 3 (3) 3 (3) 3 (3) 3 (3)4 3 (4) 3 (4) 3 (4) 3 (4)5 2 (2) 2 (2) 0 (2) 2 (2)
ISSN 2222-9833
ARPN Journal of Systems and Software ©2009-2011 AJSS Journal. All rights reserved
http://www.scientific-journals.org academic background. The difference with respect to following possible threats to validity (mostly external)
experiment was conducted with post graduate students of computer science who had no practical knowledge of testing. Our results depend on the way our subject characterized the faults in
code module is small in h the size of systems in industry.
However, it is comparable to the size of programs used in other experiment which aim at evaluating software testing techniques mentioned in section 2.4 of chapter 2. In addition to that our results are
ion of a single program; other faulty programs may have different
Defects detected and isolated by combination of
CR+FT+ST
Y N Y Y Y Y Y Y Y Y Y
Defects detected and isolated by each technique
CR+FT+ST 1 (1) 1 (1) 3 (3) 3 (4) 2 (2)
Figure 5: Effectiveness of combination testing techniques
individual ability was minimized by random match of subject and testing technique. In spite of this
7. DISCUSSION
One thing that is worth mentioning is that no testing technique was able to reduce the known risk of the program to the zero level, even for this very trivial program. This thing proves the claim of many researchers that there is no silver bullet techniqueWe require different types of appropriate techniques for detecting different types of faults in the program. We believe that the achieved level of confidence in our study will be much lower for a program of significant size and complexity. Another interesting thing is that no technique was able to find the fault F2 in the program. The possible reason for this is the type of fault (Omission, Cosmetic) and its location in the source code. The subjects may have confused themselves with the next treated that as a welcome message. In addition to that, functional and structural were unable to detect fault number F8 and F9. Although they are assigned a weight of 1 in our case, such types of fault may cause severe problems in other cases. It also points to the significance of using code reading in the software testing. One thing that can be observed from the Figure 5skipped structural testing in our case, it would have caused no effect on the result, as combinationfunctional give us the same result, and combination of functional and structural increases conwhich is 7% less what we achieved by the combinationcode reading and functional testing, and that 7% dthe achieved confidence level istesting as can been observed from However, we strongly believe that this thing is the
0
10
20
30
40
50
60
70
80
90
100
CR+FT CR+ST
%ag
e of
Def
ects
Det
ecte
d an
d Is
olat
ed
9833
94
Effectiveness of combination testing techniques
individual ability was minimized by random match of subject and testing technique. In spite of this
One thing that is worth mentioning is that no testing technique was able to reduce the known risk of the program to the zero level, even for this very trivial program. This thing proves the claim of many researchers that there is no silver bullet technique for software testing. We require different types of appropriate techniques for detecting different types of faults in the program. We believe that the achieved level of confidence in our study
a program of significant size and exity. Another interesting thing is that no technique
was able to find the fault F2 in the program. The possible reason for this is the type of fault (Omission, Cosmetic) and its location in the source code. The subjects may have
he next printf () statement and treated that as a welcome message. In addition to that, functional and structural were unable to detect fault number F8 and F9. Although they are assigned a weight of 1 in our case, such types of fault may cause severe
ems in other cases. It also points to the significance of using code reading in the software testing. One thing that
Figure 5 is that if we would have case, it would have caused
sult, as combination of code reading and functional give us the same result, and combination of
structural increases confidence by 85% which is 7% less what we achieved by the combination of code reading and functional testing, and that 7% deficit in
dence level is because of structural testing as can been observed from Table 8 and Table 9.
strongly believe that this thing is the
CR+ST FT+ST CR+FT+ST
VOL. 2, NO. 3, March 2012 ISSN 2222-9833
ARPN Journal of Systems and Software ©2009-2011 AJSS Journal. All rights reserved
http://www.scientific-journals.org
95
outcome of the types of faults and nature of program, we have used in our study. 8. CONCLUSION AND FUTURE WORK
We conducted a simple but novel experiment to evaluate three software testing techniques, code reading, functional testing and structured testing for reliability. We conclude that every testing technique contributes to reduction of risk in the software. However, we found functional testing to be more effective in terms of the reducing the risk in the program; whereas, it was the least efficient in terms of time. However, at this point of time, the results cannot be generalized due to the external validity threats. One thing that is clear is that combination of different techniques is more effective solution to increase reliability in the software; however that can decrease the overall efficiency. We also observed that no technique or combination of techniques was able to reduce known risk in the software to the zero level. Results also indicated that no technique is perfect and has its weaknesses. Although the experiment was not run on the large scale, we strongly believe that it is a significant step towards evaluating systematic software testing techniques for reliability. Studies of this kind demand replication, as the results can be generalized only when we have substantial empirical evidence. The future work includes carrying out similar experiment on a large scale with different subjects and real programs with realistic faults of significant size. In addition to that, other testing techniques need to be evaluated for the reliability. We also need to examine the interaction between testing techniques and the program, subjects, faults and other allied parameters. BIOGRAPHY Sheikh Umar Farooq is a Ph. D. Candidate in Department of Computer Sciences, Kashmir University, India. He did his Bachelor’s degree in Computer Applications from Islamia College of Science & Commerce and Master’s degree in Computer Applications from Kashmir University. His research interests include software testing techniques, empirical software engineering and software reliability improvement.
S. M. K. Quadri is Director, Department of Computer Sciences, Kashmir University, India. He did his M. Tech. in Computer Applications from Indian School of Mines and Ph. D. in Computer Sciences from Kashmir University. His research interests include software reliability.
REFERENCES
[1]. Basili, VR and Selby, RW, “Comparing the effectiveness of software testing strategies”, IEEE Transactions on
Software Engineering, v.13 n.12, p.1278-1296, December 1, 1987.
[2]. Beizer, B, “Software Testing Techniques (2nd Ed.)”, Van Nostrand Reinhold Co., New York, NY, USA, 1990.
[3]. Chen, TY and Yu, YT “On the expected number of
failures detected by sub domain testing and random testing”, IEEE Transactions on Software Engineering, 22 (2), pp. 109-19, February 1996.
[4]. Frankl PG, Hamlet RG ,Littlewood B and Strigini L,
Choosing a testing method to deliver reliability, Proceedings of the 19th international conference on Software engineering, p.68-78, May 17-23, 1997, Boston, Massachusetts, United States .
[5]. Frankl, P. and Iakounenko, O. Further empirical studies
of test effectiveness. In ACM SIGSOFT Software Engineering Notes, volume 23, pages 153-162. ACM, 1998.
[6]. Frankl, PG and Weyuker, EJ “A formal analysis of the
fault detecting ability of testing methods”, IEEE Transaction on Software Engineering, 19 (3), pp. 202-13, March 1993.
[7]. Frankl PG and Weyuker, EJ, Testing Software to Detect
and Reduce Risk. Journal of Systems and Software 53(3), 275–286 (2000).
[8]. Frankl PG, Hamlet RG ,Littlewood B and Strigini L,
Evaluating Testing Methods by Delivered Reliability, IEEE Transactions on Software Engineering, v.24 n.8, p.586-601, August 1998.
[9]. Gutjahr, W.J., Optimal test distributions for software
failure cost estimation. IEEE Transactions on Software Eng. 19 (10), 962±975, 1995.
[10]. Kamsties E and Lott C M, “An empirical evaluation of
three defect-detection techniques”. Proceedings of the Fifth European Software Engineering Conference. Sitges, Spain, 1995.
[11]. Li N and Malaiya YK, “On input profile selection for
software testing”, In Proceedings International
VOL. 2, NO. 3, March 2012 ISSN 2222-9833
ARPN Journal of Systems and Software ©2009-2011 AJSS Journal. All rights reserved
http://www.scientific-journals.org
96
Symposium on Software Reliability Engineering1994. IEEE Computer Society Press: Los Alamitos CA; 196–205.
[12]. Lyu, MR (Ed.), “Handbook of Software Reliability
Engineering”, McGraw-Hill, Inc., Hightstown, NJ, USA, 1996.
[13]. Ntafos, SC., “The cost of software failures”, In
Proceedings IASTED Software Engineering Conference, pp. 53±57. 1997.
[14]. Ntafos, SC, “On random and partition testing”.
SIGSOFT Softw. Eng. Notes 23, 2 (March 1998), 42-48.
[15]. Pizza M and Strigini L, “Comparing the effectiveness of testing methods in improving programs: the effect of variations in program quality”. In Proceedings 9th International Symposium on Software Reliability Engineering, ISSRE ’98, pages 144–153, Paderborn, Germany, 1998. IEEE Computer Society Press.
[16]. Tsoukalas MZ, Duran JW and Ntafos SC, “On some
reliability estimation problems in random and partition testing”, IEEE Transactions on Software Engineering, v.19 n.7, p.687-697, July 1993
[17]. Weyuker, EJ, “Using failure cost information for testing
and reliability assessment”, ACM Transactions on Software Engineering and Methodology (TOSEM), v.5 n.2, p.87-98, April 1996.
[18]. Wood A, Software reliability growth models:
assumptions vs. reality. Proceedings of the Eighth International Symposium on Software Reliability Engineering, pp136–141, 1997.