Embed Size (px)
Citation preview

Array Math

2
I. Definition
• MATLAB is known for its mathematical power!– It does vector and MATRIX operations automatically (most languages
require you to do this by hand).– It follows the rules of ANY math book
• Rules of addition and subtraction are straightforward and highly common sense: think MATH
• Rules of multiplication and division require basic knowledge of matrix math
WikipediaThis is an “n-by-p” matrix. n rows, p columns.

3
II. addition/subtraction (example1)
• Assume the vectors (actual math vectors) shown here
>>v1+v2+v3 <enter> results in?
v1 =
2 -3
v2 =
4 -2
v3 =
-1 4
ans =
2 4 -1 -3 -2 4
ans =
5 -1
(a) (b)

4
II. addition/subtraction (example2)
• Assume the matrices A and B below.
>>A+B <enter> results in?
A =
2 0 -3 3 -3 4 -2 2 -1 -3 2 1
B =
8 5 7 4 6 10 9 12 10 5 11 10
ans =
10 5 4 7 3 14 7 14 9 2 13 11
ans =
2 0 -3 3 8 5 7 4 -3 4 -2 2 6 10 9 12 -1 -3 2 1 10 5 11 10
(a) (b)

II. addition/subtraction (example3)
• Assume the matrices A and B below.
>>A+B <enter> results in?
??? Error using ==> +Matrix dimensions must agree.
A =
2 0 -3 3 -3 4 -2 2 -1 -3 2 1
B =
8 5 7 6 10 9 10 5 11
ans =
10 5 4 3 3 14 7 2 9 2 13 1
ans =
2 0 -3 3 8 5 7 -3 4 -2 2 6 10 9 -1 -3 2 1 10 5 11
(a) (b) (c)

6
II. addition/subtraction (example4)
• Assume the matrices A and B below.
>>C = B-A <enter> results in?
??? Error using ==> minusMatrix dimensions must agree.
(a) (b)
A =
2 3 -2 5 1 2 -2 -2
B =
4 11 5 8 9 10 7 12
ans =
2 8 7 3 8 8 9 14 Neither (a) nor (b)
(c)

7
II. addition/subtraction (Rule #1)
• Addition and subtraction between arrays (vectors OR matrices) can be done if and only if BOTH dimensions match.
(2 x 3) (2 x 3)
– By “dimensions”, understand “number of rows of A and B are equal, and number of columns of A and B are equal”• This does not mean “Square”
– A 3by4 can be added or subtracted to a 3by4.– A 100by200 can be added or subtracted to a 100by200.– A 5by4 cannot be added to a 4by5.– A 5by5 can be added to a 5by5.

8
Exception to rule #1
• Adding or subtracting a scalar (a 1 by 1 array) to any array is possible. – MATLAB assumes the operation is done on each element by default.
A =
2 4 5 3 3 8 2 2 4 3 6 4 6 6 6
>> A+2 <enter> results in?
Answer:
A is a 3by5
2 is a 1by1
It still works!
ans =
4 6 7 5 5 10 4 4 6 5 8 6 8 8 8

Multiplication/Division/Power
• Linear Algebra has its own way of multiplying matrices. You’ll learn all about it in MA 345.
• MATLAB defaults to matrix multiplication.

10
• Matrices can be multiplied together if and only if the inner dimensions match
(2 x 3) * (3 x 3) = (2 x 3)
(4 x 3) * (3 x 1) = (4 x 1)
• The resulting dimension is the outer dimensions.
Matrix Multiplication the Linear Algebra way
“inner dimensions”

11
Matrix Multiplication the Linear Algebra way
• A is a (2by3) matrix and B is a (3by4) matrix:
True or False >>A*B <enter> is a valid statementTrue or False >>B*A <enter> is a valid statement
>>C = A*BC will be a __ by __ matrix.2 4
>> B*AError using * Inner matrix dimensions must agree.

12
Matrix Division
• To divide a matrix A by a matrix B really means:“To multiply matrix A by the inverse of matrix B” “inverse” does not mean “transpose”, nor “reciprocal”
All the rules of multiplications apply
• The inverse of a matrix is possible if and only if it is “square”: it has the same amount of rows as columns.
>> A/B for example: (2by3) / (3by3) means (2by3) * inv(3by3) means (2by3) * (3by3) will work.
a/b is really a*(1/b)

But I’m not in MA 345 yet…
• The majority of how you’ll use matrices in EGR115 will NOT be using the linear algebra method.

14
Multiplying/Dividing by a Scalar
• Multiplying together a matrix and a scalar (a 1 by 1 array) to any array is possible. – MATLAB assumes the operation is done on each element per default.
• Note: the inner dimension obviously don’t match, so A*A wouldn’t work.
A =
2 4 5 3 3 8 2 2 4 3 6 4 6 6 6
>> A*2 <enter> results in? Answer:

15
Multiplying/Dividing by a Scalar
• Dividing a matrix by a scalar (a 1 by 1 array) is possible. – MATLAB assumes the operation is done on each element bydefault.
• CAUTION: Dividing a scalar by an array is impossible.

16
What if arrays don’t represent MATRICES
• In MATLAB, an array of multiple dimensions represents a MATRIX.– Any operation (+-*/^) on these is dealt with following strict
mathematical rules
• What if an array is simply used as a database of numbers?– use the element by element operators
.* ./ .^
A =
5 5 8 9
A^3 =
5 5 8 9
5 5 8 9
5 5 8 9* *
A^3 IS NOT
5^3 5^3 8^3 9^3=
885 955 1528 1649

17
Example Calculating Prices
• Assume the two following vectors:– One is the quantity bought of each item (1-5)
– The second is the price of each item (1-5)
• Calculate the total bill ($)
• So: quantities.*prices , then add all?
2 3 6 4 3
20.00 10.50 5.50 10.00 25.00
2*20
3*10.5
6*5.5
4*10
3*25
quantities
prices
= $219.50
+ + + +

The Dot Operator
• Any time you need to do math on an element-by-element basis (which will be most of the time in EGR115), you need to use the dot before the multiplication, division, and exponentiation sign.
A =
5 5 8 9
A^3 =
5 5 8 9
5 5 8 9
5 5 8 9
A^3 IS NOT
5^3 5^3 8^3 9^3
885 955 1528 1649* * =
A.^3 IS
5^3 5^3 8^3 9^3

Array Functions

Basic functions on arrays
CAUTION: A function will return different values depending on whether the argument is a vector or a matrix!Built-in function Argument is a vector Argument is a matrixmin() Returns the minimum value of the
vectorExtracts the minimum of EACH column-> returns a vector
max() Returns the maximum value of the vector
Extracts the maximum of EACH column-> returns a vector
mean()
NOT avg()!!!!
AUTOMATICALLY adds all the elements in the vector together and divides by the number of elements!
Extracts the average of EACH column-> returns a vector

Basic functions on arrays
• Rule of thumb:– If your input is a vector, it will apply the function to all the elements in
the array, regardless of if the vector is a row or column vector– If your input is a matrix, it will apply the function to each column and
return a vector corresponding to the results from each column.

Ex. vector: Temperatures
clcclear
% engine temperaturetemps = [45.5,56.7,99.9,42,12,29];
% determine minimum,maximum,average temperatureminTemp = min(temps)maxTemp = max(temps)avgTemp = mean(temps)
Do not use min =, or max=…, or mean= …These keywords are reserved by MATLAB!

23
Ex. matrix: Scoresclcclear
% scores from playing. Col1 = player1, col2 = player2…etc.scores = [45,34,56; 67,3,45; 22,55,99]’; %transposed!
% determine minimum,maximum,average scoresminScores = min(scores) ?maxScores = ______________avgScores = ______________

ARRAY REFERENCING
2424

25
II. Array Referencing
• Assume an array has values. It is useful to “refer to” the elements contained within it – as smaller portions of the array or even individually.
• Because the values contained within the array may change when the program runs, the index (i.e. position) of the elements allows a mean of accessing them.
• MATLAB starts counting at 1.
? …
? …
3RD

26
II. Array Referencing
• How to refer to elements within a scalar? A vector? A matrix?
• A scalar has one single value – simply refer to the variable itself.age
• A vector has one dimension regardless whether it’s a row vector or a column vector. Use a single index to reference the values in a vector:ages(2)
• A matrix has two or more dimensions. Use an index for EACH dimension: FIRST: a row number, SECOND: a column number
pressures(3,56) (More dimensions? Use another number for each additional dimension!)

Array Referencing - Vectors
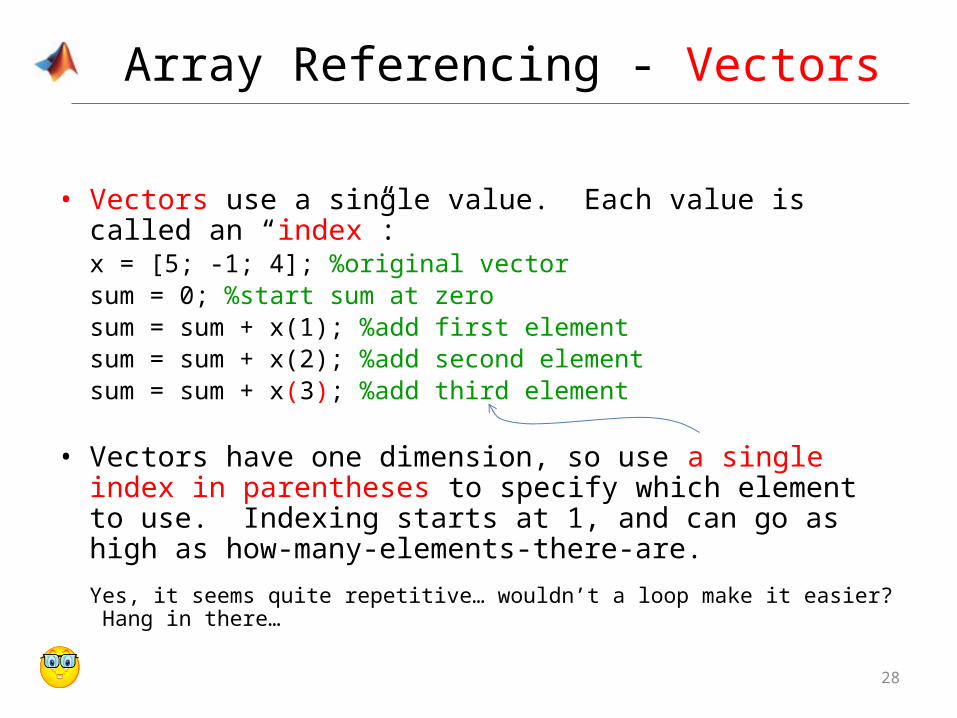
• Vectors use a single value. Each value is called an “index”:x = [5; -1; 4]; %original vectorsum = 0; %start sum at zerosum = sum + x(1); %add first elementsum = sum + x(2); %add second
elementsum = sum + x(3); %add third element
27
Index
This process of repeatedly adding numbers to a single variable is called a “running sum”
Array Referencing - Vectors
• Vectors use a single value. Each value is called an “index”:x = [5; -1; 4]; %original vectorsum = 0; %start sum at zerosum = sum + x(1); %add first elementsum = sum + x(2); %add second
elementsum = sum + x(3); %add third element
• Vectors have one dimension, so use a single index in parentheses to specify which element to use. Indexing starts at 1, and can go as high as how-many-elements-there-are.
Yes, it seems quite repetitive… wouldn’t a loop make it easier? Hang in there…
28

Array Referencing - Matrices
• Matrices are similar. To access the 6 in this matrix:
M = [1, 2, 3; 4, 5, 6; 7, 8, 9]
Use : M(2,3)
29
Row number always first!
Column number always second!
Array Referencing - Matrices
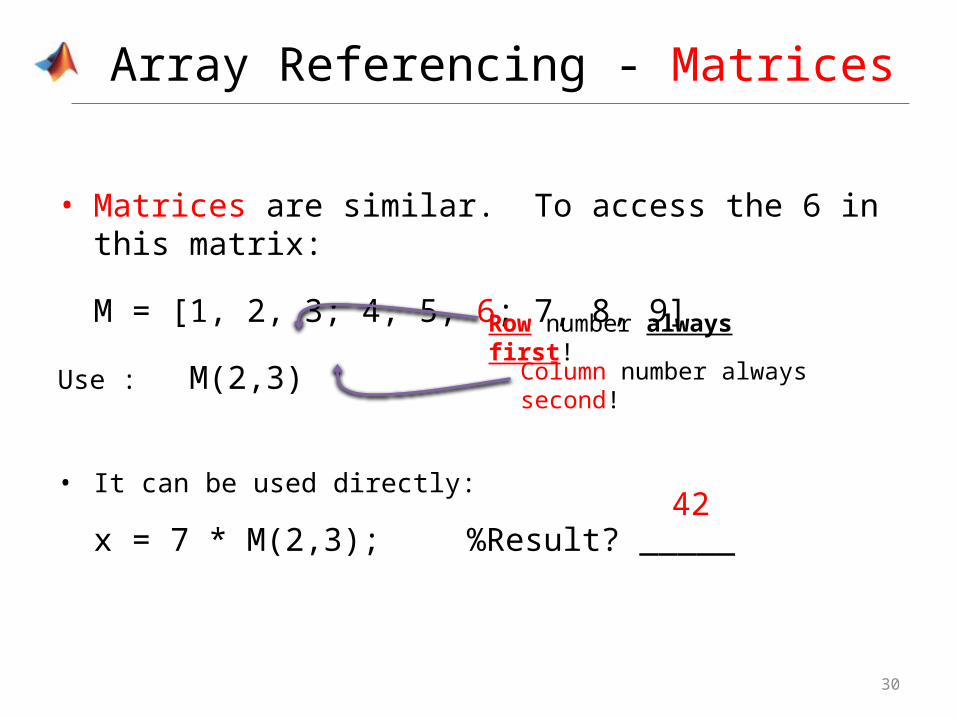
• Matrices are similar. To access the 6 in this matrix:
M = [1, 2, 3; 4, 5, 6; 7, 8, 9]
Use : M(2,3)
• It can be used directly:
x = 7 * M(2,3); %Result? _____
30
Row number always first!
Column number always second!
42
Array Referencing - Matrices
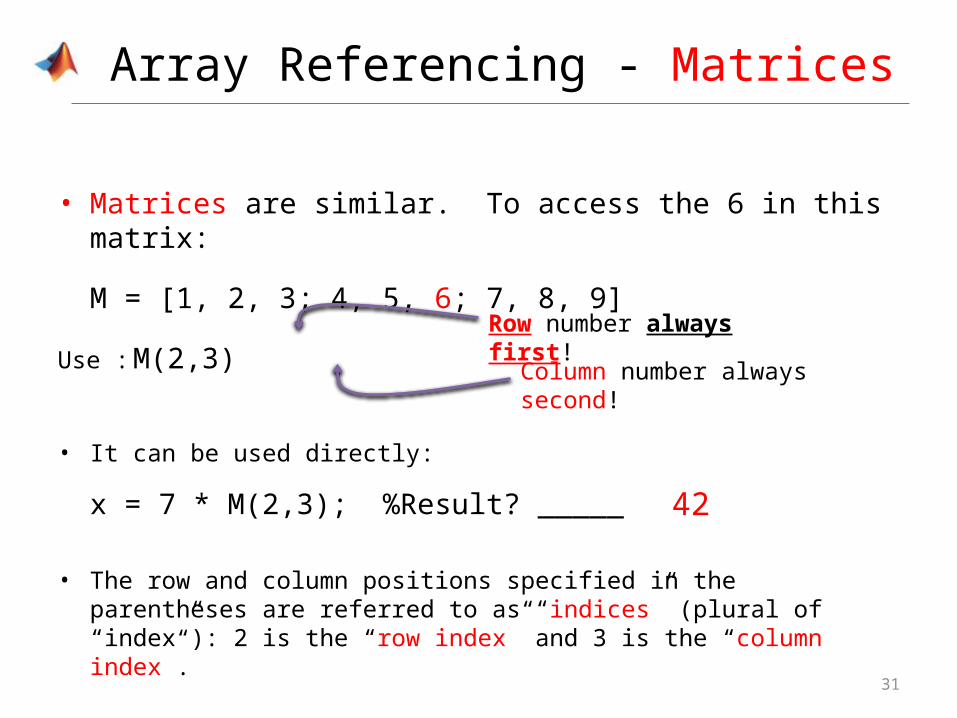
• Matrices are similar. To access the 6 in this matrix:
M = [1, 2, 3; 4, 5, 6; 7, 8, 9]
Use : M(2,3)
• It can be used directly:
x = 7 * M(2,3); %Result? _____
• The row and column positions specified in the parentheses are referred to as “indices” (plural of “index”): 2 is the “row index” and 3 is the “column index”.
31
Row number always first!
Column number always second!
42

Referencing
• To refer to “all” of a column or row, use the range operator by itself:
V = M(:, 3); %from M, copy all rows in columns 3 to V
3232
The same can be done with columns!
V = M(2, :); % V gets a copy of all columns of row 2

ARRAY SLICINGAccessing more than one element of an array
3333

Array Slicing
In general, a slice is a "smaller piece" of something. The range operator is frequently used when getting a slice.
% Copy all elements in rows 1 and 2,
% columns 1 through 4
34
…
… …
Array Slicing
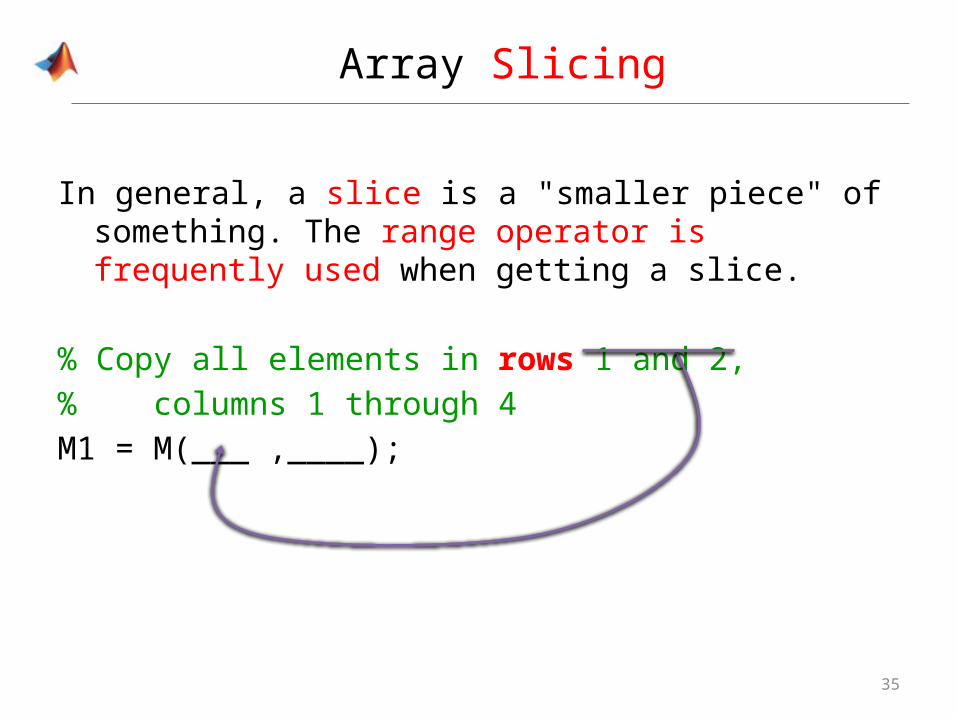
In general, a slice is a "smaller piece" of something. The range operator is frequently used when getting a slice.
% Copy all elements in rows 1 and 2,% columns 1 through 4M1 = M(___ ,____);
35

Array Slicing
In general, a slice is a "smaller piece" of something. The range operator is frequently used when getting a slice.
% Copy all elements in rows 1 and 2,% columns 1 through 4M1 = M(1:2 ,____);
36

Array Slicing
In general, a slice is a "smaller piece" of something. The range operator is frequently used when getting a slice.
% Copy all elements in rows 1 and 2,% columns 1 through 4M1 = M(1:2 ,____);
37

Array Slicing
In general, a slice is a "smaller piece" of something. The range operator is frequently used when getting a slice.
% Copy all elements in rows 1 and 2,% columns 1 through 4M1 = M(1:2,1:4);
38

Real-life #1: Eliminating bad data
• In wind tunnels, the data is obtained throughout the tunnel.
• However, data is usually flawed around the walls, or far away form the object itself.
• Given an array of pressure/temperature/or density obtained, only the ones far from the wall are kept for analysis!
39

Real-life #1: Eliminating bad data
• In wind tunnels, the data is obtained throughout the tunnel.
• However, data is usually flawed around the walls, or far away form the object itself.
• Given an array of pressure/temperature/or density obtained, only the ones far from the wall are kept for analysis!
40

ARRAY DIMINUTION
Making arrays smallerDeleting an element, a row, a column, etc..
4141
Pronounce:“Dim’ – min – yoo’ – shun”

Array Diminution
• To eliminate the whole content, re-define it as an empty-vector:
scores = []; %delete all scores
• To eliminate a single value from a vector, either take a slice:HighScores = [757, 65, -13, -89];HighScores = HighScores(1:3);%deletes last score
Or use the empty-vector:HighScores(4) = []; %removes 4th score
42
Example Diminution
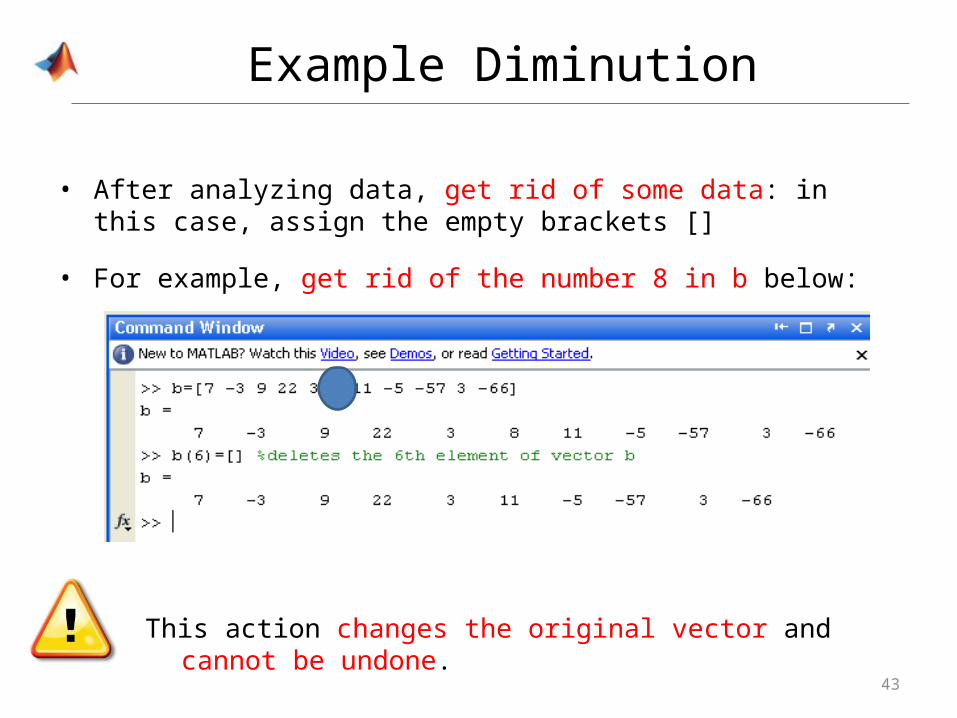
• After analyzing data, get rid of some data: in this case, assign the empty brackets []
• For example, get rid of the number 8 in b below:
43
This action changes the original vector and cannot be undone.

Example Diminution
• After analyzing data, get rid of some data: in this case, assign the empty brackets []
• For example, get rid of the number 8 in b below:
44
This action changes the original vector and cannot be undone.

Array Diminution, cont.
• To eliminate an entire row/column:1. Use the range operator, combined with2. the empty-vector
M = [1, 2, 3; 4, 5, 6];
M(:, 1) = [] … Read it as:
45
%”M

Array Diminution, cont.
• To eliminate an entire row/column:1. Use the range operator, combined with2. the empty-vector
M = [1, 2, 3; 4, 5, 6];
M(:, 1) = [] … Read it as:
46
%”M , all-rows

Array Diminution, cont.
• To eliminate an entire row/column:1. Use the range operator, combined with2. the empty-vector
M = [1, 2, 3; 4, 5, 6];
M(:, 1) = [] … Read it as:
47
%”M , all-rows, 1stcolumn

Array Diminution, cont.
• To eliminate an entire row/column:1. Use the range operator, combined with2. the empty-vector
M = [1, 2, 3; 4, 5, 6];
M(:, 1) = [] … Read it as:
48
%”M , all-rows, 1stcolumn , delete!”

Array Diminution, cont.
Question:
• Can we eliminate a single value from a matrix?
M = [1, 2, 3; 4, 5, 6];M(2, 2) = [] <enter>
49

Array Diminution, cont.
Question:
• Can we eliminate a single value from a matrix?
M = [1, 2, 3; 4, 5, 6];M(2, 2) = [] <enter>
50
No – because that would mean some rows or columns would have more values than others.

AUGMENTING AN ARRAYInsert values at the end of an array (not in the middle, nor beginning)
5151

Array Augmentation, review
Augmentation = “Adding to” = making an array bigger. For example:V = [1, 2, 3];
To augment more columns, it’s much like doing a running total or running product: to the current variable, perform an action:
V = [V, 4, 5, 6];
52
Result: [ ___________________ ] ?
52
1, 2, 3 , 4, 5, 6

Array Augmentation, review
Augmentation = “Adding to” = making an array bigger. For example:V = [1, 2, 3];
To augment more columns, it’s much like doing a running total or running product: to the current variable, perform an action:
V = [V, 4, 5, 6];
To augment with another row vector variable:V1 = [3, 4, 5];V2 = [6, 7, 8];V1 = [V1; V2];
53
Makes a matrix!
Result:__ __ __.
__ __ __.
53
1, 2, 3 , 4, 5, 6Result: [ ___________________ ] ?
3, 4, 5
6, 7, 8

Array Augmentation, review
Augmentation = “Adding to” = making an array bigger. For example:V = [1, 2, 3];
To augment more columns, it’s much like doing a running total or running product: to the current variable, perform an action:
V = [V, 4, 5, 6];
To augment with another row vector variable:V1 = [3, 4, 5];V2 = [6, 7, 8];V1 = [V1; V2];
To augment with a column vector variable:V1 = [6; 8; 9];V2 = [10; 20; 30];V1 = [V1, V2];
54
Makes a matrix!
Why use a comma? ________________
Result:__ __ __.
__ __ __.
Result:__ __ .
__ __ __ __
54
Result: [ ___________________ ] ?1, 2, 3 , 4, 5, 6
3, 4, 5
6, 7, 8
68
9
1020
30
Array Augmentation, review
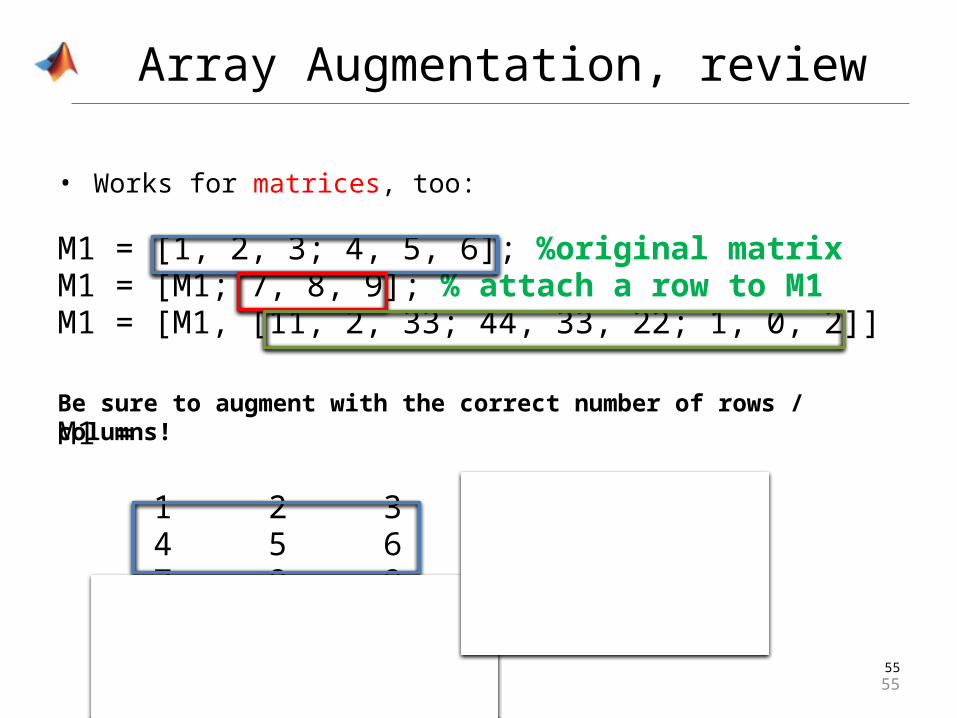
• Works for matrices, too:
M1 = [1, 2, 3; 4, 5, 6]; %original matrixM1 = [M1; 7, 8, 9]; % attach a row to M1M1 = [M1, [11, 2, 33; 44, 33, 22; 1, 0, 2]]
M1 =
1 2 3 11 2 33 4 5 6 44 33 22 7 8 9 1 0 2
55
Be sure to augment with the correct number of rows / columns!
55
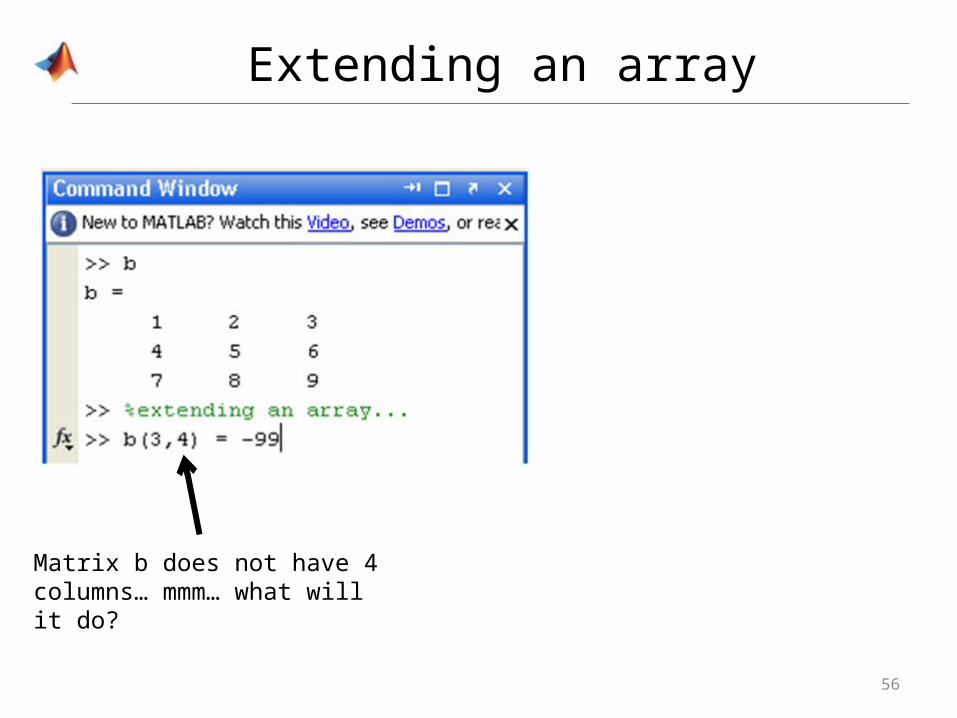
Extending an array
56
Matrix b does not have 4 columns… mmm… what will it do?

Extending an array
57
Fills in with zeros.

58
Key Ideas
I. Hardcoding arrays [] , ; : ‘Prefer these symbols when arrays are small, NOT when arrays are big.
Exception: the colon can technically create big arrays instantly.
II. Referencing• Index = position number• Use one index in vectors vector(index number)• Use two indices in matrices matrix(row, colum)
III. Common operations• Slicing: concentrating on a piece of an array• Diminution: getting rid of elements. Use =[ ]; • Augmenting: “adding values” – increasing the size of an existing array• Combine any symbols/method, as long as the array created is rectangular!
IV. Common functions• sum() prod() mean() max() min()• Different results when applied to vector compared to matrices
Go ahead, use MATLAB and arrays to check your math homework!

59
Helpful functions
• How many elements are in the array?
Function Return value
length(vector) Number of elements in the vector
length(matrix) Highest dimension
size(matrix,1) Number of rows in the matrix
size(matrix,2) Number of columns in the matrix
size(matrix) 1 by 2 array of row and column dimensions
numel(array) Number of elements total in the array

Plotting
1. Overview2. plot in 2D3. Plot in 3D4. Other possible charts5. Engineers: label your plots!6. Plots & Polynomial

1. Plots & Charts, overview
• Plotting functionsplot(), plot3(), polar(), meshgrid()
• Charting functionspie(), pie3(), bar(), bar3(), bar3h(), hist(), errorbar()
• Plot-related functionspolyfit(), polyval(), text(), title(),xlabel(), ylabel()
61

2. Plots
• Create a graph of y vs. x plot(x, y) %order of arguments
matters
• Example: 100 data-pointsx = linspace(-pi, pi);y = sin(x);plot(x, y)
• By default, plot() connects the data-points with a solid line without markers.
6262
2. Plots, cont.
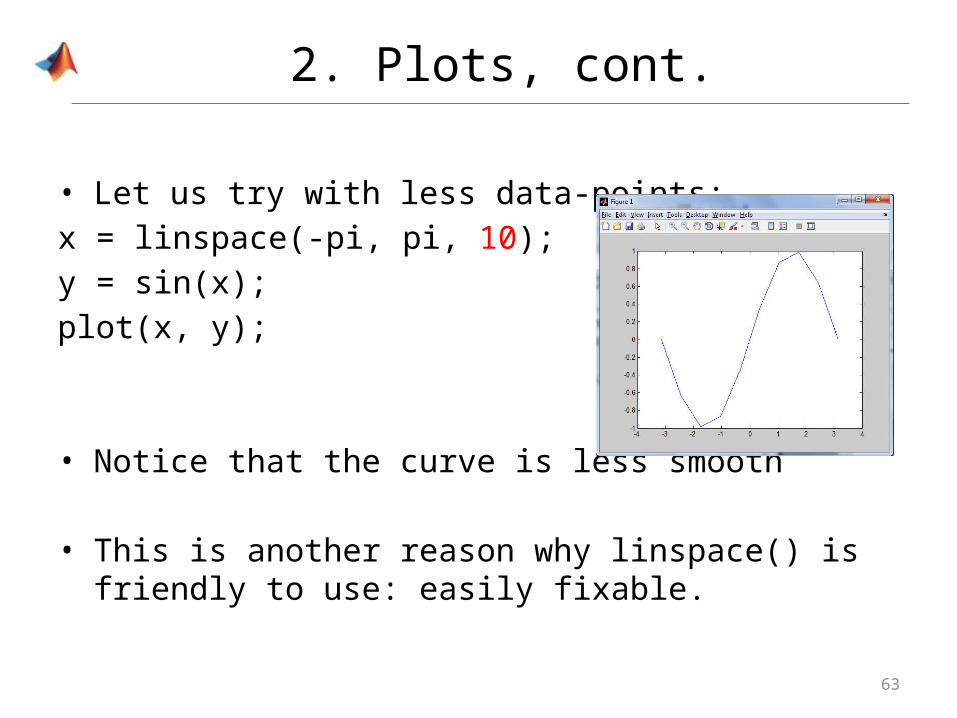
• Let us try with less data-points:x = linspace(-pi, pi, 10);y = sin(x);plot(x, y);
• Notice that the curve is less smooth
• This is another reason why linspace() is friendly to use: easily fixable.
63

2. Plots: line specifiers
• A third argument can be added in the plot function-call:plot(x,y, _____)
• The third argument must be a string, made of up to three components:– One component for the line’s color– One component for the line-style– And one component for the marker symbol (the symbol at each data
point
6464

2. Plots: lineSpecs - color
• Specify the color only:
65
plot(x, y, ‘r’);
65

2. Plots: lineSpecs – line style
• Color and line-style:
66
plot(x, y, ‘r:’);
66
(none): no line

2. Plots: lineSpecs - marker
• Color, type of line and data-marker:
67
plot(x, y, ‘r:d’);

2. Plots: line specifier, cont.
• If only the data-points must show, leave out the line-style:plot(x, y, 'rd')
• Forgot all the options?>> doc plot <enter>
6868

2. Plots: multiple plots
• Repeat the series of 3 arguments to combine multiple plots on 1 graph.
• Example:X = linspace(-2*pi,2*pi,50);Ysine = sin(X);Ycosine = cos(X);plot(X,Ysine,'r:o',X,Ycosine,'b--d')
• The string argument is unnecessary. MATLAB will rotate through the default colors to make sure each plot has a different color. The other 4 arguments are MANDATORY.
69

70
2. Plots: hold on/off
• At default mode, the plot() command erases the previous plots before drawing new plots.
• If subsequent plots are meant to add to the existing graph, use: hold on, which holds the current plot.
• When you are done, use hold off to return to default mode.
• hold, by itself, toggles the hold modes.

71
>> hold on
>> plot(x1,sin(2*x1),'g’)
2. Plots: hold on/off, cont.
>> x1 = linspace(0,pi,25);
>> plot(x1,sin(x1),'r')
* Range of the axis will be automatically adjusted.
Example: Airfoil Lift
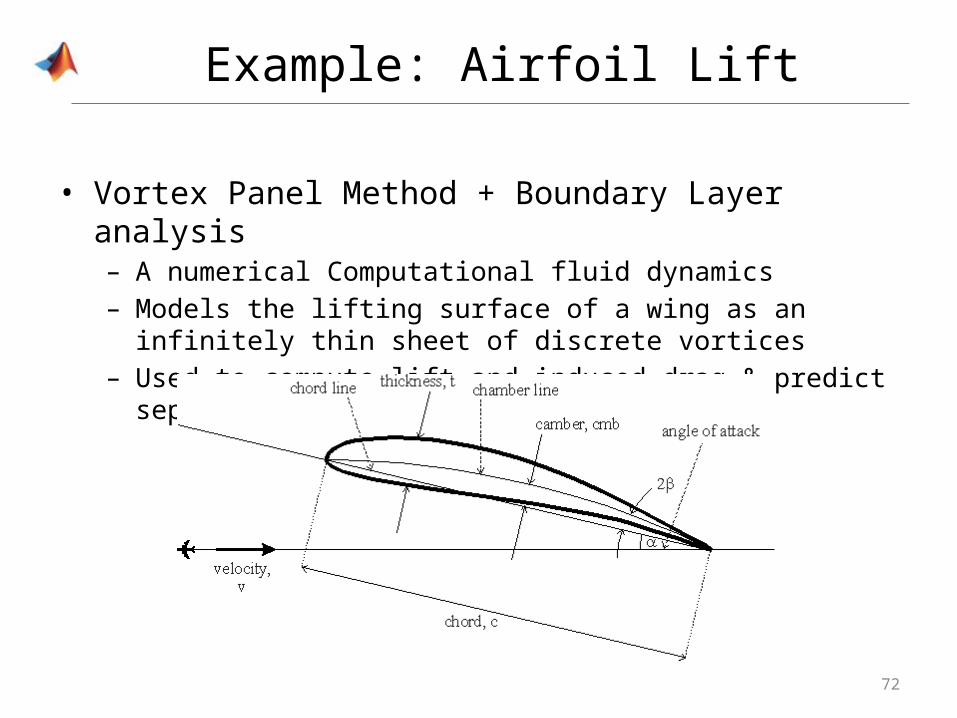
• Vortex Panel Method + Boundary Layer analysis– A numerical Computational fluid dynamics– Models the lifting surface of a wing as an infinitely thin sheet of
discrete vortices– Used to compute lift and induced drag & predict separation/stall
72
3. Plots: 3 dimensions
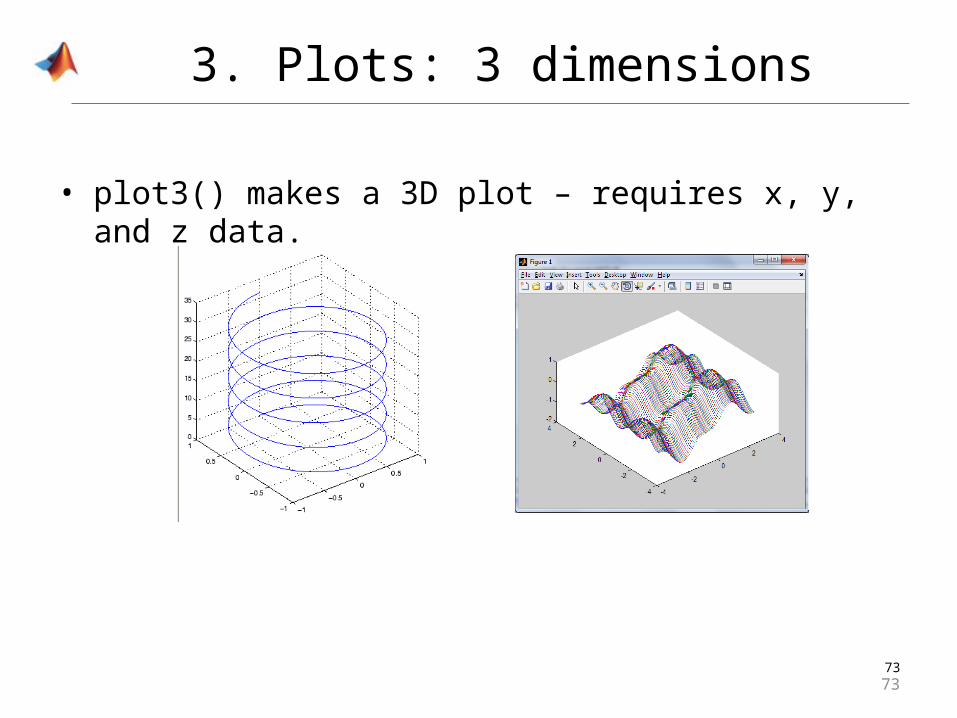
• plot3() makes a 3D plot – requires x, y, and z data.
7373

74
Meshgrid()
Given: x = [1 2 3];y = [4 5];
Evaluate: f(x,y) = x + y
In other words, I need to evaluate (x+y) at every pair of points between x and y.

75
Meshgrid(), cont.
75
To make a useful plot, it is necessary to match up each x with each y before computing z. The function meshgrid() makes this easy to do.

3. Plots: 3 dimensions, cont.
x = linspace(-pi, pi);y = linspace(-pi, pi);[X, Y] = meshgrid(x, y);Z = sin(X).^3 - cos(Y).^2;plot3(X, Y, Z)
Creates two arrays X, Y where each value of x is matched with each value of y
7676

4. Other Possible Charts
• polar() creates polar coordinate plots:
x = linspace(-pi, pi);y = cos(x) - sin(x).^2;polar(x, y)
7777

4. Other Possible Charts, cont.
• pie(), pie3(), bar(), bar3(), bar3h(), hist(), errorbar()
78
pie3()
78
Much like Excel offers:
>>x = 38 54 8 54 48
>> pie3(x)

4. Other Possible Charts, cont.
• pie(), pie3(), bar(), bar3(), bar3h(), hist(), errorbar()
7979
Much like Excel offers:
bar3h()x = 8 9 1 9 6
>> bar3h(x)

4. Other Possible Charts, cont.
• pie(), pie3(), bar(), bar3(), bar3h(), hist(), errorbar()
8080
errorbar()

Example: Flight Delays
1. Percentage of flights delayed1. Percentage of those flights delayed due to carrier’s fault2. Percentage of those flights delayed due to weather 3. Percentage of those flights delayed due to NAS4. Percentage of those flights delayed due to security5. Percentage of those flights delayed due to late flights
2. Percentage of flights arrived on time
3. Present result in table4. If time, present results in pie chart
81
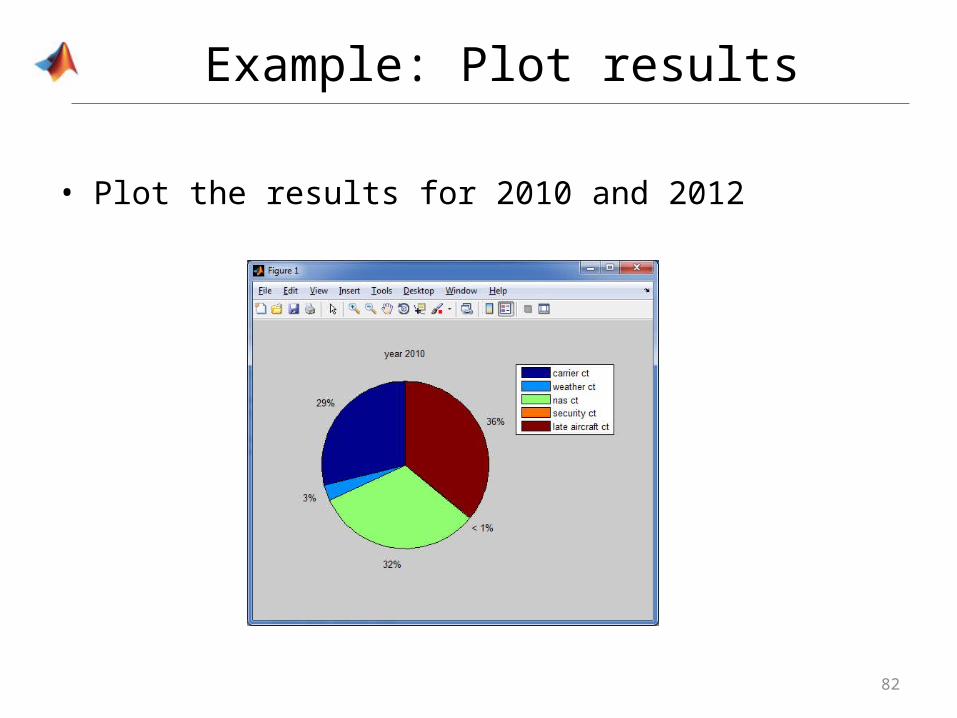
Example: Plot results
• Plot the results for 2010 and 2012
82

4. Other Possible Charts, cont.
• As with all the MATLAB possibilities, use…
83
F1 = Help
83

5. Engineers: Complete Plots
• The following built-in functions should be applied to ALL graphs created:
title() %title on figurexlabel() %x-axis labelylabel() %y-axis labelzlabel() %z-axis label
• Each function takes 1‘string’ argument only and has no return-value.
8484

5. Engineers: Complete Plots
• Additional built-in function: text()Example: text(1, -2, -2, 'Cool plot!')
8585

5. Engineers: Complete Plots
• Built-in function: grid onCOMMAND line typed in the script, after a plot command.
• It stands alone on one line, requires no arguments, and returns no value.
8686

5. Engineers: Complete Plots
• Additional built-in functions: legend(), xlim, ylim, axis
8787

Plots
• All plots MUST have a title and axis labels!• All plots with more than 1 line should have a legend with appropriate
labeling.• Grids should be appropriate for the problem• Plot limits should be appropriate for the problem
– Is there a “0” value?
• As with using fprintf and input, a happy grader is a generous grader – make your plots easy to read/understand and your grader will be happier.
• If you see the phrase “suitable for technical presentation,” assume that means title, axis labels, grid (where appropriate), legend (where appropriate), and appropriate axis limits.

6. Plotting & Polynomials• Plot-related functions that try to find an equation that links
data-points:polyfit(), polyval()
• polyfit() is like linear regression which finds the curve that best fits the data-points. polyfit() attempts to fit a polynomial – not a line. It mainly finds the coefficients of the polynomial that best fits the data given.
• polyval() is used to evaluate the polynomial at specified points. It makes use of the coefficients generated by polyfit(). – It is frequently used to generate a plot.
8989

6. Plotting & Polynomials, cont.
clearclc
%generate tables of x, and y data = [1, 50; 4, 4900; 7, 4600; 10, 3800; 70, 1300; 100, 850; 300, 0.2e9;
700, 1.2e9; 1000, 1.2e9];x = data(:, 1)';y = data(:, 2)'; %plot data points, omit lineplot(x, y, 'd')hold on %combine future plots on this one
%find best-fit polyn. of order 3coeff = polyfit(x, y, 3)px = linspace(min(x), max(x), 100);py = polyval(coeff, px);plot(px, py)
90
Remember that fitting a curve does NOT mean hitting every data-point! 90

Example: Beam Deflection
• Cantilever Beam Deflection– Determine the equation of the polynomialfrom experimental data.
91

Key Ideas
• Plotting any kind of graphs mostly requires vectors of identical dimensions: (x,y) (x, y, z) (r, theta, z)...
• hold on allows multiple plots to be combined together.• The independent variable is the first argument. IT IS A COMMON MISTAKE
TO SWAP THEM.• All functions are easily explained in the help, usually with examples that
show how to place arguments.• As engineer, remember all graphs must be labeled correctly.• For mathematical analysis, polyfit() and polyval() allow to fit a curve
through data-points.
9292


![Laboratorio04 [modalit compatibilit ]galbiati.ws.dei.polimi.it/materiale/laboratori/matlab/laboratorio... · LAB 4: MATLAB/OCTAVE ESERCIZI DI STRUTTURE DI CONTROLLO, ARRAY E MATRICI](https://img.pdfslide.net/doc/110x75/5c67ffad09d3f22d638cce85/laboratorio04-modalit-compatibilit-lab-4-matlaboctave-esercizi-di-strutture.jpg)