Embed Size (px)
Citation preview

Arrium Mining “South Australia’s leading iron ore producer”
Arrium Mining Tour 24 to 26 June 2014
For
per
sona
l use
onl
y
2
This presentation contains certain forward-looking statements with respect to the financial condition, results of operations and business of Arrium and certain plans and objectives of the management of Arrium. Forward-looking statements can generally be identified by the use of words such as ‘project’, ‘foresee’, ‘plan’, ‘expect’, ‘aim’, ‘intend’, ‘anticipate’, ‘believe’, ‘estimate’, ‘may’, ‘should’, ‘will’ or similar expressions. All such forward looking statements involve known and unknown risks, significant uncertainties, assumptions, contingencies and other factors, many of which are outside the control of Arrium, which may cause the actual results or performance of Arrium to be materially different from any future results or performance expressed or implied by such forward looking statements. Such forward-looking statements speak only as of the date of this presentation. Factors that could cause actual results or performance to differ materially include without limitation the following: risks and uncertainties associated with the Australian and global economic environment and capital market conditions, the cyclical nature of the steel industry, the level of activity in the construction, manufacturing, mining, agricultural and automotive industries in Australia and North and South America and, to a lesser extent, the same industries in Asia and New Zealand, mining activity in the Americas, commodity price fluctuations, fluctuations in foreign currency exchange and interest rates, competition, Arrium's relationships with, and the financial condition of, its suppliers and customers, legislative changes, regulatory changes or other changes in the laws which affect Arrium's business, including environmental laws, a carbon tax, mining tax and operational risk. The foregoing list of important factors is not exhaustive. There can be no assurance that actual outcomes will not differ materially from these statements. The information in this presentation and the attachment released with this presentation that relates to Exploration Results is based on information compiled by or under the supervision of Geoff Johnson BSc (Hons), PhD, Grad Dip Env Sc. Dr Johnson is a Fellow of the Australian Institute of Geoscientists and a Fellow of the Australasian Institute of Mining and Metallurgy and is a full-time employee of the Company. Dr Johnson has sufficient experience that is relevant to the style of mineralisation and type of deposit under consideration and to the activity being undertaken to qualify as a Competent Person as defined in the 2012 Edition of the “Australasian Code for Reporting of Exploration Results, Mineral Resources and Ore Reserves”. Dr Johnson consents to the inclusion in this presentation and the attachment of the matters based on his information in the form and context in which it appears. This presentation contains certain non-statutory financial measures including underlying EBIT, underlying EBITDA, underlying NPAT, underlying earnings per share and underlying effective tax rate. These measures are used to assist the reader understand the financial performance of the company’s operations. Non-statutory financial information has not been audited or reviewed as part of KPMG’s report on the 2014 Half Year Financial Report. The Directors believe that using these non-statutory financial measures appropriately represents the financial performance of the Group’s total operations including continuing and discontinued operations. Details of the reconciliation between non-statutory and statutory financial measures can be found in the Appendix of this presentation. All balance sheet items are based on statutory financial information. Except as otherwise expressed, references in this document to net profit/loss after tax refer to net profit/loss attributable to equity holders of the parent. The December 2012 and June 2013 comparatives have not been restated to reflect the application of the new Interpretation 20 Stripping Costs in the Production Phase of a Surface Mine and the revised AASB 119 Employee Benefits.
For
per
sona
l use
onl
y
Contents
Overview 5
Market commentary 7
Our Mining Operations 12
Sales & Marketing 17
Cost Base 22
Sale Longevity 29
Whyalla Port & Infrastructure 41
Summary 46
Appendix 48
Attachment – Exploration Results 53
3
For
per
sona
l use
onl
y

Overview Greg Waters Chief Executive, Mining
For
per
sona
l use
onl
y
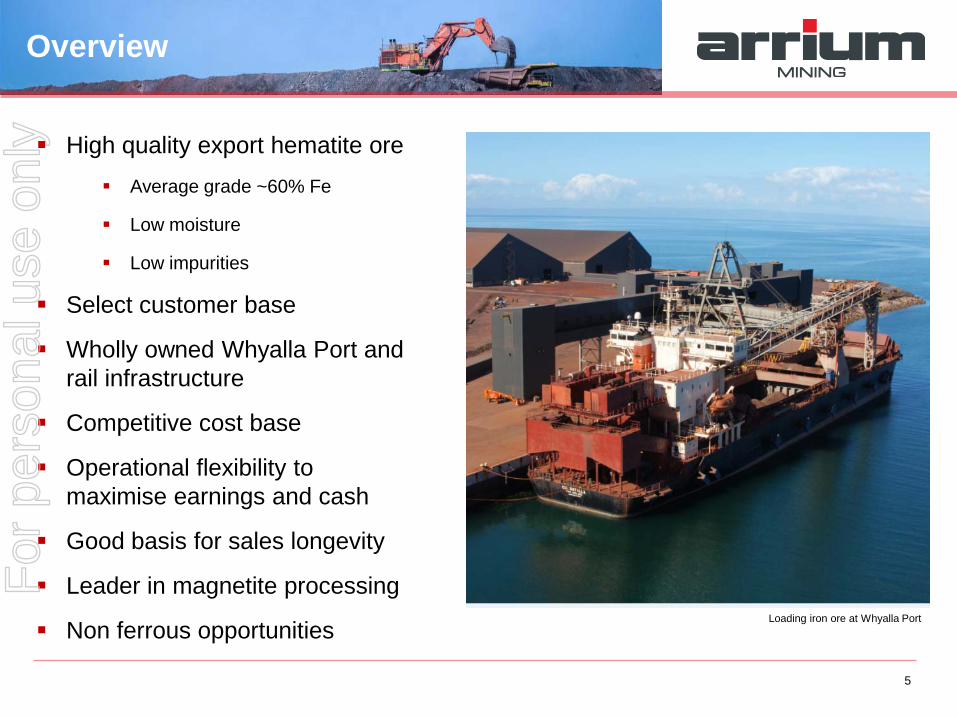
High quality export hematite ore Average grade ~60% Fe
Low moisture
Low impurities
Select customer base
Wholly owned Whyalla Port and rail infrastructure
Competitive cost base
Operational flexibility to maximise earnings and cash
Good basis for sales longevity
Leader in magnetite processing
Non ferrous opportunities
Overview
5
Loading iron ore at Whyalla Port
For
per
sona
l use
onl
y

Market Greg Waters Chief Executive, Mining
For
per
sona
l use
onl
y
China – transition underway
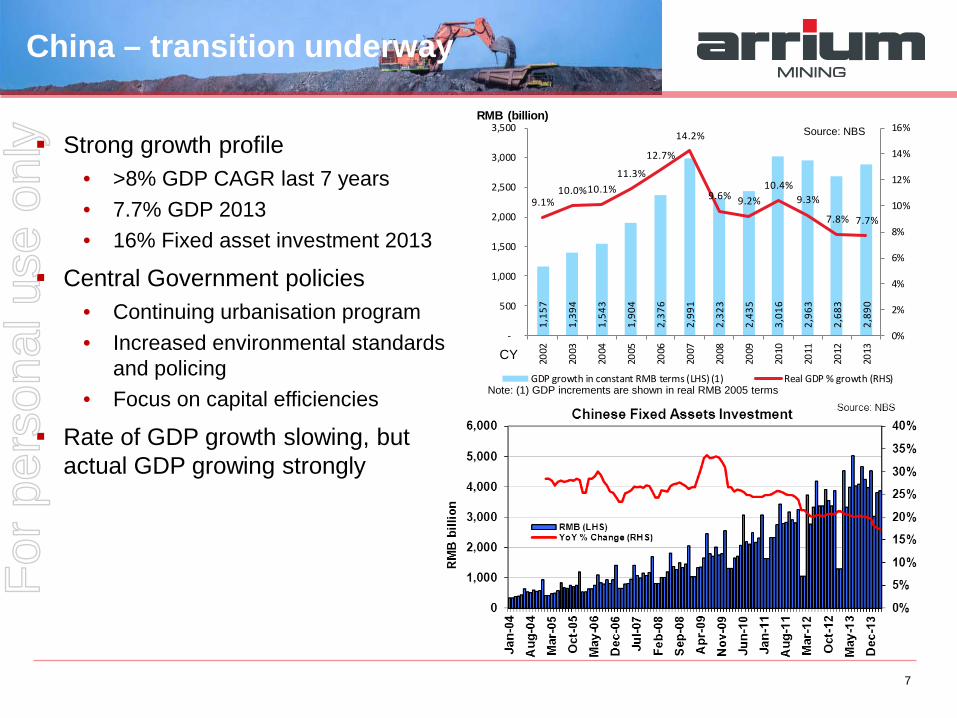
Strong growth profile • >8% GDP CAGR last 7 years • 7.7% GDP 2013 • 16% Fixed asset investment 2013
Central Government policies • Continuing urbanisation program • Increased environmental standards
and policing • Focus on capital efficiencies
Rate of GDP growth slowing, but actual GDP growing strongly
7
1,15
7
1,39
4
1,54
3
1,90
4
2,37
6
2,99
1
2,32
3
2,43
5
3,01
6
2,96
3
2,68
3
2,89
0
9.1%10.0%10.1%
11.3%
12.7%
14.2%
9.6% 9.2%10.4%
9.3%
7.8% 7.7%
0%
2%
4%
6%
8%
10%
12%
14%
16%
-
500
1,000
1,500
2,000
2,500
3,000
3,500
2002
2003
2004
2005
2006
2007
2008
2009
2010
2011
2012
2013
RMB (billion)
GDP growth in constant RMB terms (LHS) (1) Real GDP % growth (RHS)Note: (1) GDP increments are shown in real RMB 2005 terms
CY
Source: NBS
For
per
sona
l use
onl
y
Market demand continuing to grow
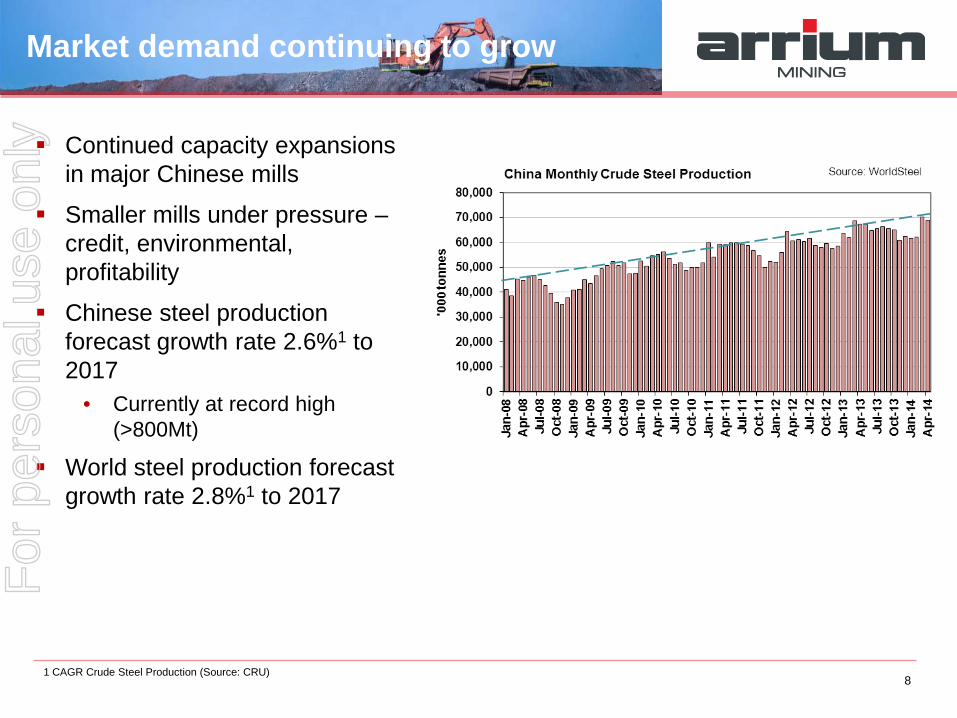
Continued capacity expansions in major Chinese mills
Smaller mills under pressure – credit, environmental, profitability
Chinese steel production forecast growth rate 2.6%1 to 2017
• Currently at record high (>800Mt)
World steel production forecast growth rate 2.8%1 to 2017
8 1 CAGR Crude Steel Production (Source: CRU)
For
per
sona
l use
onl
y
Supply – increase being absorbed
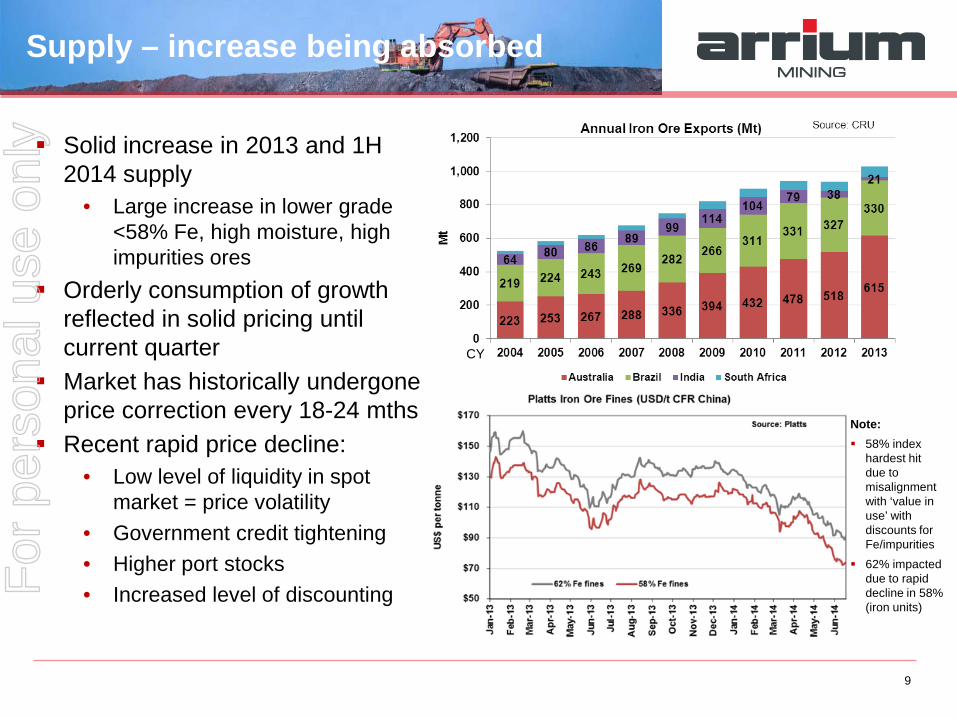
Note: 58% index
hardest hit due to misalignment with ‘value in use’ with discounts for Fe/impurities
62% impacted due to rapid decline in 58% (iron units)
Solid increase in 2013 and 1H 2014 supply
• Large increase in lower grade <58% Fe, high moisture, high impurities ores
Orderly consumption of growth reflected in solid pricing until current quarter
Market has historically undergone price correction every 18-24 mths
Recent rapid price decline: • Low level of liquidity in spot
market = price volatility • Government credit tightening • Higher port stocks • Increased level of discounting
9
CY
For
per
sona
l use
onl
y
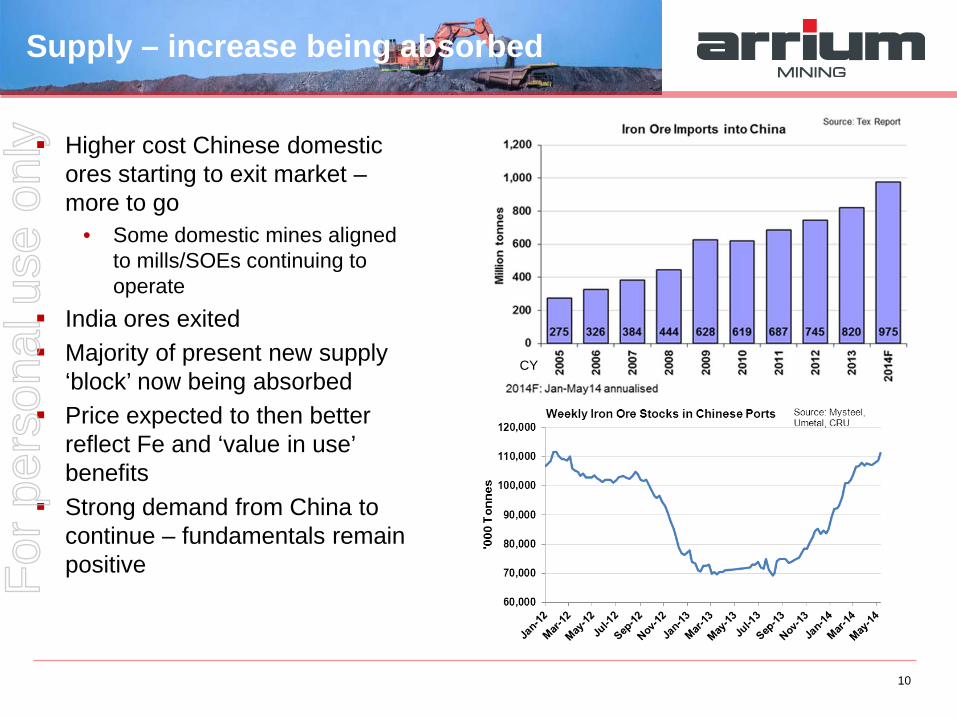
Supply – increase being absorbed
Higher cost Chinese domestic ores starting to exit market – more to go
• Some domestic mines aligned to mills/SOEs continuing to operate
India ores exited Majority of present new supply
‘block’ now being absorbed Price expected to then better
reflect Fe and ‘value in use’ benefits
Strong demand from China to continue – fundamentals remain positive
10
CY
For
per
sona
l use
onl
y

Matt Reed General Manager, Operations – Mining
Our Mining Operations
For
per
sona
l use
onl
y
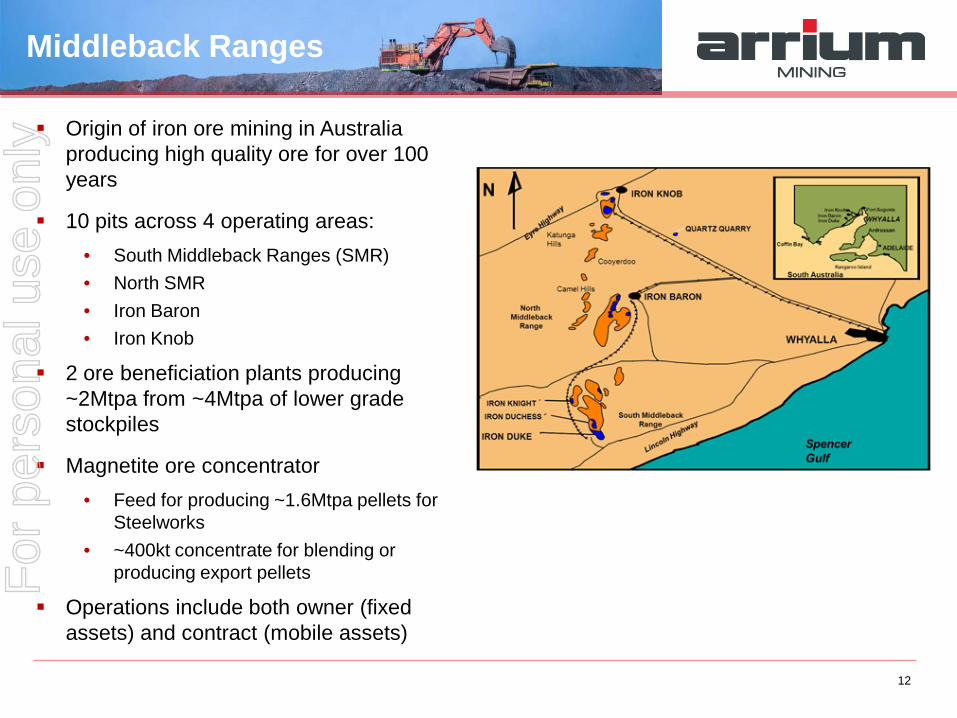
Origin of iron ore mining in Australia producing high quality ore for over 100 years
10 pits across 4 operating areas: • South Middleback Ranges (SMR) • North SMR • Iron Baron • Iron Knob
2 ore beneficiation plants producing ~2Mtpa from ~4Mtpa of lower grade stockpiles
Magnetite ore concentrator • Feed for producing ~1.6Mtpa pellets for
Steelworks • ~400kt concentrate for blending or
producing export pellets
Operations include both owner (fixed assets) and contract (mobile assets)
Middleback Ranges
12
For
per
sona
l use
onl
y
Middleback Ranges
13
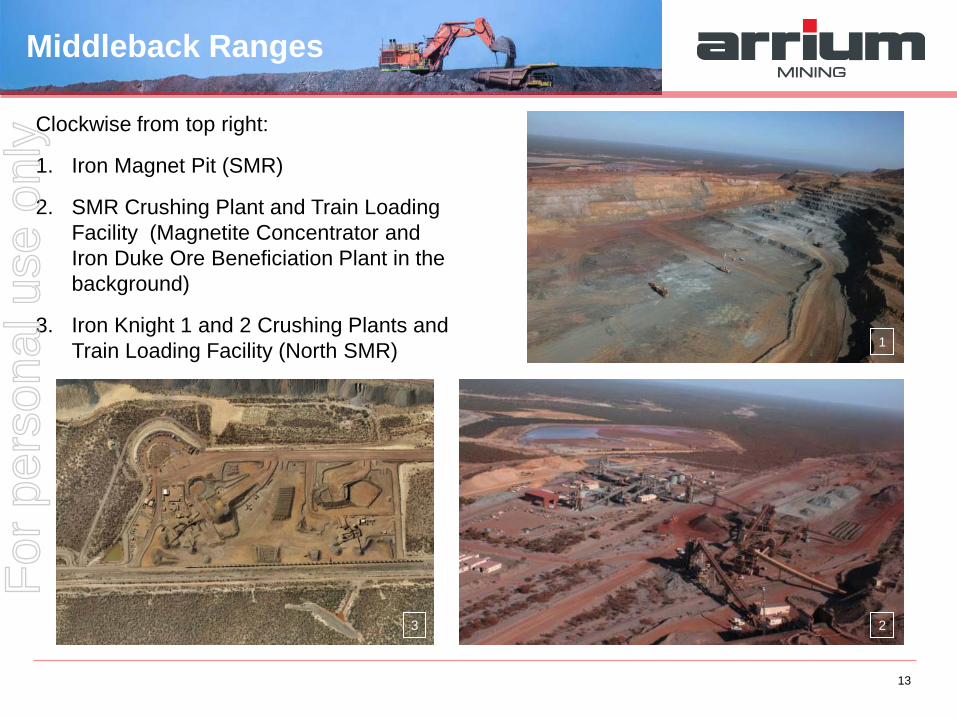
Clockwise from top right:
1. Iron Magnet Pit (SMR)
2. SMR Crushing Plant and Train Loading Facility (Magnetite Concentrator and Iron Duke Ore Beneficiation Plant in the background)
3. Iron Knight 1 and 2 Crushing Plants and Train Loading Facility (North SMR) 1
2 3
For
per
sona
l use
onl
y
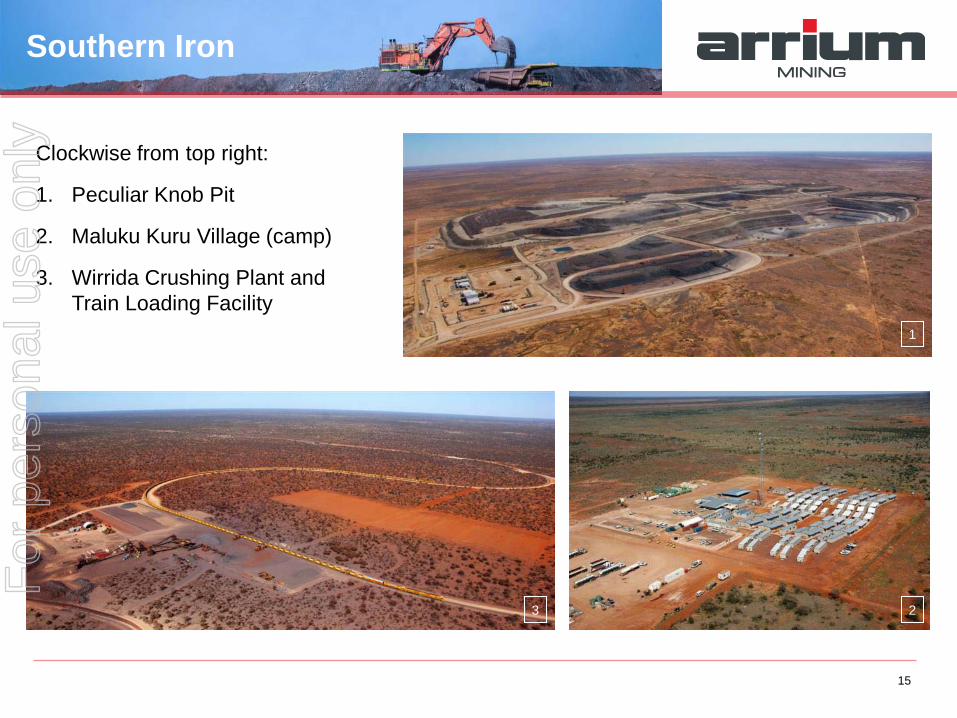
Southern Iron
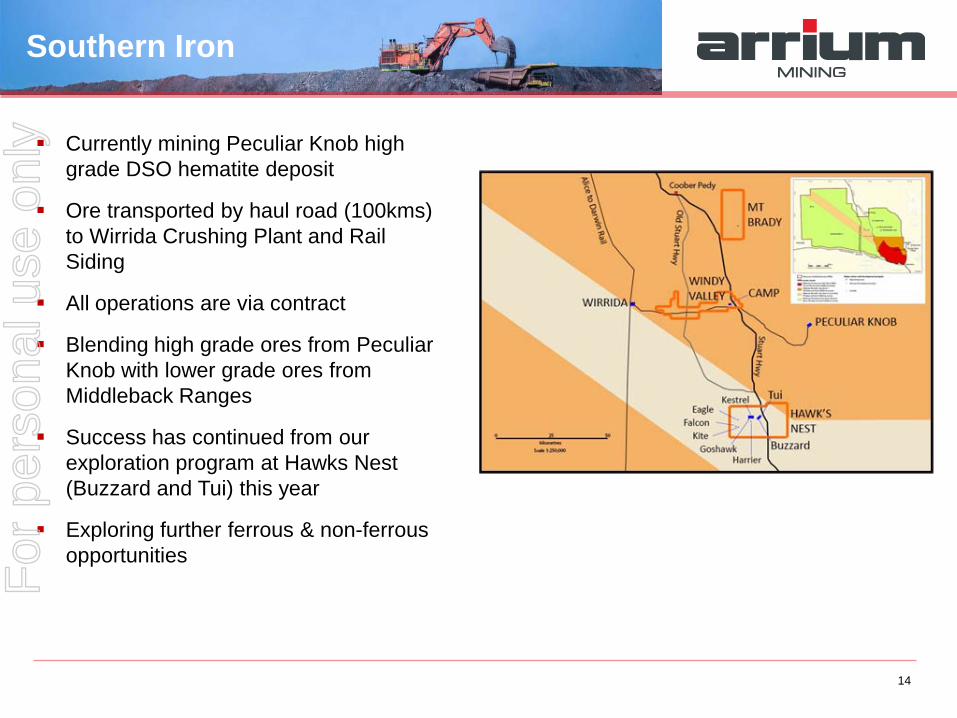
Currently mining Peculiar Knob high grade DSO hematite deposit
Ore transported by haul road (100kms) to Wirrida Crushing Plant and Rail Siding
All operations are via contract
Blending high grade ores from Peculiar Knob with lower grade ores from Middleback Ranges
Success has continued from our exploration program at Hawks Nest (Buzzard and Tui) this year
Exploring further ferrous & non-ferrous opportunities
14
For
per
sona
l use
onl
y
Southern Iron
15
Clockwise from top right:
1. Peculiar Knob Pit
2. Maluku Kuru Village (camp)
3. Wirrida Crushing Plant and Train Loading Facility
1
2 3
For
per
sona
l use
onl
y

Sales & Marketing Greg Waters Chief Executive, Mining
For
per
sona
l use
onl
y

Select quality customer base
• Targeted #1 or #2 in their field (product mix/market) with strong geographic locations
• Original 3 “term customers” have doubled or trebled their capacity
• Reduces credit risk, increases knowledge (shared) and product requirements
Mix ~70% contract, ~30% spot
• Spot customers – predominantly repeat business
• 9 customers (term & repeat spot) consume >80% volume
Customers – relationship focus
17
Loading CSL Whyalla
For
per
sona
l use
onl
y
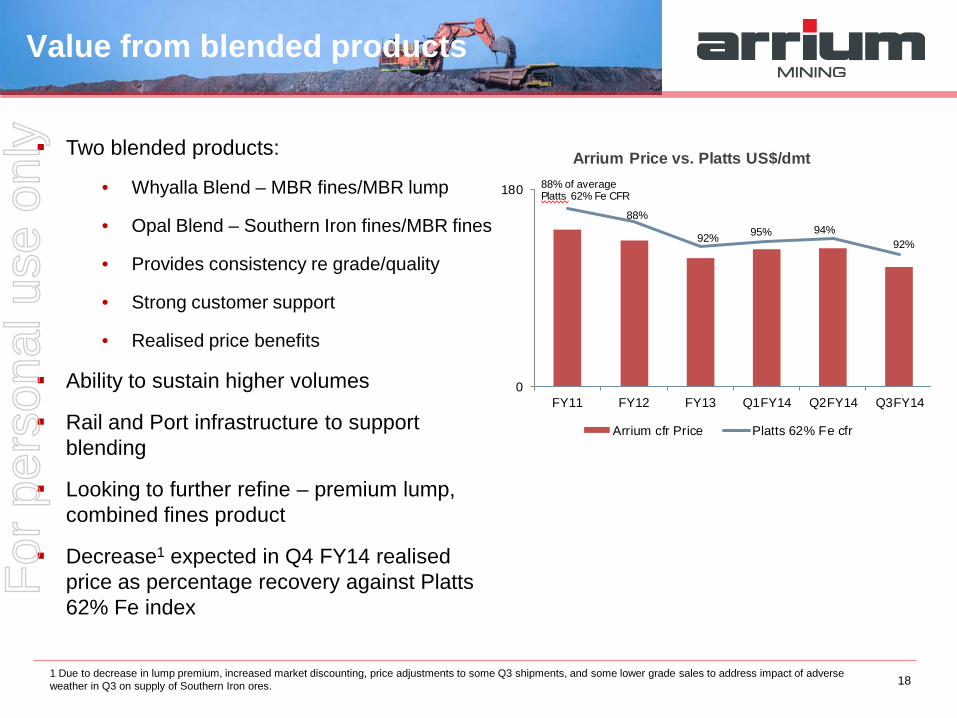
Two blended products:
• Whyalla Blend – MBR fines/MBR lump
• Opal Blend – Southern Iron fines/MBR fines
• Provides consistency re grade/quality
• Strong customer support
• Realised price benefits
Ability to sustain higher volumes
Rail and Port infrastructure to support blending
Looking to further refine – premium lump, combined fines product
Decrease1 expected in Q4 FY14 realised price as percentage recovery against Platts 62% Fe index
Value from blended products
18
0
180
FY11 FY12 FY13 Q1FY14 Q2FY14 Q3FY14
Arrium Price vs. Platts US$/dmt
Arrium cfr Price Platts 62% Fe cfr
88% of average Platts 62% Fe CFR
88%
92% 95% 94%92%
1 Due to decrease in lump premium, increased market discounting, price adjustments to some Q3 shipments, and some lower grade sales to address impact of adverse weather in Q3 on supply of Southern Iron ores.
For
per
sona
l use
onl
y
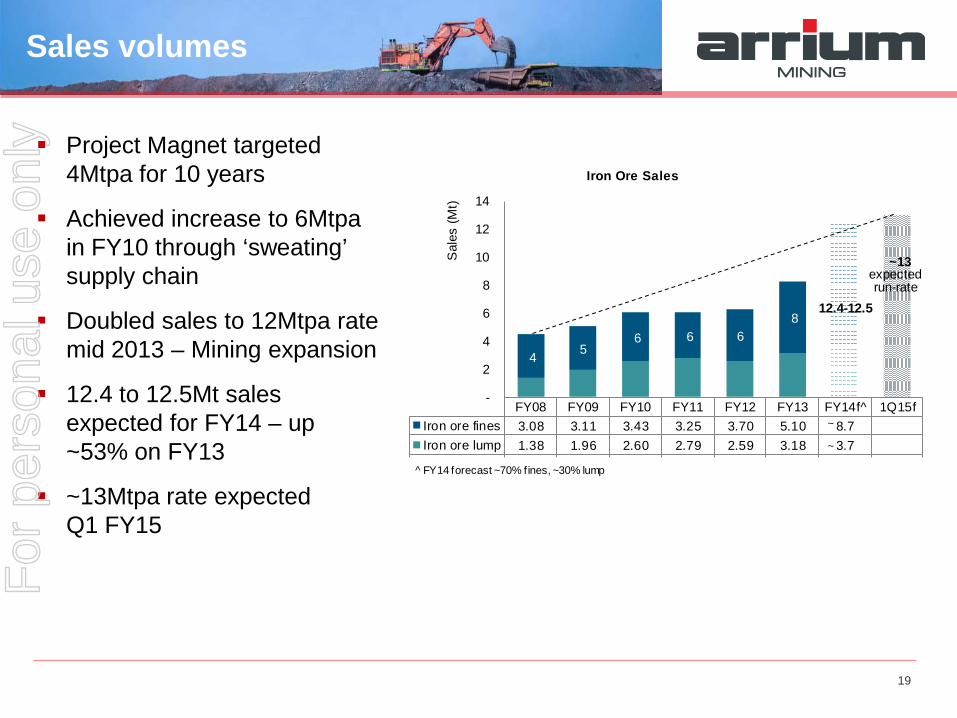
FY08 FY09 FY10 FY11 FY12 FY13 FY14f^ 1Q15fIron ore fines 3.08 3.11 3.43 3.25 3.70 5.10 8.7Iron ore lump 1.38 1.96 2.60 2.79 2.59 3.18 3.7Forecast 13.00
~13
4 56 6 6
8 12.4-12.5
-
2
4
6
8
10
12
14
Iron Ore Sales
Sal
es (M
t)
expected run-rate
^ FY14 forecast ~70% fines, ~30% lump
19
Project Magnet targeted 4Mtpa for 10 years
Achieved increase to 6Mtpa in FY10 through ‘sweating’ supply chain
Doubled sales to 12Mtpa rate mid 2013 – Mining expansion
12.4 to 12.5Mt sales expected for FY14 – up ~53% on FY13
~13Mtpa rate expected Q1 FY15
Sales volumes
~
~
For
per
sona
l use
onl
y
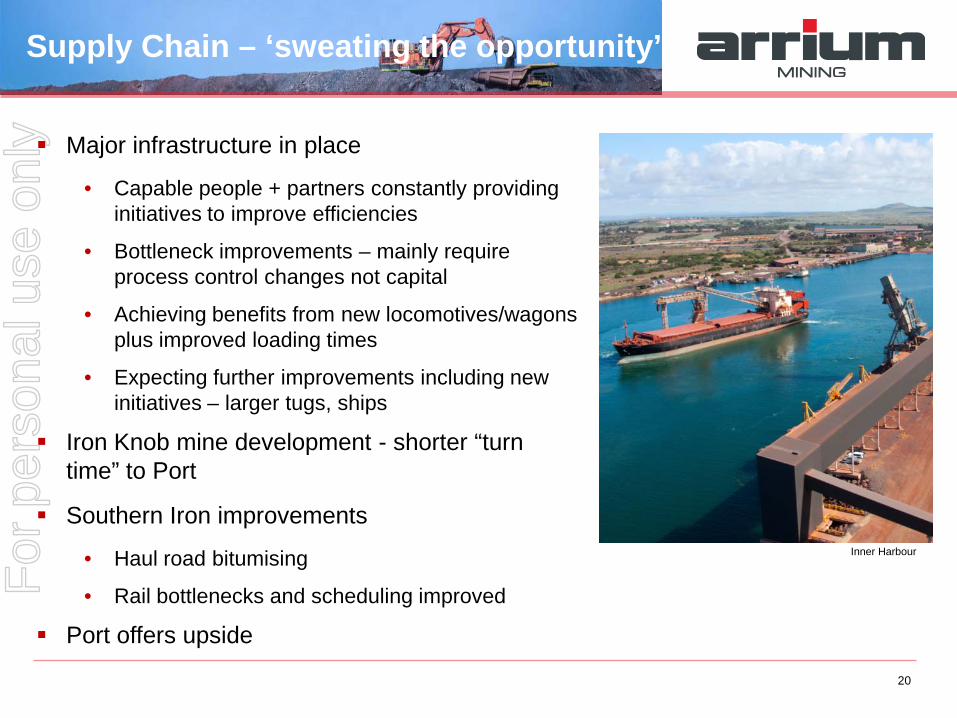
Supply Chain – ‘sweating the opportunity’
Major infrastructure in place
• Capable people + partners constantly providing initiatives to improve efficiencies
• Bottleneck improvements – mainly require process control changes not capital
• Achieving benefits from new locomotives/wagons plus improved loading times
• Expecting further improvements including new initiatives – larger tugs, ships
Iron Knob mine development - shorter “turn time” to Port
Southern Iron improvements
• Haul road bitumising
• Rail bottlenecks and scheduling improved
Port offers upside
20
Inner Harbour
For
per
sona
l use
onl
y
Cost Base Greg Waters Chief Executive, Mining
For
per
sona
l use
onl
y
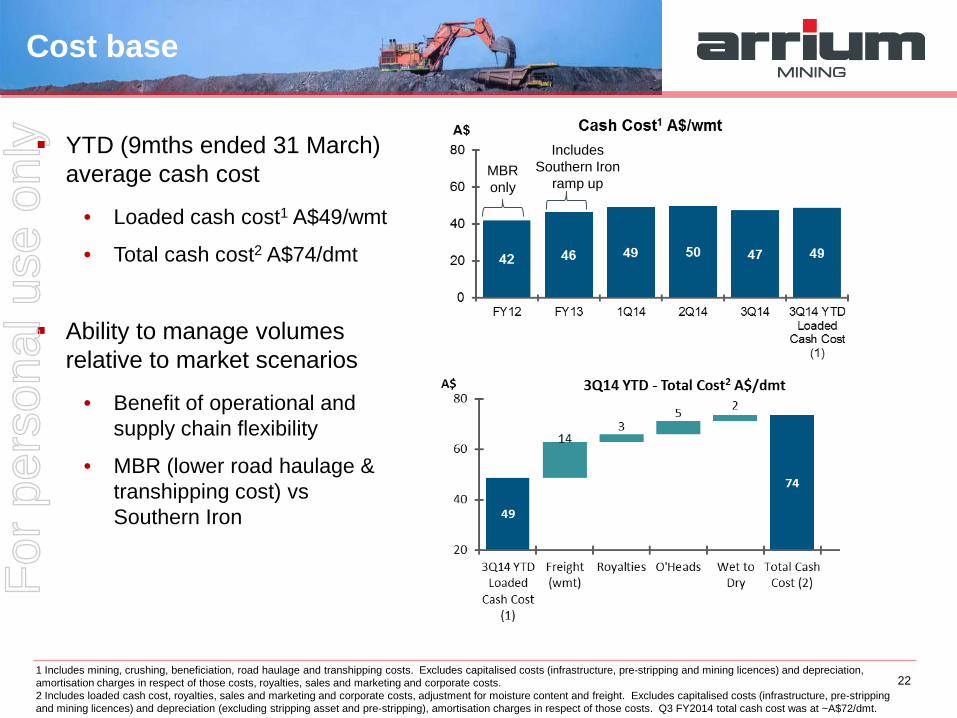
Cost base
YTD (9mths ended 31 March) average cash cost
• Loaded cash cost1 A$49/wmt
• Total cash cost2 A$74/dmt
Ability to manage volumes relative to market scenarios
• Benefit of operational and supply chain flexibility
• MBR (lower road haulage & transhipping cost) vs Southern Iron
1 Includes mining, crushing, beneficiation, road haulage and transhipping costs. Excludes capitalised costs (infrastructure, pre-stripping and mining licences) and depreciation, amortisation charges in respect of those costs, royalties, sales and marketing and corporate costs. 2 Includes loaded cash cost, royalties, sales and marketing and corporate costs, adjustment for moisture content and freight. Excludes capitalised costs (infrastructure, pre-stripping and mining licences) and depreciation (excluding stripping asset and pre-stripping), amortisation charges in respect of those costs. Q3 FY2014 total cash cost was at ~A$72/dmt.
MBR only
Includes Southern Iron
ramp up
22
For
per
sona
l use
onl
y
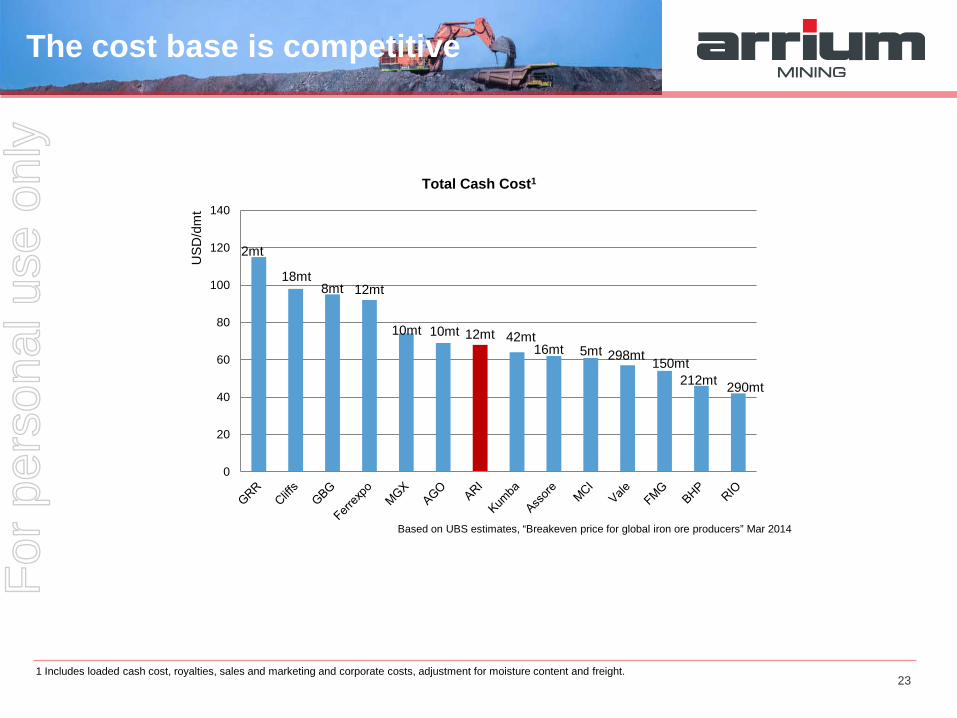
23 1 Includes loaded cash cost, royalties, sales and marketing and corporate costs, adjustment for moisture content and freight.
0
20
40
60
80
100
120
140 U
SD/d
mt
Total Cash Cost1
18mt 8mt
2mt
10mt
12mt
16mt 42mt
5mt 150mt
10mt
212mt 290mt
12mt 298mt
Based on UBS estimates, “Breakeven price for global iron ore producers” Mar 2014
The cost base is competitive F
or p
erso
nal u
se o
nly
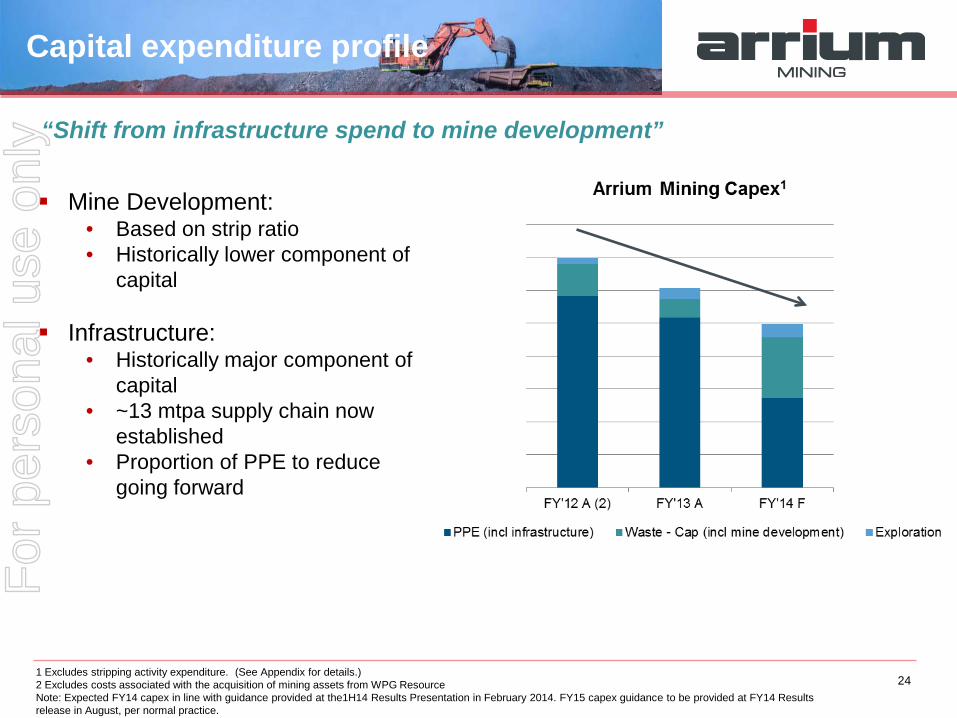
Capital expenditure profile
“Shift from infrastructure spend to mine development”
Mine Development: • Based on strip ratio • Historically lower component of
capital
Infrastructure: • Historically major component of
capital • ~13 mtpa supply chain now
established • Proportion of PPE to reduce
going forward
1 Excludes stripping activity expenditure. (See Appendix for details.) 2 Excludes costs associated with the acquisition of mining assets from WPG Resource Note: Expected FY14 capex in line with guidance provided at the1H14 Results Presentation in February 2014. FY15 capex guidance to be provided at FY14 Results release in August, per normal practice.
24
For
per
sona
l use
onl
y
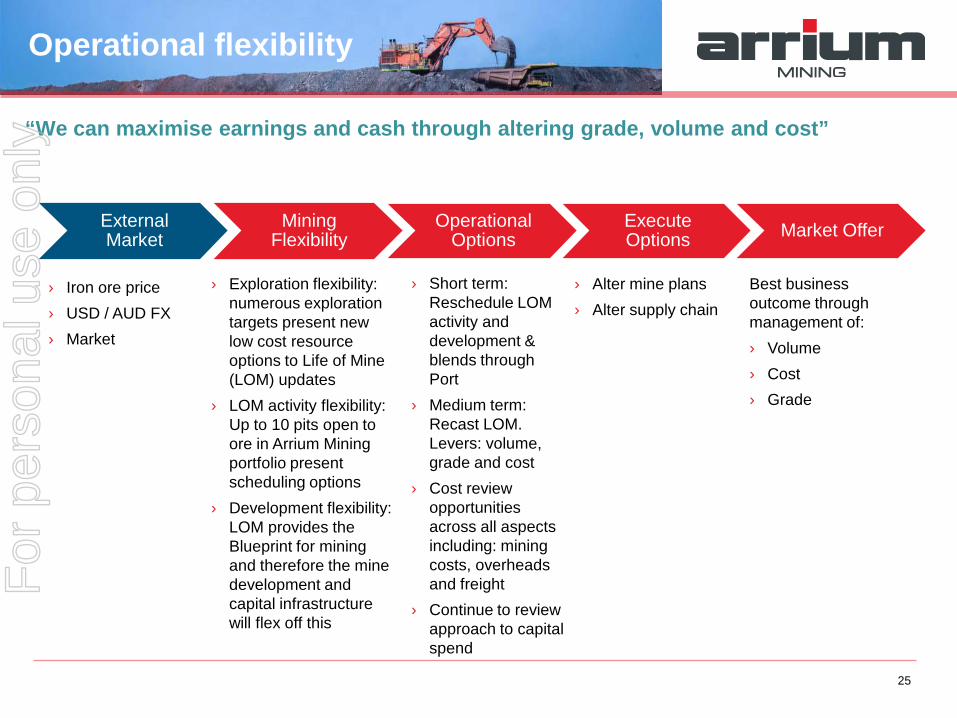
“We can maximise earnings and cash through altering grade, volume and cost”
25
Operational flexibility
External Market
Mining Flexibility
Operational Options
Execute Options Market Offer
› Iron ore price › USD / AUD FX › Market
› Exploration flexibility: numerous exploration targets present new low cost resource options to Life of Mine (LOM) updates
› LOM activity flexibility: Up to 10 pits open to ore in Arrium Mining portfolio present scheduling options
› Development flexibility: LOM provides the Blueprint for mining and therefore the mine development and capital infrastructure will flex off this
› Short term: Reschedule LOM activity and development & blends through Port
› Medium term: Recast LOM. Levers: volume, grade and cost
› Cost review opportunities across all aspects including: mining costs, overheads and freight
› Continue to review approach to capital spend
› Alter mine plans › Alter supply chain
Best business outcome through management of: › Volume › Cost › Grade
For
per
sona
l use
onl
y
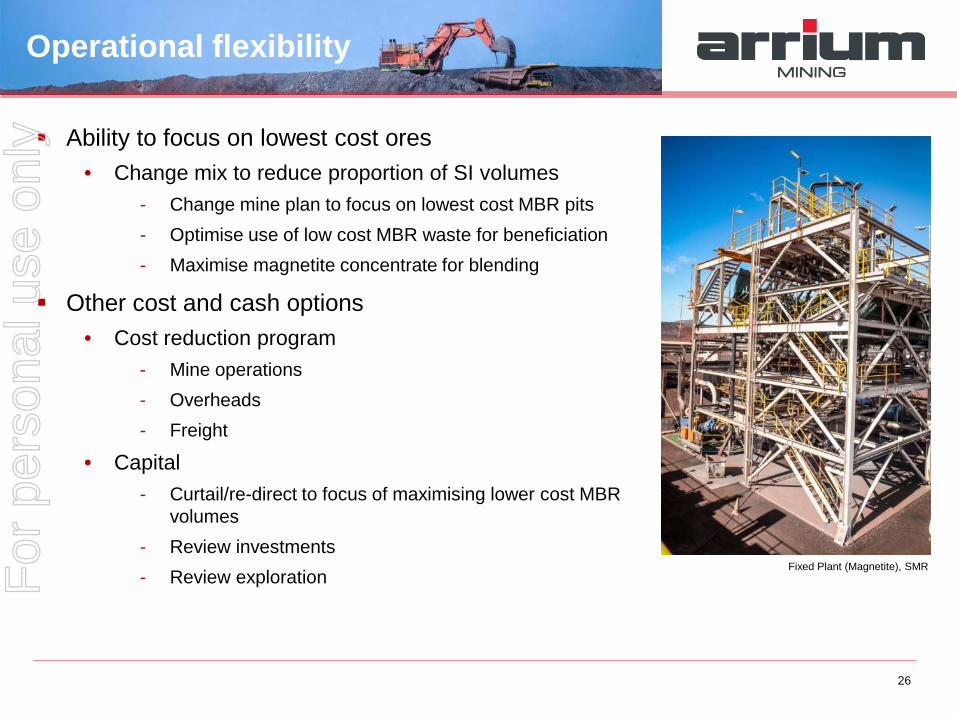
Operational flexibility
Ability to focus on lowest cost ores • Change mix to reduce proportion of SI volumes
- Change mine plan to focus on lowest cost MBR pits - Optimise use of low cost MBR waste for beneficiation - Maximise magnetite concentrate for blending
Other cost and cash options • Cost reduction program
- Mine operations - Overheads - Freight
• Capital - Curtail/re-direct to focus of maximising lower cost MBR
volumes - Review investments - Review exploration
26
Fixed Plant (Magnetite), SMR For
per
sona
l use
onl
y
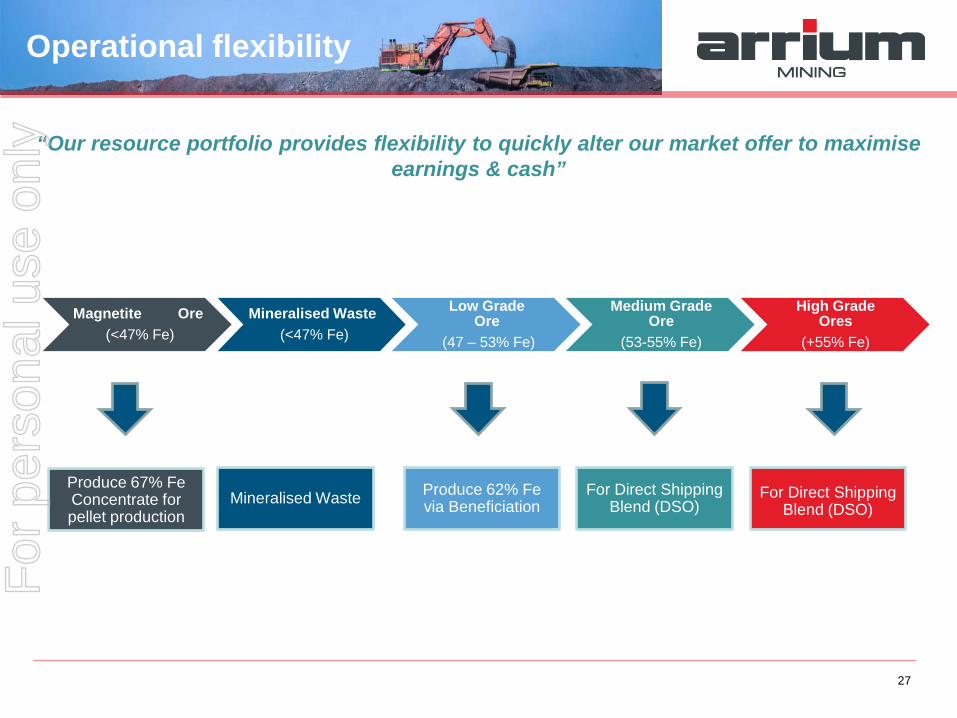
Operational flexibility
Magnetite Ore (<47% Fe)
Mineralised Waste (<47% Fe)
Low Grade Ore
(47 – 53% Fe)
Medium Grade Ore
(53-55% Fe)
High Grade Ores
(+55% Fe)
“Our resource portfolio provides flexibility to quickly alter our market offer to maximise earnings & cash”
27
Produce 67% Fe Concentrate for pellet production
Mineralised Waste Produce 62% Fe via Beneficiation
For Direct Shipping Blend (DSO)
For Direct Shipping Blend (DSO)
For
per
sona
l use
onl
y
Sales Longevity Gavin Hobart General Manager, Development
For
per
sona
l use
onl
y
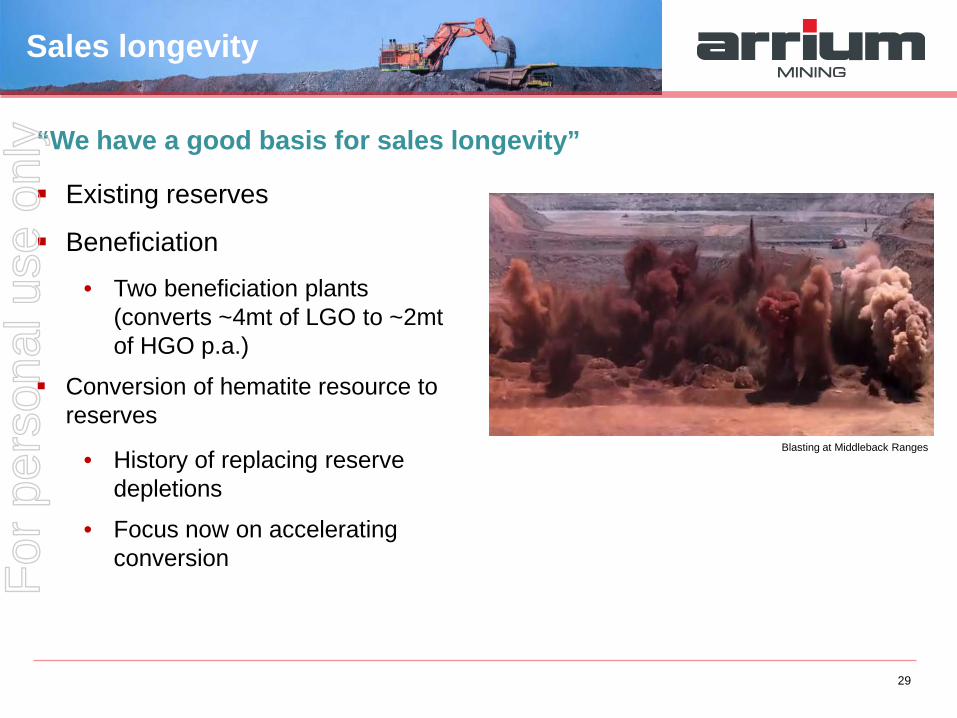
“We have a good basis for sales longevity”
Existing reserves
Beneficiation
• Two beneficiation plants (converts ~4mt of LGO to ~2mt of HGO p.a.)
Conversion of hematite resource to reserves
• History of replacing reserve depletions
• Focus now on accelerating conversion
Blasting at Middleback Ranges
Sales longevity
29
For
per
sona
l use
onl
y
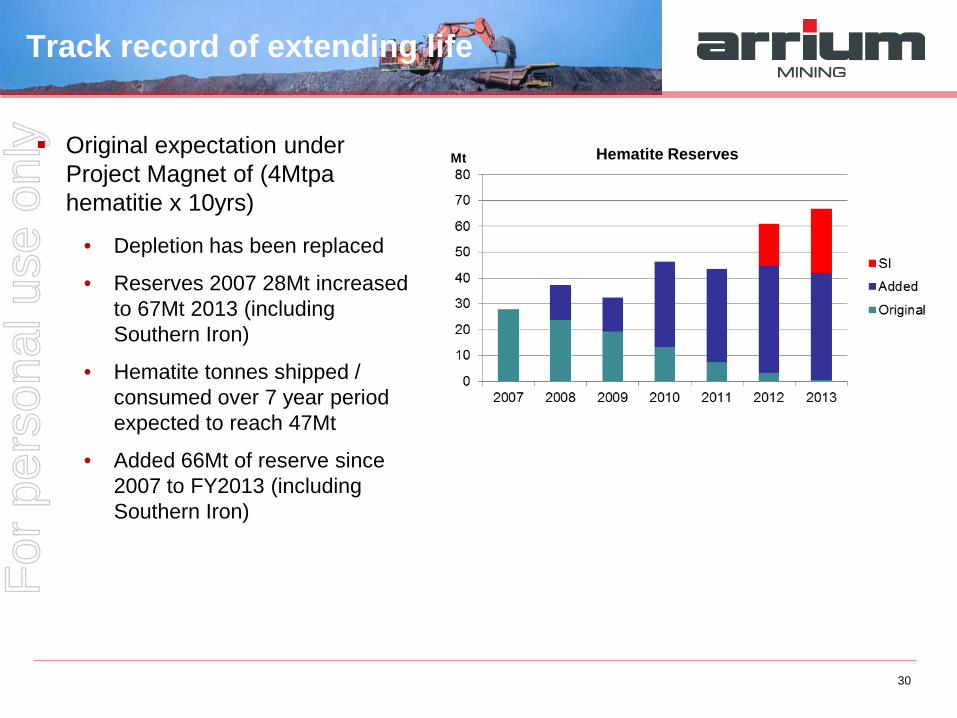
Mt Original expectation under
Project Magnet of (4Mtpa hematitie x 10yrs)
• Depletion has been replaced
• Reserves 2007 28Mt increased to 67Mt 2013 (including Southern Iron)
• Hematite tonnes shipped / consumed over 7 year period expected to reach 47Mt
• Added 66Mt of reserve since 2007 to FY2013 (including Southern Iron)
Hematite Reserves
Track record of extending life
30
For
per
sona
l use
onl
y
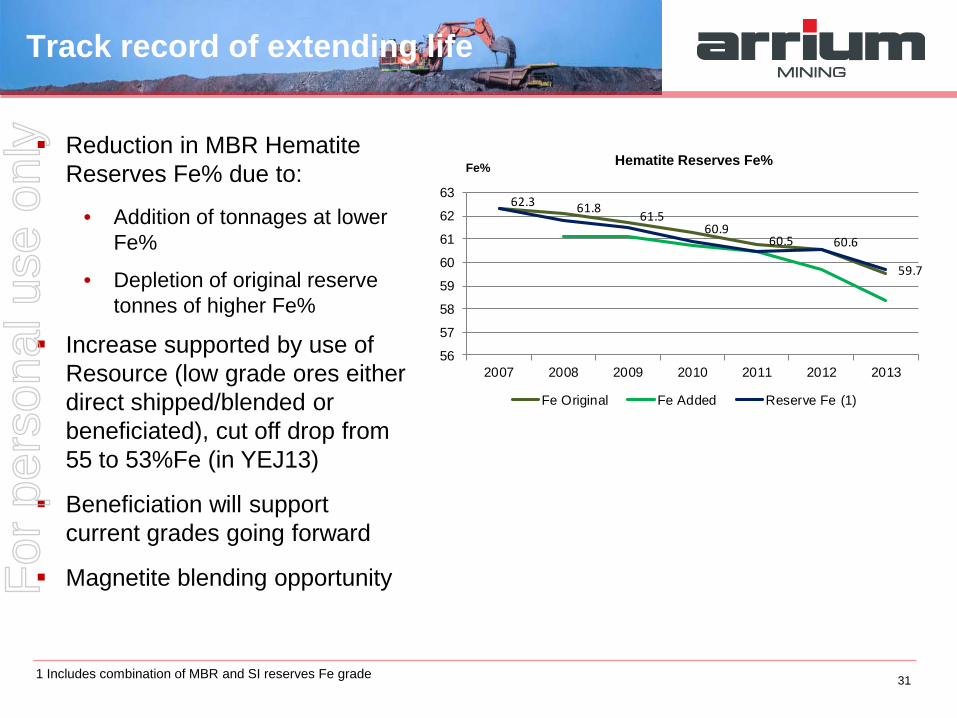
Fe%
62.3 61.8 61.560.9
60.5 60.6
59.7
56
57
58
59
60
61
62
63
2007 2008 2009 2010 2011 2012 2013
Fe Original Fe Added Reserve Fe (1)
Reduction in MBR Hematite Reserves Fe% due to:
• Addition of tonnages at lower Fe%
• Depletion of original reserve tonnes of higher Fe%
Increase supported by use of Resource (low grade ores either direct shipped/blended or beneficiated), cut off drop from 55 to 53%Fe (in YEJ13)
Beneficiation will support current grades going forward
Magnetite blending opportunity
Hematite Reserves Fe%
Track record of extending life
31 1 Includes combination of MBR and SI reserves Fe grade
For
per
sona
l use
onl
y
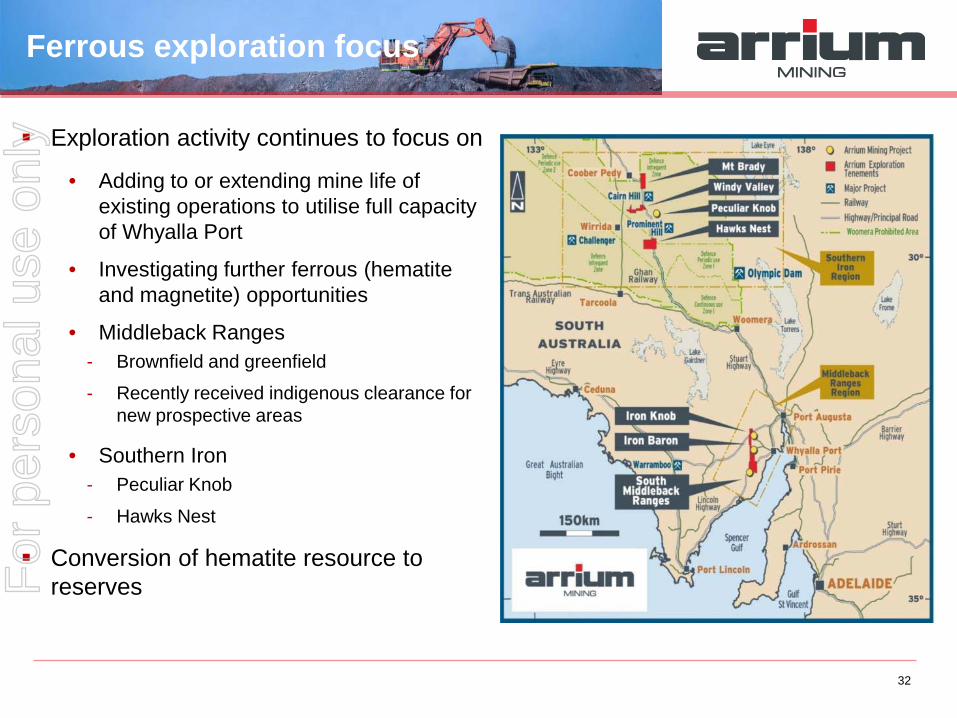
Ferrous exploration focus
Exploration activity continues to focus on
• Adding to or extending mine life of existing operations to utilise full capacity of Whyalla Port
• Investigating further ferrous (hematite and magnetite) opportunities
• Middleback Ranges - Brownfield and greenfield
- Recently received indigenous clearance for new prospective areas
• Southern Iron - Peculiar Knob
- Hawks Nest
Conversion of hematite resource to reserves
32
For
per
sona
l use
onl
y
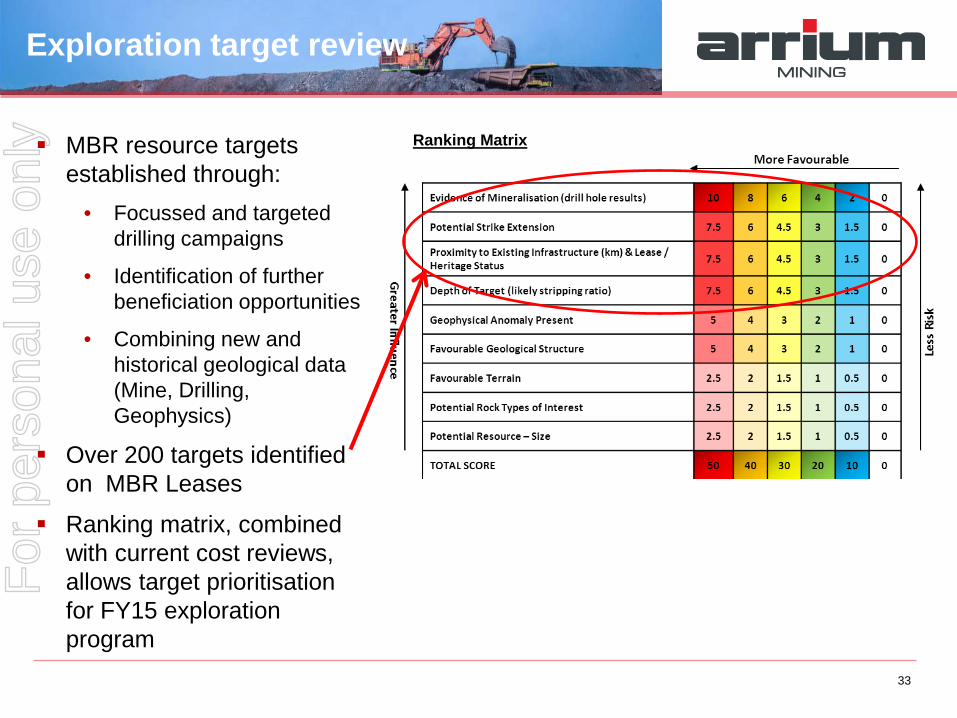
MBR resource targets established through:
• Focussed and targeted drilling campaigns
• Identification of further beneficiation opportunities
• Combining new and historical geological data (Mine, Drilling, Geophysics)
Over 200 targets identified on MBR Leases
Ranking matrix, combined with current cost reviews, allows target prioritisation for FY15 exploration program
Ranking Matrix
Exploration target review
33
For
per
sona
l use
onl
y
Exploration – MBR
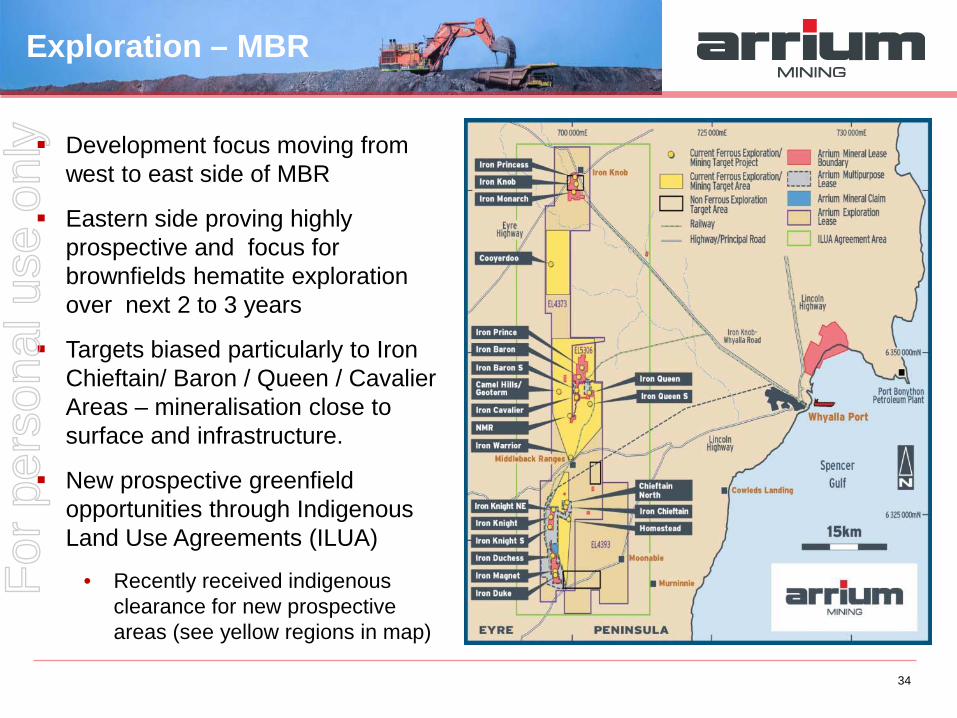
Development focus moving from west to east side of MBR
Eastern side proving highly prospective and focus for brownfields hematite exploration over next 2 to 3 years
Targets biased particularly to Iron Chieftain/ Baron / Queen / Cavalier Areas – mineralisation close to surface and infrastructure.
New prospective greenfield opportunities through Indigenous Land Use Agreements (ILUA)
• Recently received indigenous clearance for new prospective areas (see yellow regions in map)
34
For
per
sona
l use
onl
y
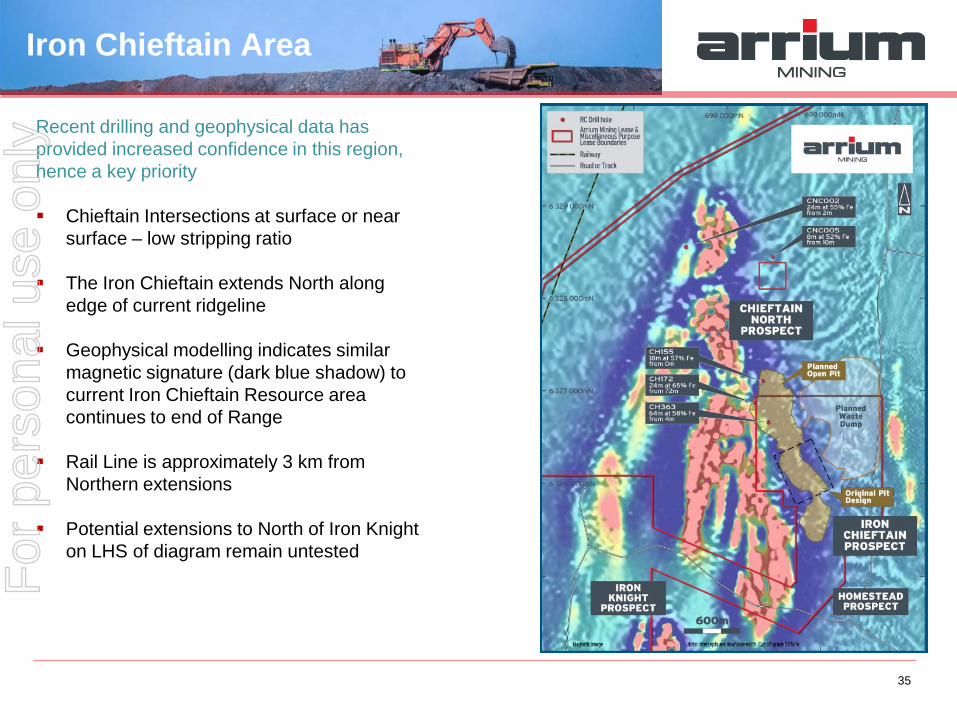
Recent drilling and geophysical data has provided increased confidence in this region, hence a key priority Chieftain Intersections at surface or near
surface – low stripping ratio
The Iron Chieftain extends North along edge of current ridgeline
Geophysical modelling indicates similar magnetic signature (dark blue shadow) to current Iron Chieftain Resource area continues to end of Range
Rail Line is approximately 3 km from Northern extensions
Potential extensions to North of Iron Knight on LHS of diagram remain untested
Iron Chieftain Area
35
For
per
sona
l use
onl
y
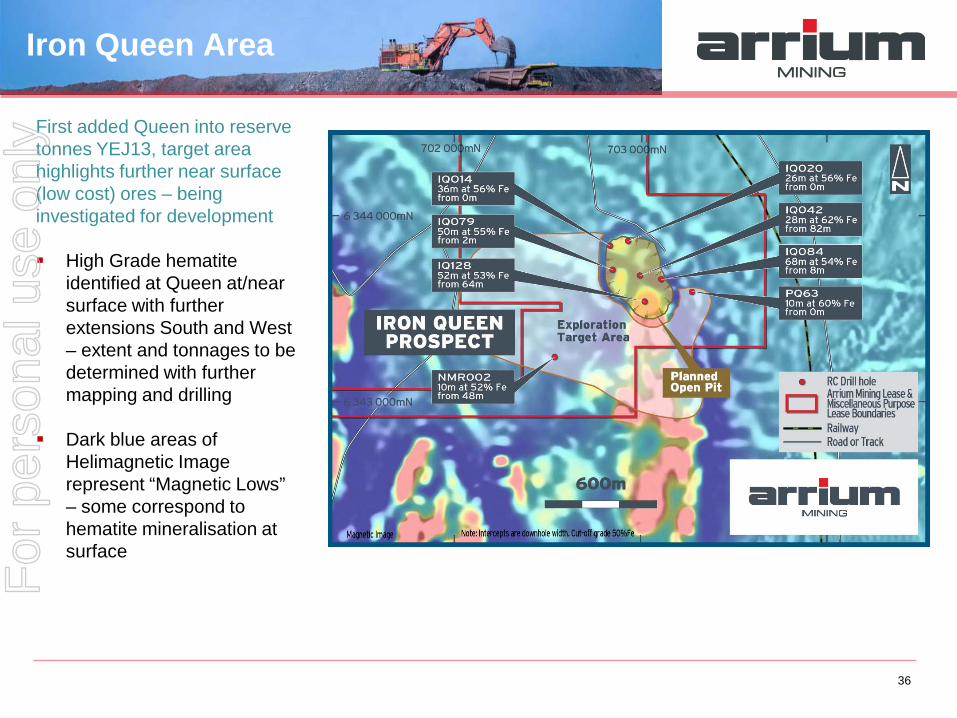
First added Queen into reserve tonnes YEJ13, target area highlights further near surface (low cost) ores – being investigated for development High Grade hematite
identified at Queen at/near surface with further extensions South and West – extent and tonnages to be determined with further mapping and drilling
Dark blue areas of Helimagnetic Image represent “Magnetic Lows” – some correspond to hematite mineralisation at surface
Iron Queen Area
36
For
per
sona
l use
onl
y
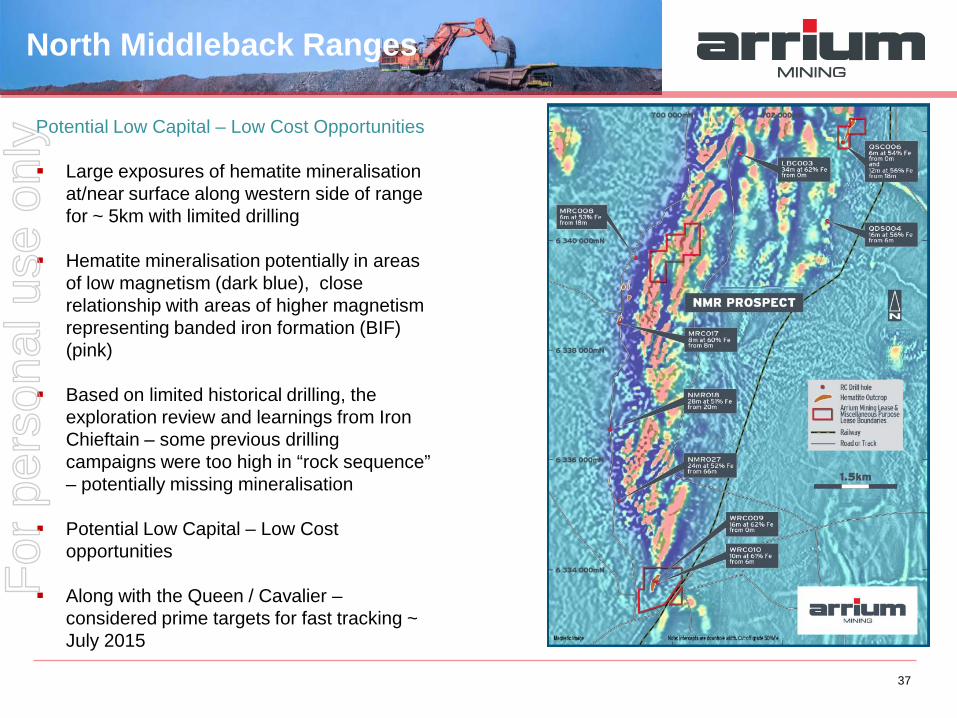
Potential Low Capital – Low Cost Opportunities Large exposures of hematite mineralisation
at/near surface along western side of range for ~ 5km with limited drilling
Hematite mineralisation potentially in areas of low magnetism (dark blue), close relationship with areas of higher magnetism representing banded iron formation (BIF) (pink)
Based on limited historical drilling, the exploration review and learnings from Iron Chieftain – some previous drilling campaigns were too high in “rock sequence” – potentially missing mineralisation
Potential Low Capital – Low Cost opportunities
Along with the Queen / Cavalier – considered prime targets for fast tracking ~ July 2015
North Middleback Ranges
37
For
per
sona
l use
onl
y
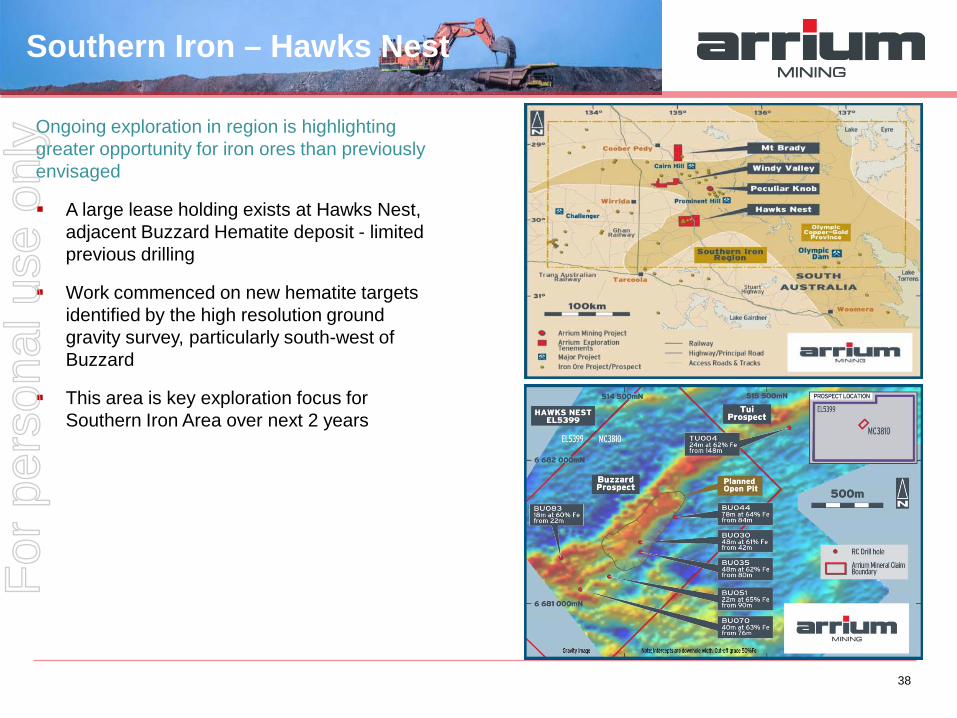
Ongoing exploration in region is highlighting greater opportunity for iron ores than previously envisaged
A large lease holding exists at Hawks Nest, adjacent Buzzard Hematite deposit - limited previous drilling
Work commenced on new hematite targets identified by the high resolution ground gravity survey, particularly south-west of Buzzard
This area is key exploration focus for Southern Iron Area over next 2 years
Southern Iron – Hawks Nest
38
For
per
sona
l use
onl
y
39
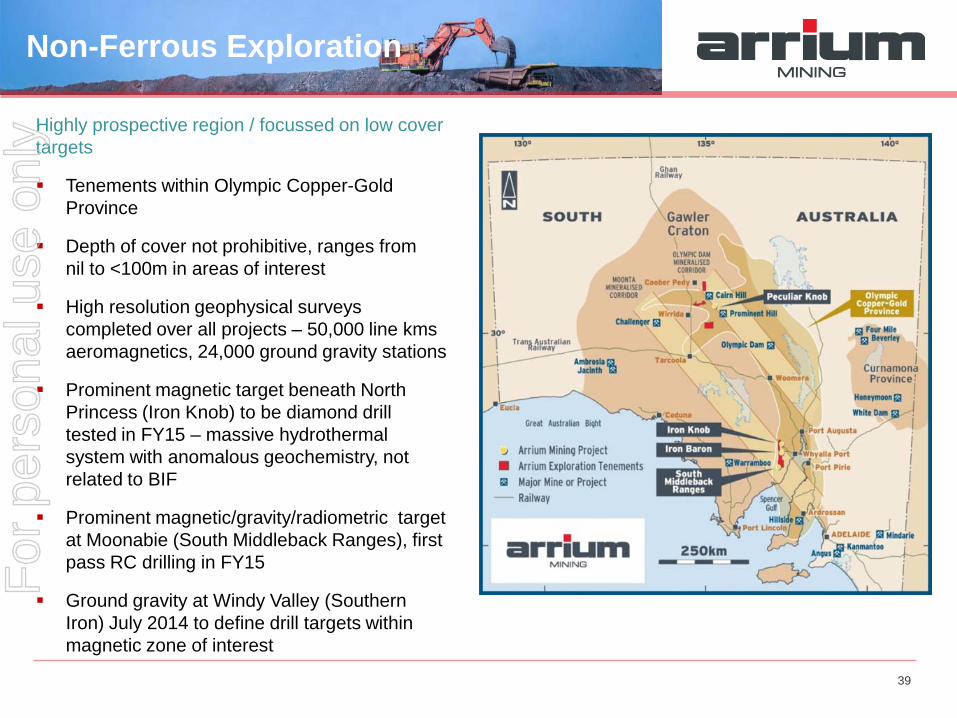
Highly prospective region / focussed on low cover targets
Tenements within Olympic Copper-Gold Province
Depth of cover not prohibitive, ranges from nil to <100m in areas of interest
High resolution geophysical surveys completed over all projects – 50,000 line kms aeromagnetics, 24,000 ground gravity stations
Prominent magnetic target beneath North Princess (Iron Knob) to be diamond drill tested in FY15 – massive hydrothermal system with anomalous geochemistry, not related to BIF
Prominent magnetic/gravity/radiometric target at Moonabie (South Middleback Ranges), first pass RC drilling in FY15
Ground gravity at Windy Valley (Southern Iron) July 2014 to define drill targets within magnetic zone of interest
Non-Ferrous Exploration F
or p
erso
nal u
se o
nly
Whyalla Port and Infrastructure Jon Hobbs General Manager, Whyalla Port
For
per
sona
l use
onl
y
41
Whyalla Port facilities
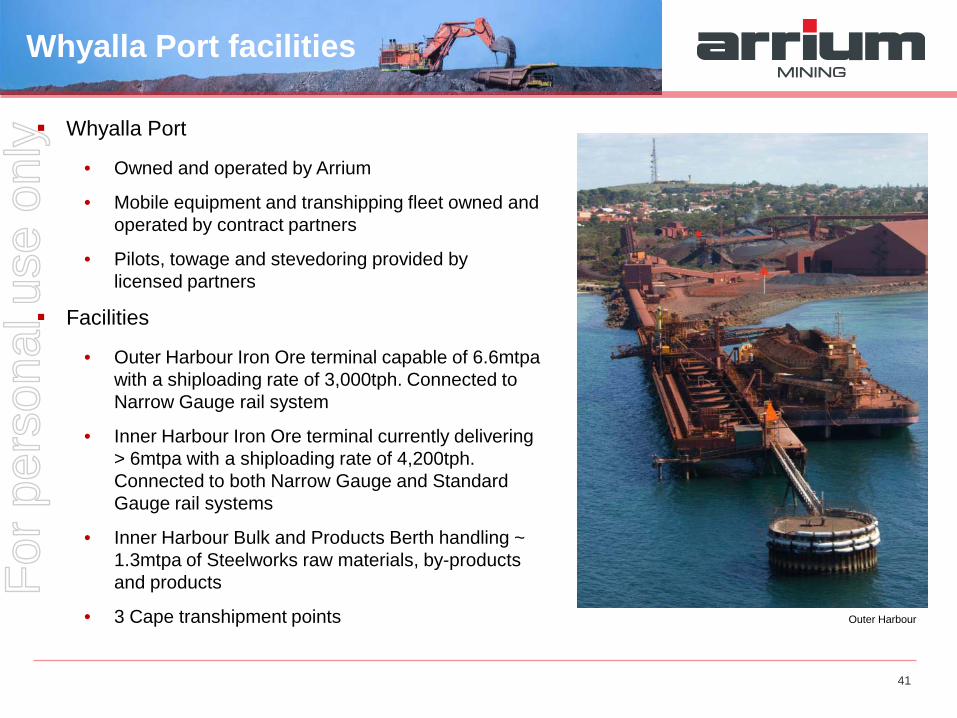
Whyalla Port
• Owned and operated by Arrium
• Mobile equipment and transhipping fleet owned and operated by contract partners
• Pilots, towage and stevedoring provided by licensed partners
Facilities
• Outer Harbour Iron Ore terminal capable of 6.6mtpa with a shiploading rate of 3,000tph. Connected to Narrow Gauge rail system
• Inner Harbour Iron Ore terminal currently delivering > 6mtpa with a shiploading rate of 4,200tph. Connected to both Narrow Gauge and Standard Gauge rail systems
• Inner Harbour Bulk and Products Berth handling ~ 1.3mtpa of Steelworks raw materials, by-products and products
• 3 Cape transhipment points Outer Harbour
For
per
sona
l use
onl
y
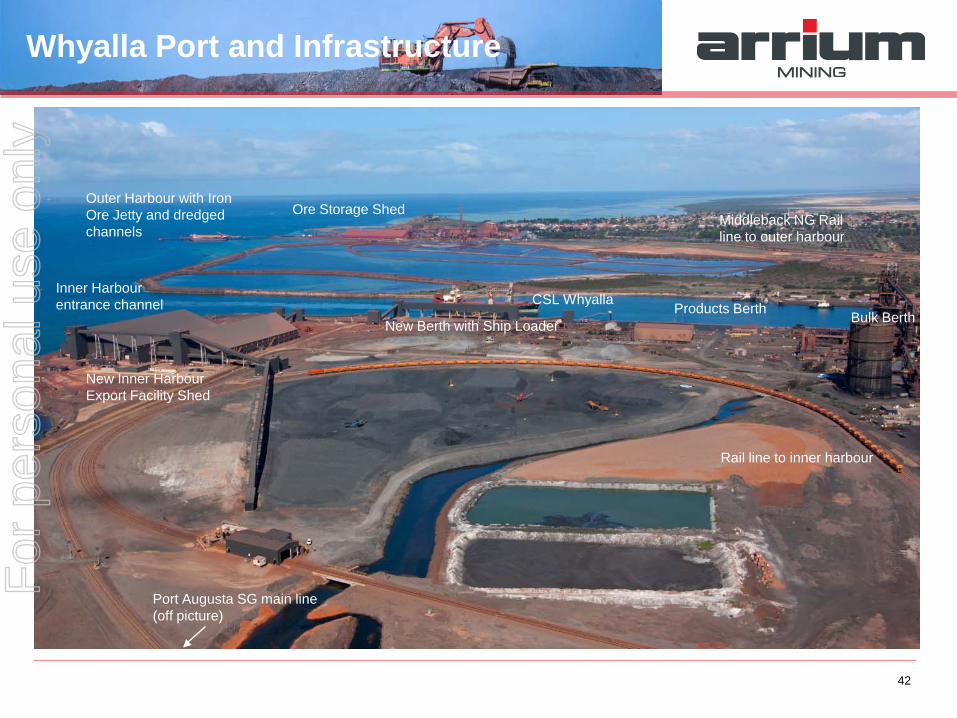
Whyalla Port and Infrastructure
Inner Harbour entrance channel
Ore Storage Shed Outer Harbour with Iron Ore Jetty and dredged channels
Products Berth
Middleback NG Rail line to outer harbour
New Berth with Ship Loader
New Inner Harbour Export Facility Shed
CSL Whyalla
Port Augusta SG main line (off picture)
Rail line to inner harbour
Bulk Berth
42
For
per
sona
l use
onl
y
43
Iron Ore Terminals performance
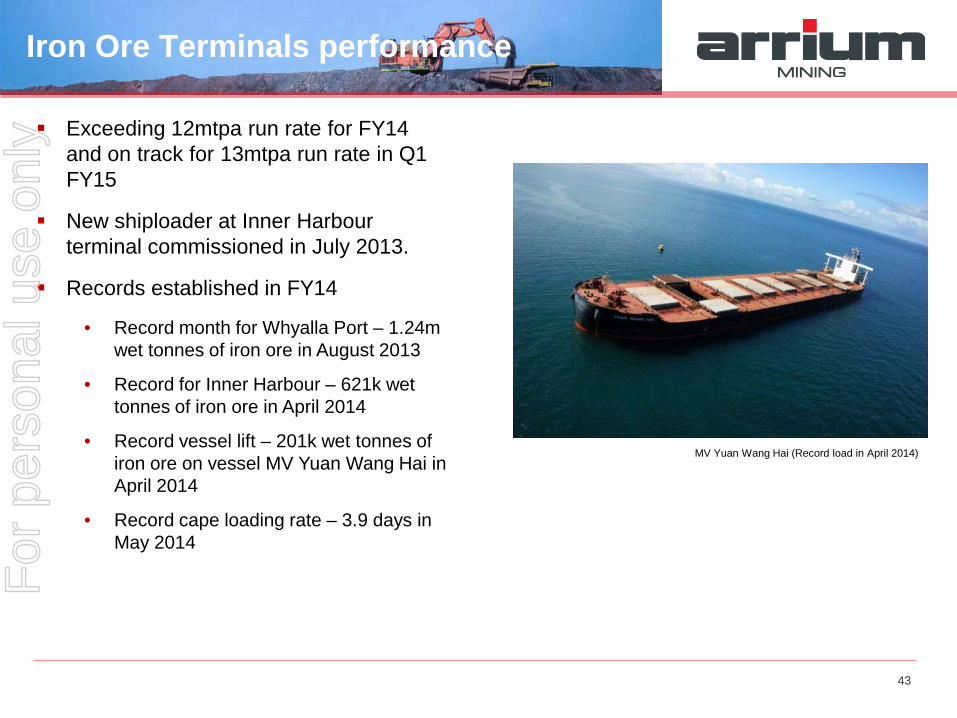
Exceeding 12mtpa run rate for FY14 and on track for 13mtpa run rate in Q1 FY15
New shiploader at Inner Harbour terminal commissioned in July 2013.
Records established in FY14
• Record month for Whyalla Port – 1.24m wet tonnes of iron ore in August 2013
• Record for Inner Harbour – 621k wet tonnes of iron ore in April 2014
• Record vessel lift – 201k wet tonnes of iron ore on vessel MV Yuan Wang Hai in April 2014
• Record cape loading rate – 3.9 days in May 2014
MV Yuan Wang Hai (Record load in April 2014)
For
per
sona
l use
onl
y
44
Whyalla Port future potential
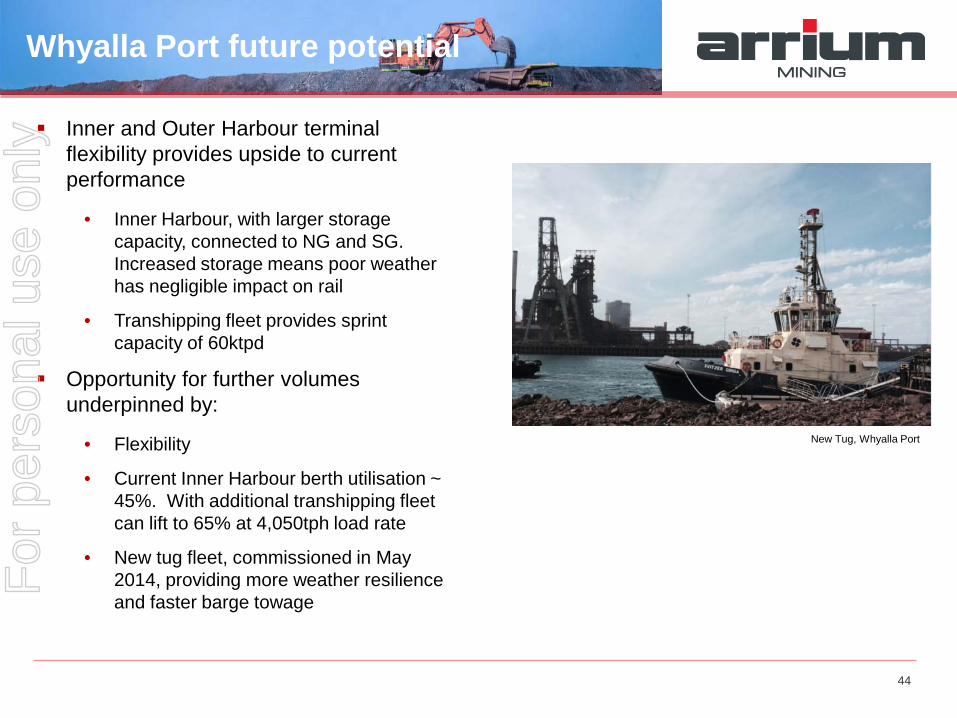
Inner and Outer Harbour terminal flexibility provides upside to current performance
• Inner Harbour, with larger storage capacity, connected to NG and SG. Increased storage means poor weather has negligible impact on rail
• Transhipping fleet provides sprint capacity of 60ktpd
Opportunity for further volumes underpinned by:
• Flexibility
• Current Inner Harbour berth utilisation ~ 45%. With additional transhipping fleet can lift to 65% at 4,050tph load rate
• New tug fleet, commissioned in May 2014, providing more weather resilience and faster barge towage
New Tug, Whyalla Port
For
per
sona
l use
onl
y

Summary
For
per
sona
l use
onl
y
46
Summary
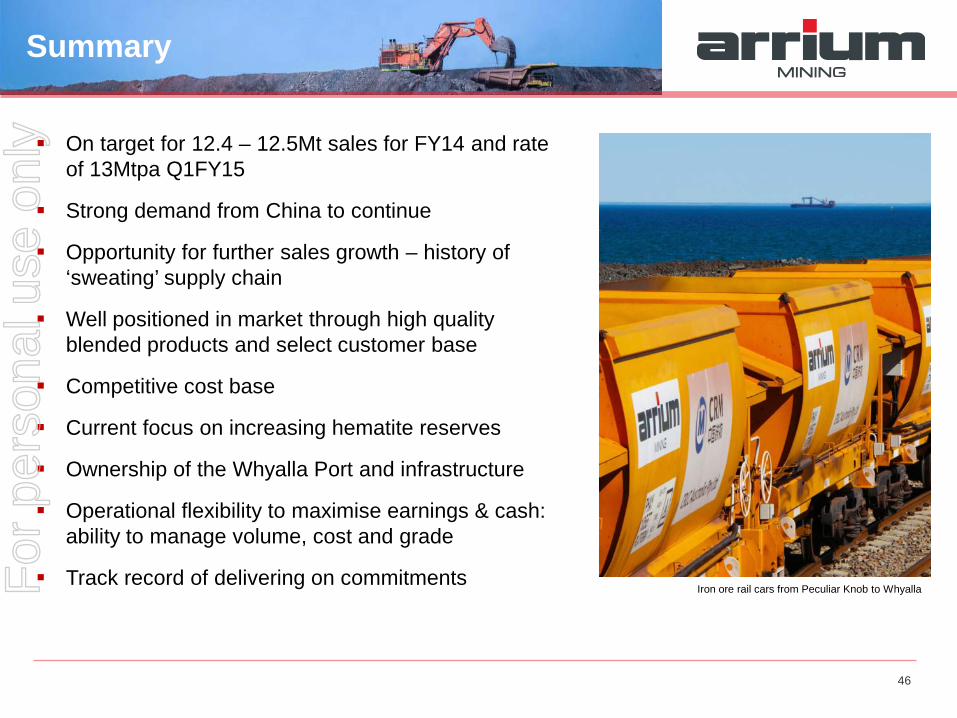
On target for 12.4 – 12.5Mt sales for FY14 and rate of 13Mtpa Q1FY15
Strong demand from China to continue
Opportunity for further sales growth – history of ‘sweating’ supply chain
Well positioned in market through high quality blended products and select customer base
Competitive cost base
Current focus on increasing hematite reserves
Ownership of the Whyalla Port and infrastructure
Operational flexibility to maximise earnings & cash: ability to manage volume, cost and grade
Track record of delivering on commitments Iron ore rail cars from Peculiar Knob to Whyalla F
or p
erso
nal u
se o
nly
Appendix
For
per
sona
l use
onl
y
48
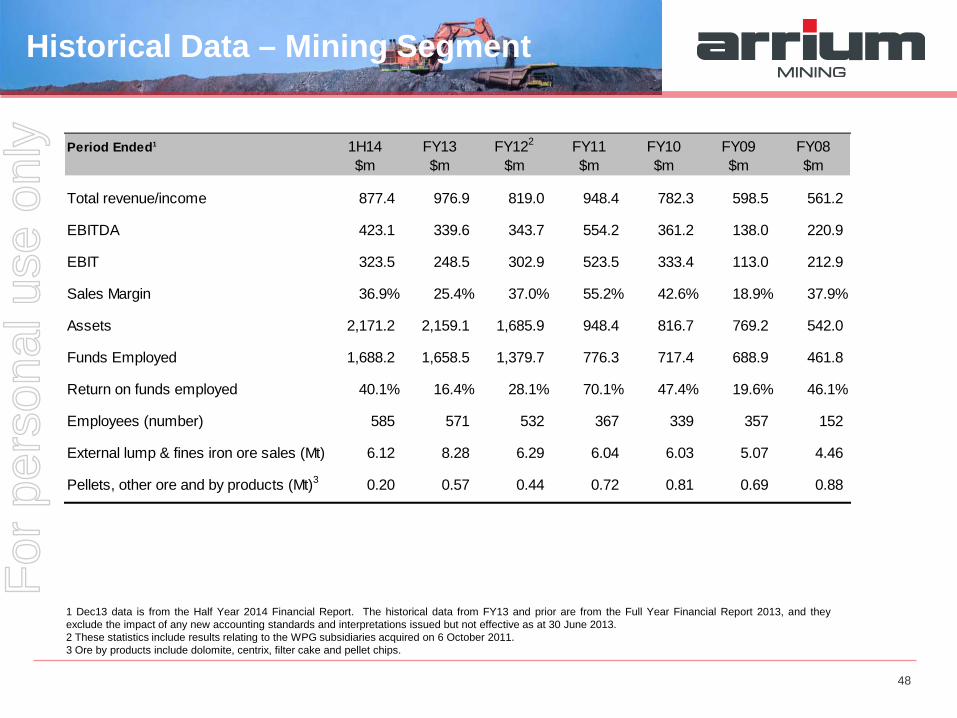
Historical Data – Mining Segment
1 Dec13 data is from the Half Year 2014 Financial Report. The historical data from FY13 and prior are from the Full Year Financial Report 2013, and they exclude the impact of any new accounting standards and interpretations issued but not effective as at 30 June 2013. 2 These statistics include results relating to the WPG subsidiaries acquired on 6 October 2011. 3 Ore by products include dolomite, centrix, filter cake and pellet chips.
Period Ended1 1H14 FY13 FY122 FY11 FY10 FY09 FY08$m $m $m $m $m $m $m
Total revenue/income 877.4 976.9 819.0 948.4 782.3 598.5 561.2
EBITDA 423.1 339.6 343.7 554.2 361.2 138.0 220.9
EBIT 323.5 248.5 302.9 523.5 333.4 113.0 212.9
Sales Margin 36.9% 25.4% 37.0% 55.2% 42.6% 18.9% 37.9%
Assets 2,171.2 2,159.1 1,685.9 948.4 816.7 769.2 542.0
Funds Employed 1,688.2 1,658.5 1,379.7 776.3 717.4 688.9 461.8
Return on funds employed 40.1% 16.4% 28.1% 70.1% 47.4% 19.6% 46.1%
Employees (number) 585 571 532 367 339 357 152
External lump & fines iron ore sales (Mt) 6.12 8.28 6.29 6.04 6.03 5.07 4.46
Pellets, other ore and by products (Mt)3 0.20 0.57 0.44 0.72 0.81 0.69 0.88
For
per
sona
l use
onl
y
IFRIC 20
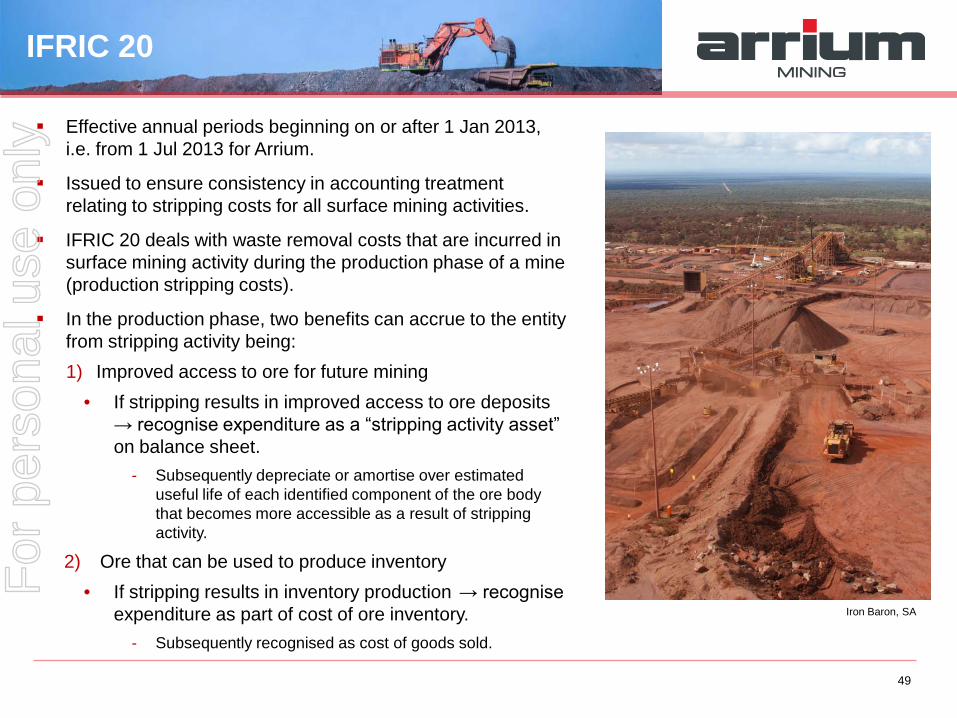
Effective annual periods beginning on or after 1 Jan 2013, i.e. from 1 Jul 2013 for Arrium.
Issued to ensure consistency in accounting treatment relating to stripping costs for all surface mining activities.
IFRIC 20 deals with waste removal costs that are incurred in surface mining activity during the production phase of a mine (production stripping costs).
In the production phase, two benefits can accrue to the entity from stripping activity being: 1) Improved access to ore for future mining
• If stripping results in improved access to ore deposits → recognise expenditure as a “stripping activity asset” on balance sheet.
- Subsequently depreciate or amortise over estimated useful life of each identified component of the ore body that becomes more accessible as a result of stripping activity.
2) Ore that can be used to produce inventory • If stripping results in inventory production → recognise
expenditure as part of cost of ore inventory. - Subsequently recognised as cost of goods sold.
Iron Baron, SA
49
For
per
sona
l use
onl
y
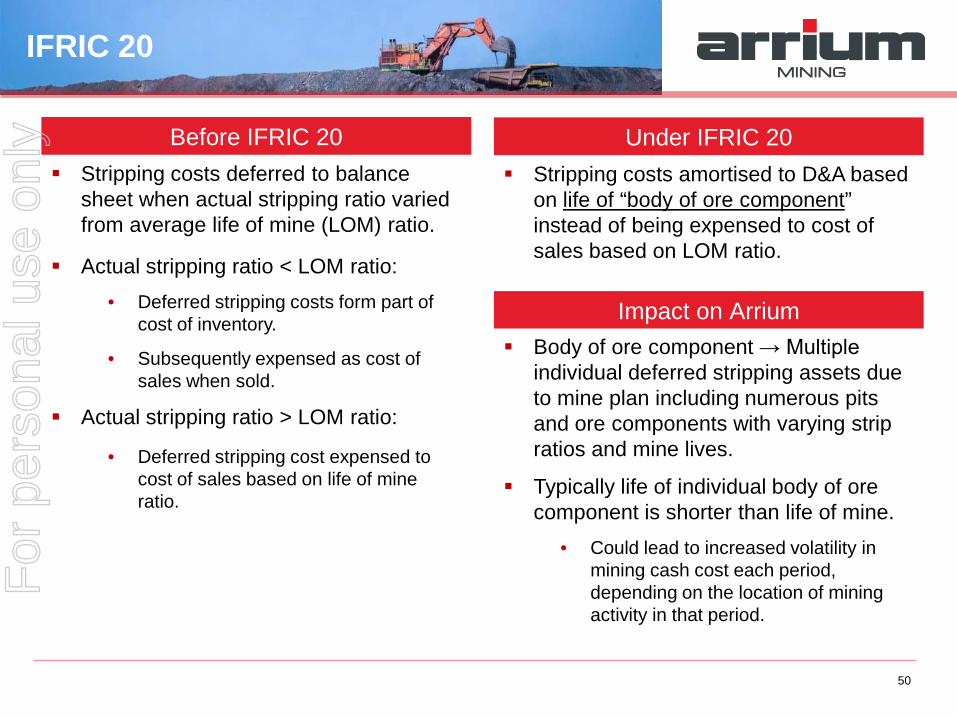
IFRIC 20
Stripping costs deferred to balance sheet when actual stripping ratio varied from average life of mine (LOM) ratio.
Actual stripping ratio < LOM ratio: • Deferred stripping costs form part of
cost of inventory.
• Subsequently expensed as cost of sales when sold.
Actual stripping ratio > LOM ratio:
• Deferred stripping cost expensed to cost of sales based on life of mine ratio.
Before IFRIC 20 Stripping costs amortised to D&A based
on life of “body of ore component” instead of being expensed to cost of sales based on LOM ratio.
Under IFRIC 20
Impact on Arrium Body of ore component → Multiple
individual deferred stripping assets due to mine plan including numerous pits and ore components with varying strip ratios and mine lives.
Typically life of individual body of ore component is shorter than life of mine.
• Could lead to increased volatility in mining cash cost each period, depending on the location of mining activity in that period.
50
For
per
sona
l use
onl
y
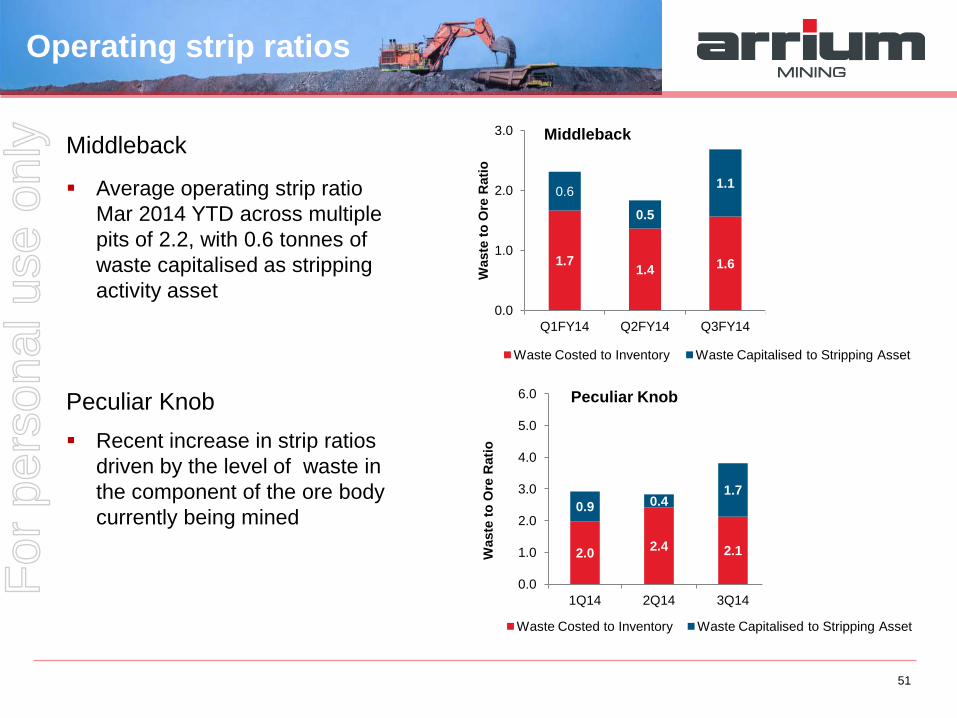
Operating strip ratios
Middleback
Average operating strip ratio Mar 2014 YTD across multiple pits of 2.2, with 0.6 tonnes of waste capitalised as stripping activity asset
Peculiar Knob Recent increase in strip ratios
driven by the level of waste in the component of the ore body currently being mined
51
1.7 1.4 1.6 1.4 1.3
0.6
0.5
1.1 1.0
0.7
0.0
1.0
2.0
3.0
Q1FY14 Q2FY14 Q3FY14 Q4FY14 FY15
Was
te to
Ore
Rat
io
Middleback
Waste Costed to Inventory Waste Capitalised to Stripping Asset
2.0 2.4 2.1 2.8 3.1
0.9 0.4 1.7
2.2 1.5
0.0
1.0
2.0
3.0
4.0
5.0
6.0
1Q14 2Q14 3Q14 4Q14 FY15
Was
te to
Ore
Rat
io
Peculiar Knob
Waste Costed to Inventory Waste Capitalised to Stripping Asset
For
per
sona
l use
onl
y
Attachment – Exploration Results
For
per
sona
l use
onl
y
53
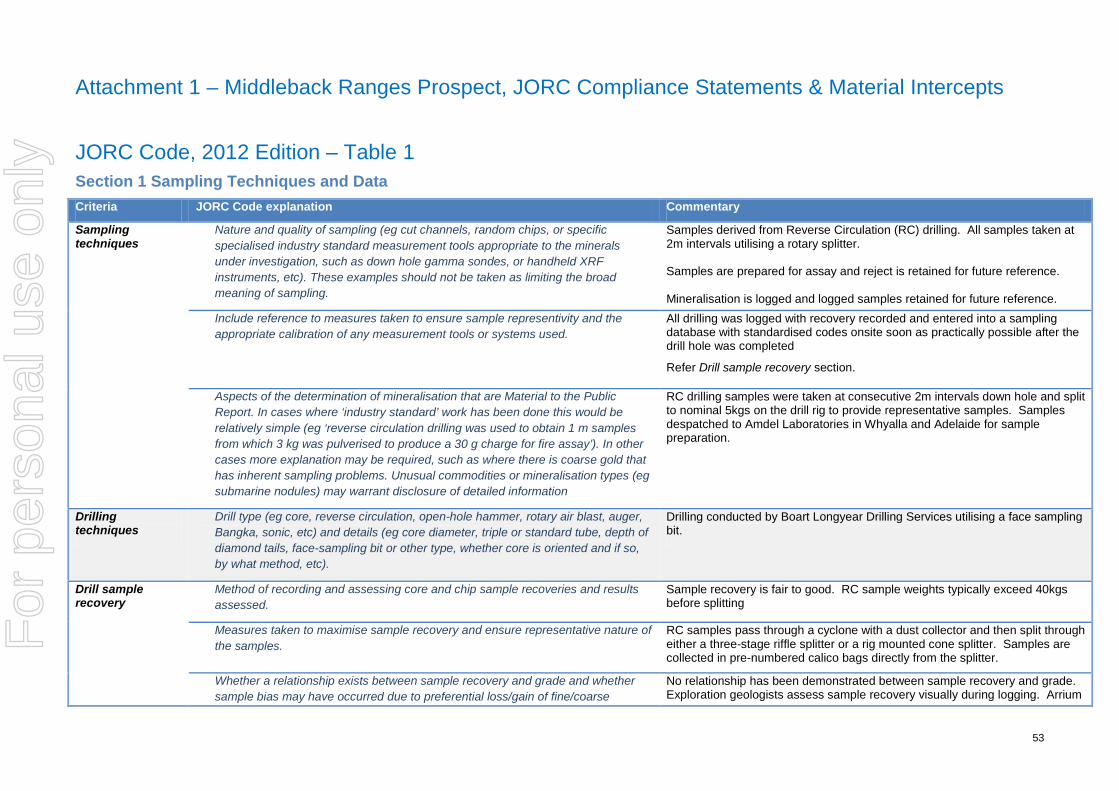
Attachment 1 – Middleback Ranges Prospect, JORC Compliance Statements & Material Intercepts JORC Code, 2012 Edition – Table 1 Section 1 Sampling Techniques and Data Criteria JORC Code explanation Commentary
Sampling techniques
Nature and quality of sampling (eg cut channels, random chips, or specific specialised industry standard measurement tools appropriate to the minerals under investigation, such as down hole gamma sondes, or handheld XRF instruments, etc). These examples should not be taken as limiting the broad meaning of sampling.
Samples derived from Reverse Circulation (RC) drilling. All samples taken at 2m intervals utilising a rotary splitter. Samples are prepared for assay and reject is retained for future reference. Mineralisation is logged and logged samples retained for future reference.
Include reference to measures taken to ensure sample representivity and the appropriate calibration of any measurement tools or systems used.
All drilling was logged with recovery recorded and entered into a sampling database with standardised codes onsite soon as practically possible after the drill hole was completed
Refer Drill sample recovery section.
Aspects of the determination of mineralisation that are Material to the Public Report. In cases where ‘industry standard’ work has been done this would be relatively simple (eg ‘reverse circulation drilling was used to obtain 1 m samples from which 3 kg was pulverised to produce a 30 g charge for fire assay’). In other cases more explanation may be required, such as where there is coarse gold that has inherent sampling problems. Unusual commodities or mineralisation types (eg submarine nodules) may warrant disclosure of detailed information
RC drilling samples were taken at consecutive 2m intervals down hole and split to nominal 5kgs on the drill rig to provide representative samples. Samples despatched to Amdel Laboratories in Whyalla and Adelaide for sample preparation.
Drilling techniques
Drill type (eg core, reverse circulation, open-hole hammer, rotary air blast, auger, Bangka, sonic, etc) and details (eg core diameter, triple or standard tube, depth of diamond tails, face-sampling bit or other type, whether core is oriented and if so, by what method, etc).
Drilling conducted by Boart Longyear Drilling Services utilising a face sampling bit.
Drill sample recovery
Method of recording and assessing core and chip sample recoveries and results assessed.
Sample recovery is fair to good. RC sample weights typically exceed 40kgs before splitting
Measures taken to maximise sample recovery and ensure representative nature of the samples.
RC samples pass through a cyclone with a dust collector and then split through either a three-stage riffle splitter or a rig mounted cone splitter. Samples are collected in pre-numbered calico bags directly from the splitter.
Whether a relationship exists between sample recovery and grade and whether sample bias may have occurred due to preferential loss/gain of fine/coarse
No relationship has been demonstrated between sample recovery and grade. Exploration geologists assess sample recovery visually during logging. Arrium
For
per
sona
l use
onl
y
54
Criteria JORC Code explanation Commentary
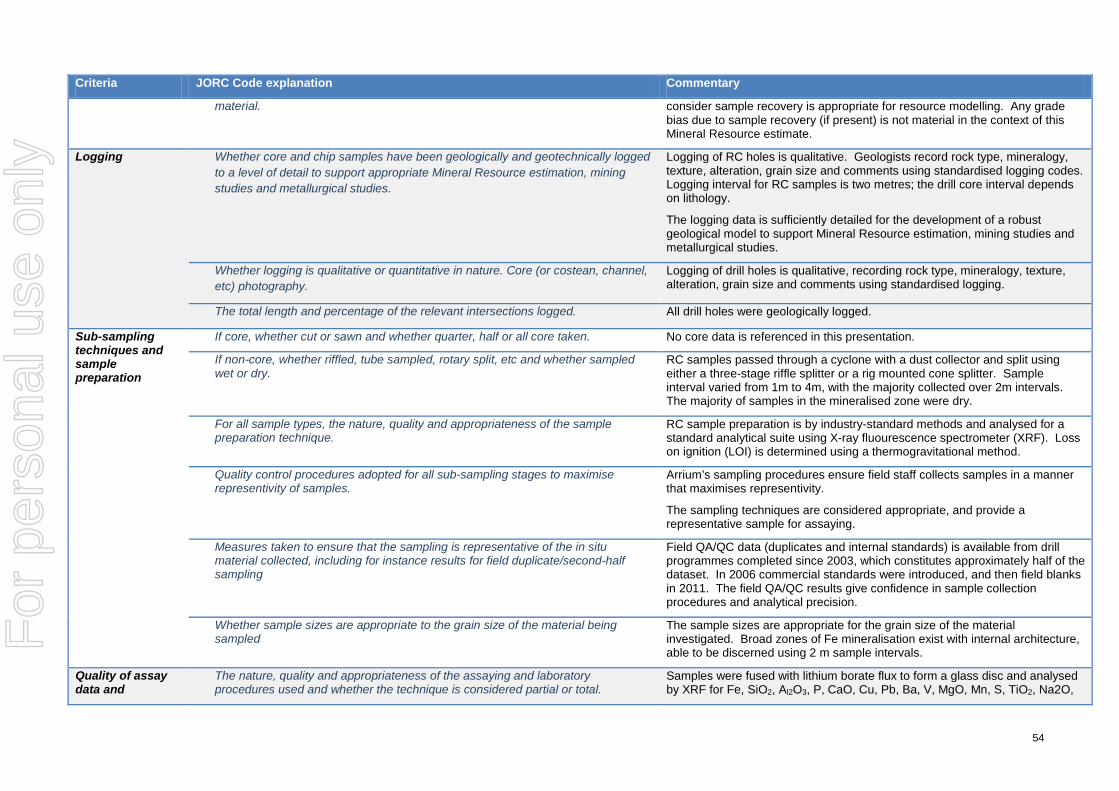
material. consider sample recovery is appropriate for resource modelling. Any grade bias due to sample recovery (if present) is not material in the context of this Mineral Resource estimate.
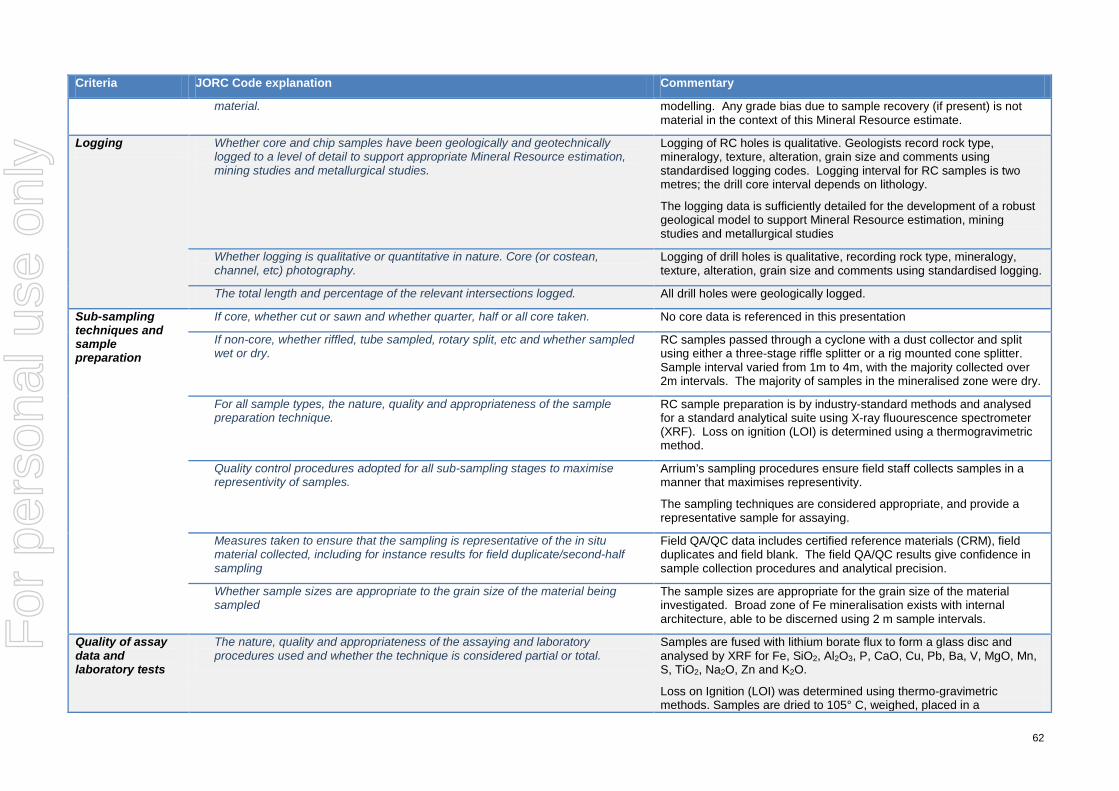
Logging Whether core and chip samples have been geologically and geotechnically logged to a level of detail to support appropriate Mineral Resource estimation, mining studies and metallurgical studies.
Logging of RC holes is qualitative. Geologists record rock type, mineralogy, texture, alteration, grain size and comments using standardised logging codes. Logging interval for RC samples is two metres; the drill core interval depends on lithology.
The logging data is sufficiently detailed for the development of a robust geological model to support Mineral Resource estimation, mining studies and metallurgical studies.
Whether logging is qualitative or quantitative in nature. Core (or costean, channel, etc) photography.
Logging of drill holes is qualitative, recording rock type, mineralogy, texture, alteration, grain size and comments using standardised logging.
The total length and percentage of the relevant intersections logged. All drill holes were geologically logged.
Sub-sampling techniques and sample preparation
If core, whether cut or sawn and whether quarter, half or all core taken. No core data is referenced in this presentation.
If non-core, whether riffled, tube sampled, rotary split, etc and whether sampled wet or dry.
RC samples passed through a cyclone with a dust collector and split using either a three-stage riffle splitter or a rig mounted cone splitter. Sample interval varied from 1m to 4m, with the majority collected over 2m intervals. The majority of samples in the mineralised zone were dry.
For all sample types, the nature, quality and appropriateness of the sample preparation technique.
RC sample preparation is by industry-standard methods and analysed for a standard analytical suite using X-ray fluourescence spectrometer (XRF). Loss on ignition (LOI) is determined using a thermogravitational method.
Quality control procedures adopted for all sub-sampling stages to maximise representivity of samples.
Arrium’s sampling procedures ensure field staff collects samples in a manner that maximises representivity.
The sampling techniques are considered appropriate, and provide a representative sample for assaying.
Measures taken to ensure that the sampling is representative of the in situ material collected, including for instance results for field duplicate/second-half sampling
Field QA/QC data (duplicates and internal standards) is available from drill programmes completed since 2003, which constitutes approximately half of the dataset. In 2006 commercial standards were introduced, and then field blanks in 2011. The field QA/QC results give confidence in sample collection procedures and analytical precision.
Whether sample sizes are appropriate to the grain size of the material being sampled
The sample sizes are appropriate for the grain size of the material investigated. Broad zones of Fe mineralisation exist with internal architecture, able to be discerned using 2 m sample intervals.
Quality of assay data and
The nature, quality and appropriateness of the assaying and laboratory procedures used and whether the technique is considered partial or total.
Samples were fused with lithium borate flux to form a glass disc and analysed by XRF for Fe, SiO2, Al2O3, P, CaO, Cu, Pb, Ba, V, MgO, Mn, S, TiO2, Na2O,
For
per
sona
l use
onl
y
55
Criteria JORC Code explanation Commentary
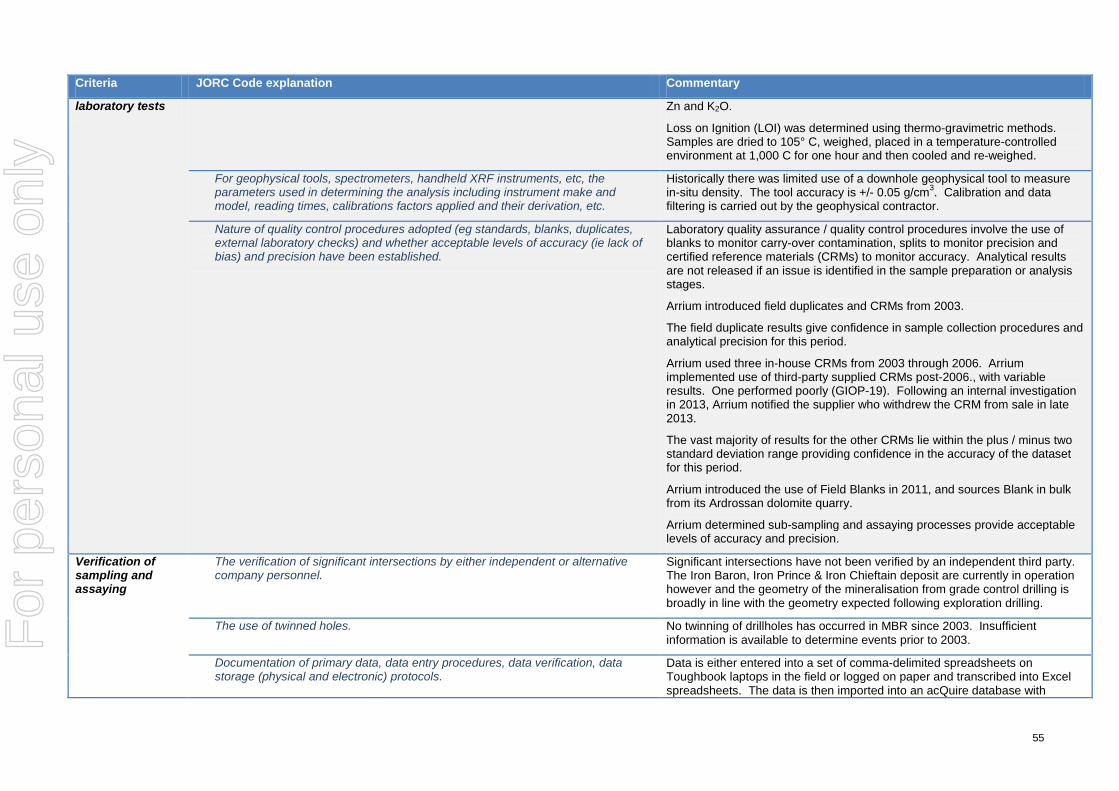
laboratory tests Zn and K2O.
Loss on Ignition (LOI) was determined using thermo-gravimetric methods. Samples are dried to 105° C, weighed, placed in a temperature-controlled environment at 1,000 C for one hour and then cooled and re-weighed.
For geophysical tools, spectrometers, handheld XRF instruments, etc, the parameters used in determining the analysis including instrument make and model, reading times, calibrations factors applied and their derivation, etc.
Historically there was limited use of a downhole geophysical tool to measure in-situ density. The tool accuracy is +/- 0.05 g/cm3. Calibration and data filtering is carried out by the geophysical contractor.
Nature of quality control procedures adopted (eg standards, blanks, duplicates, external laboratory checks) and whether acceptable levels of accuracy (ie lack of bias) and precision have been established.
Laboratory quality assurance / quality control procedures involve the use of blanks to monitor carry-over contamination, splits to monitor precision and certified reference materials (CRMs) to monitor accuracy. Analytical results are not released if an issue is identified in the sample preparation or analysis stages.
Arrium introduced field duplicates and CRMs from 2003.
The field duplicate results give confidence in sample collection procedures and analytical precision for this period.
Arrium used three in-house CRMs from 2003 through 2006. Arrium implemented use of third-party supplied CRMs post-2006., with variable results. One performed poorly (GIOP-19). Following an internal investigation in 2013, Arrium notified the supplier who withdrew the CRM from sale in late 2013.
The vast majority of results for the other CRMs lie within the plus / minus two standard deviation range providing confidence in the accuracy of the dataset for this period.
Arrium introduced the use of Field Blanks in 2011, and sources Blank in bulk from its Ardrossan dolomite quarry.
Arrium determined sub-sampling and assaying processes provide acceptable levels of accuracy and precision.
Verification of sampling and assaying
The verification of significant intersections by either independent or alternative company personnel.
Significant intersections have not been verified by an independent third party. The Iron Baron, Iron Prince & Iron Chieftain deposit are currently in operation however and the geometry of the mineralisation from grade control drilling is broadly in line with the geometry expected following exploration drilling.
The use of twinned holes. No twinning of drillholes has occurred in MBR since 2003. Insufficient information is available to determine events prior to 2003.
Documentation of primary data, data entry procedures, data verification, data storage (physical and electronic) protocols.
Data is either entered into a set of comma-delimited spreadsheets on Toughbook laptops in the field or logged on paper and transcribed into Excel spreadsheets. The data is then imported into an acQuire database with
For
per
sona
l use
onl
y
56
Criteria JORC Code explanation Commentary
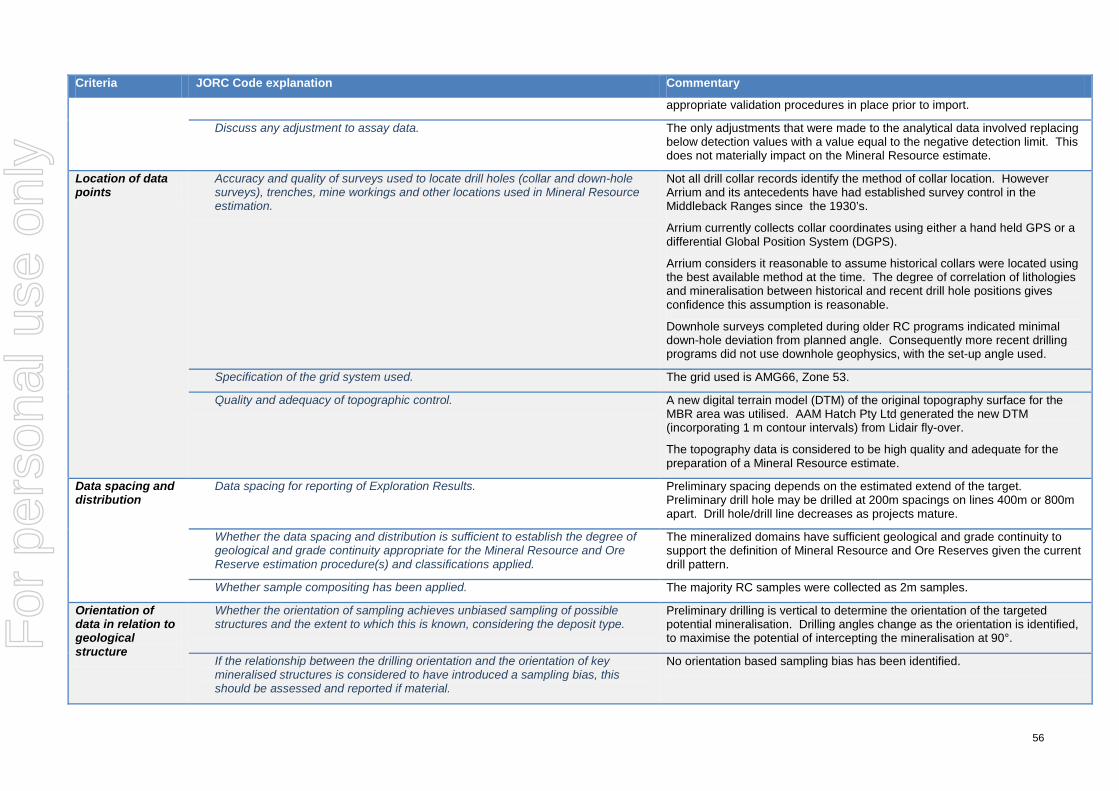
appropriate validation procedures in place prior to import.
Discuss any adjustment to assay data. The only adjustments that were made to the analytical data involved replacing below detection values with a value equal to the negative detection limit. This does not materially impact on the Mineral Resource estimate.
Location of data points
Accuracy and quality of surveys used to locate drill holes (collar and down-hole surveys), trenches, mine workings and other locations used in Mineral Resource estimation.
Not all drill collar records identify the method of collar location. However Arrium and its antecedents have had established survey control in the Middleback Ranges since the 1930’s.
Arrium currently collects collar coordinates using either a hand held GPS or a differential Global Position System (DGPS).
Arrium considers it reasonable to assume historical collars were located using the best available method at the time. The degree of correlation of lithologies and mineralisation between historical and recent drill hole positions gives confidence this assumption is reasonable.
Downhole surveys completed during older RC programs indicated minimal down-hole deviation from planned angle. Consequently more recent drilling programs did not use downhole geophysics, with the set-up angle used.
Specification of the grid system used. The grid used is AMG66, Zone 53.
Quality and adequacy of topographic control. A new digital terrain model (DTM) of the original topography surface for the MBR area was utilised. AAM Hatch Pty Ltd generated the new DTM (incorporating 1 m contour intervals) from Lidair fly-over.
The topography data is considered to be high quality and adequate for the preparation of a Mineral Resource estimate.
Data spacing and distribution
Data spacing for reporting of Exploration Results. Preliminary spacing depends on the estimated extend of the target. Preliminary drill hole may be drilled at 200m spacings on lines 400m or 800m apart. Drill hole/drill line decreases as projects mature.
Whether the data spacing and distribution is sufficient to establish the degree of geological and grade continuity appropriate for the Mineral Resource and Ore Reserve estimation procedure(s) and classifications applied.
The mineralized domains have sufficient geological and grade continuity to support the definition of Mineral Resource and Ore Reserves given the current drill pattern.
Whether sample compositing has been applied. The majority RC samples were collected as 2m samples.
Orientation of data in relation to geological structure
Whether the orientation of sampling achieves unbiased sampling of possible structures and the extent to which this is known, considering the deposit type.
Preliminary drilling is vertical to determine the orientation of the targeted potential mineralisation. Drilling angles change as the orientation is identified, to maximise the potential of intercepting the mineralisation at 90°.
If the relationship between the drilling orientation and the orientation of key mineralised structures is considered to have introduced a sampling bias, this should be assessed and reported if material.
No orientation based sampling bias has been identified.
For
per
sona
l use
onl
y
57
Criteria JORC Code explanation Commentary
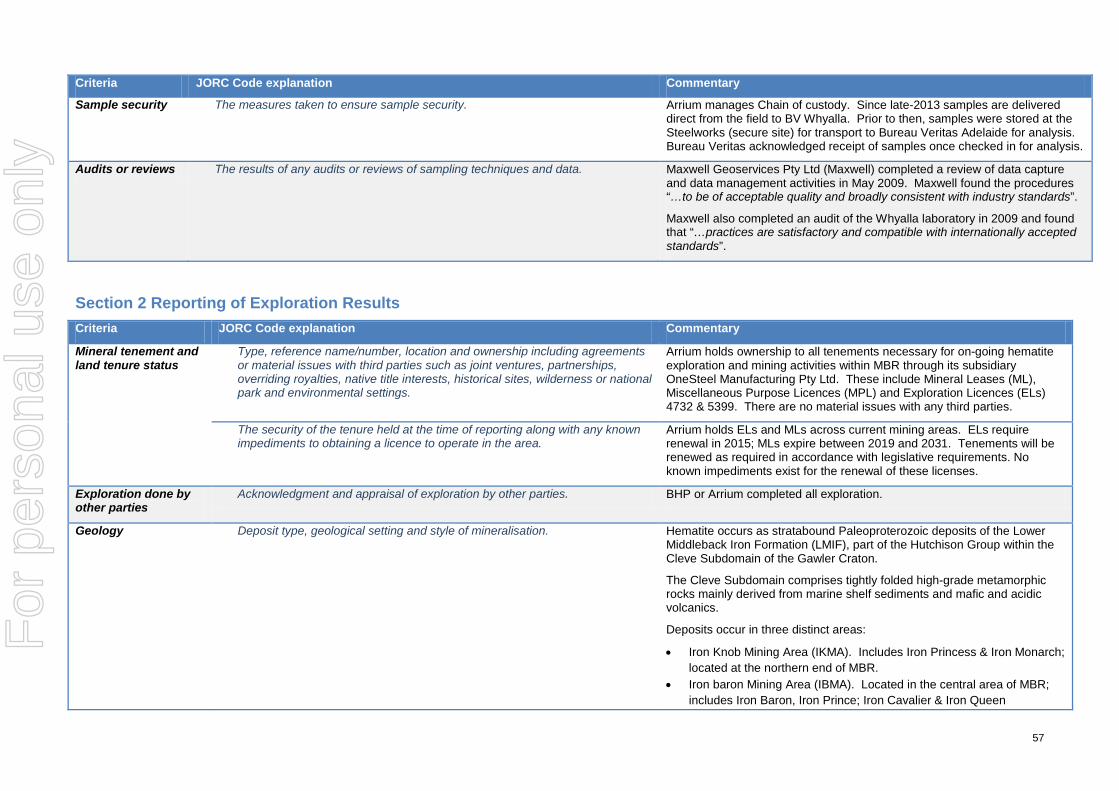
Sample security The measures taken to ensure sample security. Arrium manages Chain of custody. Since late-2013 samples are delivered direct from the field to BV Whyalla. Prior to then, samples were stored at the Steelworks (secure site) for transport to Bureau Veritas Adelaide for analysis. Bureau Veritas acknowledged receipt of samples once checked in for analysis.
Audits or reviews The results of any audits or reviews of sampling techniques and data. Maxwell Geoservices Pty Ltd (Maxwell) completed a review of data capture and data management activities in May 2009. Maxwell found the procedures “…to be of acceptable quality and broadly consistent with industry standards”.
Maxwell also completed an audit of the Whyalla laboratory in 2009 and found that “…practices are satisfactory and compatible with internationally accepted standards”.
Section 2 Reporting of Exploration Results Criteria JORC Code explanation Commentary
Mineral tenement and land tenure status
Type, reference name/number, location and ownership including agreements or material issues with third parties such as joint ventures, partnerships, overriding royalties, native title interests, historical sites, wilderness or national park and environmental settings.
Arrium holds ownership to all tenements necessary for on-going hematite exploration and mining activities within MBR through its subsidiary OneSteel Manufacturing Pty Ltd. These include Mineral Leases (ML), Miscellaneous Purpose Licences (MPL) and Exploration Licences (ELs) 4732 & 5399. There are no material issues with any third parties.
The security of the tenure held at the time of reporting along with any known impediments to obtaining a licence to operate in the area.
Arrium holds ELs and MLs across current mining areas. ELs require renewal in 2015; MLs expire between 2019 and 2031. Tenements will be renewed as required in accordance with legislative requirements. No known impediments exist for the renewal of these licenses.
Exploration done by other parties
Acknowledgment and appraisal of exploration by other parties. BHP or Arrium completed all exploration.
Geology Deposit type, geological setting and style of mineralisation. Hematite occurs as stratabound Paleoproterozoic deposits of the Lower Middleback Iron Formation (LMIF), part of the Hutchison Group within the Cleve Subdomain of the Gawler Craton.
The Cleve Subdomain comprises tightly folded high-grade metamorphic rocks mainly derived from marine shelf sediments and mafic and acidic volcanics.
Deposits occur in three distinct areas:
• Iron Knob Mining Area (IKMA). Includes Iron Princess & Iron Monarch; located at the northern end of MBR.
• Iron baron Mining Area (IBMA). Located in the central area of MBR; includes Iron Baron, Iron Prince; Iron Cavalier & Iron Queen
For
per
sona
l use
onl
y
58
Criteria JORC Code explanation Commentary
• Southern Middleback Ranges (SMR). Lies at the southern end of the MBR, and includes Iron Chieftain, Iron Knight and Iron Duchess.
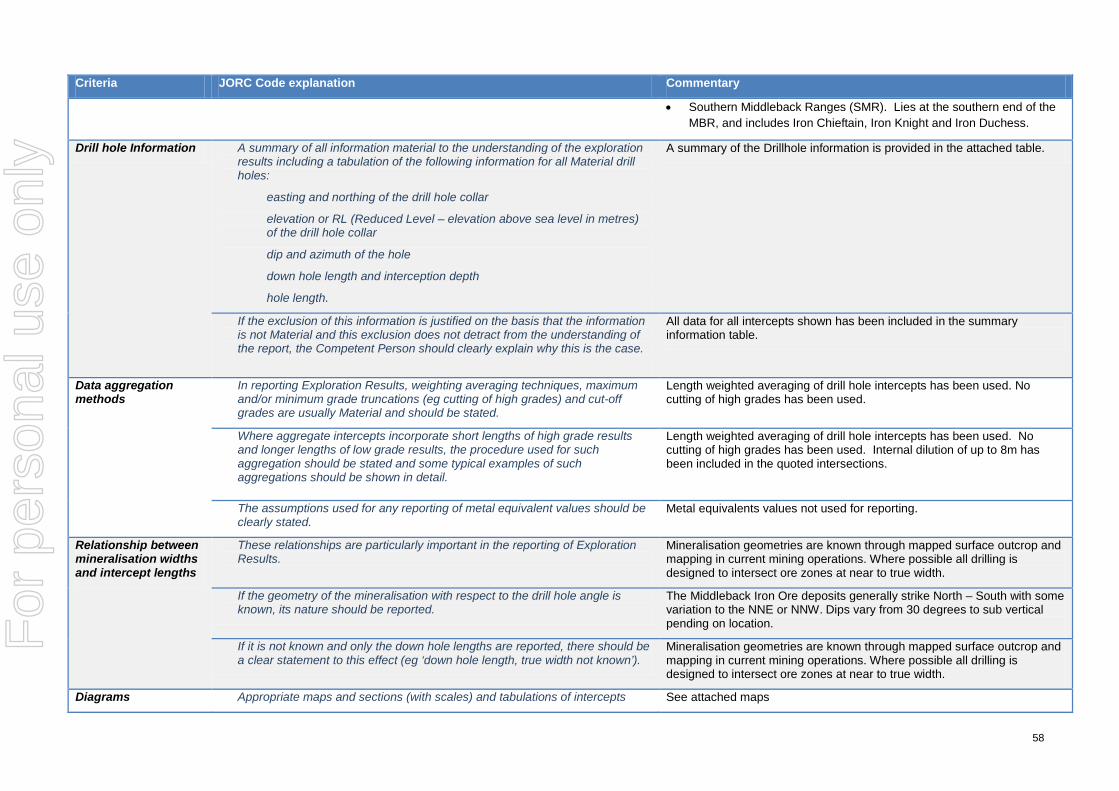
Drill hole Information A summary of all information material to the understanding of the exploration results including a tabulation of the following information for all Material drill holes:
easting and northing of the drill hole collar
elevation or RL (Reduced Level – elevation above sea level in metres) of the drill hole collar
dip and azimuth of the hole
down hole length and interception depth
hole length.
A summary of the Drillhole information is provided in the attached table.
If the exclusion of this information is justified on the basis that the information is not Material and this exclusion does not detract from the understanding of the report, the Competent Person should clearly explain why this is the case.
All data for all intercepts shown has been included in the summary information table.
Data aggregation methods
In reporting Exploration Results, weighting averaging techniques, maximum and/or minimum grade truncations (eg cutting of high grades) and cut-off grades are usually Material and should be stated.
Length weighted averaging of drill hole intercepts has been used. No cutting of high grades has been used.
Where aggregate intercepts incorporate short lengths of high grade results and longer lengths of low grade results, the procedure used for such aggregation should be stated and some typical examples of such aggregations should be shown in detail.
Length weighted averaging of drill hole intercepts has been used. No cutting of high grades has been used. Internal dilution of up to 8m has been included in the quoted intersections.
The assumptions used for any reporting of metal equivalent values should be clearly stated.
Metal equivalents values not used for reporting.
Relationship between mineralisation widths and intercept lengths
These relationships are particularly important in the reporting of Exploration Results.
Mineralisation geometries are known through mapped surface outcrop and mapping in current mining operations. Where possible all drilling is designed to intersect ore zones at near to true width.
If the geometry of the mineralisation with respect to the drill hole angle is known, its nature should be reported.
The Middleback Iron Ore deposits generally strike North – South with some variation to the NNE or NNW. Dips vary from 30 degrees to sub vertical pending on location.
If it is not known and only the down hole lengths are reported, there should be a clear statement to this effect (eg ‘down hole length, true width not known’).
Mineralisation geometries are known through mapped surface outcrop and mapping in current mining operations. Where possible all drilling is designed to intersect ore zones at near to true width.
Diagrams Appropriate maps and sections (with scales) and tabulations of intercepts See attached maps
For
per
sona
l use
onl
y
59
Criteria JORC Code explanation Commentary
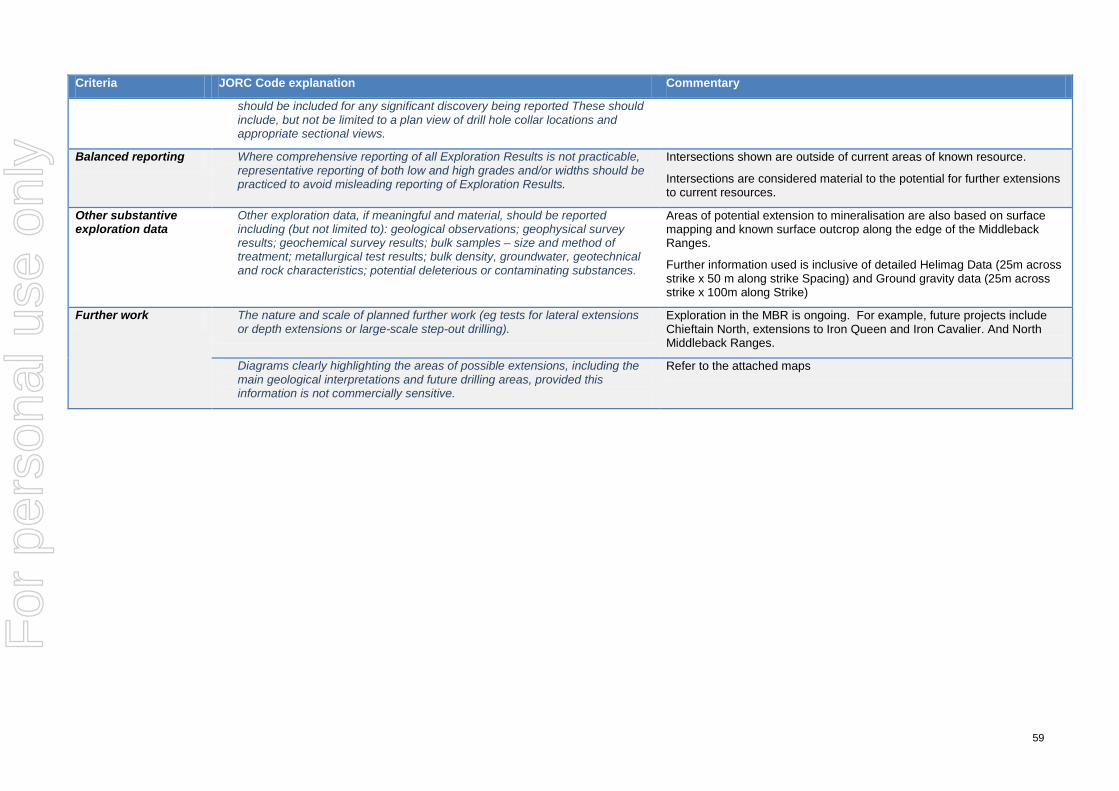
should be included for any significant discovery being reported These should include, but not be limited to a plan view of drill hole collar locations and appropriate sectional views.
Balanced reporting Where comprehensive reporting of all Exploration Results is not practicable, representative reporting of both low and high grades and/or widths should be practiced to avoid misleading reporting of Exploration Results.
Intersections shown are outside of current areas of known resource.
Intersections are considered material to the potential for further extensions to current resources.
Other substantive exploration data
Other exploration data, if meaningful and material, should be reported including (but not limited to): geological observations; geophysical survey results; geochemical survey results; bulk samples – size and method of treatment; metallurgical test results; bulk density, groundwater, geotechnical and rock characteristics; potential deleterious or contaminating substances.
Areas of potential extension to mineralisation are also based on surface mapping and known surface outcrop along the edge of the Middleback Ranges.
Further information used is inclusive of detailed Helimag Data (25m across strike x 50 m along strike Spacing) and Ground gravity data (25m across strike x 100m along Strike)
Further work The nature and scale of planned further work (eg tests for lateral extensions or depth extensions or large-scale step-out drilling).
Exploration in the MBR is ongoing. For example, future projects include Chieftain North, extensions to Iron Queen and Iron Cavalier. And North Middleback Ranges.
Diagrams clearly highlighting the areas of possible extensions, including the main geological interpretations and future drilling areas, provided this information is not commercially sensitive.
Refer to the attached maps
For
per
sona
l use
onl
y
60
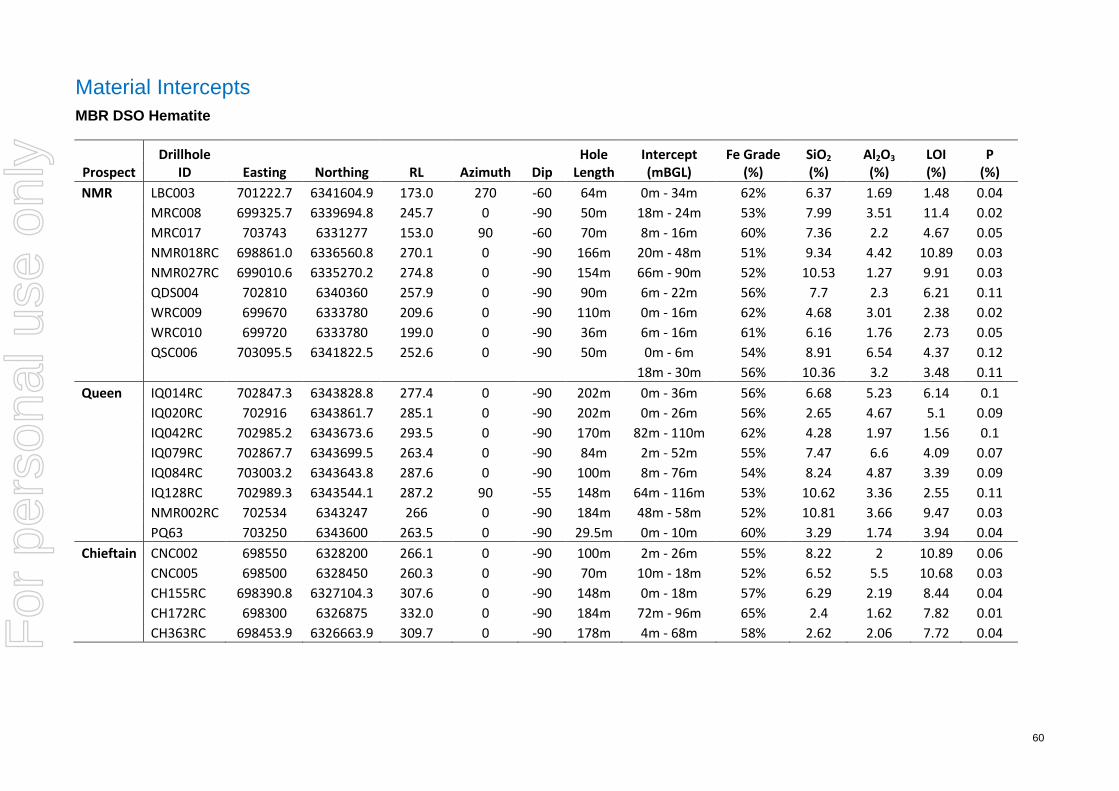
Material Intercepts MBR DSO Hematite
Prospect Drillhole
ID Easting Northing RL Azimuth Dip Hole
Length Intercept (mBGL)
Fe Grade (%)
SiO2 (%)
Al2O3 (%)
LOI (%)
P (%)
NMR LBC003 701222.7 6341604.9 173.0 270 -60 64m 0m - 34m 62% 6.37 1.69 1.48 0.04 MRC008 699325.7 6339694.8 245.7 0 -90 50m 18m - 24m 53% 7.99 3.51 11.4 0.02 MRC017 703743 6331277 153.0 90 -60 70m 8m - 16m 60% 7.36 2.2 4.67 0.05 NMR018RC 698861.0 6336560.8 270.1 0 -90 166m 20m - 48m 51% 9.34 4.42 10.89 0.03 NMR027RC 699010.6 6335270.2 274.8 0 -90 154m 66m - 90m 52% 10.53 1.27 9.91 0.03 QDS004 702810 6340360 257.9 0 -90 90m 6m - 22m 56% 7.7 2.3 6.21 0.11 WRC009 699670 6333780 209.6 0 -90 110m 0m - 16m 62% 4.68 3.01 2.38 0.02 WRC010 699720 6333780 199.0 0 -90 36m 6m - 16m 61% 6.16 1.76 2.73 0.05 QSC006 703095.5 6341822.5 252.6 0 -90 50m 0m - 6m 54% 8.91 6.54 4.37 0.12 18m - 30m 56% 10.36 3.2 3.48 0.11 Queen IQ014RC 702847.3 6343828.8 277.4 0 -90 202m 0m - 36m 56% 6.68 5.23 6.14 0.1 IQ020RC 702916 6343861.7 285.1 0 -90 202m 0m - 26m 56% 2.65 4.67 5.1 0.09 IQ042RC 702985.2 6343673.6 293.5 0 -90 170m 82m - 110m 62% 4.28 1.97 1.56 0.1 IQ079RC 702867.7 6343699.5 263.4 0 -90 84m 2m - 52m 55% 7.47 6.6 4.09 0.07 IQ084RC 703003.2 6343643.8 287.6 0 -90 100m 8m - 76m 54% 8.24 4.87 3.39 0.09 IQ128RC 702989.3 6343544.1 287.2 90 -55 148m 64m - 116m 53% 10.62 3.36 2.55 0.11 NMR002RC 702534 6343247 266 0 -90 184m 48m - 58m 52% 10.81 3.66 9.47 0.03 PQ63 703250 6343600 263.5 0 -90 29.5m 0m - 10m 60% 3.29 1.74 3.94 0.04 Chieftain CNC002 698550 6328200 266.1 0 -90 100m 2m - 26m 55% 8.22 2 10.89 0.06 CNC005 698500 6328450 260.3 0 -90 70m 10m - 18m 52% 6.52 5.5 10.68 0.03 CH155RC 698390.8 6327104.3 307.6 0 -90 148m 0m - 18m 57% 6.29 2.19 8.44 0.04 CH172RC 698300 6326875 332.0 0 -90 184m 72m - 96m 65% 2.4 1.62 7.82 0.01 CH363RC 698453.9 6326663.9 309.7 0 -90 178m 4m - 68m 58% 2.62 2.06 7.72 0.04
For
per
sona
l use
onl
y
61
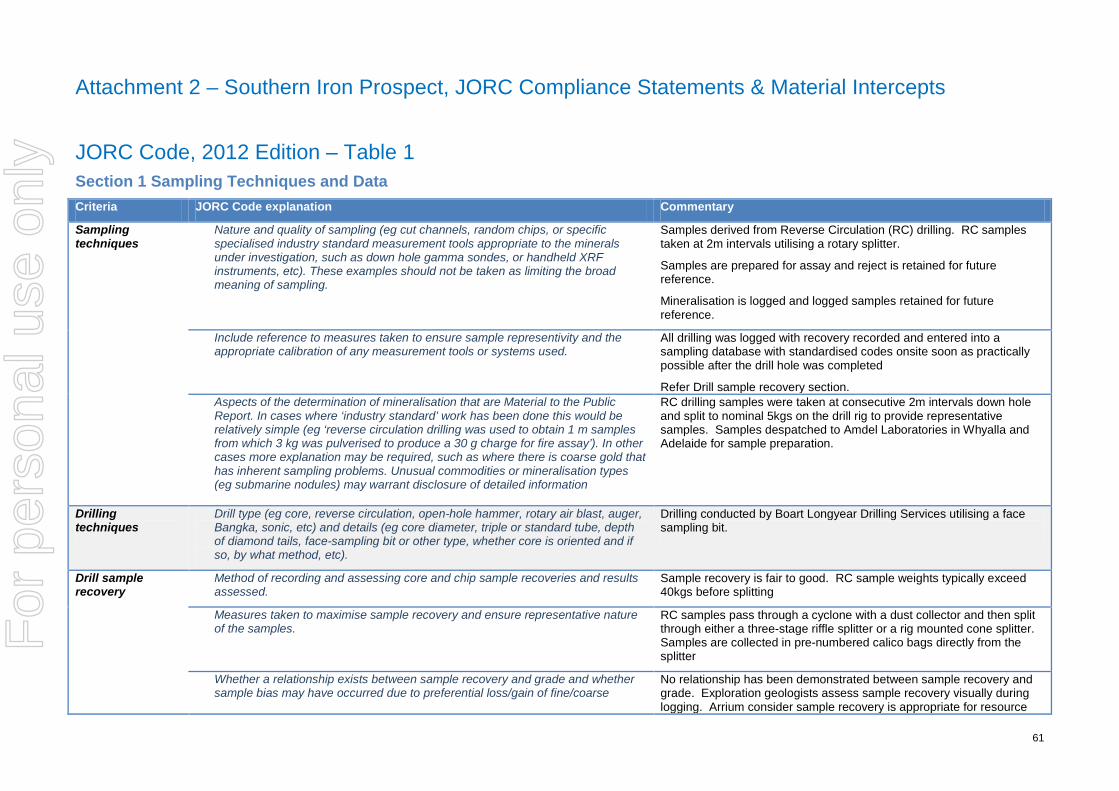
Attachment 2 – Southern Iron Prospect, JORC Compliance Statements & Material Intercepts JORC Code, 2012 Edition – Table 1 Section 1 Sampling Techniques and Data Criteria JORC Code explanation Commentary
Sampling techniques
Nature and quality of sampling (eg cut channels, random chips, or specific specialised industry standard measurement tools appropriate to the minerals under investigation, such as down hole gamma sondes, or handheld XRF instruments, etc). These examples should not be taken as limiting the broad meaning of sampling.
Samples derived from Reverse Circulation (RC) drilling. RC samples taken at 2m intervals utilising a rotary splitter.
Samples are prepared for assay and reject is retained for future reference.
Mineralisation is logged and logged samples retained for future reference.
Include reference to measures taken to ensure sample representivity and the appropriate calibration of any measurement tools or systems used.
All drilling was logged with recovery recorded and entered into a sampling database with standardised codes onsite soon as practically possible after the drill hole was completed
Refer Drill sample recovery section. Aspects of the determination of mineralisation that are Material to the Public Report. In cases where ‘industry standard’ work has been done this would be relatively simple (eg ‘reverse circulation drilling was used to obtain 1 m samples from which 3 kg was pulverised to produce a 30 g charge for fire assay’). In other cases more explanation may be required, such as where there is coarse gold that has inherent sampling problems. Unusual commodities or mineralisation types (eg submarine nodules) may warrant disclosure of detailed information
RC drilling samples were taken at consecutive 2m intervals down hole and split to nominal 5kgs on the drill rig to provide representative samples. Samples despatched to Amdel Laboratories in Whyalla and Adelaide for sample preparation.
Drilling techniques
Drill type (eg core, reverse circulation, open-hole hammer, rotary air blast, auger, Bangka, sonic, etc) and details (eg core diameter, triple or standard tube, depth of diamond tails, face-sampling bit or other type, whether core is oriented and if so, by what method, etc).
Drilling conducted by Boart Longyear Drilling Services utilising a face sampling bit.
Drill sample recovery
Method of recording and assessing core and chip sample recoveries and results assessed.
Sample recovery is fair to good. RC sample weights typically exceed 40kgs before splitting
Measures taken to maximise sample recovery and ensure representative nature of the samples.
RC samples pass through a cyclone with a dust collector and then split through either a three-stage riffle splitter or a rig mounted cone splitter. Samples are collected in pre-numbered calico bags directly from the splitter
Whether a relationship exists between sample recovery and grade and whether sample bias may have occurred due to preferential loss/gain of fine/coarse
No relationship has been demonstrated between sample recovery and grade. Exploration geologists assess sample recovery visually during logging. Arrium consider sample recovery is appropriate for resource
For
per
sona
l use
onl
y
62
Criteria JORC Code explanation Commentary
material. modelling. Any grade bias due to sample recovery (if present) is not material in the context of this Mineral Resource estimate.
Logging Whether core and chip samples have been geologically and geotechnically logged to a level of detail to support appropriate Mineral Resource estimation, mining studies and metallurgical studies.
Logging of RC holes is qualitative. Geologists record rock type, mineralogy, texture, alteration, grain size and comments using standardised logging codes. Logging interval for RC samples is two metres; the drill core interval depends on lithology.
The logging data is sufficiently detailed for the development of a robust geological model to support Mineral Resource estimation, mining studies and metallurgical studies
Whether logging is qualitative or quantitative in nature. Core (or costean, channel, etc) photography.
Logging of drill holes is qualitative, recording rock type, mineralogy, texture, alteration, grain size and comments using standardised logging.
The total length and percentage of the relevant intersections logged. All drill holes were geologically logged.
Sub-sampling techniques and sample preparation
If core, whether cut or sawn and whether quarter, half or all core taken. No core data is referenced in this presentation
If non-core, whether riffled, tube sampled, rotary split, etc and whether sampled wet or dry.
RC samples passed through a cyclone with a dust collector and split using either a three-stage riffle splitter or a rig mounted cone splitter. Sample interval varied from 1m to 4m, with the majority collected over 2m intervals. The majority of samples in the mineralised zone were dry.
For all sample types, the nature, quality and appropriateness of the sample preparation technique.
RC sample preparation is by industry-standard methods and analysed for a standard analytical suite using X-ray fluourescence spectrometer (XRF). Loss on ignition (LOI) is determined using a thermogravimetric method.
Quality control procedures adopted for all sub-sampling stages to maximise representivity of samples.
Arrium’s sampling procedures ensure field staff collects samples in a manner that maximises representivity.
The sampling techniques are considered appropriate, and provide a representative sample for assaying.
Measures taken to ensure that the sampling is representative of the in situ material collected, including for instance results for field duplicate/second-half sampling
Field QA/QC data includes certified reference materials (CRM), field duplicates and field blank. The field QA/QC results give confidence in sample collection procedures and analytical precision.
Whether sample sizes are appropriate to the grain size of the material being sampled
The sample sizes are appropriate for the grain size of the material investigated. Broad zone of Fe mineralisation exists with internal architecture, able to be discerned using 2 m sample intervals.
Quality of assay data and laboratory tests
The nature, quality and appropriateness of the assaying and laboratory procedures used and whether the technique is considered partial or total.
Samples are fused with lithium borate flux to form a glass disc and analysed by XRF for Fe, SiO2, Al2O3, P, CaO, Cu, Pb, Ba, V, MgO, Mn, S, TiO2, Na2O, Zn and K2O.
Loss on Ignition (LOI) was determined using thermo-gravimetric methods. Samples are dried to 105° C, weighed, placed in a
For
per
sona
l use
onl
y
63
Criteria JORC Code explanation Commentary
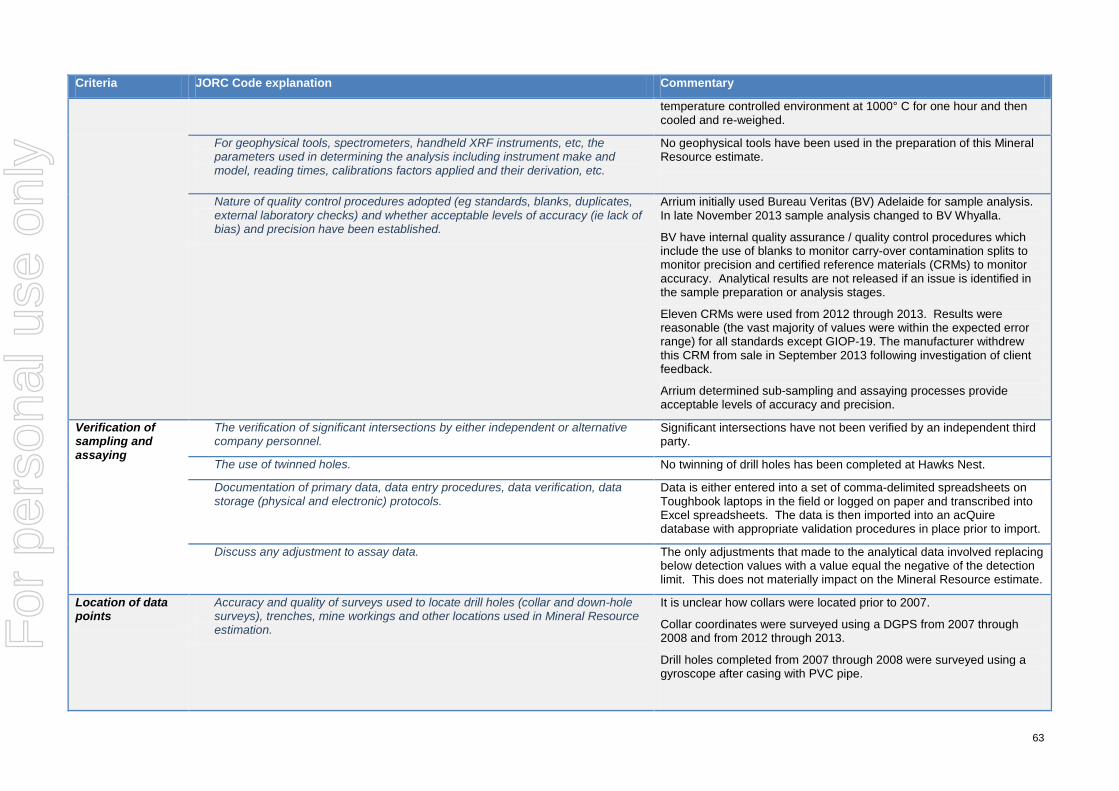
temperature controlled environment at 1000° C for one hour and then cooled and re-weighed.
For geophysical tools, spectrometers, handheld XRF instruments, etc, the parameters used in determining the analysis including instrument make and model, reading times, calibrations factors applied and their derivation, etc.
No geophysical tools have been used in the preparation of this Mineral Resource estimate.
Nature of quality control procedures adopted (eg standards, blanks, duplicates, external laboratory checks) and whether acceptable levels of accuracy (ie lack of bias) and precision have been established.
Arrium initially used Bureau Veritas (BV) Adelaide for sample analysis. In late November 2013 sample analysis changed to BV Whyalla.
BV have internal quality assurance / quality control procedures which include the use of blanks to monitor carry-over contamination splits to monitor precision and certified reference materials (CRMs) to monitor accuracy. Analytical results are not released if an issue is identified in the sample preparation or analysis stages.
Eleven CRMs were used from 2012 through 2013. Results were reasonable (the vast majority of values were within the expected error range) for all standards except GIOP-19. The manufacturer withdrew this CRM from sale in September 2013 following investigation of client feedback.
Arrium determined sub-sampling and assaying processes provide acceptable levels of accuracy and precision.
Verification of sampling and assaying
The verification of significant intersections by either independent or alternative company personnel.
Significant intersections have not been verified by an independent third party.
The use of twinned holes. No twinning of drill holes has been completed at Hawks Nest.
Documentation of primary data, data entry procedures, data verification, data storage (physical and electronic) protocols.
Data is either entered into a set of comma-delimited spreadsheets on Toughbook laptops in the field or logged on paper and transcribed into Excel spreadsheets. The data is then imported into an acQuire database with appropriate validation procedures in place prior to import.
Discuss any adjustment to assay data. The only adjustments that made to the analytical data involved replacing below detection values with a value equal the negative of the detection limit. This does not materially impact on the Mineral Resource estimate.
Location of data points
Accuracy and quality of surveys used to locate drill holes (collar and down-hole surveys), trenches, mine workings and other locations used in Mineral Resource estimation.
It is unclear how collars were located prior to 2007.
Collar coordinates were surveyed using a DGPS from 2007 through 2008 and from 2012 through 2013.
Drill holes completed from 2007 through 2008 were surveyed using a gyroscope after casing with PVC pipe.
For
per
sona
l use
onl
y
64
Criteria JORC Code explanation Commentary
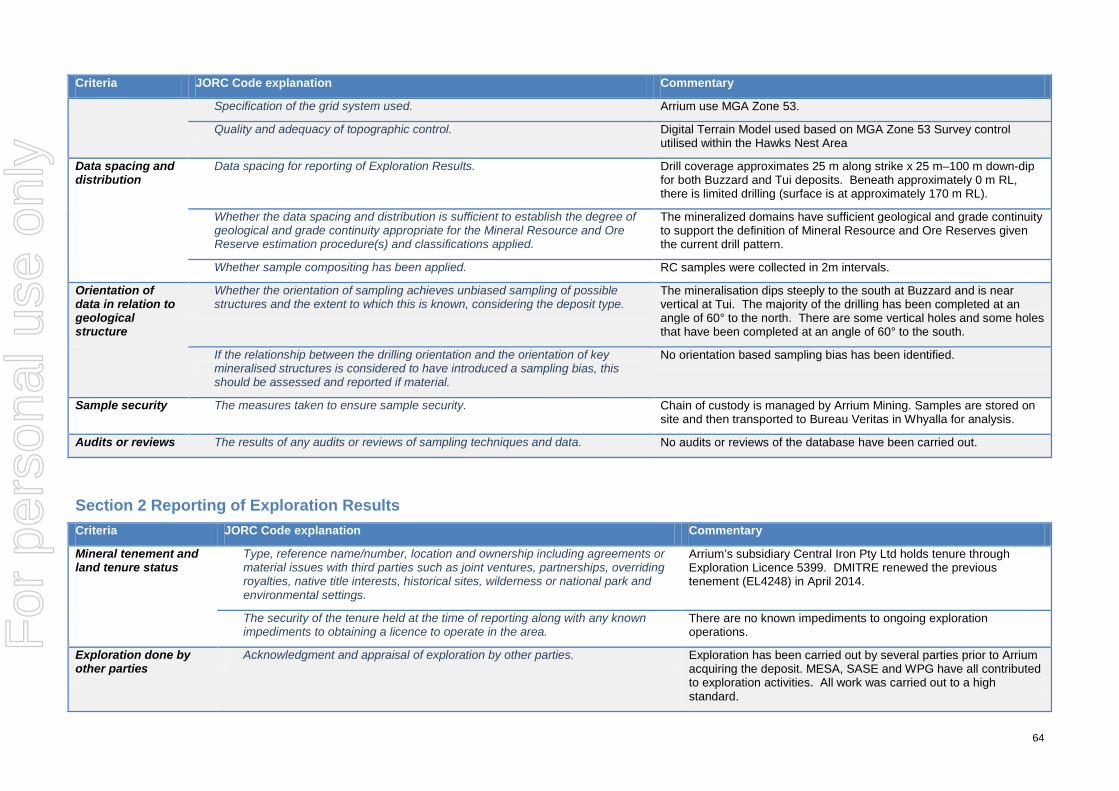
Specification of the grid system used. Arrium use MGA Zone 53.
Quality and adequacy of topographic control. Digital Terrain Model used based on MGA Zone 53 Survey control utilised within the Hawks Nest Area
Data spacing and distribution
Data spacing for reporting of Exploration Results. Drill coverage approximates 25 m along strike x 25 m–100 m down-dip for both Buzzard and Tui deposits. Beneath approximately 0 m RL, there is limited drilling (surface is at approximately 170 m RL).
Whether the data spacing and distribution is sufficient to establish the degree of geological and grade continuity appropriate for the Mineral Resource and Ore Reserve estimation procedure(s) and classifications applied.
The mineralized domains have sufficient geological and grade continuity to support the definition of Mineral Resource and Ore Reserves given the current drill pattern.
Whether sample compositing has been applied. RC samples were collected in 2m intervals.
Orientation of data in relation to geological structure
Whether the orientation of sampling achieves unbiased sampling of possible structures and the extent to which this is known, considering the deposit type.
The mineralisation dips steeply to the south at Buzzard and is near vertical at Tui. The majority of the drilling has been completed at an angle of 60° to the north. There are some vertical holes and some holes that have been completed at an angle of 60° to the south.
If the relationship between the drilling orientation and the orientation of key mineralised structures is considered to have introduced a sampling bias, this should be assessed and reported if material.
No orientation based sampling bias has been identified.
Sample security The measures taken to ensure sample security. Chain of custody is managed by Arrium Mining. Samples are stored on site and then transported to Bureau Veritas in Whyalla for analysis.
Audits or reviews The results of any audits or reviews of sampling techniques and data. No audits or reviews of the database have been carried out.
Section 2 Reporting of Exploration Results Criteria JORC Code explanation Commentary
Mineral tenement and land tenure status
Type, reference name/number, location and ownership including agreements or material issues with third parties such as joint ventures, partnerships, overriding royalties, native title interests, historical sites, wilderness or national park and environmental settings.
Arrium’s subsidiary Central Iron Pty Ltd holds tenure through Exploration Licence 5399. DMITRE renewed the previous tenement (EL4248) in April 2014.
The security of the tenure held at the time of reporting along with any known impediments to obtaining a licence to operate in the area.
There are no known impediments to ongoing exploration operations.
Exploration done by other parties
Acknowledgment and appraisal of exploration by other parties. Exploration has been carried out by several parties prior to Arrium acquiring the deposit. MESA, SASE and WPG have all contributed to exploration activities. All work was carried out to a high standard.
For
per
sona
l use
onl
y
65
Criteria JORC Code explanation Commentary
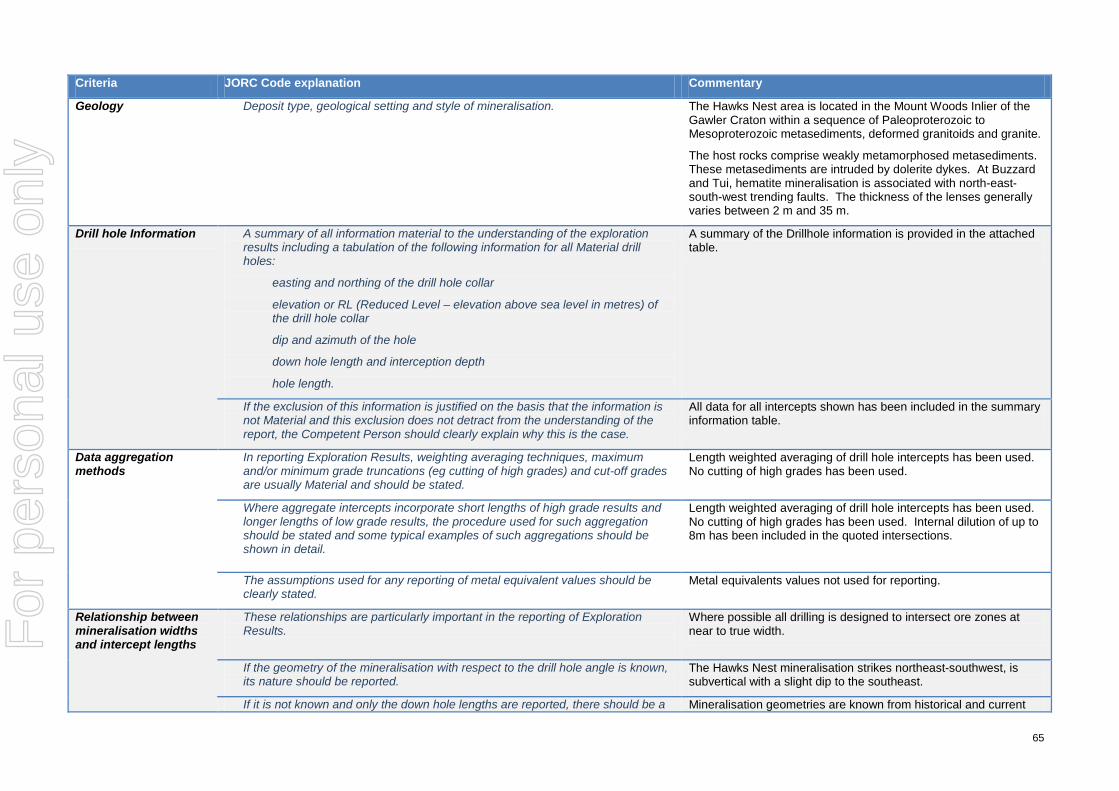
Geology Deposit type, geological setting and style of mineralisation. The Hawks Nest area is located in the Mount Woods Inlier of the Gawler Craton within a sequence of Paleoproterozoic to Mesoproterozoic metasediments, deformed granitoids and granite.
The host rocks comprise weakly metamorphosed metasediments. These metasediments are intruded by dolerite dykes. At Buzzard and Tui, hematite mineralisation is associated with north-east-south-west trending faults. The thickness of the lenses generally varies between 2 m and 35 m.
Drill hole Information A summary of all information material to the understanding of the exploration results including a tabulation of the following information for all Material drill holes:
easting and northing of the drill hole collar
elevation or RL (Reduced Level – elevation above sea level in metres) of the drill hole collar
dip and azimuth of the hole
down hole length and interception depth
hole length.
A summary of the Drillhole information is provided in the attached table.
If the exclusion of this information is justified on the basis that the information is not Material and this exclusion does not detract from the understanding of the report, the Competent Person should clearly explain why this is the case.
All data for all intercepts shown has been included in the summary information table.
Data aggregation methods
In reporting Exploration Results, weighting averaging techniques, maximum and/or minimum grade truncations (eg cutting of high grades) and cut-off grades are usually Material and should be stated.
Length weighted averaging of drill hole intercepts has been used. No cutting of high grades has been used.
Where aggregate intercepts incorporate short lengths of high grade results and longer lengths of low grade results, the procedure used for such aggregation should be stated and some typical examples of such aggregations should be shown in detail.
Length weighted averaging of drill hole intercepts has been used. No cutting of high grades has been used. Internal dilution of up to 8m has been included in the quoted intersections.
The assumptions used for any reporting of metal equivalent values should be clearly stated.
Metal equivalents values not used for reporting.
Relationship between mineralisation widths and intercept lengths
These relationships are particularly important in the reporting of Exploration Results.
Where possible all drilling is designed to intersect ore zones at near to true width.
If the geometry of the mineralisation with respect to the drill hole angle is known, its nature should be reported.
The Hawks Nest mineralisation strikes northeast-southwest, is subvertical with a slight dip to the southeast.
If it is not known and only the down hole lengths are reported, there should be a Mineralisation geometries are known from historical and current
For
per
sona
l use
onl
y
66
Criteria JORC Code explanation Commentary
clear statement to this effect (eg ‘down hole length, true width not known’). drilling. Drilling is designed to minimise the apparent thickness of ore zones.
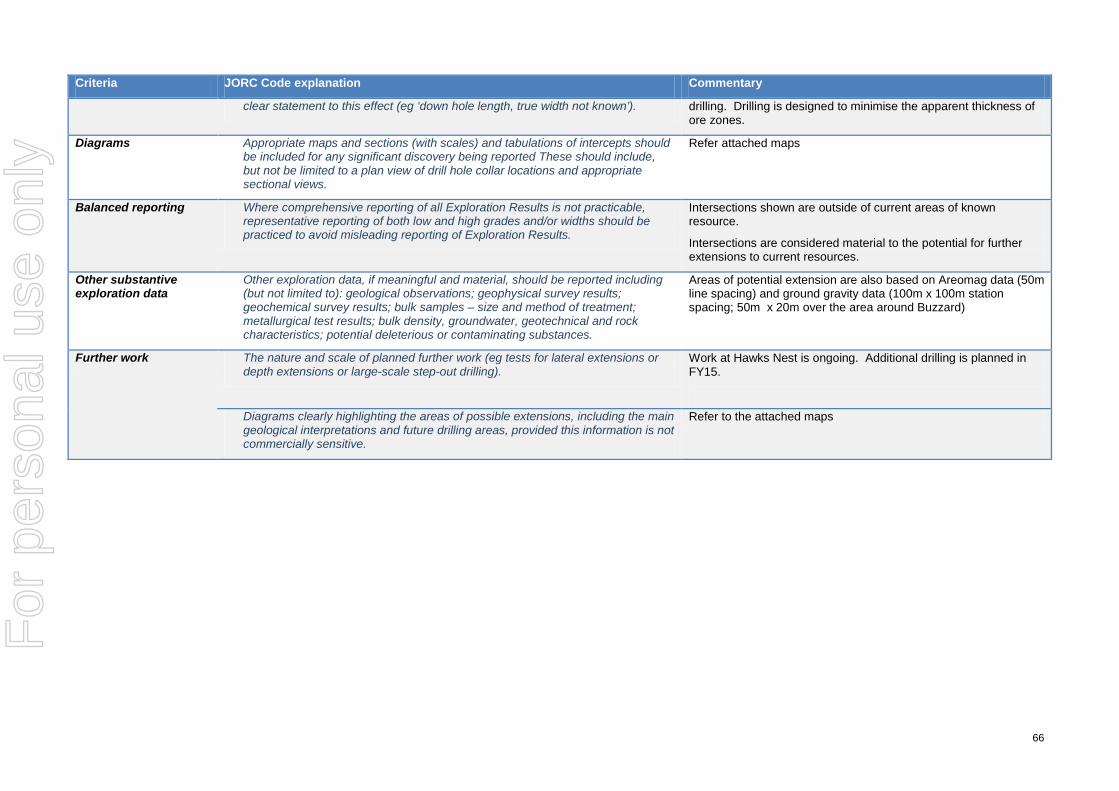
Diagrams Appropriate maps and sections (with scales) and tabulations of intercepts should be included for any significant discovery being reported These should include, but not be limited to a plan view of drill hole collar locations and appropriate sectional views.
Refer attached maps
Balanced reporting Where comprehensive reporting of all Exploration Results is not practicable, representative reporting of both low and high grades and/or widths should be practiced to avoid misleading reporting of Exploration Results.
Intersections shown are outside of current areas of known resource.
Intersections are considered material to the potential for further extensions to current resources.
Other substantive exploration data
Other exploration data, if meaningful and material, should be reported including (but not limited to): geological observations; geophysical survey results; geochemical survey results; bulk samples – size and method of treatment; metallurgical test results; bulk density, groundwater, geotechnical and rock characteristics; potential deleterious or contaminating substances.
Areas of potential extension are also based on Areomag data (50m line spacing) and ground gravity data (100m x 100m station spacing; 50m x 20m over the area around Buzzard)
Further work The nature and scale of planned further work (eg tests for lateral extensions or depth extensions or large-scale step-out drilling).
Work at Hawks Nest is ongoing. Additional drilling is planned in FY15.
Diagrams clearly highlighting the areas of possible extensions, including the main geological interpretations and future drilling areas, provided this information is not commercially sensitive.
Refer to the attached maps
For
per
sona
l use
onl
y
67
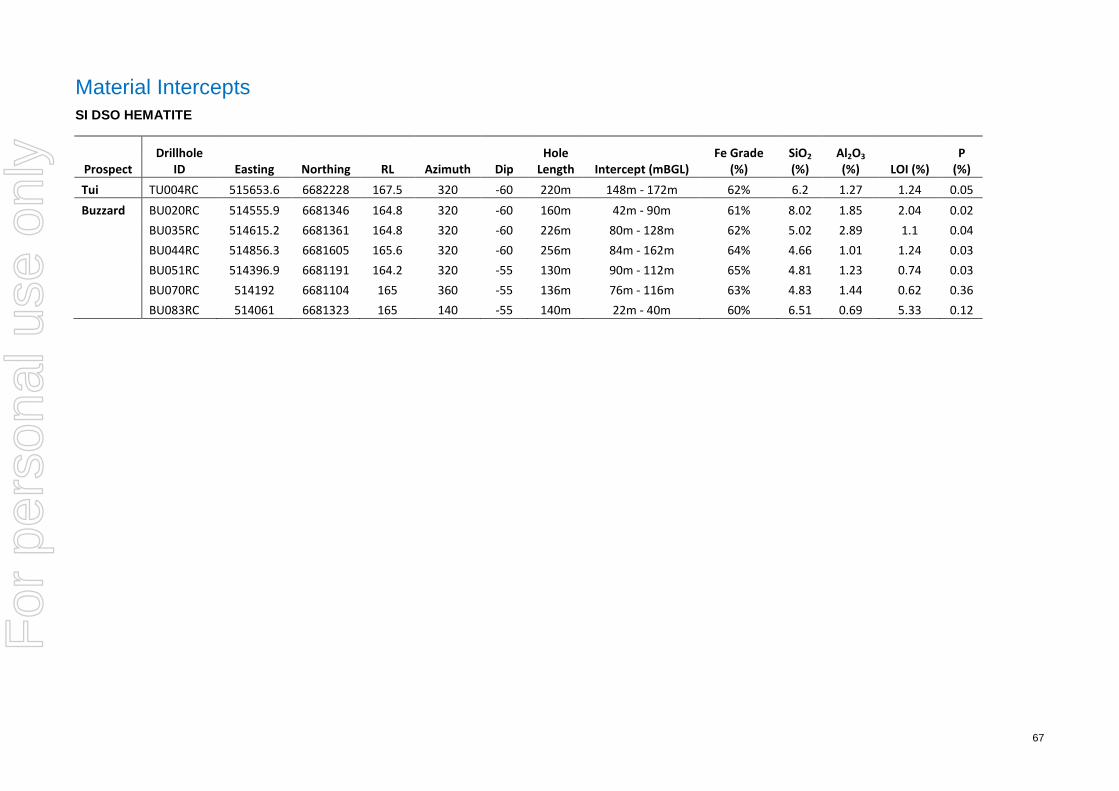
Material Intercepts SI DSO HEMATITE
Prospect Drillhole
ID Easting Northing RL Azimuth Dip Hole
Length Intercept (mBGL) Fe Grade
(%) SiO2 (%)
Al2O3 (%) LOI (%)
P (%)
Tui TU004RC 515653.6 6682228 167.5 320 -60 220m 148m - 172m 62% 6.2 1.27 1.24 0.05 Buzzard BU020RC 514555.9 6681346 164.8 320 -60 160m 42m - 90m 61% 8.02 1.85 2.04 0.02 BU035RC 514615.2 6681361 164.8 320 -60 226m 80m - 128m 62% 5.02 2.89 1.1 0.04 BU044RC 514856.3 6681605 165.6 320 -60 256m 84m - 162m 64% 4.66 1.01 1.24 0.03 BU051RC 514396.9 6681191 164.2 320 -55 130m 90m - 112m 65% 4.81 1.23 0.74 0.03 BU070RC 514192 6681104 165 360 -55 136m 76m - 116m 63% 4.83 1.44 0.62 0.36 BU083RC 514061 6681323 165 140 -55 140m 22m - 40m 60% 6.51 0.69 5.33 0.12
For
per
sona
l use
onl
y