Embed Size (px)
Citation preview
12th National Convention on Statistics
Arrival/Departure (A/D) Cards as a Tool for Tourism Planning
By Rolando Canizal
Abstract
Republic Act No. 9593, otherwise known as Tourism Act of 2009, declares tourism as an indispensable element of the national economy and an industry of national interest and importance, which must be harnessed as an engine of socio-economic growth and cultural affirmation to generate investment, foreign exchange and employment, and to enhance sense of national pride for all Filipinos. The sector needs reliable indicators not only to monitor and assess the tourism performance, but in crafting sound and relevant policies, plans and programs. Both public and private stakeholders rely on substantial data that is in need of constant update. The Department of Tourism, in cooperation with the Bureau of Immigration, has developed a tourism database based on arrival card to provide reliable data to assess the performance and determine the growth of the tourism industry. This set of information is consistent with the United Nations World Tourism Organization (UNWTO) methodology for collecting data on inbound visitors. Over the years, DOT has been improving the database using information technology. This paper will discuss the development and use of the arrival card for formulating the national tourism development plan.
Key words: Tourism Act of 2009, arrival card, inbound visitors, national tourism
development plan
Introduction
Tourism has been recognized as an engine for national growth through foreign
exchange, job generation and investments to boost the country’s GDP. It is also
seen as an important vehicle in enhancing one’s national pride in its place and
culture.
As the country is gearing up to the challenge of becoming a premier destination in
Asia and for tourism to contribute significantly to its economic growth, it is imperative
to provide the most significant indicators to be able to measure the impact and
growth of the sector. These indicators should be used to monitor and assess the
development of tourism, as well as, basis for developing policies, programs,
marketing and promotions activities, setting up standards and encouraging
investments. More importantly, both public and private entities should be able to
access and use these indicators.
To achieve the above, Republic Act No. 9593 (RA 9593) i , otherwise known as
Tourism Act of 2009, provided the framework for the sector. This has become the
guidelines and policy support for implementing programs, activities and program that
will help policy makers and planners optimize benefits from tourism. One of the
salient features provided in the objectives of RA 9593 is the collection, analysis and
dissemination of data that can accurately measure the economic and social impact
of tourism in the country to facilitate planning in the public and private sectors.
In the past years, Philippine tourism has seen a steady growth in inbound visitorsii by posting a compounded annual growth rate of 8.26% from 2002 to 2012. For the year 2012 alone, visitor arrivals iii to the Philippines posted an increase of 9.07% by achieving a record high of 4,272,811 visitors to the country. During this year, a new milestone for Philippine tourism was achieved as it was the first time that the country surpassed the 4 millionth arrivals. Another record was achieved by the tourism industry as it is the first time that a source market of the Philippines reached its 1 millionth visitor as arrivals from Korea recorded 1,031,155 visitors.
Clearly, the most basic and sought indicator of the performance of the tourism sector
is the volume of visitors to the country. More so, to provide more analysis of the
tourism situation, the profile and travel characteristics of the visitors are also
monitored as these are important data that gives more relevant basis in decision
making and marketing and promotion implementation. It is in this light that the
Department of Tourism in coordination with the Bureau of Immigration has
developed a system to process and generate data from the Arrival/Departure (A/D)
cards. The system has been the most important source of visitor data for the
Philippines as it provided data on the volume of visitors as well as profile and travel
characteristics of tourists.
II. History of the Arrival/Departure Card Processing Center
The Department of Tourism (DOT) and Bureau of Immigration (BI) have agreed to
jointly undertake the processing of the A/D cards and subsequently, management
and operations of the Arrival/Departure Cards Processing Center (ADCPC) in 1993.
It serves as the processing center of the A/D cards to meet the statistical and
monitoring requirements of both agencies. During the early operations of the
ADCPC, the DOT contracted the services of a Service Provider to manage and
operate the ADCPC. However in 2006, the DOT and BI took the full responsibility to
manage and operate the ADCPC and has since ceased the services of a Service
Provider. Consequently, during the same year, the DOT started hiring contractual
personnel to supply the manpower complement of the ADCPC. Over the years,
contract salaries of encoders, data controllers, supervisors and software developers
have been improved competitively. Management has based the salary level of
contract personnel on the responsibilities they hold, their efficiency, while being
guided by the standard government salary grade and compensation for job order
personnel. Management gives credit to individuals’ effectiveness and efficiency as
well as length of service. Suffice to say, the ADCPC has been operating smoothly for
more than twenty (20) years.
The database generated by ADCPC is shared by both DOT and BI.
Part of the evolving activities of the ADCPC is the continuing review and updating of
the A/D cards to meet the current demand for information that will be useful not only
to the DOT and BI, but to the users of the data being generated from the cards.
Hence, in between years of the ADCPC operations, the DOT conducted a Study on
Upgrading the Design, Collection and Processing of A/D cards. The study aims to
determine ways of improving the system for collecting the A/D cards. In addition, the
study looked into ways for quick transmittal and processing of the cards as well as
determines ways to enhance the A/D cards’ current design to suit the present need
for information. The study provided recommendations for an efficient, effective and
timely gathering and generation of statistics from the cards. It was because of this
Study that the DOT and BI, with consultations from various agencies, implemented
the revision to the cards’ design.
The updating of the design of the A/D cards did not stop as demand for information
changes. The need for more data, hence more items included in the card, go toe to
toe all the time with operational considerations. It was agreed in the inter-agency
committee on tourism statistics (IACTS) that the development and reformatting of the
card should undergo discussions within the IACTS or the technical working group
behind it. This way all data users’ requirements can be satisfied. However, it has
been experienced that for the most part, the format of the A/D card and even its
retrieval for processing sometimes is solely under the discretion of BI. Hence, as a
policy, all data users especially DOT must renegotiate and communicate with BI their
concern in the design of the card from time to time.
The project’s importance was more emphasized when it was included in the list of
designated statistical activities in 1996. iv The designationv was a milestone as it
assured the continuity and institutionalization of the activity.
III. Operation of the ADCPC
The ADCPC works under the principles of the Memorandum of Agreement between
DOT and BI. The MOA defines the responsibilities of each national agency in relation
to their respective mandates.
ADCPC is stationed in the international airport terminal, NAIA I, for convenience
since almost all of A/D cards are coming from BI stations in that port. The BI then is
tasked to assure turnover of A/D cards to DOT for encoding. Once batches of A/D
cards are encoded, DOT shall return the cards to BI for safekeeping. BI shall be
furnished with the database file regularly by DOT.
DOT will then process the database file along with that from sea manifest in order to
come up with reports on visitors to the country, mostly pertaining to volume and
visitor profile. Other data that are not necessary and not part of tourism such as
particular names of passengers though part of the database generated are owned
and exclusive to BI. DOT will disregard all these and in fact has no legal mandate to
release such data.
As a policy, the arrival cards are prioritized for immediate processing. Hence most of
the development in the project, including the speed of report generation was geared
towards the arrival cards. It was only recently that the departure cards are now being
processed simultaneously with the arrival cards.
Ideally, reports on arrival should be generated 2 weeks after the reference month
(period) while reports on departures should be generated 6 weeks after the
reference month (period). Consistency of reporting has been hampered from time to
time by delays of turnover of documents and efficiency of encoders.
III. Use of the Data obtained from A/D cards
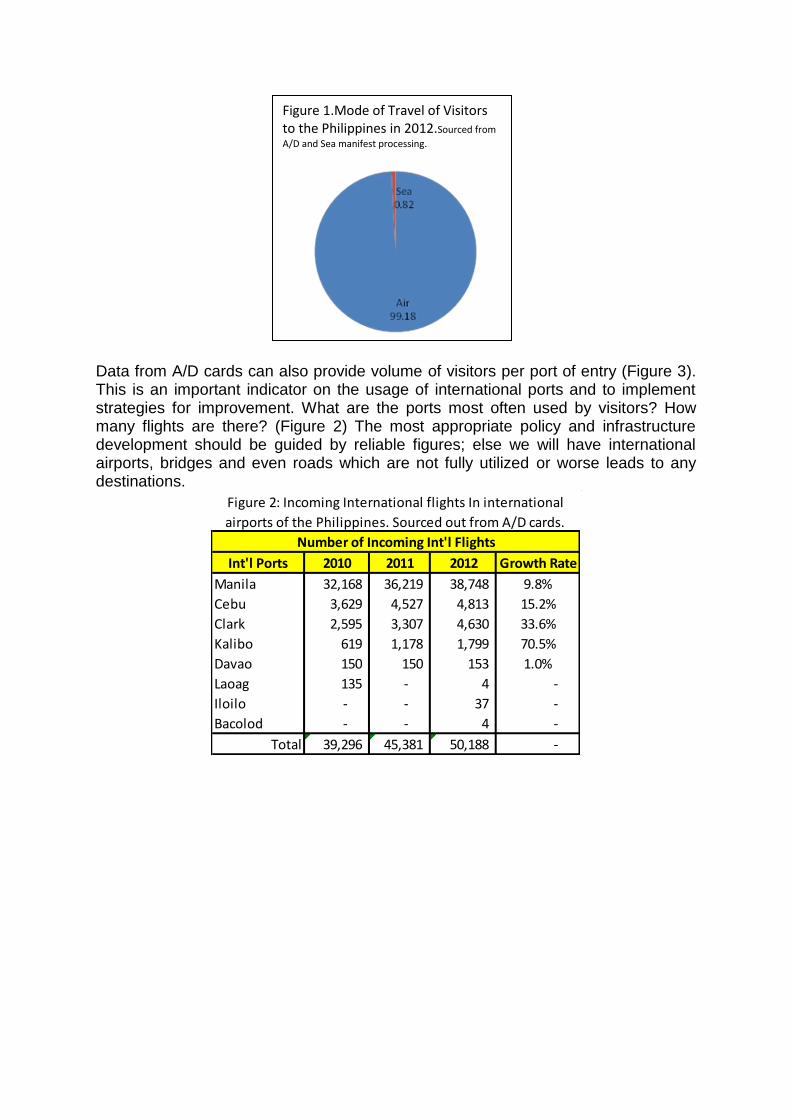
In tourism development, everything depends on how well the destination is being patronized, how its products are bought and tourism establishments are used. In order to have an indicator in the national level, the simplest way is to monitor arrivals of visitors to the country and understand their profile and travel characteristics. In the 2008 International Recommendations on Tourism Statistics (2008 IRTS) published by the United Nations World Tourism Organization (UNWTO), it is stated that when the measurement of inbound travel can be undertaken at the border, It is recommended that such administrative means of control as Entry/Departure cards, can be complemented with (or substituted by) surveys of travelers at the border (or in its vicinity), mostly at the moment the travelers leave the country.vi Consistent with the 2008 IRTS, the Philippines utilize the arrival card as a form of administrative record and source of data on visitor arrivals to the country. The sources of volume of arrivals to the Philippines are the A/D cards and the sea manifest. While the data from sea manifest are part and partial of that report, it is the data from the A/D cards that provides most of the indicators we need for policy and decision making. Figure 1 illustrates that visitors are almost all being sourced from A/D cards. As an archipelago, Philippine tourism depends on arrivals and transportation by air. Policy and decision makers will logically then gear up the quality and range of air services and the support infrastructure, knowing that these will affect the volume of visitors coming in. Concessions regarding air travel in the international level deeply affect the country’s tourism. For example, issues on the international grading of Philippine airports limit the flights coming in from other countries and airlines’ international grading also denotes their capacity to have clearance to fly popular destinations such as those in Europe.
Data from A/D cards can also provide volume of visitors per port of entry (Figure 3). This is an important indicator on the usage of international ports and to implement strategies for improvement. What are the ports most often used by visitors? How many flights are there? (Figure 2) The most appropriate policy and infrastructure development should be guided by reliable figures; else we will have international airports, bridges and even roads which are not fully utilized or worse leads to any destinations.
Int'l Ports 2010 2011 2012 Growth Rate
Manila 32,168 36,219 38,748 9.8%
Cebu 3,629 4,527 4,813 15.2%
Clark 2,595 3,307 4,630 33.6%
Kalibo 619 1,178 1,799 70.5%
Davao 150 150 153 1.0%
Laoag 135 - 4 -
Iloilo - - 37 -
Bacolod - - 4 -
Total 39,296 45,381 50,188 -
Number of Incoming Int'l Flights
Figure 2: Incoming International flights In international
airports of the Philippines. Sourced out from A/D cards.
Figure 1.Mode of Travel of Visitors to the Philippines in 2012.Sourced from
A/D and Sea manifest processing.

Aside from volume, the A/D cards also provide volume by country of residence, by major purpose of visit, by nationality, by age, by frequency of visit, by occupation, by sex, among others. These indicators are very important in the development of tourism programs including destination marketing and promotional plans. Figure 4 provides information for decision makers on where to develop and invest in. Knowing where visitors come from helps decision makers in their promotional and marketing strategy. They might think it wise and safe to invest on top markets especially if these are still rich with potential visitors. The other side would be to look at growing markets which have the potential to be big in time and with the right strategy. Having a tourism budget relatively and proportionately smaller compared to other country-destinations, it is very important to decide on strategies that will bring in more visitors to the country.
Int'l Ports 2010 2011 2012 Growth Rate
Manila 2,754,075 2,970,383 3,131,584 6.6% 45.9%
Cebu 474,507 567,099 612,548 13.6% 80.5%
Clark 129,865 163,852 224,802 31.6% 46.7%
Kalibo 88,380 175,273 259,663 71.4% 99.6%
Davao 5,182 7,448 8,276 26.4% 100%
Laoag 8,998 - 87 - 97.8%
Iloilo - - 598 - 12.6%
Bacolod - - 377 - 100%
Total 3,461,007 3,884,055 4,237,935 - -
Visitors by International Ports % of Visitors from
Passengers in 2012
Figure 3: Volume of Visitors by International Ports in the Philippines. Sourced out
from A/D cards.
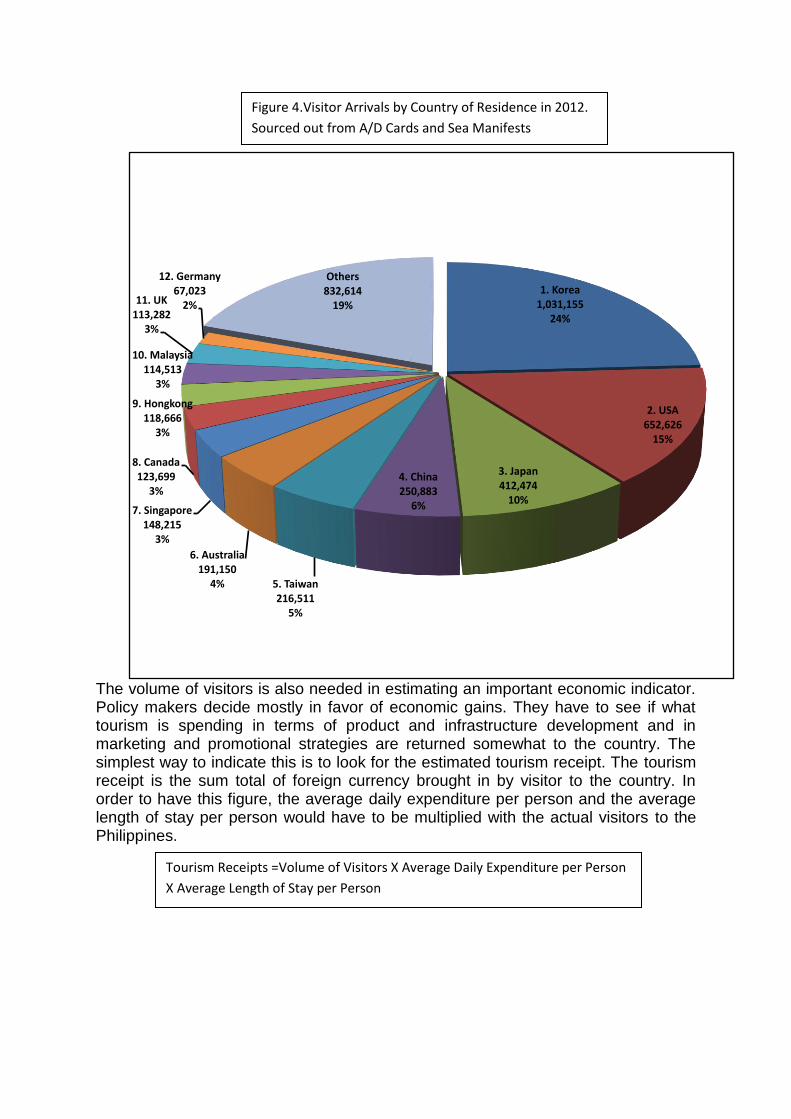
The volume of visitors is also needed in estimating an important economic indicator. Policy makers decide mostly in favor of economic gains. They have to see if what tourism is spending in terms of product and infrastructure development and in marketing and promotional strategies are returned somewhat to the country. The simplest way to indicate this is to look for the estimated tourism receipt. The tourism receipt is the sum total of foreign currency brought in by visitor to the country. In order to have this figure, the average daily expenditure per person and the average length of stay per person would have to be multiplied with the actual visitors to the Philippines.
Figure 4.Visitor Arrivals by Country of Residence in 2012.
Sourced out from A/D Cards and Sea Manifests
1. Korea1,031,155
24%
2. USA652,626
15%
3. Japan412,474
10%
4. China250,883
6%
5. Taiwan216,511
5%
6. Australia191,150
4%
7. Singapore148,215
3%
8. Canada123,699
3%
9. Hongkong118,666
3%
10. Malaysia114,513
3%
11. UK113,282
3%
12. Germany67,023
2%
Others832,614
19%
Tourism Receipts =Volume of Visitors X Average Daily Expenditure per Person
X Average Length of Stay per Person
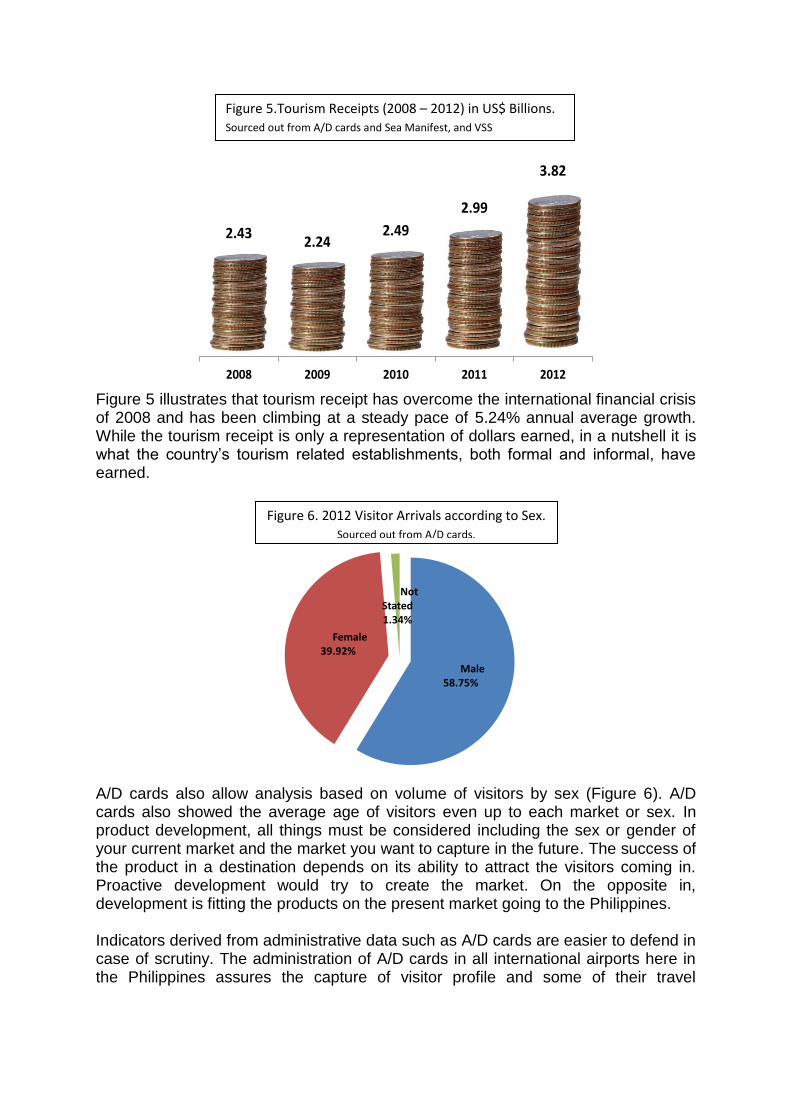
Figure 5 illustrates that tourism receipt has overcome the international financial crisis of 2008 and has been climbing at a steady pace of 5.24% annual average growth. While the tourism receipt is only a representation of dollars earned, in a nutshell it is what the country’s tourism related establishments, both formal and informal, have earned.
A/D cards also allow analysis based on volume of visitors by sex (Figure 6). A/D cards also showed the average age of visitors even up to each market or sex. In product development, all things must be considered including the sex or gender of your current market and the market you want to capture in the future. The success of the product in a destination depends on its ability to attract the visitors coming in. Proactive development would try to create the market. On the opposite in, development is fitting the products on the present market going to the Philippines. Indicators derived from administrative data such as A/D cards are easier to defend in case of scrutiny. The administration of A/D cards in all international airports here in the Philippines assures the capture of visitor profile and some of their travel
2.432.24
2.49
2.99
3.82
2008 2009 2010 2011 2012
Figure 5.Tourism Receipts (2008 – 2012) in US$ Billions. Sourced out from A/D cards and Sea Manifest, and VSS
Male58.75%
Female39.92%
Not Stated1.34%
Figure 6. 2012 Visitor Arrivals according to Sex. Sourced out from A/D cards.
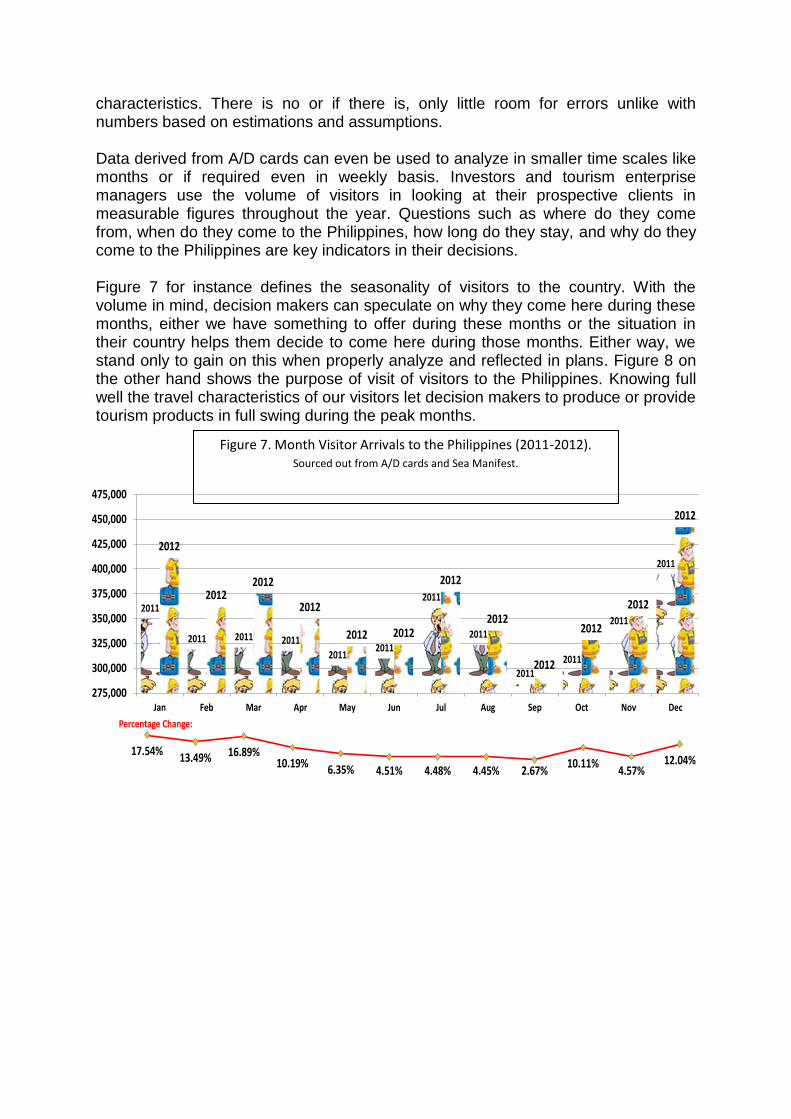
characteristics. There is no or if there is, only little room for errors unlike with numbers based on estimations and assumptions. Data derived from A/D cards can even be used to analyze in smaller time scales like months or if required even in weekly basis. Investors and tourism enterprise managers use the volume of visitors in looking at their prospective clients in measurable figures throughout the year. Questions such as where do they come from, when do they come to the Philippines, how long do they stay, and why do they come to the Philippines are key indicators in their decisions. Figure 7 for instance defines the seasonality of visitors to the country. With the volume in mind, decision makers can speculate on why they come here during these months, either we have something to offer during these months or the situation in their country helps them decide to come here during those months. Either way, we stand only to gain on this when properly analyze and reflected in plans. Figure 8 on the other hand shows the purpose of visit of visitors to the Philippines. Knowing full well the travel characteristics of our visitors let decision makers to produce or provide tourism products in full swing during the peak months.
Figure 7. Month Visitor Arrivals to the Philippines (2011-2012). Sourced out from A/D cards and Sea Manifest.
2011
2011 2011 2011
20112011
2011
2011
2011
2011
2011
2011
2012
20122012
2012
2012 2012
2012
2012
2012
2012
2012
2012
275,000
300,000
325,000
350,000
375,000
400,000
425,000
450,000
475,000
Jan Feb Mar Apr May Jun Jul Aug Sep Oct Nov Dec
17.54%13.49% 16.89%
10.19% 6.35% 4.51% 4.48% 4.45% 2.67%10.11%
4.57%12.04%
Percentage Change:
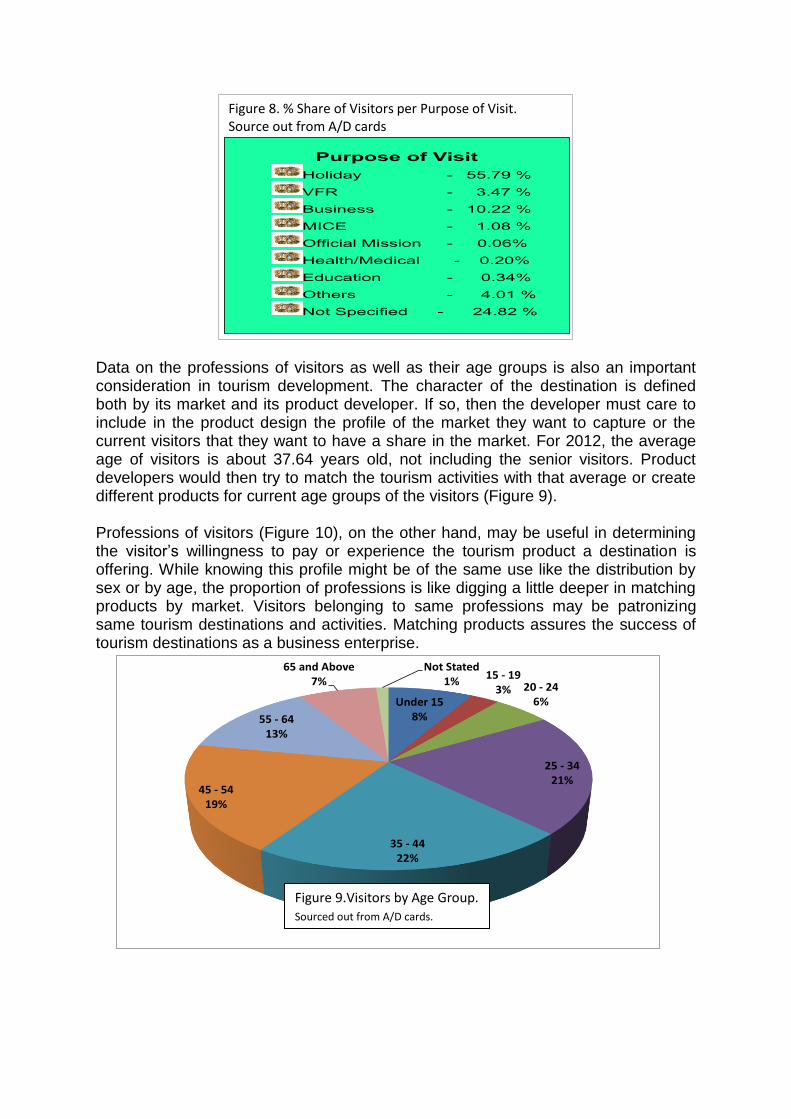
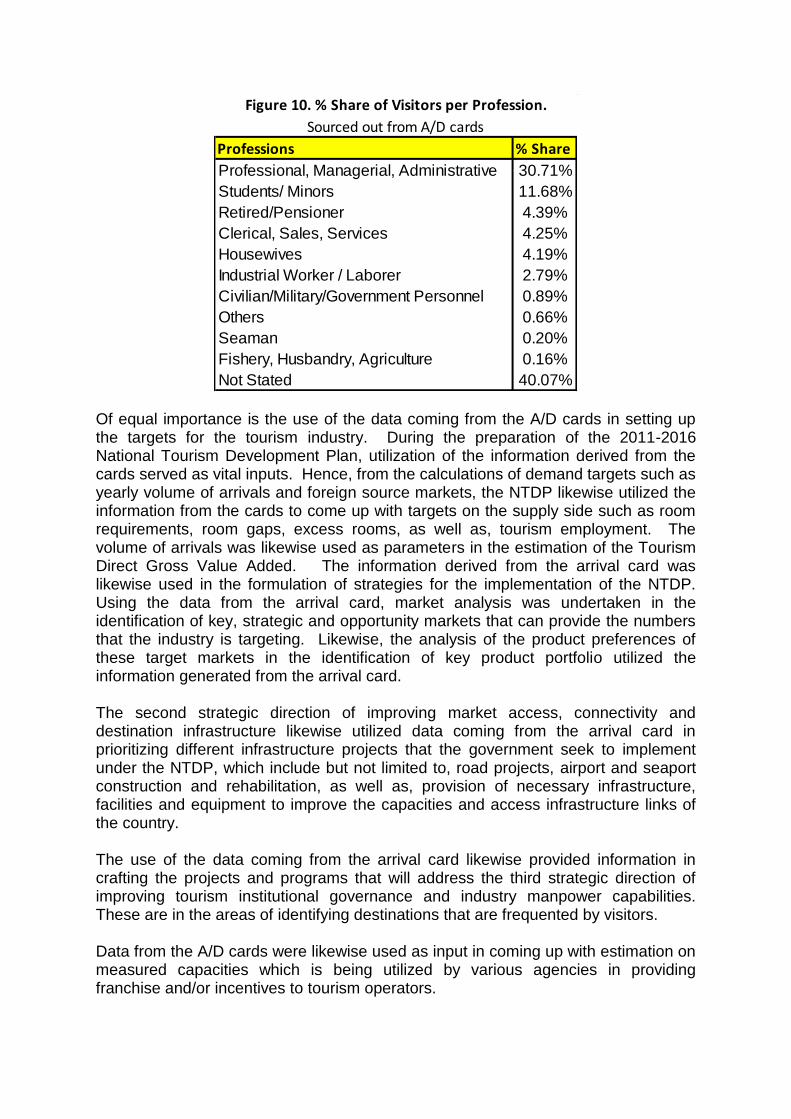
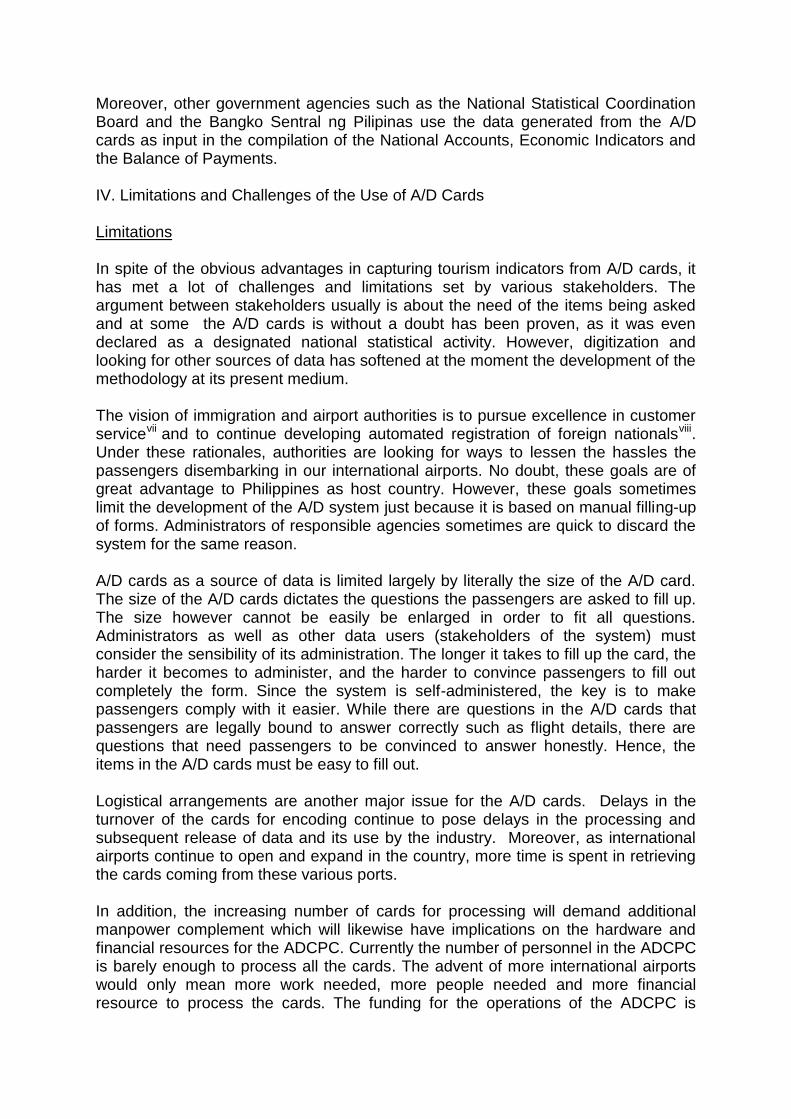
Data on the professions of visitors as well as their age groups is also an important consideration in tourism development. The character of the destination is defined both by its market and its product developer. If so, then the developer must care to include in the product design the profile of the market they want to capture or the current visitors that they want to have a share in the market. For 2012, the average age of visitors is about 37.64 years old, not including the senior visitors. Product developers would then try to match the tourism activities with that average or create different products for current age groups of the visitors (Figure 9). Professions of visitors (Figure 10), on the other hand, may be useful in determining the visitor’s willingness to pay or experience the tourism product a destination is offering. While knowing this profile might be of the same use like the distribution by sex or by age, the proportion of professions is like digging a little deeper in matching products by market. Visitors belonging to same professions may be patronizing same tourism destinations and activities. Matching products assures the success of tourism destinations as a business enterprise.
Figure 8. % Share of Visitors per Purpose of Visit.Source out from A/D cards
Purpose of Visit
Holiday - 55.79 %
VFR - 3.47 %
Business - 10.22 %
MICE - 1.08 %
Official Mission - 0.06%
Health/Medical - 0.20%
Education - 0.34%
Others - 4.01 %
Not Specified - 24.82 %
Under 158%
15 - 193% 20 - 24
6%
25 - 3421%
35 - 4422%
45 - 5419%
55 - 6413%
65 and Above7%
Not Stated1%
Figure 9.Visitors by Age Group. Sourced out from A/D cards.
Of equal importance is the use of the data coming from the A/D cards in setting up the targets for the tourism industry. During the preparation of the 2011-2016 National Tourism Development Plan, utilization of the information derived from the cards served as vital inputs. Hence, from the calculations of demand targets such as yearly volume of arrivals and foreign source markets, the NTDP likewise utilized the information from the cards to come up with targets on the supply side such as room requirements, room gaps, excess rooms, as well as, tourism employment. The volume of arrivals was likewise used as parameters in the estimation of the Tourism Direct Gross Value Added. The information derived from the arrival card was likewise used in the formulation of strategies for the implementation of the NTDP. Using the data from the arrival card, market analysis was undertaken in the identification of key, strategic and opportunity markets that can provide the numbers that the industry is targeting. Likewise, the analysis of the product preferences of these target markets in the identification of key product portfolio utilized the information generated from the arrival card. The second strategic direction of improving market access, connectivity and destination infrastructure likewise utilized data coming from the arrival card in prioritizing different infrastructure projects that the government seek to implement under the NTDP, which include but not limited to, road projects, airport and seaport construction and rehabilitation, as well as, provision of necessary infrastructure, facilities and equipment to improve the capacities and access infrastructure links of the country. The use of the data coming from the arrival card likewise provided information in crafting the projects and programs that will address the third strategic direction of improving tourism institutional governance and industry manpower capabilities. These are in the areas of identifying destinations that are frequented by visitors. Data from the A/D cards were likewise used as input in coming up with estimation on measured capacities which is being utilized by various agencies in providing franchise and/or incentives to tourism operators.
Professions % Share
Professional, Managerial, Administrative 30.71%
Students/ Minors 11.68%
Retired/Pensioner 4.39%
Clerical, Sales, Services 4.25%
Housewives 4.19%
Industrial Worker / Laborer 2.79%
Civilian/Military/Government Personnel 0.89%
Others 0.66%
Seaman 0.20%
Fishery, Husbandry, Agriculture 0.16%
Not Stated 40.07%
Figure 10. % Share of Visitors per Profession.
Sourced out from A/D cards
Moreover, other government agencies such as the National Statistical Coordination Board and the Bangko Sentral ng Pilipinas use the data generated from the A/D cards as input in the compilation of the National Accounts, Economic Indicators and the Balance of Payments. IV. Limitations and Challenges of the Use of A/D Cards Limitations In spite of the obvious advantages in capturing tourism indicators from A/D cards, it has met a lot of challenges and limitations set by various stakeholders. The argument between stakeholders usually is about the need of the items being asked and at some the A/D cards is without a doubt has been proven, as it was even declared as a designated national statistical activity. However, digitization and looking for other sources of data has softened at the moment the development of the methodology at its present medium. The vision of immigration and airport authorities is to pursue excellence in customer servicevii and to continue developing automated registration of foreign nationalsviii. Under these rationales, authorities are looking for ways to lessen the hassles the passengers disembarking in our international airports. No doubt, these goals are of great advantage to Philippines as host country. However, these goals sometimes limit the development of the A/D system just because it is based on manual filling-up of forms. Administrators of responsible agencies sometimes are quick to discard the system for the same reason. A/D cards as a source of data is limited largely by literally the size of the A/D card. The size of the A/D cards dictates the questions the passengers are asked to fill up. The size however cannot be easily be enlarged in order to fit all questions. Administrators as well as other data users (stakeholders of the system) must consider the sensibility of its administration. The longer it takes to fill up the card, the harder it becomes to administer, and the harder to convince passengers to fill out completely the form. Since the system is self-administered, the key is to make passengers comply with it easier. While there are questions in the A/D cards that passengers are legally bound to answer correctly such as flight details, there are questions that need passengers to be convinced to answer honestly. Hence, the items in the A/D cards must be easy to fill out. Logistical arrangements are another major issue for the A/D cards. Delays in the turnover of the cards for encoding continue to pose delays in the processing and subsequent release of data and its use by the industry. Moreover, as international airports continue to open and expand in the country, more time is spent in retrieving the cards coming from these various ports. In addition, the increasing number of cards for processing will demand additional manpower complement which will likewise have implications on the hardware and financial resources for the ADCPC. Currently the number of personnel in the ADCPC is barely enough to process all the cards. The advent of more international airports would only mean more work needed, more people needed and more financial resource to process the cards. The funding for the operations of the ADCPC is
currently being sourced from the General Appropriations fund of the DOT. Studies should be made on how to increase resource for this project. While DOT is a major user of the A/D card, and has taken the responsibility of processing it for all users and data owners, the administration of the cards is still under the jurisdiction of BI. This arrangement is one of the things that can be considered as something that delimits the A/D cards system. Logically, the arrangement is correct and becoming, therefore, it is included perennially as a priority of the interagency committee on tourism statistics. However, the arrangement and cooperation is not enough to manage the system. The consultations made have proven to be fairly formal most of the times. It delays the development, thereby limiting the potential of the system. Challenges As the tourism industry relies heavily on the information derived from the A/D cards, especially the volume of visitors, the phasing out of the arrival/departure cards in the ports of entry will pose a major challenge in the future. The industry has to look for alternative source of data that will provide indicator of the volume of visitors to the country when that happens. It has to be emphasized that administrative-sourced data has been identified as more reliable than those sourced from surveys or estimation methodologies. Stakeholders must lobby that the A/D cards system must not be discarded as a whole but must be evolved together with the other data capturing systems of the airport and immigration authorities. Another challenge that may be encountered in the near future is the move of the Department of Justice/Bureau of Immigration (DOJ/BI) in simplifying the cards which could mean the deletion of tourism information in the card. The immigration authorities must be made to understand the need of the other data users of the A/D card system and not to focus solely on their needs. The expansion of cruise tourism in the country can be a challenge also as it will require logistics in terms of collection of more information from this market segment. It has been suggested before to administer the A/D cards in seaports with regular international ships docking. With the growth of cruise tourism in the country, there is no direction other than to prepare administrative and technical arrangements. Other than logistical requirements, enhancement of the system to provide more information and data on this segment could mean updating of the process and applications used in the data processing of the encoded cards. In general, challenges for the A/D card system centers on the co-operation of the real owner of the system and the major users of data. It is understood that current direction right now of development in agencies concern centers on more effective and efficient process thru the application of up-to-date information and communication technologies. Still, emphasis must be given to importance of each data culled from the system. Making everybody understand the need of this data is a challenge that needs future strategic plans.
VI. Future Development and Recommendations With the evolving statistical methodologies and compilation in counting border arrivals, as well as implementation of various regional agreements like when ASEAN finally becomes like the European Union where arrival cards are dispensed off, a different methodology for counting arrivals can be developed. The 2008 IRTS provided recommendation that in case of countries where the administrative controls at the borders have disappeared and where surveys of travelers at the border cannot be implemented, surveys of travelers at places of accommodation be used in parallel with other sources (for example, such as surveys at popular tourism sites or other destinations.ix We have to learn from countries that do not use A/D cards as source of information for their volume of visitors. Best practices in the use of surveys for estimating inbound visitors can likewise be looked into. The UNWTO compiles information on the methodologies used by its member countries in the generation of tourism data which can likewise be helpful once the A/D cards will be phased out by the Bureau of Immigration. Another possibility, though remote, can be the implementation of a “tourism card”, much like the A/D card, which the tourism industry may implement. Another future development is to look into the Department of Tourism’s Visitor Sample Survey (VSS) results in coming up with a methodology on estimating the volume of inbound visitors. The VSS at present is already complementing the information coming from the cards when the BI decided to trim down the information being asked from the passengers. The use of mirror data or partner country data can also be studied in the future to be able to estimate the volume of arrivals to the country in the absence of the arrival card. While this is very feasible in paper, a line of difficulties would need to be hurdled. This methodology would need high level of coordination amongst many countries to start with. Just like other countries, the discarding of the A/D cards as the source of volume for inbound visitors for the Philippines will greatly affect the future tourism indicators that are being provided by the current data from the cards. However, the industry must be prepared for it in the face of the developments in researches, changes in border control implementation and the use of technology in various statistical compilations. It is noteworthy to mention, that these developments will not only satisfy the need for volume of visitors to the Philippines as a basic indicator of the tourism industry but of parallel significance is to ensure that the data to be generated is comparable with other countries. On a final note, given that the importance of the data generated from the A/D card system has been established, it is recommended that agencies that are stakeholders of the data from A/D card System must sit down and work substantially on the future direction of the system. Since the data is useful not only to its sole owner but for many national level agencies and not to mention, local government units which uses the data in their development plans, it is only right that its development must be agreed by all.
REFERENCES Department of Tourism. Republic Act No. 9593 otherwise known as Tourism Act of 2009 and Its Implementing Rules and Regulations. 2009. United Nations World Tourism Organization. International Recommendations for Tourism Statistics.2008. Department of Tourism. National Tourism Development Plan 2011-2016. Wikipedia, the free Encyclopedia. i An Act Declaring a National policy for tourism as an engine of investment, employment, growth and national development, and strengthening the Department of Tourism and its attached agencies to effectively and efficiently implement that policy, and appropriating funds therefor. iiInbound visitor is a person undertaking travel to a country who is a non- resident of the country visited.
iii Visitor arrival is the volume of visitors arriving to the country during a given period
ivExecutive Order 352 dated July 1, 1996 signed by President Fidel V. Ramos declared the processing of A / D
cards as a designated statistical activity. v Designated statistical activities and indicators are prioritized in budget and management. The system of
designating statistics and activities is being implemented by the National Statistical Coordination Board for the purpose of identifying nationally important activities that provides critical data for decision making. vi 2008 IRTS, 2.57
viiwww.miaa.gov.ph. Manila International Airport Authority’s Vision states,” Manila International Airport Authority,
by 2016, will be the leading organization in airport development and management and pursuing excellence in customer service, world-class facilities, high quality security and safety standards in promoting the Philippines as a destination of choice for trade and tourism.” viii
www.immigration.gov.ph. Goals and Objectives: 3. To maintain automated registration and monitoring of
foreign nationals to implement the nationwide mapping of aliens, so as to identify undocumented, improperly and incompletely documented foreign nationals; ix UNWTO 2008 International Recommendations on for Tourism Statistics , 2.56


![Architecture Thesis presentation: Arrival [ ] Departure](https://img.pdfslide.net/doc/110x75/579054461a28ab900c8fdb77/architecture-thesis-presentation-arrival-departure.jpg)