Embed Size (px)
Citation preview
7/24/2019 Arsalaan Thesis Paper
http://slidepdf.com/reader/full/arsalaan-thesis-paper 1/7
3rd World Conference on Applied Sciences,
Engineering and Technology
27-29 September 2!"
The application of imaging technique to study
segregation and aggregate orientation in cement concrete
ARSALAAN K HAN1, RAWID K HAN2
#ac$lty member, %epartment of Ci&il Engineering, 'ni&ersity of Engineering ( Technology )esha*ar )a+istan
Email !engrarsalaan.gmailcom, 2ra*id/0.gmailcom
Abstract: Segregation and orientation of aggregate affects the performance of cement concrete. Image analysistechnique was applied to study orientation and segregation of aggregates in hardened concrete. Samples prepared from 1½ inch and 1 inch down aggregate both in laboratory and in situ were scanned for images.Samples with steel bars were also scanned to understand the effect of reinforcement. From image analysis of thedata, it was found that the value of segregation is not similar for laboratory, and site prepared samples. Thevalues are varying through the height of the samples and there is high segregation near the edges compared to
the midpoint of sample.
Keywords: 1mage analysis, 1mage, threshold, segregation, regional orientation
1 Introduction & Literature Review
The orientation and distribution of aggregates have asignificant effect on the performance of concretemitures. The internal structure of asphalt concrete pavements plays a vital role in its resistance todistress, which include rutting and crac!ing due to
fatigue, low temperature and thermal changes "#.$asad %. $., 1&&&'.(ifferent mechanical properties of asphalt andconcrete mitures are obtained with specimenshaving the same air voids content and mi design.This difference is due to aggregate orientation and
segregation as function of particle si)e and shape, position in the sample, and mode of compaction, thathave significant influence on asphalt miture performance "*listair #. +unter, --'. The methodof compaction has a direct impact on the aggregateorientation and internal structure of an asphalt
miture "*.#. +unter, --'. The quantification of the aggregate matri of an asphalt miture specimenis an important and difficult tas! because of itscomposite structure and three/dimensional form. Theasphalt matri is a composite of three phases0 air,mastic and aggregate, each of which may be
described by their distribution, shape properties andsegregation within any given specimen "*listair #.+unter, --'. Image analysis has made it possible toquantitatively define and study the aggregate matriand asphalt and concrete specimens. (ifferent image
processing procedures can be applied to distinguishthe aggregate particles from the bac!ground for image analysis. ircumferential particle orientationoccurs mostly in gyratory and vibratory compactedspecimens, and to a lesser etent in slab, compactedspecimens "*listair #. +unter, --'. $astic is a
combination of asphalt binder and fines, which are particles passing sieve 2 -- "i.e. si)es finer than 34microns'. The proportions, distribution, andinteractions of these three phases define the micromechanical behavior of asphalt concrete pavements"+.$. 5elelew, --6'.
7ecent studies show that the microstructure of asphalt mitures can be quantified using imageanalysis techniques. This approach allows theaggregate structure to be accurately and non/destructively visuali)ed at the microstructure level.
8ast wor! shows that the gradation curves obtainedafter image analysis on different specimenscompacted via different methods give almost sameresults as coarse particles are mostly concentrated atthe bottom compared to the top of the specimen, theoverall average orientation angles for the whole
specimen is around 4-, showing random orientationin the specimens, and the aggregates in the outer section of the specimen tend to form circumferentialalignment whereas randomly aligned in the inner section "9orhidayah , -1'.The ob:ective of this research is to develop, and
apply the image analysis technique for studying thesegregation and orientation of coarse aggregates incement concrete in laboratory and in situ, and withand without reinforcement.
! "ethodology
The methodology consists of eperimental wor! involving preparation of samples and thedevelopment of the image analysis program inImage; software.
2.1 Mix design and aggregate gradation
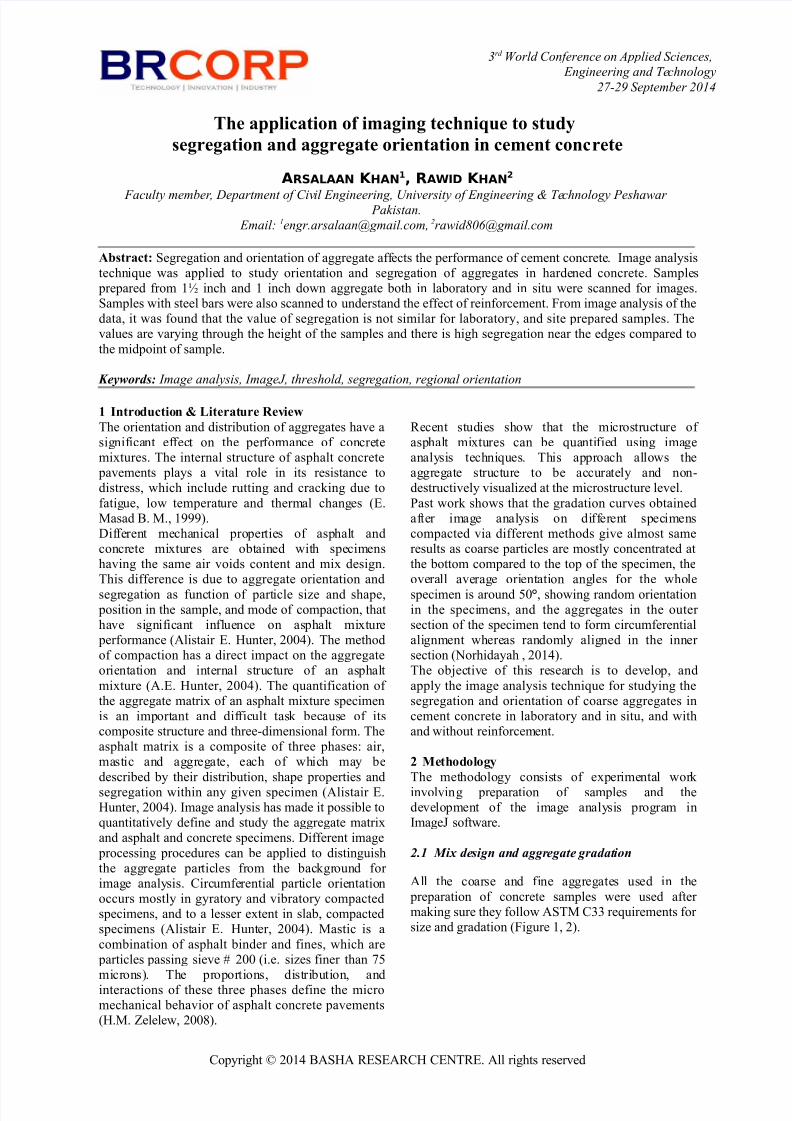
*ll the coarse and fine aggregates used in the
preparation of concrete samples were used after ma!ing sure they follow *ST$ << requirements for si)e and gradation "Figure 1, '.
opyright = -1 %*S+* 7#S#*7+ #9T7#. *ll rights reserved
7/24/2019 Arsalaan Thesis Paper
http://slidepdf.com/reader/full/arsalaan-thesis-paper 2/7
*7S*>**9 ?+*9, 7*@I( ?+*9
#ig$re ! radation c$r&e for !45 lab samples
6coarse aggregate
#ig$re 2 radation c$r&e for !45 and !8 lab
samples 6fine aggregate
2.2 Preparation of lab and field representative
concreteSample of 1 ½ inch and 1 inch down aggregate were prepared in laboratory. *dditionally, samples withreinforcement bars were also prepared to study theeffect of reinforcement on aggregate segregation and
orientation "Figure <. '.>aboratory concrete samples in controlledenvironment were prepared <--- psi. $i design and proportioning was done using *bsolute Aolumemethod of the *I code. Two cylinders out of fivefor each concrete type were tested for crushing
strength via universal testing machine whereas therests were cut at bottom, middle and top levels for
acquiring the images.
#ig$re 3 ab representati&e samples
Field representative concrete was prepared followingthe same mi design ratio for 1½B and 1B downconcrete, used for lab prepared samples. This was
done to study the effect of cylinderCs wall onhardened concrete properties.
#ig$re " !25 deep field concrete slabs, !48 do*n on
right and !8 do*n on left
Two slabs of 1 ½ inch and 1 inch down concrete were prepared. These slabs were 4B long, 1B wide and1B deep. The length and depth were decided so that
to etract five cores from each slab, and its depth wasdecided to be as of laboratory cylinder samples, for depth/wise similarity.
2.3 Preparation of reinforced concrete samples
*s the effect of reinforcement on aggregatesC
orientation and segregation was the desired ob:ectivethis study, concrete samples having steel bars were prepared for the purpose and then to cut along thecross/section at the required levels. * problem facedin preparing these samples was that the samplescould not be cut along the cross section with the
available cutter that was only capable of cutting
concrete, and not the steel bars. This was resolved byusing straight rubber pipes of the same outer diameter as of the steel bars. These pipes were !ept straightduring pouring of concrete in the cylinder byinserting a straight steel rod in the rubber pipes that
were removed from the pipes after the concrete hadgot hardened. * total of three 9o "1D inch' si)esteel bars were placed with plastic pipes in cylinder
2.4 Cores extraction ! "ield representative
samples
Two cores out of the five etracted cores "Figure 4'were tested for compressive strength.
#ig$re : Cores; e<traction from slabs in progress
<7( @E7>( E9F#7#9# E9 *88>I#( SI#9#S, #9I9##7I9 *9( T#+9E>EG
3/& S#8T#$%#7 -1
7/24/2019 Arsalaan Thesis Paper
http://slidepdf.com/reader/full/arsalaan-thesis-paper 3/7
*7S*>**9 ?+*9, 7*@I( ?+*9
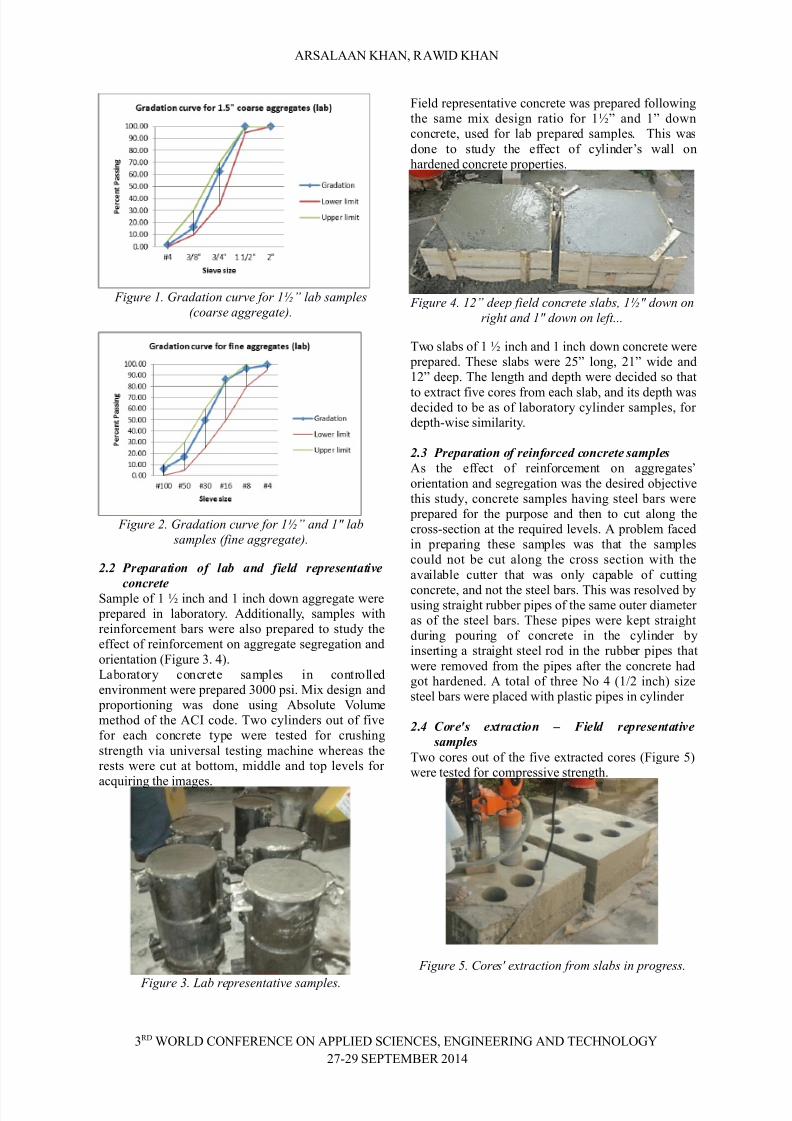
2.# C$tting process of samples
The locations of cutting were mar!ed on the samplesonce they were ready. The samples were cut at ½B
from the bottom and top level, and also at the mid/level, so as to acquire images at these locations for further study. The top and bottom covers were
important to be removed so that the aggregate particles become visible for image acquisition.8roviding proper nomenclature to the samples was
very important because it becomes impossible todistinguish once the sample is cut. Similarly, itcannot be identified whether the surface is the upper,middle or lower one unless not mentioned on thesamples before cutting.
#ig$re 0 =ie* of reinforced cylinders and field core
samples after being c$t at re>$ired le&els
2.% &mages ac'$isition process
*fter the process of cutting all samples at requiredlevels, images were then acquired with flatbedscanner.
#ig$re 7 1mage ac>$ired sho*ing air &oids, mastic
and aggregate
2.( )ata ac'$isition * &mage analysis
( images were processed to study the effect of concrete preparation in controlled and uncontrolled
environments on aggregatesC orientation andsegregation.Image analysis was performed on these images with
Image ; the image analysis software "*bramoff,--'. *nalyses was done based on piels anddegrees of the input image. For eample, the area,
perimeters, etc. are calculated in units of square piels, and feret angle, etc. in decimal degrees. Thesoftware was also used to crop the images acquired
so that the concrete cross sections could bemagnified, for further analysis. Figure 3 shows asample output image generated by Image;. The
aggregates are labeled, and the data is eported tospreadsheet. $acro was developed in Image; thatwas run on each image loaded in the software. This
macro applied the necessary filters and converts theimage into binary image and then detects the boundary of all aggregates and then labels them andcalculates the required data and displays inspreadsheet for further manipulation.
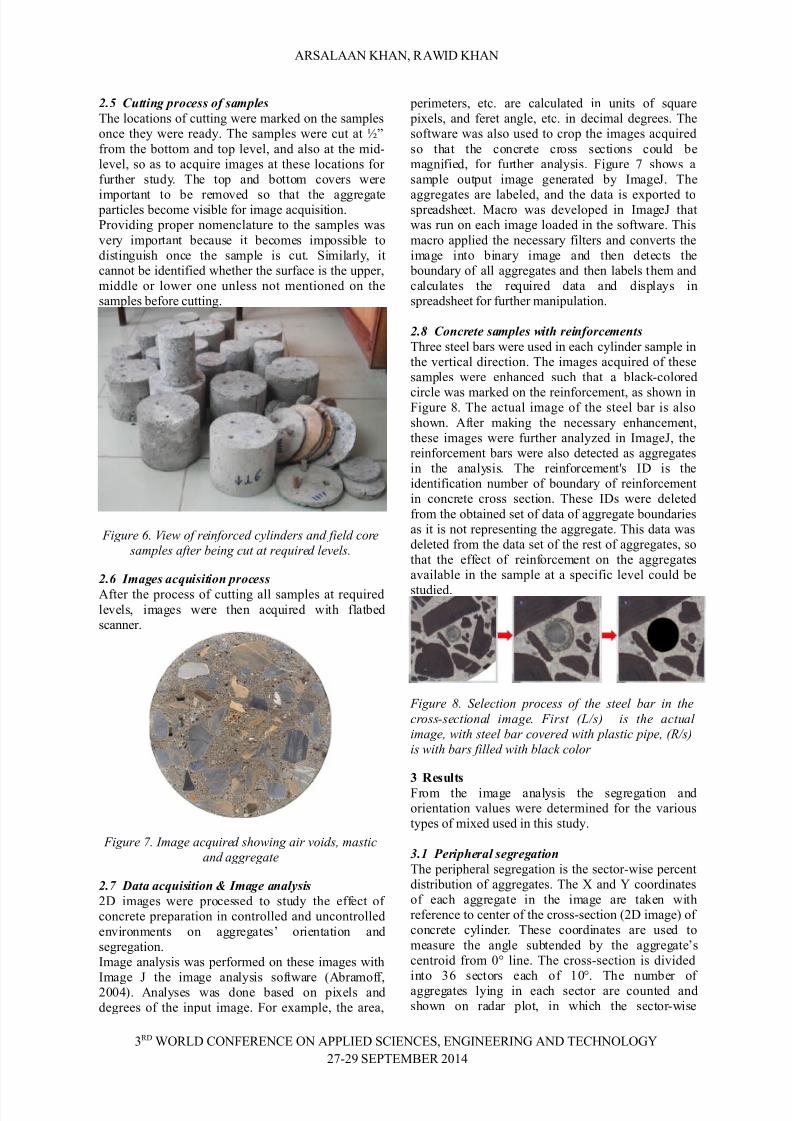
2.+ Concrete samples wit, reinforcements
Three steel bars were used in each cylinder sample inthe vertical direction. The images acquired of thesesamples were enhanced such that a blac!/colored
circle was mar!ed on the reinforcement, as shown inFigure 6. The actual image of the steel bar is also
shown. *fter ma!ing the necessary enhancement,these images were further analy)ed in Image;, thereinforcement bars were also detected as aggregatesin the analysis. The reinforcementHs I( is theidentification number of boundary of reinforcementin concrete cross section. These I(s were deleted
from the obtained set of data of aggregate boundariesas it is not representing the aggregate. This data wasdeleted from the data set of the rest of aggregates, sothat the effect of reinforcement on the aggregatesavailable in the sample at a specific level could be
studied.
#ig$re / Selection process of the steel bar in the
cross-sectional image #irst 6?s is the act$al
image, *ith steel bar co&ered *ith plastic pipe, 6@?s
is *ith bars filled *ith blac+ color
# Results
From the image analysis the segregation andorientation values were determined for the varioustypes of mied used in this study.
3.1 Perip,eral segregation
The peripheral segregation is the sector/wise percentdistribution of aggregates. The and G coordinatesof each aggregate in the image are ta!en withreference to center of the cross/section "( image' of concrete cylinder. These coordinates are used to
measure the angle subtended by the aggregateCscentroid from -J line. The cross/section is divided
into <K sectors each of 1-J. The number of aggregates lying in each sector are counted andshown on radar plot, in which the sector/wise
<7( @E7>( E9F#7#9# E9 *88>I#( SI#9#S, #9I9##7I9 *9( T#+9E>EG
3/& S#8T#$%#7 -1
7/24/2019 Arsalaan Thesis Paper
http://slidepdf.com/reader/full/arsalaan-thesis-paper 4/7
*7S*>**9 ?+*9, 7*@I( ?+*9
distribution of aggregates at bottom, middle and toplevels could be compared. $aimum value of peripheral segregation is the largest number of
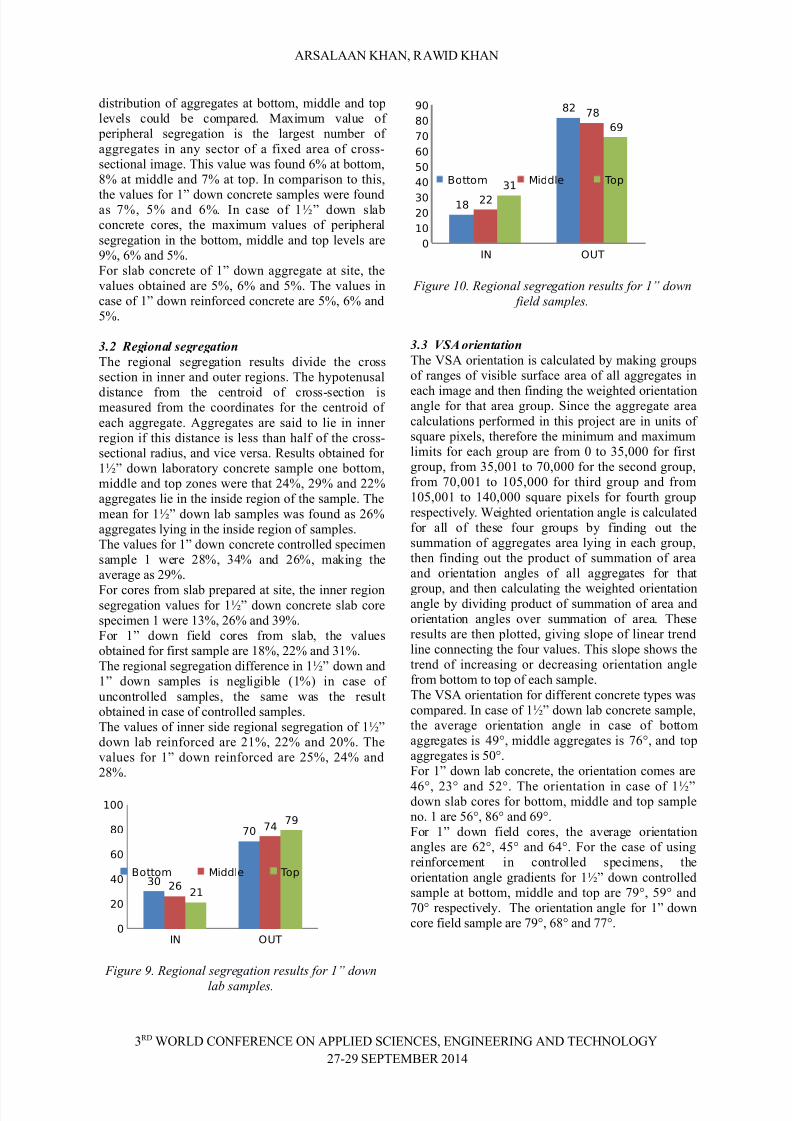
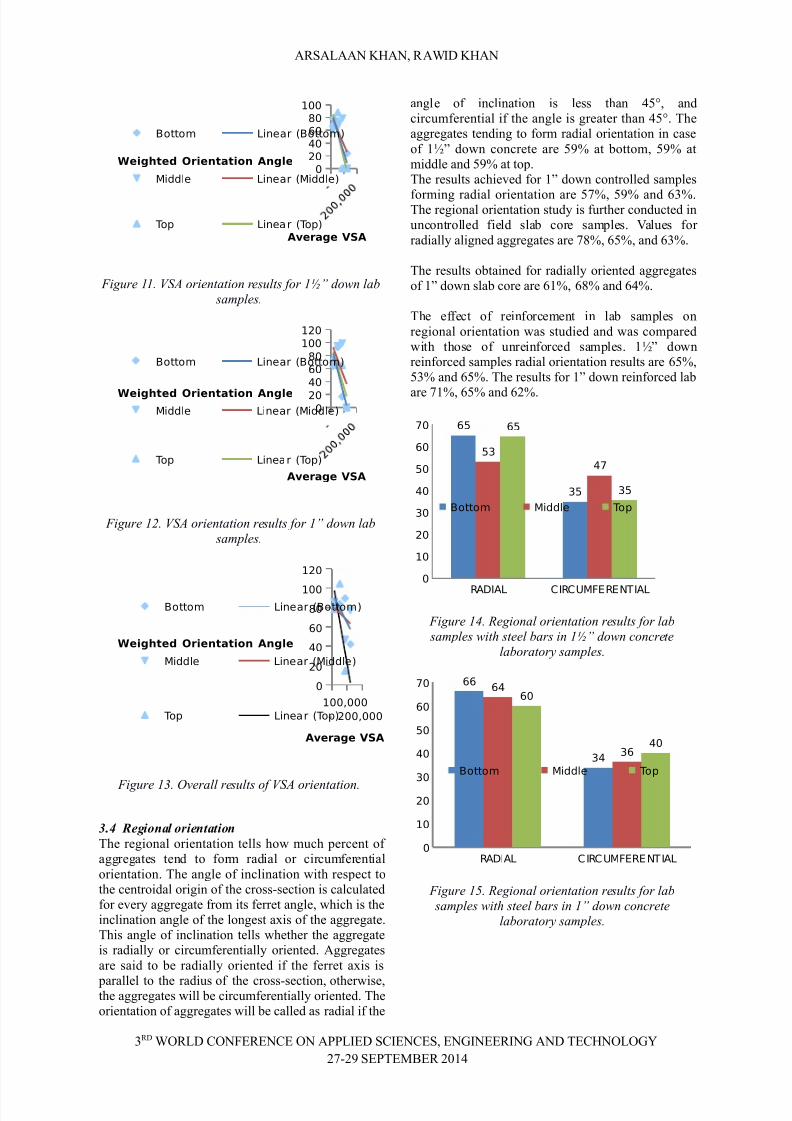
aggregates in any sector of a fied area of cross/sectional image. This value was found KL at bottom,6L at middle and 3L at top. In comparison to this,
the values for 1B down concrete samples were foundas 3L, 4L and KL. In case of 1½B down slabconcrete cores, the maimum values of peripheral
segregation in the bottom, middle and top levels are&L, KL and 4L.For slab concrete of 1B down aggregate at site, thevalues obtained are 4L, KL and 4L. The values incase of 1B down reinforced concrete are 4L, KL and4L.
3.2 -egional segregation
The regional segregation results divide the crosssection in inner and outer regions. The hypotenusal
distance from the centroid of cross/section ismeasured from the coordinates for the centroid of
each aggregate. *ggregates are said to lie in inner region if this distance is less than half of the cross/sectional radius, and vice versa. 7esults obtained for 1½B down laboratory concrete sample one bottom,middle and top )ones were that L, &L and Laggregates lie in the inside region of the sample. The
mean for 1½B down lab samples was found as KLaggregates lying in the inside region of samples.The values for 1B down concrete controlled specimensample 1 were 6L, <L and KL, ma!ing theaverage as &L.
For cores from slab prepared at site, the inner regionsegregation values for 1½B down concrete slab corespecimen 1 were 1<L, KL and <&L.For 1B down field cores from slab, the valuesobtained for first sample are 16L, L and <1L.The regional segregation difference in 1½B down and1B down samples is negligible "1L' in case of
uncontrolled samples, the same was the resultobtained in case of controlled samples.The values of inner side regional segregation of 1½Bdown lab reinforced are 1L, L and -L. Thevalues for 1B down reinforced are 4L, L and6L.
IN OUT0
20
40
60
80
100
30
70
26
74
21
79
Bottom Middle Top
#ig$re 9 @egional segregation res$lts for !5 do*n
lab samples
IN OUT0
10
2030
40
50
60
70
80
90
18
82
22
78
31
69
Bottom Middle Top
#ig$re ! @egional segregation res$lts for !5 do*n
field samples
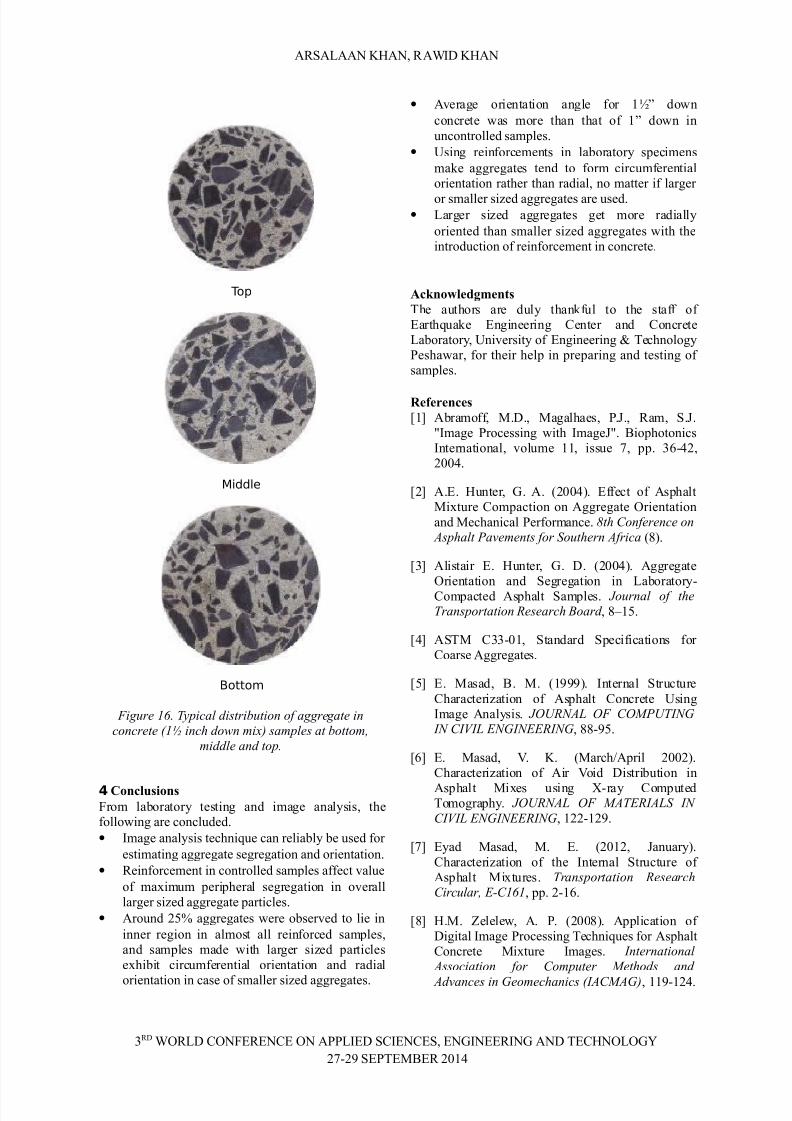
3.3 /0 orientation
The AS* orientation is calculated by ma!ing groupsof ranges of visible surface area of all aggregates in
each image and then finding the weighted orientationangle for that area group. Since the aggregate area
calculations performed in this pro:ect are in units of square piels, therefore the minimum and maimumlimits for each group are from - to <4,--- for firstgroup, from <4,--1 to 3-,--- for the second group,from 3-,--1 to 1-4,--- for third group and from1-4,--1 to 1-,--- square piels for fourth group
respectively. @eighted orientation angle is calculatedfor all of these four groups by finding out thesummation of aggregates area lying in each group,then finding out the product of summation of areaand orientation angles of all aggregates for that
group, and then calculating the weighted orientationangle by dividing product of summation of area andorientation angles over summation of area. Theseresults are then plotted, giving slope of linear trendline connecting the four values. This slope shows thetrend of increasing or decreasing orientation anglefrom bottom to top of each sample.
The AS* orientation for different concrete types wascompared. In case of 1½B down lab concrete sample,the average orientation angle in case of bottomaggregates is &J, middle aggregates is 3KJ, and topaggregates is 4-J.For 1B down lab concrete, the orientation comes are
KJ, <J and 4J. The orientation in case of 1½Bdown slab cores for bottom, middle and top sampleno. 1 are 4KJ, 6KJ and K&J.For 1B down field cores, the average orientationangles are KJ, 4J and KJ. For the case of usingreinforcement in controlled specimens, the
orientation angle gradients for 1½B down controlledsample at bottom, middle and top are 3&J, 4&J and3-J respectively. The orientation angle for 1B downcore field sample are 3&J, K6J and 33J.
<7( @E7>( E9F#7#9# E9 *88>I#( SI#9#S, #9I9##7I9 *9( T#+9E>EG
3/& S#8T#$%#7 -1
7/24/2019 Arsalaan Thesis Paper
http://slidepdf.com/reader/full/arsalaan-thesis-paper 5/7
*7S*>**9 ?+*9, 7*@I( ?+*9
020406080
100
Bottom Linear (Bottom
Middle Linear (Middle
Top Linear (TopAverage VSA
Weighted Orientation Angle
#ig$re !! =SA orientation res$lts for !45 do*n lab
samples
020
40
60
80
100
120
Bottom Linear (Bottom
Middle Linear (Middle
Top Linear (Top
Average VSA
Weighted Orientation Angle
#ig$re !2 =SA orientation res$lts for !5 do*n lab
samples
!
100"000
200"000
0
20
40
60
80
100
120
Bottom Linear (Bottom
Middle Linear (Middle
Top Linear (Top
Average VSA
Weighted Orientation Angle
#ig$re !3 &erall res$lts of =SA orientation
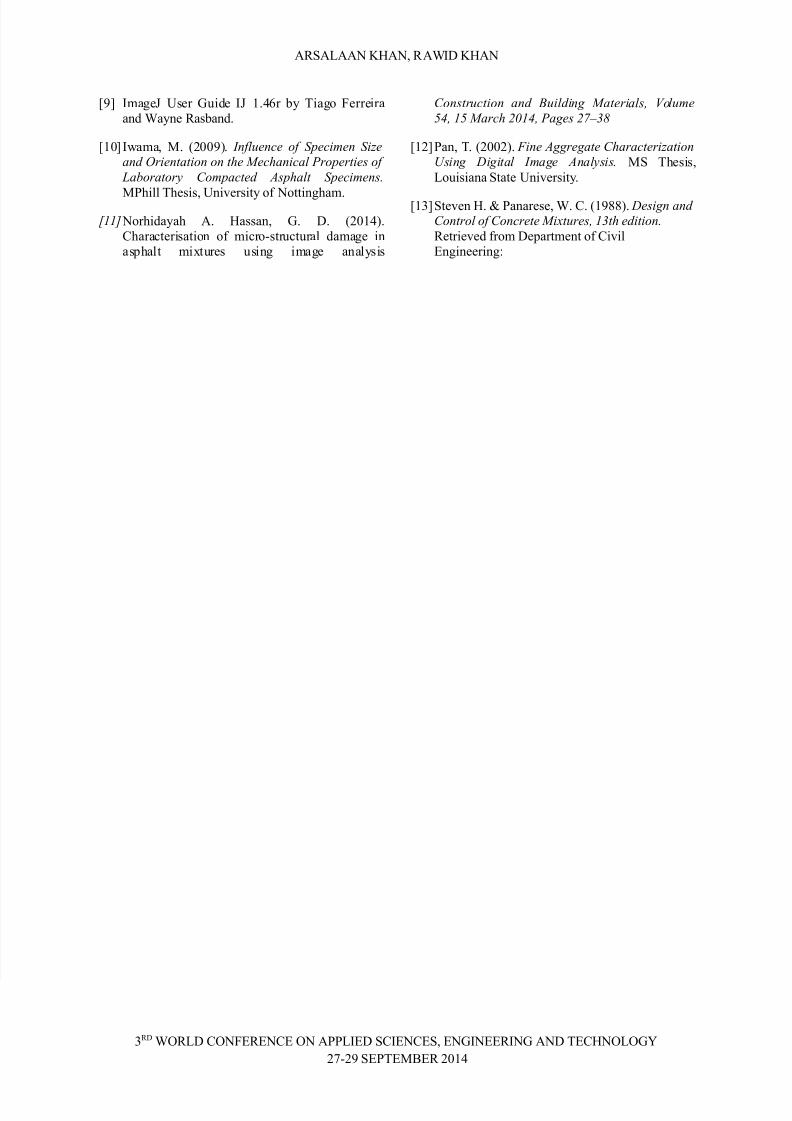
3.4 -egional orientation
The regional orientation tells how much percent of aggregates tend to form radial or circumferential
orientation. The angle of inclination with respect tothe centroidal origin of the cross/section is calculatedfor every aggregate from its ferret angle, which is theinclination angle of the longest ais of the aggregate.This angle of inclination tells whether the aggregateis radially or circumferentially oriented. *ggregates
are said to be radially oriented if the ferret ais is
parallel to the radius of the cross/section, otherwise,the aggregates will be circumferentially oriented. Theorientation of aggregates will be called as radial if the
angle of inclination is less than 4J, andcircumferential if the angle is greater than 4J. Theaggregates tending to form radial orientation in case
of 1½B down concrete are 4&L at bottom, 4&L atmiddle and 4&L at top.The results achieved for 1B down controlled samples
forming radial orientation are 43L, 4&L and K<L.The regional orientation study is further conducted inuncontrolled field slab core samples. Aalues for
radially aligned aggregates are 36L, K4L, and K<L.
The results obtained for radially oriented aggregatesof 1B down slab core are K1L, K6L and KL.
The effect of reinforcement in lab samples on
regional orientation was studied and was comparedwith those of unreinforced samples. 1½B downreinforced samples radial orientation results are K4L,4<L and K4L. The results for 1B down reinforced lab
are 31L, K4L and KL.
#$%I$L &I#&UM'#NTI$L
0
10
20
30
40
50
60
70 65
35
53
47
65
35
Bottom Middle Top
#ig$re !" @egional orientation res$lts for lab
samples *ith steel bars in !45 do*n concrete
laboratory samples
#$%I$L &I#&UM'#NTI$L0
10
20
30
40
50
60
70 66
34
64
36
60
40
Bottom Middle Top
#ig$re !: @egional orientation res$lts for lab
samples *ith steel bars in !5 do*n concrete
laboratory samples
<7( @E7>( E9F#7#9# E9 *88>I#( SI#9#S, #9I9##7I9 *9( T#+9E>EG
3/& S#8T#$%#7 -1
7/24/2019 Arsalaan Thesis Paper
http://slidepdf.com/reader/full/arsalaan-thesis-paper 6/7
*7S*>**9 ?+*9, 7*@I( ?+*9
Top
Middle
Bottom
#ig$re !0 Typical distrib$tion of aggregate in
concrete 6!4 inch do*n mi< samples at bottom,
middle and top
4 $onclusions From laboratory testing and image analysis, thefollowing are concluded.
• Image analysis technique can reliably be used for
estimating aggregate segregation and orientation.
• 7einforcement in controlled samples affect value
of maimum peripheral segregation in overall
larger si)ed aggregate particles.
• *round 4L aggregates were observed to lie in
inner region in almost all reinforced samples,and samples made with larger si)ed particles
ehibit circumferential orientation and radial
orientation in case of smaller si)ed aggregates.
• *verage orientation angle for 1½B down
concrete was more than that of 1B down in
uncontrolled samples.
• Msing reinforcements in laboratory specimens
ma!e aggregates tend to form circumferentialorientation rather than radial, no matter if larger
or smaller si)ed aggregates are used.• >arger si)ed aggregates get more radially
oriented than smaller si)ed aggregates with theintroduction of reinforcement in concrete.
Ac%nowledgments The authors are duly than!ful to the staff of #arthqua!e #ngineering enter and oncrete>aboratory, Mniversity of #ngineering N Technology8eshawar, for their help in preparing and testing of samples.
References
O1P *bramoff, $.(., $agalhaes, 8.;., 7am, S.;.QImage 8rocessing with Image;Q. %iophotonicsInternational, volume 11, issue 3, pp. <K/,--.
OP *.#. +unter, . *. "--'. #ffect of *sphalt$iture ompaction on *ggregate Erientation
and $echanical 8erformance. /th Conference on
Asphalt )a&ements for So$thern Africa "6'.
O<P *listair #. +unter, . (. "--'. *ggregateErientation and Segregation in >aboratory/ompacted *sphalt Samples. o$rnal of the
Transportation @esearch Board , 6R14.
OP *ST$ <</-1, Standard Specifications for oarse *ggregates.
O4P #. $asad, %. $. "1&&&'. Internal Structure
haracteri)ation of *sphalt oncrete MsingImage *nalysis. '@A # CD)'T1
1 C1=1 E1EE@1, 66/&4.
OKP #. $asad, A. ?. "$archD*pril --'.haracteri)ation of *ir Aoid (istribution in
*sphalt $ies using /ray omputedTomography. '@A # DATE@1AS 1
C1=1 E1EE@1, 1/1&.
O3P #yad $asad, $. #. "-1, ;anuary'.
haracteri)ation of the Internal Structure of *sphalt $itures. Transportation @esearch
Circ$lar, E-C!0!, pp. /1K.
O6P +.$. 5elelew, *. 8. "--6'. *pplication of (igital Image 8rocessing Techniques for *sphaltoncrete $iture Images. 1nternational
Association for Comp$ter Dethods and
Ad&ances in eomechanics 61ACDA, 11&/1.
<7( @E7>( E9F#7#9# E9 *88>I#( SI#9#S, #9I9##7I9 *9( T#+9E>EG
3/& S#8T#$%#7 -1
7/24/2019 Arsalaan Thesis Paper
http://slidepdf.com/reader/full/arsalaan-thesis-paper 7/7
*7S*>**9 ?+*9, 7*@I( ?+*9
O&P Image; Mser uide I; 1.Kr by Tiago Ferreiraand @ayne 7asband.
O1-P Iwama, $. "--&'. 1nfl$ence of Specimen Sie
and rientation on the Dechanical )roperties of
aboratory Compacted Asphalt Specimens
$8hill Thesis, Mniversity of 9ottingham.
F!!G 9orhidayah *. +assan, . (. "-1'.haracterisation of micro/structural damage inasphalt mitures using image analysis
Constr$ction and B$ilding Daterials, =ol$me
:", !: Darch 2!", )ages 27H3/
O1P8an, T. "--'. #ine Aggregate Characteriation
'sing %igital 1mage Analysis $S Thesis,
>ouisiana State Mniversity.
O1<PSteven +. N 8anarese, @. . "1&66'. %esign and
Control of Concrete Di<t$res, !3th edition 7etrieved from (epartment of ivil#ngineering0
<7( @E7>( E9F#7#9# E9 *88>I#( SI#9#S, #9I9##7I9 *9( T#+9E>EG
3/& S#8T#$%#7 -1