Embed Size (px)
Citation preview

Renewable energy powered membrane technology: Impact of pH and ionic
strength on fluoride and natural organic matter removal
Isaac Owusu-Agyeman a, Junjie Shen b,c1, Andrea Iris Schäfer a,b*
a Membrane Technology Department, Institute of Functional Interfaces (IFG), Karlsruhe Institute of
Technology (KIT), Hermann-von-Helmholtz-Platz 1, 76344 Eggenstein-Leopoldshafen, Germany.b Department of Water and Environmental Engineering, Nelson Mandela African Institute of Science and
Technology, Arusha, Tanzaniac School of Engineering and Physical Sciences, Heriot-Watt University, Edinburgh EH14 4AS, United Kingdom
*corresponding author: Andrea Iris Schäfer, +49 (0)721 6082 6906, [email protected]
1. Composition of the natural water
Other anions and cations of feed water were measured by an ion chromatograph (IC 790, Metrohm, Germany)
and inductively coupled plasma optical emission spectrometry (ICP-OES) spectrometer (Vista-PRO CCD
Simultaneous ICP-OES,Varian, The Netherlands) respectively. The results are shown in Table SI 1. The water
contained high concentration of Na+ and relatively low Ca2+, which makes the water a Na-HCO3 type, where the
Ca2+ concentration is restricted by CaCO3 precipitation, and therefore the amount of Ca2+ is not enough to bind
and precipitate F- (Rafique et al., 2015). In consequence the fluoride concentration in the water is high.
Table SI 1: Composition of the original feed water (analysis by the Engler Bunte Institute, KIT).
Element Concentration (mg/L) WHO guideline value (mg/L)
B3+ 0.69 2.4
Ca2+ 7.63 300 a
Fe2+ 0.74 0.3 a
K+ 165 -
Mg2+ 1.72 500 a
Na+ 968 200 a
Rb+ 0.38 -
Sr2+ 0.39 -
Cl- 89.1 300 a
SO42- 228.2 250 a
NO3- 2.0 50
a Not based on health effect but on acceptability (taste, odour and appearance) (World Health Organization, 2017)
2. Error estimation
Error was estimated for retention of water quality parameters including EC, F, TOC and IC by the membranes
from measurement uncertainty and system error. All of the uncertainties are converted into percentages before
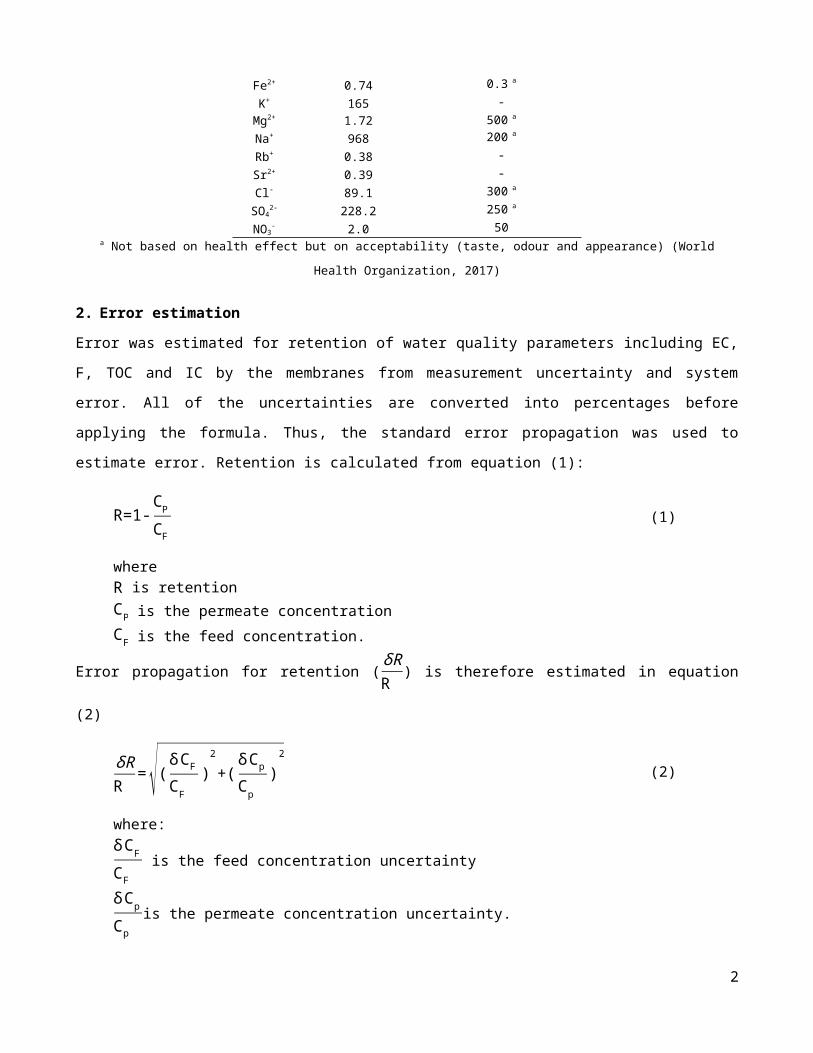
applying the formula. Thus, the standard error propagation was used to estimate error. Retention is calculated
from equation (1):
R=1-CP
CF (1)
whereR is retentionCP is the permeate concentrationCF is the feed concentration.
Error propagation for retention (δRR ) is therefore estimated in equation (2)
δRR
=√(δCF
CF)
2
+(δCp
Cp)
2
(2)
where:δ CF
CF is the feed concentration uncertainty
δ Cp
Cpis the permeate concentration uncertainty.
Taken into consideration the system error, the overall error (±∆RTot) was estimated as per equation (3)
±∆RTot = δRR + δS (3)
where:±∆RTot is the overall errorδ S is system error, estimated based on variation in temperature, pressure and flow as ±5%.
Uncertainties of measurement was estimated from measuring of standard solutions. Standards with low
concentration were used to estimate uncertainties for permeates while high concentration were used to estimate
for feed. Table SI 2 shows the error estimation of water quality parameters for permeate and feed
concentrations.
Table SI 2 : Measurement uncertainties for permeate and feed concentrations
Parameter Permeate Feed
EC 3% 2%IC 7% 5%UV254 3% 2%TOC 7% 5%F 4% 3%
2

Error estimation for fluoride retention δRF
RF for instance can hence be determined as
δRF
RF= √0.032 +0.042= 0.05
Overall fluoride retention uncertainty ±∆RTot is therefore ±∆RTot = 0.05+0.05 = 0.1.
For the estimation of the IC retention error in the pH experiments, a different method explained by Owusu-
Agyeman et al. (Owusu-Agyeman et al., 2017) was used due to degassing. Retention error was estimated from
as per equation (4)
δRR =
R1- R2
2√3 (4)
R1=1- Cp−∂cp
(CF +∆ CF¿+∂ cF ¿ (5)
R2=1- (Cp +∆ CF )+∂ cp
(CF +∆ CF ¿−∂ cF¿ (6)
Where:R1 is the highest possible retention; assuming that all the IC difference in feed concentration would have been rejected by the membrane and assuming that all the IC that degassed was retained. R2 is the lowest possible retention; assuming that all the IC difference in feed concentration would have permeated, while the lowest retention could not be negative because ∆ CF is the feed concentration.Cp is the measured permeate concentration, and CF is the measured feed concentration∆ CF is the difference feed concentration due to degassing ∂ cp is the permeate concentration uncertainty, and ∂ cF is the feed concentration uncertainty
3

3. Ultrafiltration pre-treatment
The results of the ultrafiltration stage are shown for each of the experiment type, pH and IS experiment.
3.1. Impact of pH on NOM removal by UF
Mean values of TOC and UV from the two pH experiments (NF270 and BW30) were taken to calculate
retention. The results are shown on Figure SI 1. Specific UV absorbance (SUVA) was calculated by dividing
the UV absorbance at 254 nm by the dissolved organic carbon (DOC) concentration. TOC, UV and SUVA
retention were low (<30%). The retention of TOC, UV and SUVA were below 20%, resulting in significant
error, while the UV retention more constant with pH. The results show that the UF membrane removed very
little NOM and there was no specific influence of pH.
Figure SI 1: (A) TOC concentration in feed and UF permeate (B) retention of TOC by the UF membrane (C) UV
absorbance at wavelength of 254 nm for Feed and UF-Permeate (D) retention of UV absorbance at wavelength of
254 nm (E) specific UV absorbance at wavelength of 254 nm for Feed and UF-Permeate (F) retention of SUVA
at wavelength of 254 nm by the UF membrane as a function of pH.
4

3.2. Impact of ionic strength on NOM removal by UF
Two experiments (NF270 and BW30) were used to calculate retention. TOC retention by UF appeared to
decrease with increasing salt concentration. The decreases in permeate TOC with IS can be attributed to the fact
that at low IS, charged membranes may have a larger electric double layer thickness (Braghetta et al., 1997).
NOM is mainly linear and negatively charged, while at high IS NOM assumes a curled shape (Ghosh and
Schnitzer, 1980). However, this trend was clearly within the high error at such a low retention. Equally, no
significant trend of IS on SUVA values was observed.
Figure SI 2: (A) TOC concentration in feed and UF permeate (B) retention of TOC by the UF membrane (C) UV
absorbance at wavelength of 254 nm for Feed and UF-Permeate (D) retention of UV absorbance at wavelength of
254 nm (E) specific UV absorbance at wavelength of 254 nm for Feed and UF-Permeate (F) retention of SUVA
at wavelength of 254 nm by the UF membrane as a function of TDS of feed water
5

4. pH experiments: Operating parameters
Permeate flux of the NF270 (Figure SI 3) is around 3.5 times higher than BW30 (Figure SI 4) operated at the
same TMP. The NF270 membrane module was operated at a high recovery of around 40%, while the BW30
recovery was 10%. The specific energy consumption (SEC) of the pH experiment with NF270 was low and
stable around 1 kWh/m³ at all pH range studied. However, for the BW30 membrane, the SEC of about 3 kWh/m³
was observed mainly due to the lower permeability.
Figure SI 3: Operating parameters as a function of pH for NF270 membrane (A) Array power from SAS, (B)
motor Power, (C) measured transmembrane pressure, (D) feed flow, (E) permeate flux, (F), recovery, (G) specific
energy consumption, (H) osmotic pressure difference
6

Figure SI 4: Operating parameters as a function of pH for BW30 membrane (A) Array power from SAS, (B)
motor Power, (C) measured transmembrane pressure, (D) feed flow, (E) permeate flux, (F), recovery, (G) specific
energy consumption, (H) osmotic pressure difference
7

5. Ionic strength experiment: Operating parameters
Due to the relatively low IS rejection, no change in TMP, permeate flux, feed flow and osomotic pressure
difference with increase in IS and hence constant SEC of 1kWh/m³ was observed for the NF270 (Figure SI 5). In
consequence, the osmotic pressure difference between permeate and bulk solution is low (1 bar) (Figure SI 5H).
Figure SI 5: Operating parameters as a function of IS for NF270 membrane (A) Array power from SAS, (B)
motor Power, (C) measured transmembrane pressure, (D) feed flow, (E) permeate flux, (F) recovery, (G) specific
energy consumption, (H) osmotic pressure difference
8

In the case of the BW30 membrane, the motor reaches its maximum capacity at around 5 g/L TDS ( Figure SI
6B) due to increase in osmotic pressure difference. At this point the pressure of the experiment was adjusted
manually to allow a permeate flow when the effective TMP (difference between TMP and osmotic pressure) was
reduced (Schäfer et al., 2004). Permeate flux of the BW30 starts to decrease as soon as maximum motor power is
reached and osmotic pressure increases due to higher salt concentration. Unlike the NF270, there was drop of
feed flow for the BW30 and therefore increase in recovery. SEC increased to maximum of 5.5 kWh/m³ at
maximum salt concentration due to the osmotic pressure increase (Richards et al., 2009).
Figure SI 6: Operating parameters as a function of IS for BW30 membrane (A) Array power from SAS, (B)
motor Power, (C) measured transmembrane pressure, (D) feed flow, (E) permeate flux, (F), recovery, (G) specific
energy consumption, (H) osmotic pressure difference.
9

6. References
Braghetta A, DiGiano FA, Ball WP. Nanofiltration of Natural Organic Matter: pH and Ionic Strength Effects. Journal of Environmental Engineering 1997; 123: 628-641.
Ghosh K, Schnitzer M. Macromolecular Structures of Humic Substances. Soil Science 1980; 129: 266-276.
Owusu-Agyeman I, Jeihanipour A, Luxbacher T, Schäfer AI. Implications of humic acid, inorganic carbon and speciation on fluoride retention mechanisms in nanofiltration and reverse osmosis. Journal of Membrane Science 2017; 528: 82-94.
Rafique T, Naseem S, Ozsvath D, Hussain R, Bhanger MI, Usmani TH. Geochemical controls of high Fluoride groundwater in Umarkot Sub-District, Thar Desert, Pakistan. Science of the Total Environment 2015; 530-531: 271-8.
Richards BS, Masson L, Schäfer AI. Impact of Feedwater Salinity on Energy Requirements of a Small-Scale Membrane Filtration System. In: Yanful EK, editor. Appropriate Technologies for Environmental Protection in the Developing World. Springer Netherlands, 2009, pp. pp 123-137.
Schäfer AI, Remy C, Richards BS. Performance of a small solar-powered hybrid membrane system for remote communities under varying feedwater salinities. Water Science and Technology: Water Supply 2004; 4: 233-243.
World Health Organization. Guidelines for drinking-water quality: fourth edition incorporating the first addendum, Geneva, 2017.
10