Embed Size (px)
Citation preview
The Quantitative Structure – Insecticidal Activity Relationships
from plant derived compounds against chikungunya and zika
Aedes aegypti (Diptera:Culicidae) vector
Laura M. Saavedra a,*, Gustavo P. Romanelli b, c, Ciro E. Rozo d, Pablo R. Duchowicz a,*
a Instituto de Investigaciones Fisicoquímicas Teóricas y Aplicadas (INIFTA). CONICET.
UNLP. Diag. 113 y 64. C.C. 16. Sucursal 4. 1900 La Plata. Argentina.b Centro de Investigación y Desarrollo en Ciencias Aplicadas “Dr. J.J. Ronco” (CINDECA).
Departamento de Química. Facultad de Ciencias Exactas. CONICET. UNLP. Calle 47 No.
257. B1900AJK La Plata. Argentinac Cátedra de Química Orgánica. Centro de Investigación en Sanidad Vegetal (CISaV). Facultad
de Ciencias Agrarias y Forestales. Universidad Nacional de La Plata. Calles 60 y 119 s/n.
B1904AAN La Plata. Argentinad Grupo de Investigaciones Ambientales para el Desarrollo Sostenible (GIADS). Universidad
Santo Tomas, seccional Bucaramanga. Carrera 18 No. 9-27. 680011 Bucaramanga. Colombia.
*Corresponding authors: Tel.: +54 221 425 7430. +54 221 425 7291; fax: +54 221 425 4642.
E-mail addresses: laurasaa0913@gmail .com (L.M.S.); [email protected] (P.R.D.)
(Total 26 pages including this cover page)
The Quantitative Structure – Insecticidal Activity Relationships from plant derived compounds against chikungunya and zika Aedes aegypti (Diptera:Culicidae) vector Supplementary material
Supplementary Material
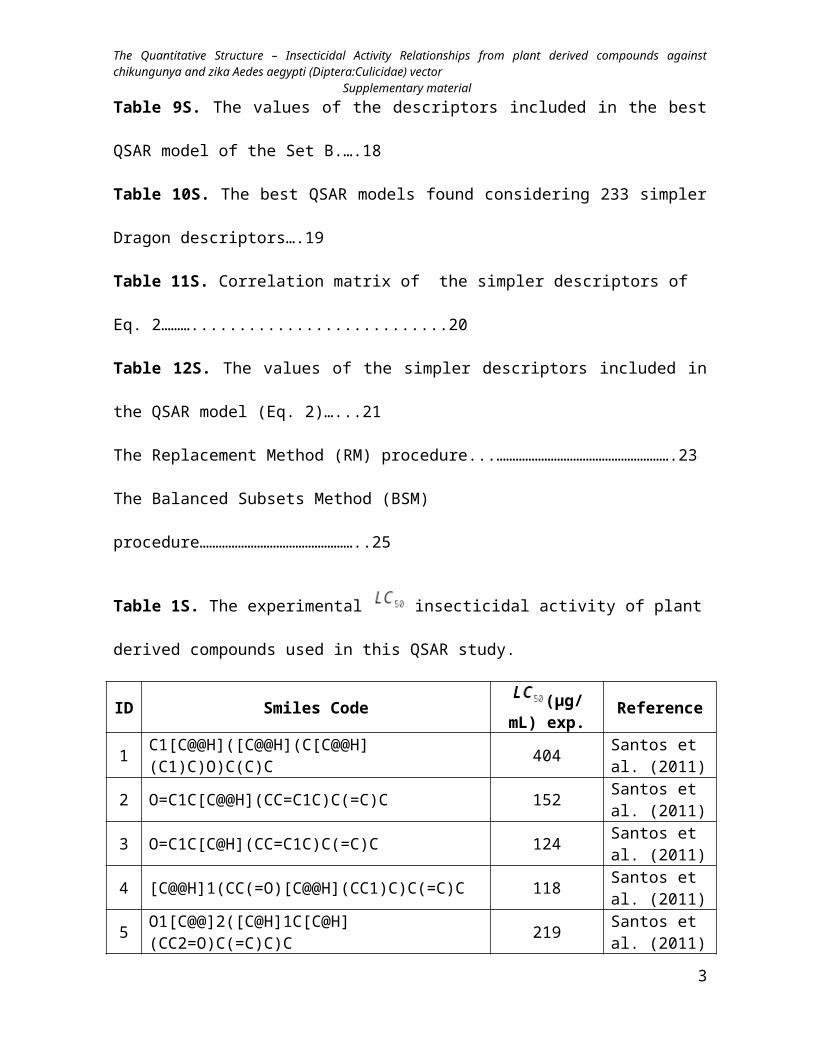
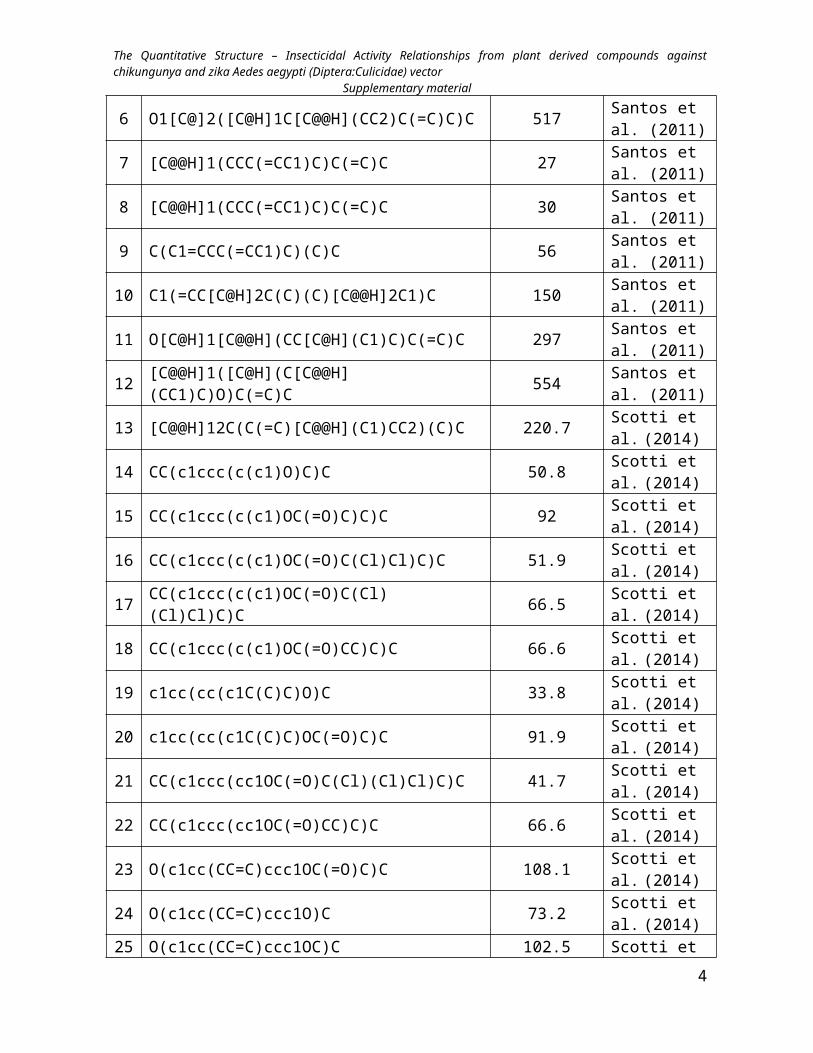
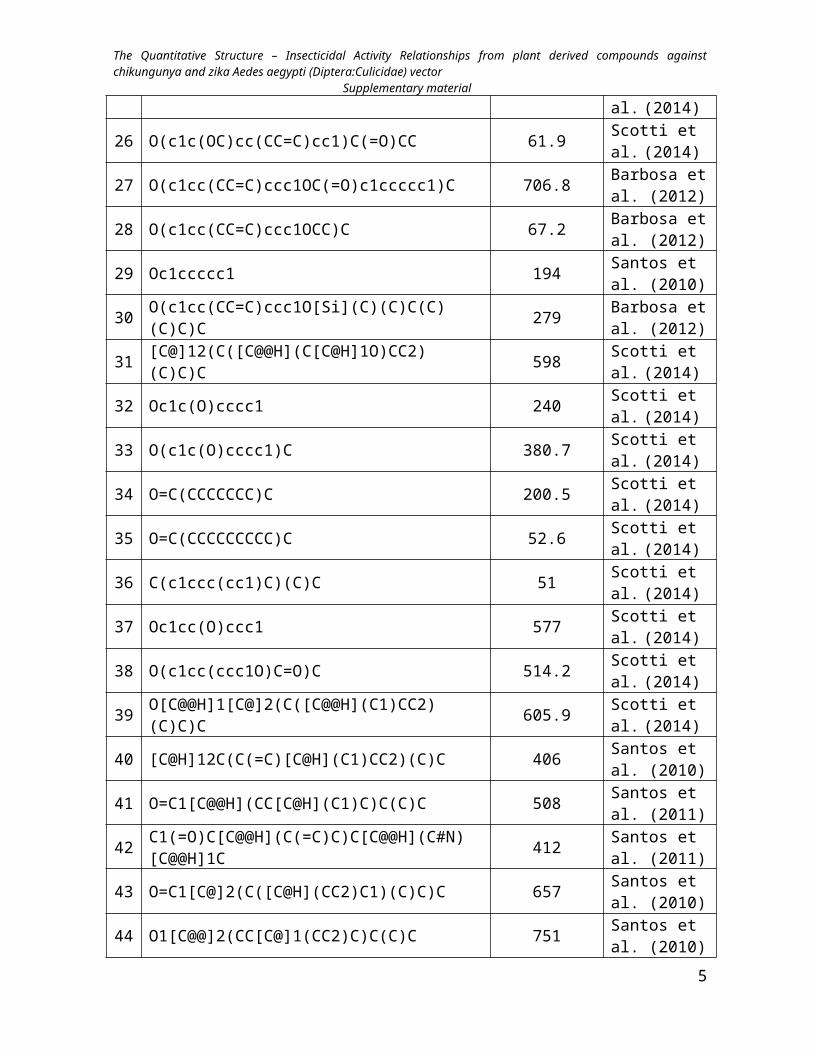
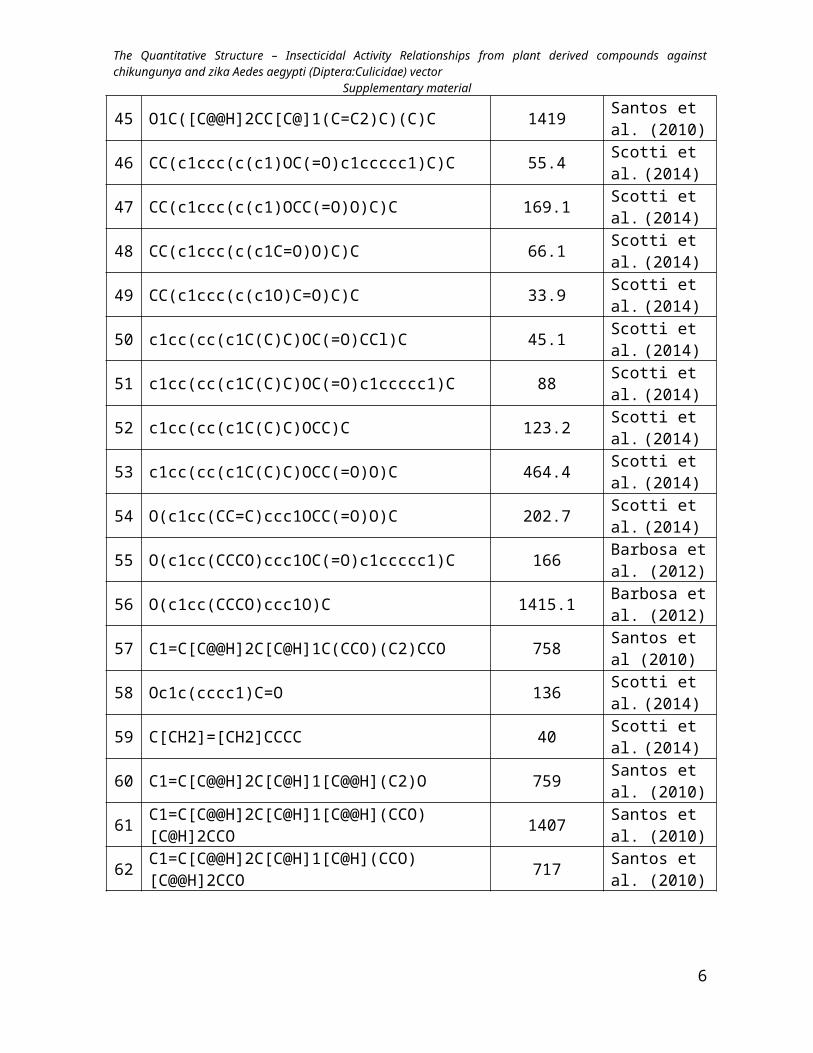
Table 1S. The experimental insecticidal activity of plant-derived compounds used in
this QSAR study…….…………………………………………………….………………….2
Table 2S. List of mathematical equations used in the present study……..………………….5
Table 3S. A brief description for different molecular descriptors.....................……………..7
Table 4S. Correlation matrix for the best QSAR model established………………………...9
Table 5S. The values of the descriptors included in the best QSAR model (Eq. 1)..............10
Table 6S. Experimental, predicted (Eq. 1) and residual values for the insecticidal
activity………………………………………………………………………………………12
Table 7S. The best QSAR models found considering all descriptors blocks for the ‘set A’
and ‘set B’…...…………………………….…………………………………………...……14
Figure 1S. A. Predicted and experimental values for the model with and the
set A. B. Dispersion plot of residuals……………………………………………………….15
Figure 2S. A. Predicted and experimental values for the model with and the
set B. B. Dispersion plot of residuals……………………………………………………….16
Table 8S. The values of the descriptors included in the best QSAR model of the Set A…..17
Table 9S. The values of the descriptors included in the best QSAR model of the Set B.….18
Table 10S. The best QSAR models found considering 233 simpler Dragon descriptors….19
Table 11S. Correlation matrix of the simpler descriptors of Eq. 2………...........................20
Table 12S. The values of the simpler descriptors included in the QSAR model (Eq. 2)…...21
The Replacement Method (RM) procedure...……………………………………………….23
The Balanced Subsets Method (BSM) procedure…………………………………………..25
1
The Quantitative Structure – Insecticidal Activity Relationships from plant derived compounds against chikungunya and zika Aedes aegypti (Diptera:Culicidae) vector Supplementary material
Table 1S. The experimental insecticidal activity of plant derived compounds used in
this QSAR study.
ID Smiles Code (µg/mL) exp.
Reference
1 C1[C@@H]([C@@H](C[C@@H](C1)C)O)C(C)C 404 Santos et al. (2011)
2 O=C1C[C@@H](CC=C1C)C(=C)C 152 Santos et al. (2011)
3 O=C1C[C@H](CC=C1C)C(=C)C 124 Santos et al. (2011)
4 [C@@H]1(CC(=O)[C@@H](CC1)C)C(=C)C 118 Santos et al. (2011)
5 O1[C@@]2([C@H]1C[C@H](CC2=O)C(=C)C)C 219 Santos et al. (2011)
6 O1[C@]2([C@H]1C[C@@H](CC2)C(=C)C)C 517 Santos et al. (2011)
7 [C@@H]1(CCC(=CC1)C)C(=C)C 27 Santos et al. (2011)
8 [C@@H]1(CCC(=CC1)C)C(=C)C 30 Santos et al. (2011)
9 C(C1=CCC(=CC1)C)(C)C 56 Santos et al. (2011)
10 C1(=CC[C@H]2C(C)(C)[C@@H]2C1)C 150 Santos et al. (2011)
11 O[C@H]1[C@@H](CC[C@H](C1)C)C(=C)C 297 Santos et al. (2011)
12 [C@@H]1([C@H](C[C@@H](CC1)C)O)C(=C)C 554 Santos et al. (2011)
13 [C@@H]12C(C(=C)[C@@H](C1)CC2)(C)C 220.7 Scotti et al. (2014)
14 CC(c1ccc(c(c1)O)C)C 50.8 Scotti et al. (2014)
15 CC(c1ccc(c(c1)OC(=O)C)C)C 92 Scotti et al. (2014)
16 CC(c1ccc(c(c1)OC(=O)C(Cl)Cl)C)C 51.9 Scotti et al. (2014)
17 CC(c1ccc(c(c1)OC(=O)C(Cl)(Cl)Cl)C)C 66.5 Scotti et al. (2014)
18 CC(c1ccc(c(c1)OC(=O)CC)C)C 66.6 Scotti et al. (2014)
19 c1cc(cc(c1C(C)C)O)C 33.8 Scotti et al. (2014)
20 c1cc(cc(c1C(C)C)OC(=O)C)C 91.9 Scotti et al.
2
The Quantitative Structure – Insecticidal Activity Relationships from plant derived compounds against chikungunya and zika Aedes aegypti (Diptera:Culicidae) vector Supplementary material
(2014)
21 CC(c1ccc(cc1OC(=O)C(Cl)(Cl)Cl)C)C 41.7 Scotti et al. (2014)
22 CC(c1ccc(cc1OC(=O)CC)C)C 66.6 Scotti et al. (2014)
23 O(c1cc(CC=C)ccc1OC(=O)C)C 108.1 Scotti et al. (2014)
24 O(c1cc(CC=C)ccc1O)C 73.2 Scotti et al. (2014)
25 O(c1cc(CC=C)ccc1OC)C 102.5 Scotti et al. (2014)
26 O(c1c(OC)cc(CC=C)cc1)C(=O)CC 61.9 Scotti et al. (2014)
27 O(c1cc(CC=C)ccc1OC(=O)c1ccccc1)C 706.8 Barbosa et al. (2012)
28 O(c1cc(CC=C)ccc1OCC)C 67.2 Barbosa et al. (2012)
29 Oc1ccccc1 194 Santos et al. (2010)
30 O(c1cc(CC=C)ccc1O[Si](C)(C)C(C)(C)C)C 279 Barbosa et al. (2012)
31 [C@]12(C([C@@H](C[C@H]1O)CC2)(C)C)C 598 Scotti et al. (2014)
32 Oc1c(O)cccc1 240 Scotti et al. (2014)
33 O(c1c(O)cccc1)C 380.7 Scotti et al. (2014)
34 O=C(CCCCCCC)C 200.5 Scotti et al. (2014)
35 O=C(CCCCCCCCC)C 52.6 Scotti et al. (2014)
36 C(c1ccc(cc1)C)(C)C 51 Scotti et al. (2014)
37 Oc1cc(O)ccc1 577 Scotti et al. (2014)
38 O(c1cc(ccc1O)C=O)C 514.2 Scotti et al. (2014)
39 O[C@@H]1[C@]2(C([C@@H](C1)CC2)(C)C)C 605.9 Scotti et al. (2014)
40 [C@H]12C(C(=C)[C@H](C1)CC2)(C)C 406 Santos et al. (2010)
41 O=C1[C@@H](CC[C@H](C1)C)C(C)C 508 Santos et al. (2011)
42 C1(=O)C[C@@H](C(=C)C)C[C@@H](C#N)[C@@H]1C 412 Santos et al.
(2011)43 O=C1[C@]2(C([C@H](CC2)C1)(C)C)C 657 Santos et al.
3
The Quantitative Structure – Insecticidal Activity Relationships from plant derived compounds against chikungunya and zika Aedes aegypti (Diptera:Culicidae) vector Supplementary material
(2010)
44 O1[C@@]2(CC[C@]1(CC2)C)C(C)C 751 Santos et al. (2010)
45 O1C([C@@H]2CC[C@]1(C=C2)C)(C)C 1419 Santos et al. (2010)
46 CC(c1ccc(c(c1)OC(=O)c1ccccc1)C)C 55.4 Scotti et al. (2014)
47 CC(c1ccc(c(c1)OCC(=O)O)C)C 169.1 Scotti et al. (2014)
48 CC(c1ccc(c(c1C=O)O)C)C 66.1 Scotti et al. (2014)
49 CC(c1ccc(c(c1O)C=O)C)C 33.9 Scotti et al. (2014)
50 c1cc(cc(c1C(C)C)OC(=O)CCl)C 45.1 Scotti et al. (2014)
51 c1cc(cc(c1C(C)C)OC(=O)c1ccccc1)C 88 Scotti et al. (2014)
52 c1cc(cc(c1C(C)C)OCC)C 123.2 Scotti et al. (2014)
53 c1cc(cc(c1C(C)C)OCC(=O)O)C 464.4 Scotti et al. (2014)
54 O(c1cc(CC=C)ccc1OCC(=O)O)C 202.7 Scotti et al. (2014)
55 O(c1cc(CCCO)ccc1OC(=O)c1ccccc1)C 166 Barbosa et al. (2012)
56 O(c1cc(CCCO)ccc1O)C 1415.1 Barbosa et al. (2012)
57 C1=C[C@@H]2C[C@H]1C(CCO)(C2)CCO 758 Santos et al (2010)
58 Oc1c(cccc1)C=O 136 Scotti et al. (2014)
59 C[CH2]=[CH2]CCCC 40 Scotti et al. (2014)
60 C1=C[C@@H]2C[C@H]1[C@@H](C2)O 759 Santos et al. (2010)
61 C1=C[C@@H]2C[C@H]1[C@@H](CCO)[C@H]2CCO 1407 Santos et al.
(2010)
62 C1=C[C@@H]2C[C@H]1[C@H](CCO)[C@@H]2CCO 717 Santos et al.
(2010)
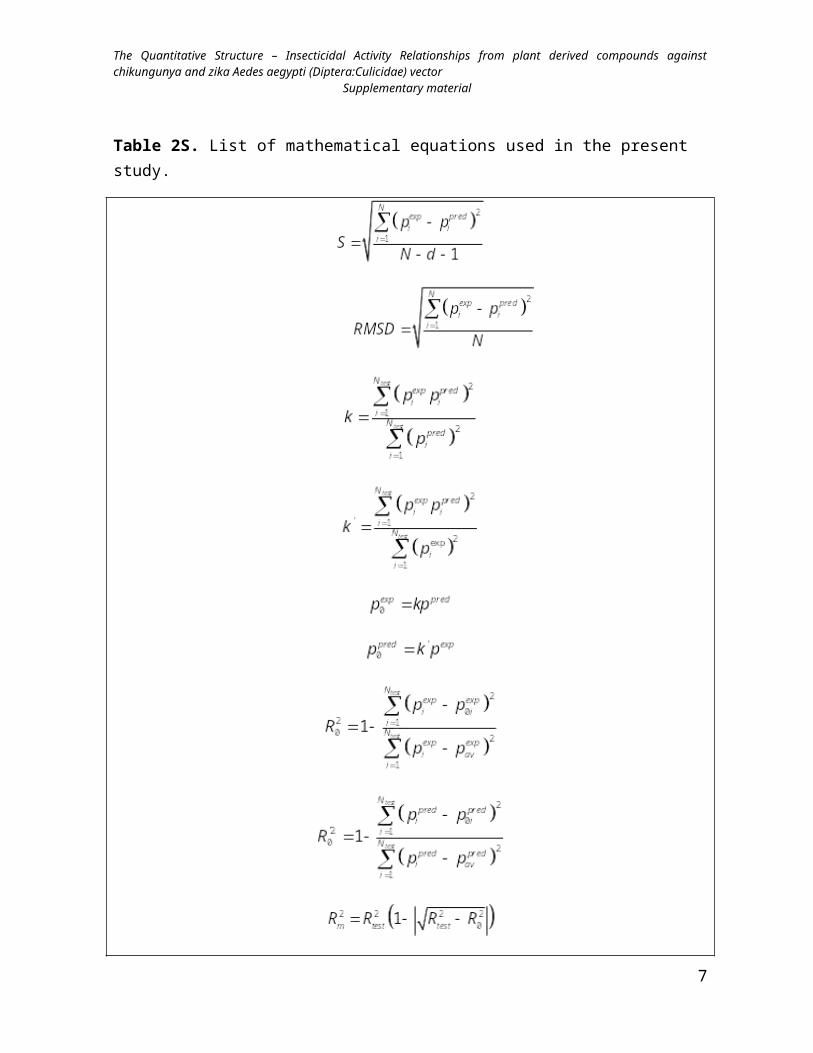
Table 2S. List of mathematical equations used in the present study.
4
The Quantitative Structure – Insecticidal Activity Relationships from plant derived compounds against chikungunya and zika Aedes aegypti (Diptera:Culicidae) vector Supplementary material
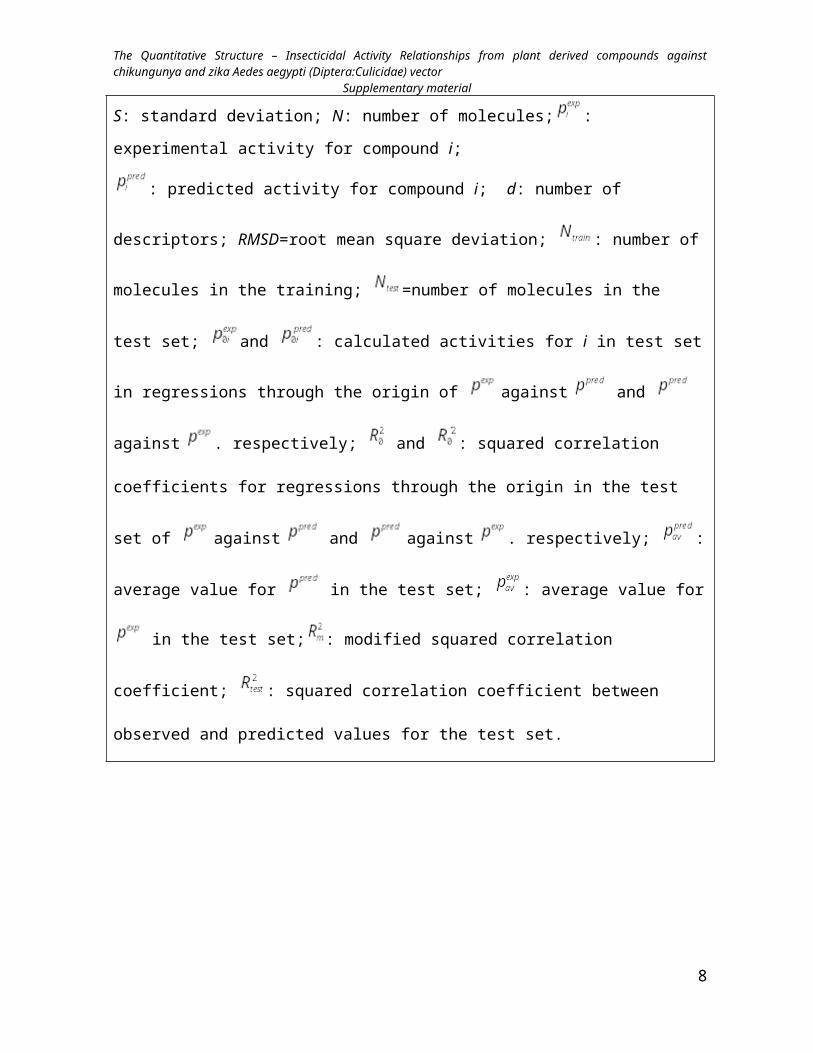
S: standard deviation; N: number of molecules; : experimental activity for compound i;
: predicted activity for compound i; d: number of descriptors; RMSD=root mean
5
The Quantitative Structure – Insecticidal Activity Relationships from plant derived compounds against chikungunya and zika Aedes aegypti (Diptera:Culicidae) vector Supplementary material
square deviation; : number of molecules in the training; =number of molecules in
the test set; and : calculated activities for i in test set in regressions through the
origin of against and against . respectively; and : squared
correlation coefficients for regressions through the origin in the test set of against
and against . respectively; : average value for in the test set; :
average value for in the test set; : modified squared correlation coefficient; :
squared correlation coefficient between observed and predicted values for the test set.
6
The Quantitative Structure – Insecticidal Activity Relationships from plant derived compounds against chikungunya and zika Aedes aegypti (Diptera:Culicidae) vector Supplementary material
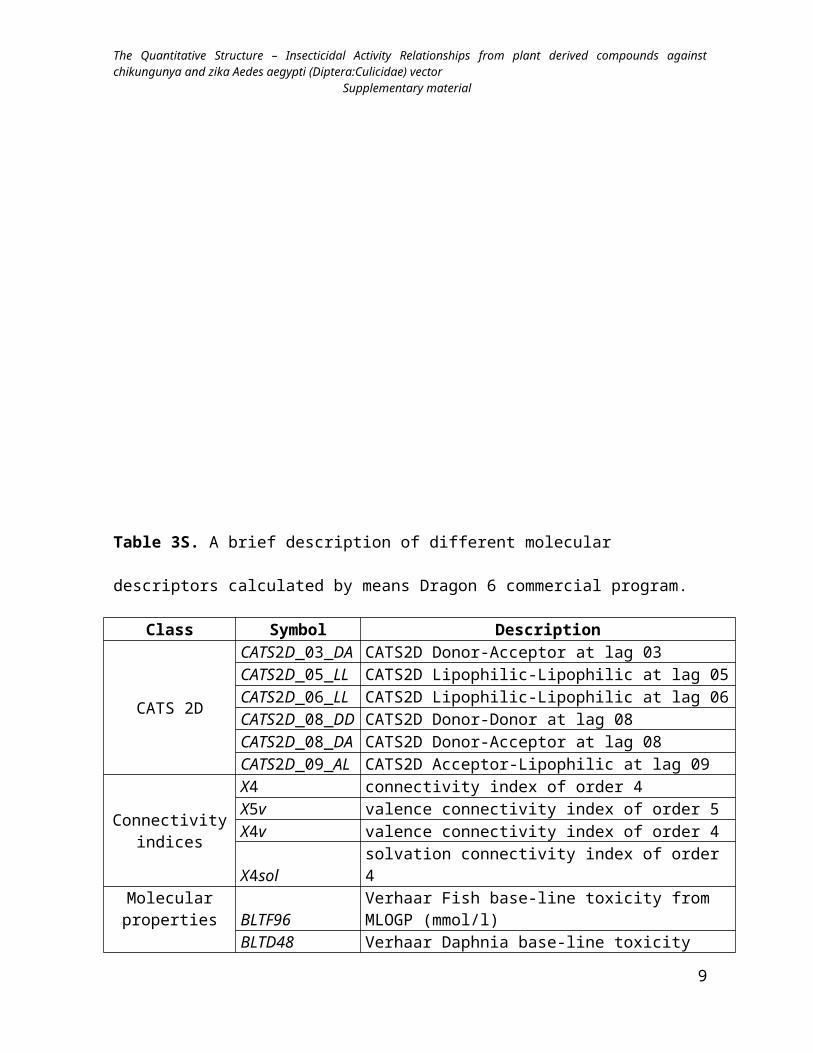
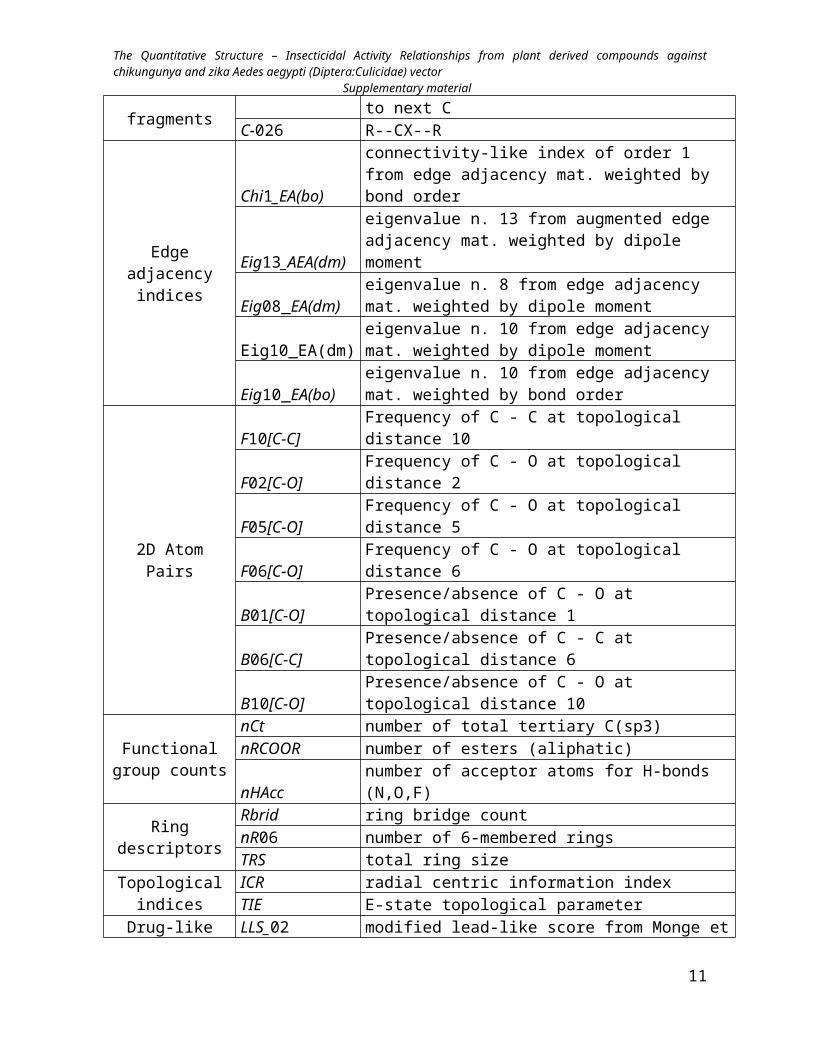
Table 3S. A brief description of different molecular descriptors calculated by means Dragon
6 commercial program.
Class Symbol Description
CATS 2D
CATS2D_03_DA CATS2D Donor-Acceptor at lag 03CATS2D_05_LL CATS2D Lipophilic-Lipophilic at lag 05CATS2D_06_LL CATS2D Lipophilic-Lipophilic at lag 06CATS2D_08_DD CATS2D Donor-Donor at lag 08CATS2D_08_DA CATS2D Donor-Acceptor at lag 08CATS2D_09_AL CATS2D Acceptor-Lipophilic at lag 09
Connectivity indices
X4 connectivity index of order 4X5v valence connectivity index of order 5X4v valence connectivity index of order 4X4sol solvation connectivity index of order 4
Molecular properties
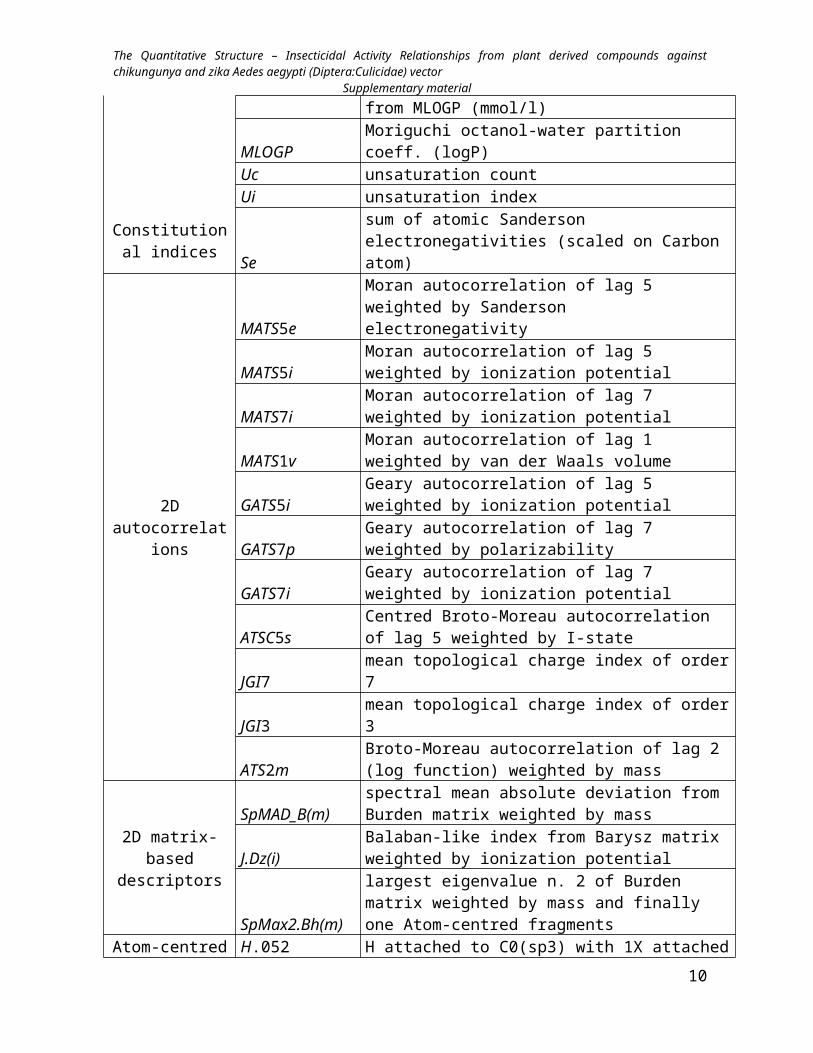
BLTF96 Verhaar Fish base-line toxicity from MLOGP (mmol/l)
BLTD48Verhaar Daphnia base-line toxicity from MLOGP (mmol/l)
MLOGP Moriguchi octanol-water partition coeff. (logP)Uc unsaturation countUi unsaturation index
Constitutional indices Se
sum of atomic Sanderson electronegativities (scaled on Carbon atom)
2D autocorrelations
MATS5eMoran autocorrelation of lag 5 weighted by Sanderson electronegativity
MATS5iMoran autocorrelation of lag 5 weighted by ionization potential
MATS7iMoran autocorrelation of lag 7 weighted by ionization potential
MATS1vMoran autocorrelation of lag 1 weighted by van der Waals volume
GATS5iGeary autocorrelation of lag 5 weighted by ionization potential
GATS7p Geary autocorrelation of lag 7 weighted by polarizability
GATS7iGeary autocorrelation of lag 7 weighted by ionization potential
ATSC5sCentred Broto-Moreau autocorrelation of lag 5 weighted by I-state
JGI7 mean topological charge index of order 7JGI3 mean topological charge index of order 3
ATS2mBroto-Moreau autocorrelation of lag 2 (log function) weighted by mass
2D matrix-based descriptors SpMAD_B(m)
spectral mean absolute deviation from Burden matrix weighted by mass
J.Dz(i) Balaban-like index from Barysz matrix weighted by
7
The Quantitative Structure – Insecticidal Activity Relationships from plant derived compounds against chikungunya and zika Aedes aegypti (Diptera:Culicidae) vector Supplementary material
ionization potential
SpMax2.Bh(m)largest eigenvalue n. 2 of Burden matrix weighted by mass and finally one Atom-centred fragments
Atom-centred fragments
H.052 H attached to C0(sp3) with 1X attached to next CC-026 R--CX--R
Edge adjacency indices
Chi1_EA(bo)connectivity-like index of order 1 from edge adjacency mat. weighted by bond order
Eig13_AEA(dm)eigenvalue n. 13 from augmented edge adjacency mat. weighted by dipole moment
Eig08_EA(dm)eigenvalue n. 8 from edge adjacency mat. weighted by dipole moment
Eig10_EA(dm)eigenvalue n. 10 from edge adjacency mat. weighted by dipole moment
Eig10_EA(bo)eigenvalue n. 10 from edge adjacency mat. weighted by bond order
2D Atom Pairs
F10[C-C] Frequency of C - C at topological distance 10F02[C-O] Frequency of C - O at topological distance 2F05[C-O] Frequency of C - O at topological distance 5F06[C-O] Frequency of C - O at topological distance 6B01[C-O] Presence/absence of C - O at topological distance 1B06[C-C] Presence/absence of C - C at topological distance 6B10[C-O] Presence/absence of C - O at topological distance 10
Functional group counts
nCt number of total tertiary C(sp3)nRCOOR number of esters (aliphatic)nHAcc number of acceptor atoms for H-bonds (N,O,F)
Ring descriptorsRbrid ring bridge countnR06 number of 6-membered ringsTRS total ring size
Topological indices
ICR radial centric information indexTIE E-state topological parameter
Drug-like indices LLS_02 modified lead-like score from Monge et al. (8 rules)
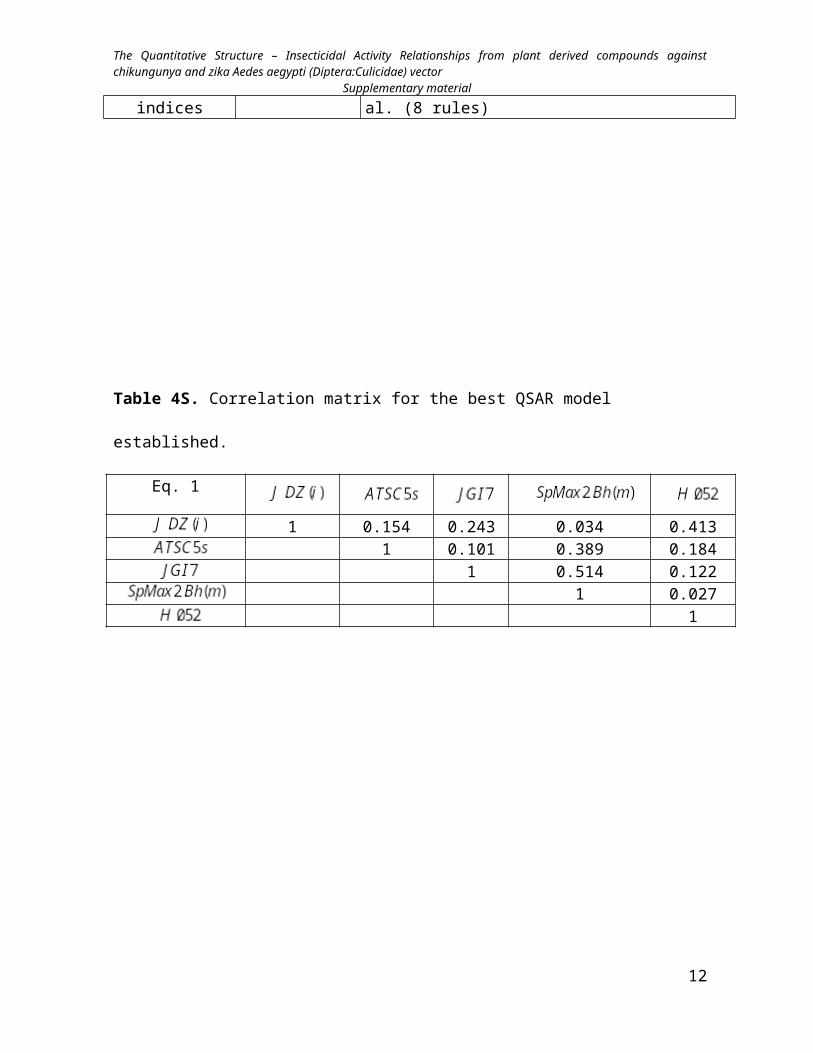
Table 4S. Correlation matrix for the best QSAR model established.
8
The Quantitative Structure – Insecticidal Activity Relationships from plant derived compounds against chikungunya and zika Aedes aegypti (Diptera:Culicidae) vector Supplementary material
Eq. 1
1 0.154 0.243 0.034 0.413 1 0.101 0.389 0.184
1 0.514 0.1221 0.027
1
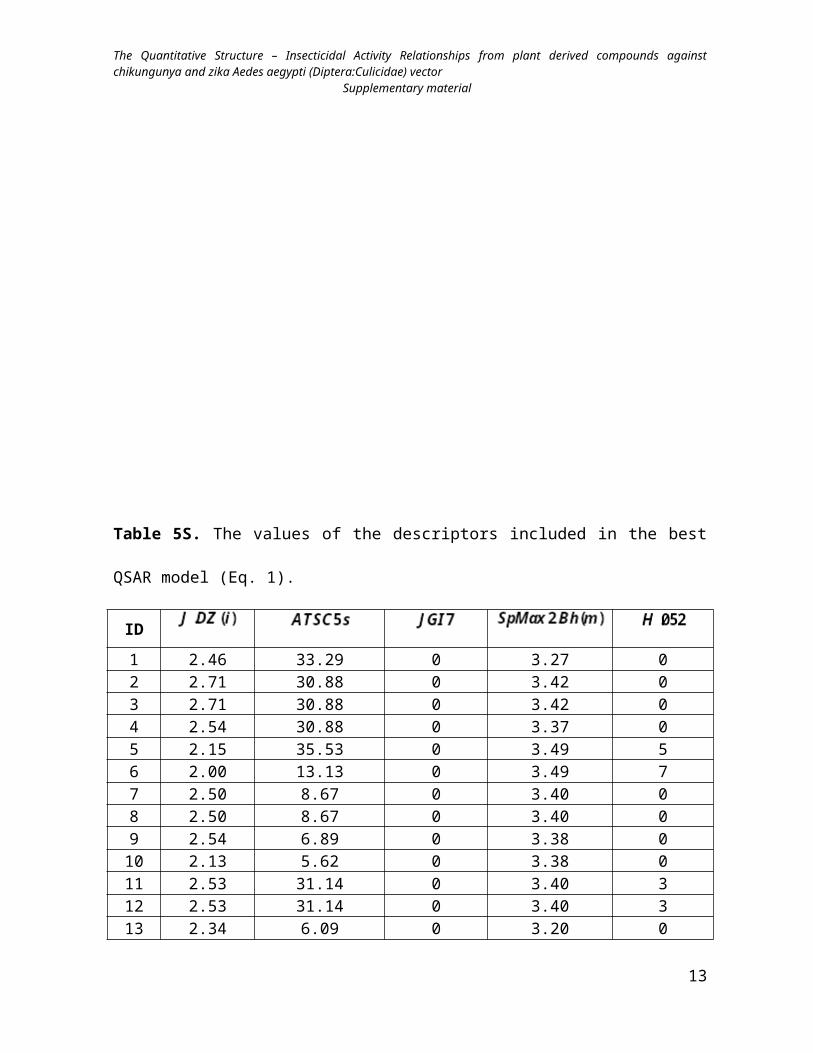
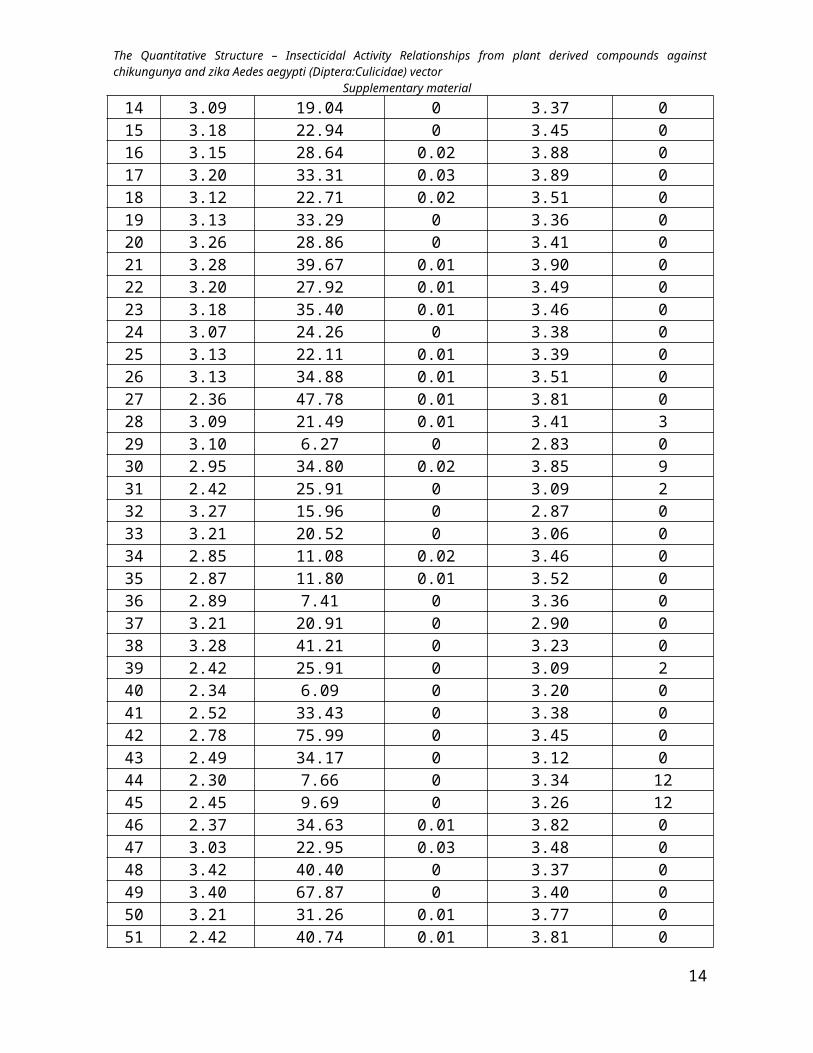
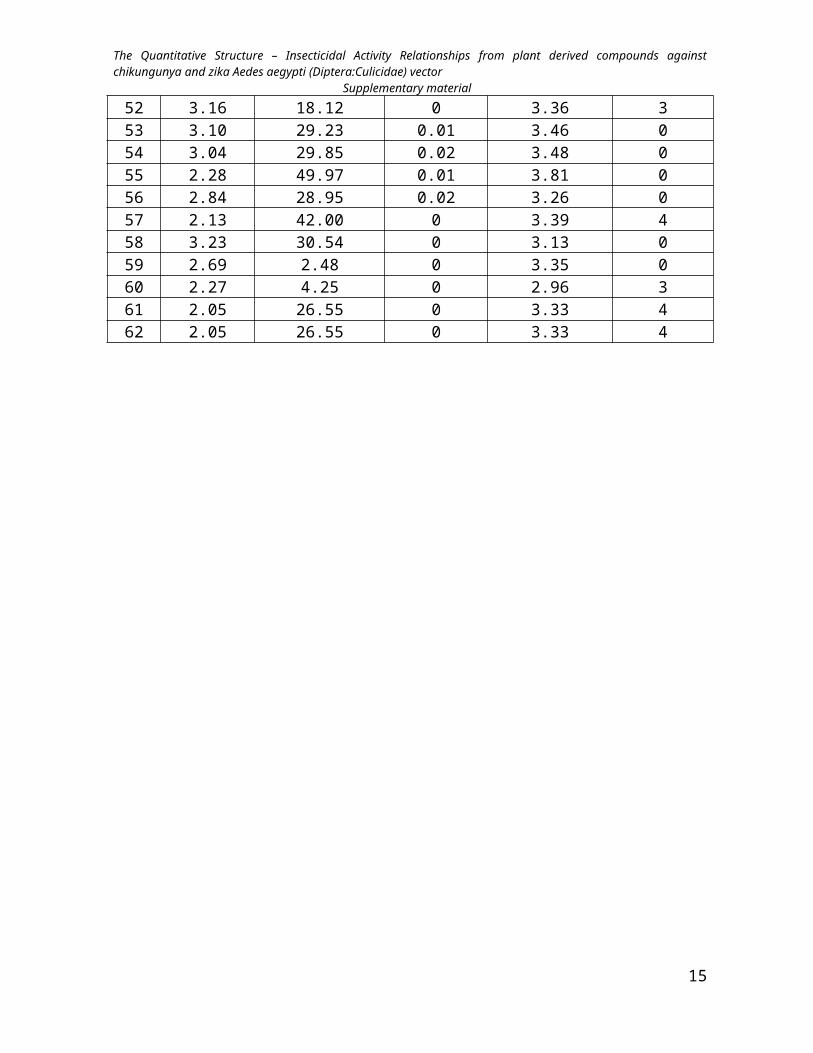
Table 5S. The values of the descriptors included in the best QSAR model (Eq. 1).
9
The Quantitative Structure – Insecticidal Activity Relationships from plant derived compounds against chikungunya and zika Aedes aegypti (Diptera:Culicidae) vector Supplementary material
ID
1 2.46 33.29 0 3.27 02 2.71 30.88 0 3.42 03 2.71 30.88 0 3.42 04 2.54 30.88 0 3.37 05 2.15 35.53 0 3.49 56 2.00 13.13 0 3.49 77 2.50 8.67 0 3.40 08 2.50 8.67 0 3.40 09 2.54 6.89 0 3.38 010 2.13 5.62 0 3.38 011 2.53 31.14 0 3.40 312 2.53 31.14 0 3.40 313 2.34 6.09 0 3.20 014 3.09 19.04 0 3.37 015 3.18 22.94 0 3.45 016 3.15 28.64 0.02 3.88 017 3.20 33.31 0.03 3.89 018 3.12 22.71 0.02 3.51 019 3.13 33.29 0 3.36 020 3.26 28.86 0 3.41 021 3.28 39.67 0.01 3.90 022 3.20 27.92 0.01 3.49 023 3.18 35.40 0.01 3.46 024 3.07 24.26 0 3.38 025 3.13 22.11 0.01 3.39 026 3.13 34.88 0.01 3.51 027 2.36 47.78 0.01 3.81 028 3.09 21.49 0.01 3.41 329 3.10 6.27 0 2.83 030 2.95 34.80 0.02 3.85 931 2.42 25.91 0 3.09 232 3.27 15.96 0 2.87 033 3.21 20.52 0 3.06 034 2.85 11.08 0.02 3.46 035 2.87 11.80 0.01 3.52 036 2.89 7.41 0 3.36 037 3.21 20.91 0 2.90 038 3.28 41.21 0 3.23 039 2.42 25.91 0 3.09 240 2.34 6.09 0 3.20 041 2.52 33.43 0 3.38 042 2.78 75.99 0 3.45 043 2.49 34.17 0 3.12 0
10
The Quantitative Structure – Insecticidal Activity Relationships from plant derived compounds against chikungunya and zika Aedes aegypti (Diptera:Culicidae) vector Supplementary material
44 2.30 7.66 0 3.34 1245 2.45 9.69 0 3.26 1246 2.37 34.63 0.01 3.82 047 3.03 22.95 0.03 3.48 048 3.42 40.40 0 3.37 049 3.40 67.87 0 3.40 050 3.21 31.26 0.01 3.77 051 2.42 40.74 0.01 3.81 052 3.16 18.12 0 3.36 353 3.10 29.23 0.01 3.46 054 3.04 29.85 0.02 3.48 055 2.28 49.97 0.01 3.81 056 2.84 28.95 0.02 3.26 057 2.13 42.00 0 3.39 458 3.23 30.54 0 3.13 059 2.69 2.48 0 3.35 060 2.27 4.25 0 2.96 361 2.05 26.55 0 3.33 462 2.05 26.55 0 3.33 4
11
The Quantitative Structure – Insecticidal Activity Relationships from plant derived compounds against chikungunya and zika Aedes aegypti (Diptera:Culicidae) vector Supplementary material
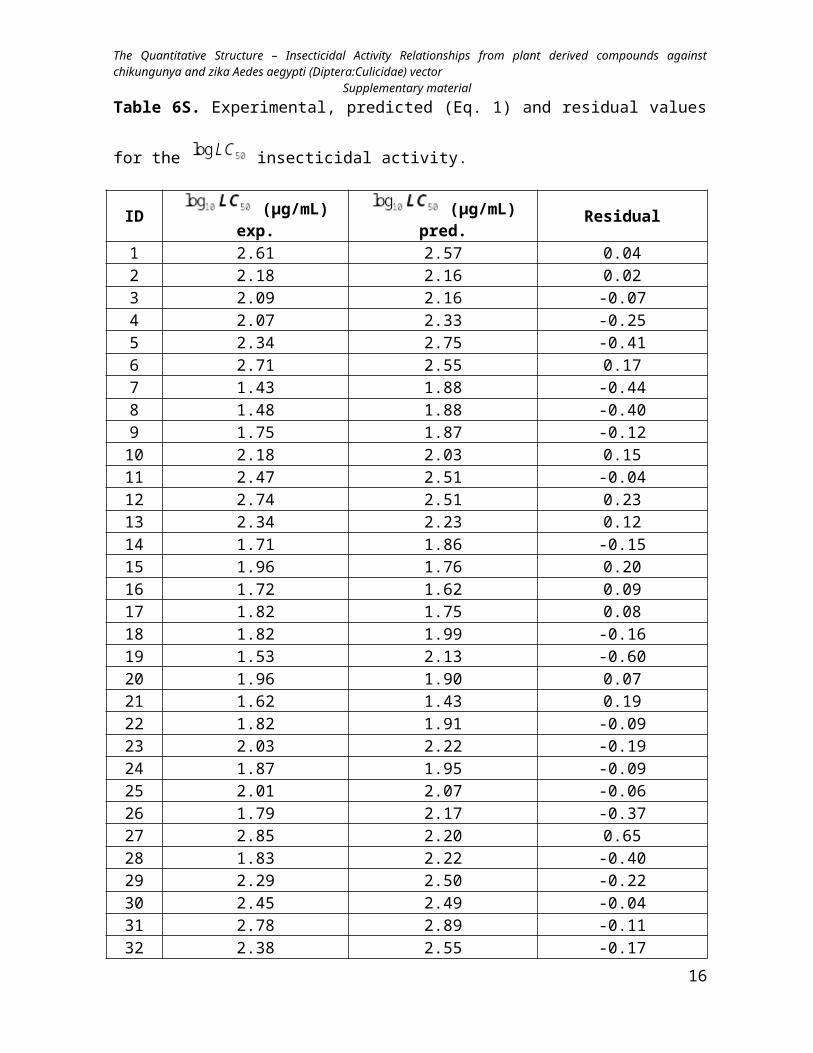
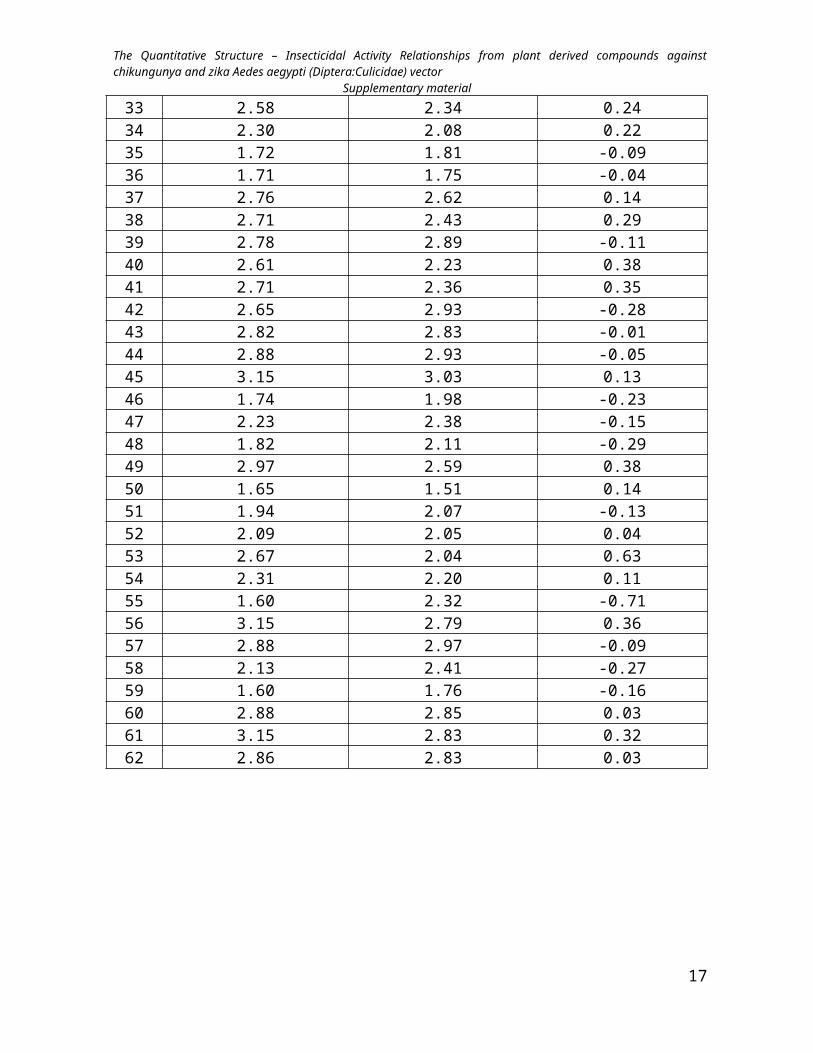
Table 6S. Experimental, predicted (Eq. 1) and residual values for the insecticidal
activity.
ID (µg/mL) exp. (µg/mL) pred. Residual1 2.61 2.57 0.042 2.18 2.16 0.023 2.09 2.16 -0.074 2.07 2.33 -0.255 2.34 2.75 -0.416 2.71 2.55 0.177 1.43 1.88 -0.448 1.48 1.88 -0.409 1.75 1.87 -0.1210 2.18 2.03 0.1511 2.47 2.51 -0.0412 2.74 2.51 0.2313 2.34 2.23 0.1214 1.71 1.86 -0.1515 1.96 1.76 0.2016 1.72 1.62 0.0917 1.82 1.75 0.0818 1.82 1.99 -0.1619 1.53 2.13 -0.6020 1.96 1.90 0.0721 1.62 1.43 0.1922 1.82 1.91 -0.0923 2.03 2.22 -0.1924 1.87 1.95 -0.0925 2.01 2.07 -0.0626 1.79 2.17 -0.3727 2.85 2.20 0.6528 1.83 2.22 -0.4029 2.29 2.50 -0.2230 2.45 2.49 -0.0431 2.78 2.89 -0.1132 2.38 2.55 -0.1733 2.58 2.34 0.2434 2.30 2.08 0.2235 1.72 1.81 -0.0936 1.71 1.75 -0.0437 2.76 2.62 0.1438 2.71 2.43 0.29
12
The Quantitative Structure – Insecticidal Activity Relationships from plant derived compounds against chikungunya and zika Aedes aegypti (Diptera:Culicidae) vector Supplementary material
39 2.78 2.89 -0.1140 2.61 2.23 0.3841 2.71 2.36 0.3542 2.65 2.93 -0.2843 2.82 2.83 -0.0144 2.88 2.93 -0.0545 3.15 3.03 0.1346 1.74 1.98 -0.2347 2.23 2.38 -0.1548 1.82 2.11 -0.2949 2.97 2.59 0.3850 1.65 1.51 0.1451 1.94 2.07 -0.1352 2.09 2.05 0.0453 2.67 2.04 0.6354 2.31 2.20 0.1155 1.60 2.32 -0.7156 3.15 2.79 0.3657 2.88 2.97 -0.0958 2.13 2.41 -0.2759 1.60 1.76 -0.1660 2.88 2.85 0.0361 3.15 2.83 0.3262 2.86 2.83 0.03
13
The Quantitative Structure – Insecticidal Activity Relationships from plant derived compounds against chikungunya and zika Aedes aegypti (Diptera:Culicidae) vector Supplementary material
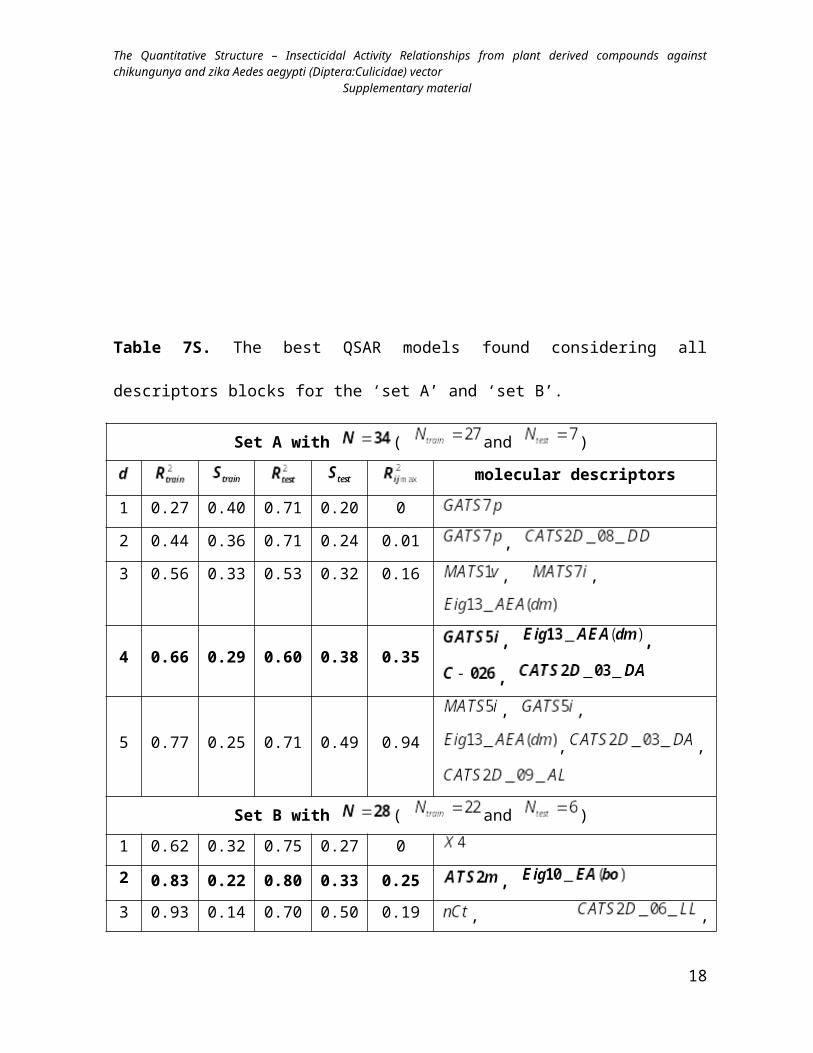
Table 7S. The best QSAR models found considering all descriptors blocks for the ‘set A’
and ‘set B’.
Set A with ( and )
molecular descriptors
1 0.27 0.40 0.71 0.20 0
2 0.44 0.36 0.71 0.24 0.01 ,
3 0.56 0.33 0.53 0.32 0.16 , ,
4 0.66 0.29 0.60 0.38 0.35, , ,
5 0.77 0.25 0.71 0.49 0.94, , ,
,
Set B with ( and )
1 0.62 0.32 0.75 0.27 0
2 0.83 0.22 0.80 0.33 0.25 ,
3 0.93 0.14 0.70 0.50 0.19 , ,
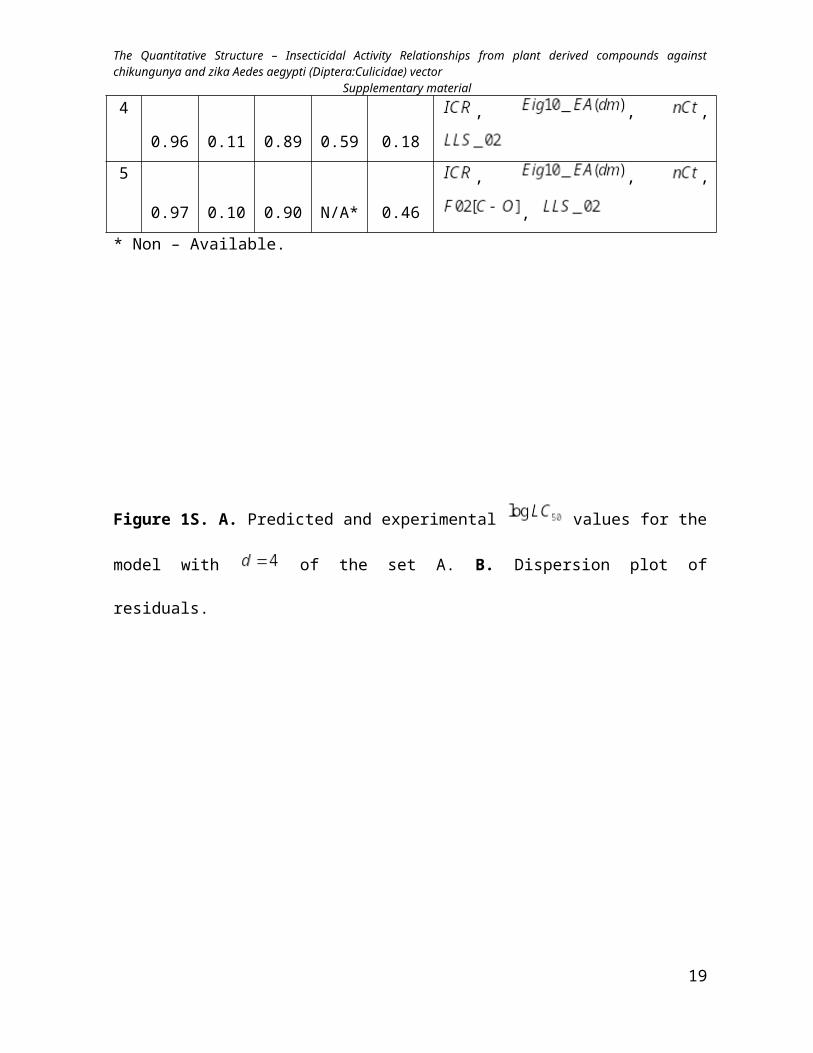
4 0.96 0.11 0.89 0.59 0.18 , , ,
5
0.97 0.10 0.90 N/A* 0.46
, , ,
,
* Non – Available.
14
The Quantitative Structure – Insecticidal Activity Relationships from plant derived compounds against chikungunya and zika Aedes aegypti (Diptera:Culicidae) vector Supplementary material
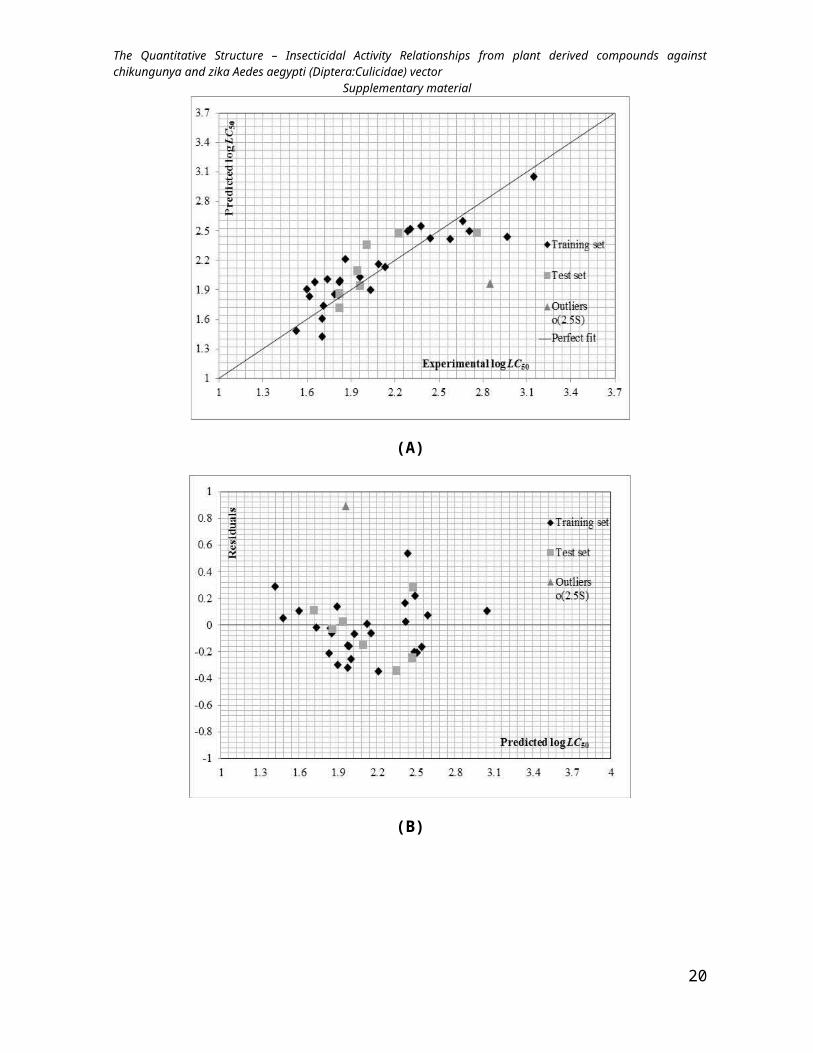
Figure 1S. A. Predicted and experimental values for the model with of the
set A. B. Dispersion plot of residuals.
(A)
(B)
15
The Quantitative Structure – Insecticidal Activity Relationships from plant derived compounds against chikungunya and zika Aedes aegypti (Diptera:Culicidae) vector Supplementary material
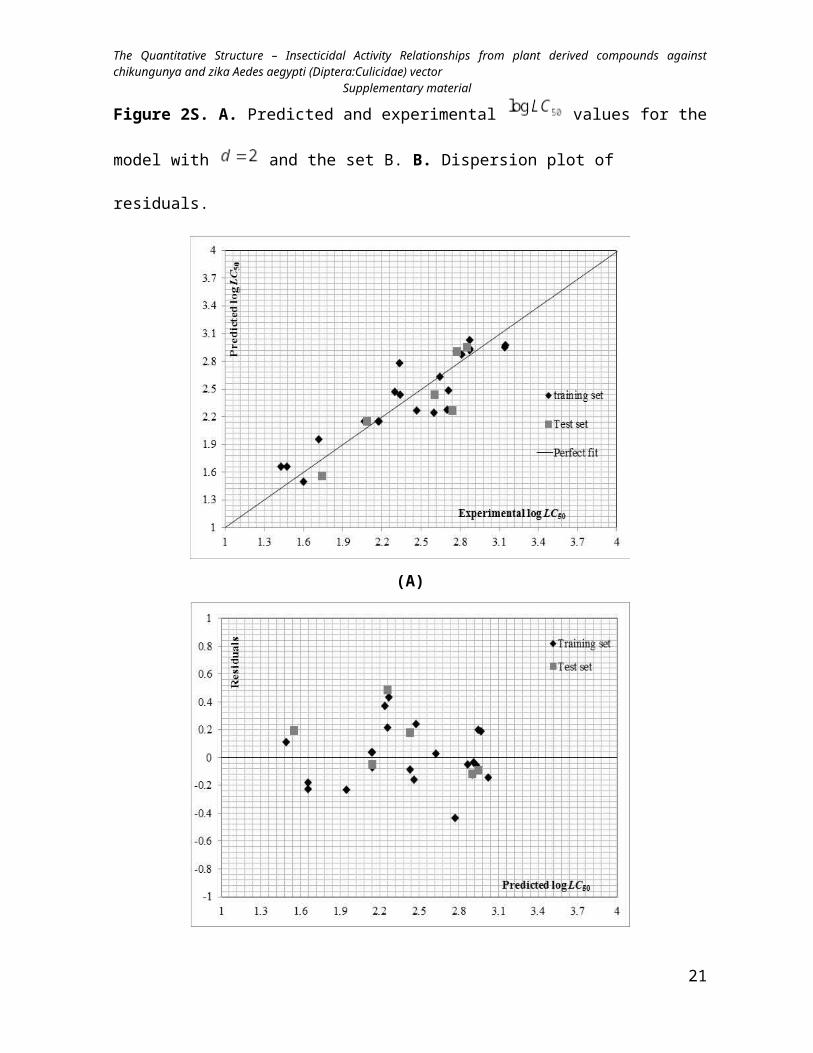
Figure 2S. A. Predicted and experimental values for the model with and the
set B. B. Dispersion plot of residuals.
(A)
(B)
16
The Quantitative Structure – Insecticidal Activity Relationships from plant derived compounds against chikungunya and zika Aedes aegypti (Diptera:Culicidae) vector Supplementary material
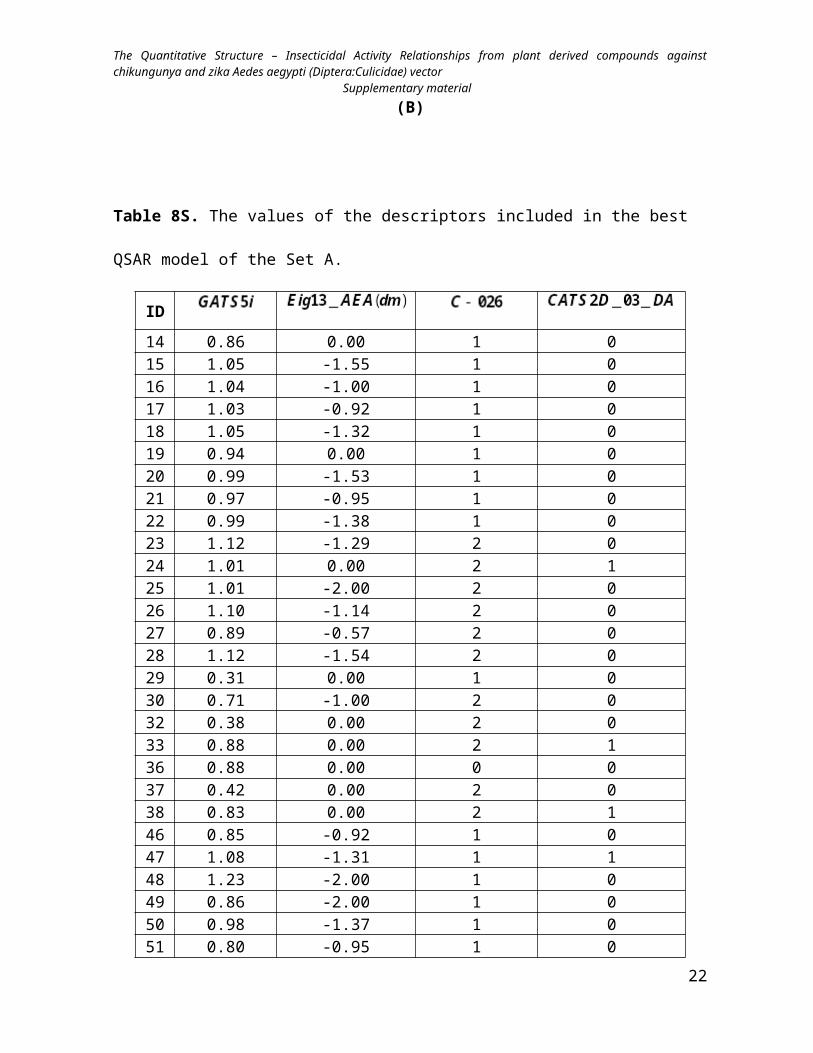
Table 8S. The values of the descriptors included in the best QSAR model of the Set A.
ID
14 0.86 0.00 1 015 1.05 -1.55 1 016 1.04 -1.00 1 017 1.03 -0.92 1 018 1.05 -1.32 1 019 0.94 0.00 1 020 0.99 -1.53 1 021 0.97 -0.95 1 022 0.99 -1.38 1 023 1.12 -1.29 2 024 1.01 0.00 2 125 1.01 -2.00 2 026 1.10 -1.14 2 027 0.89 -0.57 2 028 1.12 -1.54 2 029 0.31 0.00 1 030 0.71 -1.00 2 032 0.38 0.00 2 033 0.88 0.00 2 136 0.88 0.00 0 037 0.42 0.00 2 038 0.83 0.00 2 146 0.85 -0.92 1 047 1.08 -1.31 1 148 1.23 -2.00 1 049 0.86 -2.00 1 050 0.98 -1.37 1 051 0.80 -0.95 1 052 1.03 -2.00 1 053 1.02 -1.37 1 154 1.11 -1.12 2 155 0.88 -0.40 2 056 1.00 -2.00 2 158 0.54 0.00 1 0
17
The Quantitative Structure – Insecticidal Activity Relationships from plant derived compounds against chikungunya and zika Aedes aegypti (Diptera:Culicidae) vector Supplementary material
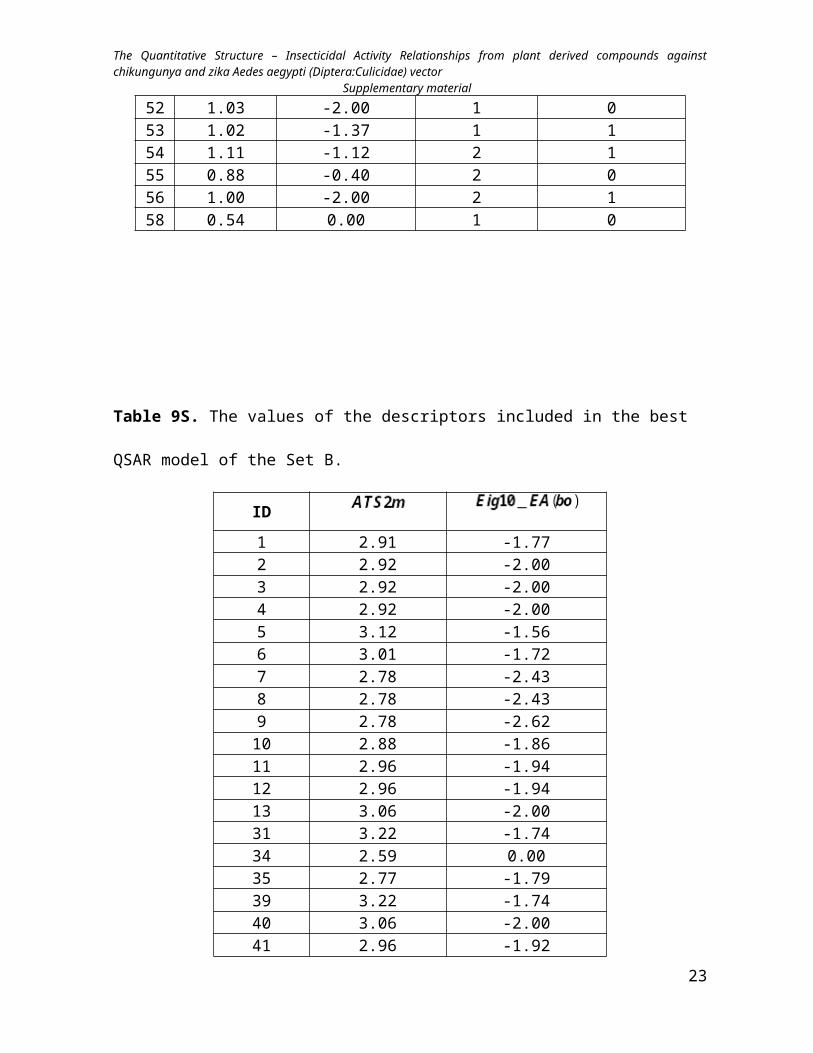
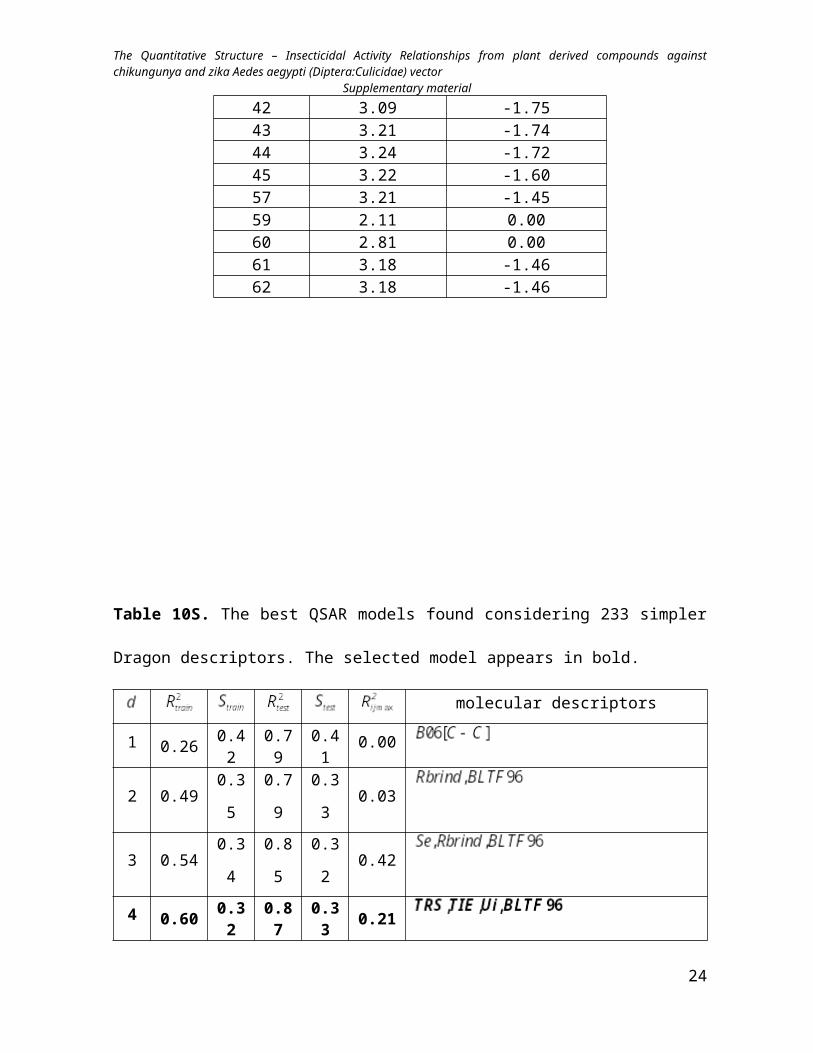
Table 9S. The values of the descriptors included in the best QSAR model of the Set B.
ID
1 2.91 -1.772 2.92 -2.003 2.92 -2.004 2.92 -2.005 3.12 -1.566 3.01 -1.727 2.78 -2.438 2.78 -2.439 2.78 -2.6210 2.88 -1.8611 2.96 -1.9412 2.96 -1.9413 3.06 -2.0031 3.22 -1.7434 2.59 0.0035 2.77 -1.7939 3.22 -1.7440 3.06 -2.0041 2.96 -1.9242 3.09 -1.7543 3.21 -1.7444 3.24 -1.7245 3.22 -1.6057 3.21 -1.4559 2.11 0.0060 2.81 0.0061 3.18 -1.4662 3.18 -1.46
18
The Quantitative Structure – Insecticidal Activity Relationships from plant derived compounds against chikungunya and zika Aedes aegypti (Diptera:Culicidae) vector Supplementary material
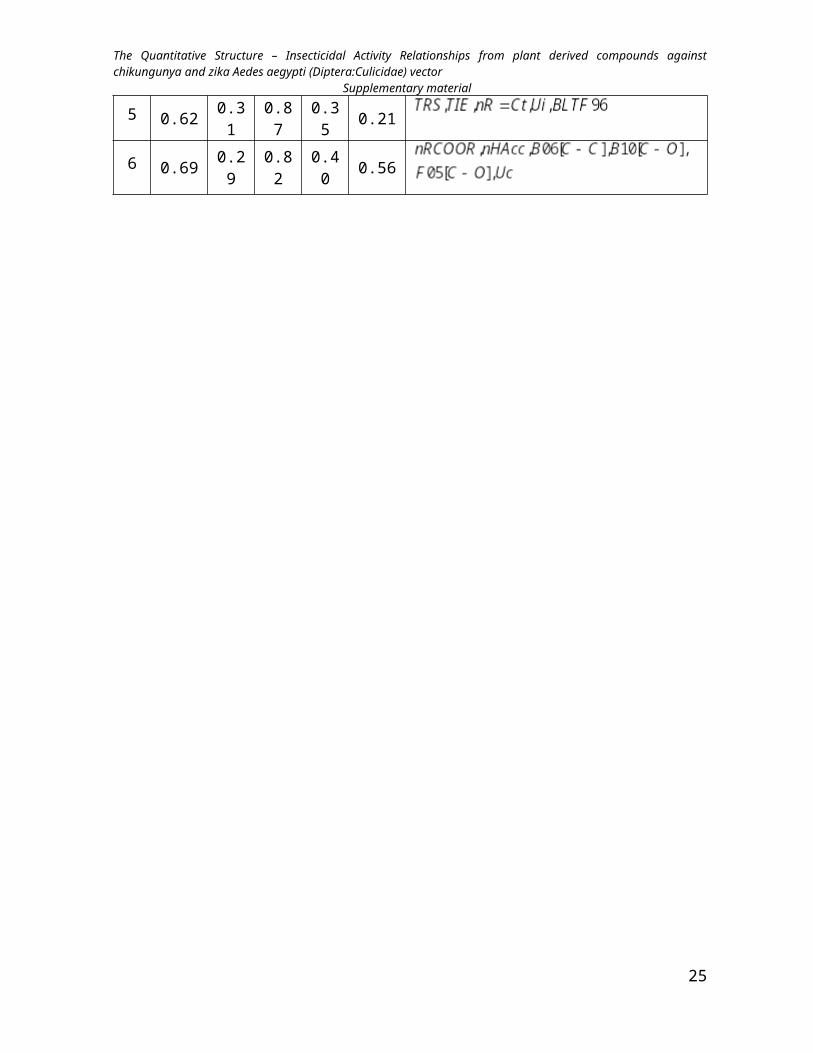
Table 10S. The best QSAR models found considering 233 simpler Dragon descriptors. The
selected model appears in bold.
molecular descriptors
1 0.26 0.42 0.79 0.41 0.00
2 0.49 0.35 0.79 0.33 0.03
3 0.54 0.34 0.85 0.32 0.42
4 0.60 0.32 0.87 0.33 0.21
5 0.62 0.31 0.87 0.35 0.21
6 0.69 0.29 0.82 0.40 0.56
19
The Quantitative Structure – Insecticidal Activity Relationships from plant derived compounds against chikungunya and zika Aedes aegypti (Diptera:Culicidae) vector Supplementary material
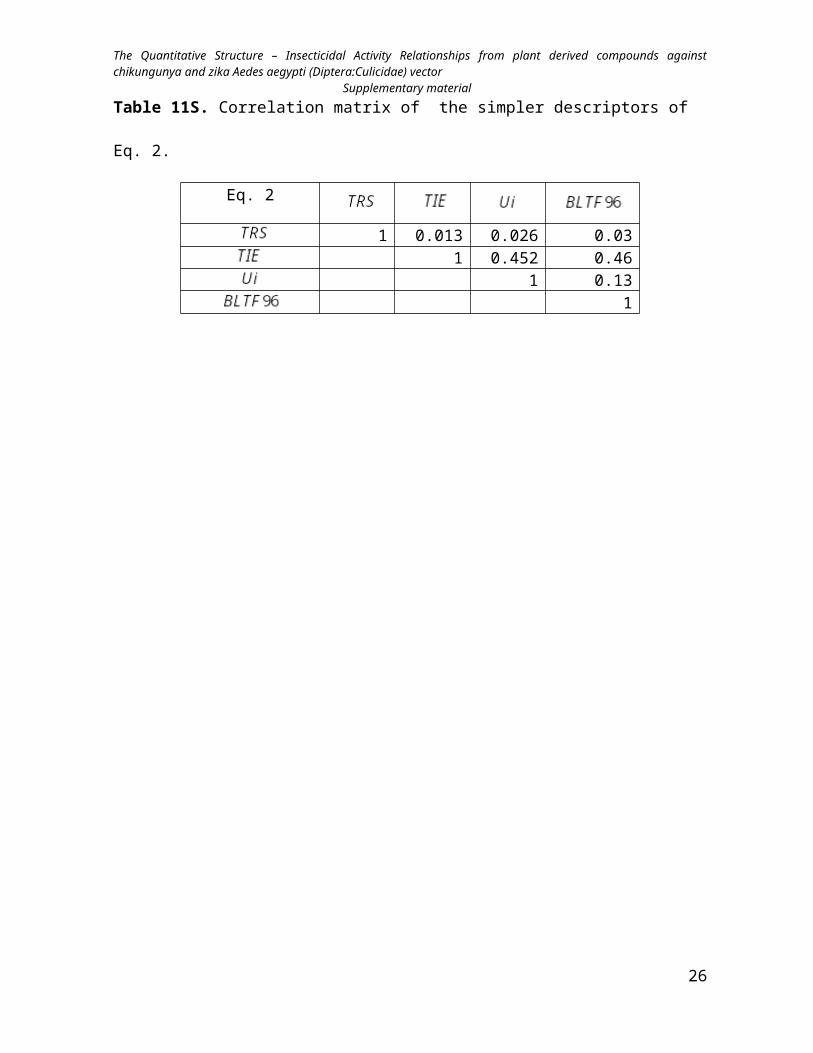
Table 11S. Correlation matrix of the simpler descriptors of Eq. 2.
Eq. 2
1 0.013 0.026 0.031 0.452 0.46
1 0.131
20
The Quantitative Structure – Insecticidal Activity Relationships from plant derived compounds against chikungunya and zika Aedes aegypti (Diptera:Culicidae) vector Supplementary material
Table 12S. The values of the simpler descriptor included in the QSAR model (Eq. 2).
ID TRS TIE Ui BLTF961 6 59.99 1.43 1.732 6 59.99 1.428 1.653 6 59.99 1.428 1.654 6 59.99 1.428 1.655 9 92.19 1.461 1.376 9 80.43 1.426 1.337 6 50.00 1.389 1.608 6 50.00 1.389 1.609 6 50.00 1.389 1.6010 9 72.00 1.395 1.6311 6 59.99 1.43 1.7312 6 59.99 1.43 1.7313 10 72.00 1.404 2.1314 6 59.99 1.428 1.6515 6 77.98 1.513 1.4216 6 113.42 1.555 1.3117 6 140.00 1.573 1.3118 6 83.65 1.534 1.3419 6 59.99 1.43 1.7320 6 77.98 1.516 1.5321 6 140.00 1.576 1.4022 6 83.65 1.538 1.4423 6 83.08 1.533 1.3024 6 65.09 1.458 1.4525 6 71.09 1.487 1.4126 6 88.75 1.553 1.2427 12 118.41 1.618 0.8128 6 75.42 1.511 1.3329 6 32.66 1.241 2.0230 6 146.76 1.607 1.2831 10 87.33 1.443 2.2932 6 43.10 1.305 2.0933 6 49.09 1.354 1.8934 0 35.33 1.373 1.4935 0 43.33 1.439 1.3136 6 50.00 1.389 1.6037 6 41.32 1.303 1.9538 6 62.42 1.43 1.6339 10 87.33 1.443 2.2940 10 72.00 1.404 2.13
21
The Quantitative Structure – Insecticidal Activity Relationships from plant derived compounds against chikungunya and zika Aedes aegypti (Diptera:Culicidae) vector Supplementary material
41 6 59.99 1.43 1.7342 6 73.66 1.492 1.6543 10 87.33 1.443 2.2944 10 83.32 1.436 1.8345 12 80.65 1.438 1.8446 12 113.31 1.604 0.8647 6 83.87 1.532 1.2748 6 75.65 1.494 1.7849 6 75.65 1.493 1.7450 6 92.75 1.538 1.4451 12 113.31 1.607 0.9152 6 70.32 1.491 1.5853 6 83.87 1.536 1.3654 6 88.97 1.552 1.1955 12 123.41 1.632 0.7756 6 70.09 1.483 1.2957 10 83.99 1.492 1.4058 6 47.32 1.354 1.8959 0 20.00 1.222 1.7360 10 53.99 1.309 2.2261 10 80.99 1.49 1.2762 10 80.99 1.49 1.27
The Replacement Method (RM) procedure
22
The Quantitative Structure – Insecticidal Activity Relationships from plant derived compounds against chikungunya and zika Aedes aegypti (Diptera:Culicidae) vector Supplementary material
The procedure of the RM technique is as follows: choose descriptors at
random and do a linear regression. Choose one of the descriptors of this set called Xi and
replaced it by each of the descriptors of the set (except itself), keeping the best resulting
set.21 Since one can start replacing any of the d descriptors in the initial model then a
regression equation with variables has possible paths to achieve the final result; one
example of the choice above will develop into path . Next choose the variable with the
greatest relative error in its coefficient (except the one replaced in the previous step) and
replace it with all the descriptors (except itself) keeping again the best set. Replace the
entire remaining variable having the greatest relative error in the coefficient and repeat the
whole process. The process will be repeated as many times as needed until the set of
descriptors remains unchanged. At the end, we have the best model for the path i. Proceed in
exactly the same way for all possible paths compare the resulting models and
keep the best one. Our numerical experiments show that in this way one obtains a model
almost as good as the best one with fewer linear regressions when this
combinatorial number is large.29
Dataset Partitioning
Several standard techniques for designing a rational partition of a data set are currently
available in the literature, namely the traditional procedures such as principal compounds
23
The Quantitative Structure – Insecticidal Activity Relationships from plant derived compounds against chikungunya and zika Aedes aegypti (Diptera:Culicidae) vector Supplementary material
analysis (PCA), discriminant analysis (DA), cluster analysis (CA), Kennard-Stone method and
D-optimal design, which offer different possibilities and objectives. The CA is proposed for
many different application fields and is divided into two methods: hierarchical and partition;
the latter consists of relocation cases by moving them for one cluster to another, starting from
an initial cluster, and requires that the cluster numbers shall be defined by the user. For
obtaining the global optimality of partition-base clustering many enumeration processes of all
possible partitions are needed; the most common algorithm uses a squared error criterion is
called k-means algorithm; this method for partitioning the data into k-clusters, where each
cluster is determined by its centroid or centre point (the centroid of each cluster is calculated as
the mean of all the instances belonging to that cluster). The initialization of the algorithm is
based on an initial set of cluster centroids chosen by a heuristic process, where each iteration
for each instance is assigned to its nearest cluster centroid depending on the Euclidean distance
between two of them, and then the cluster centroids are recalculated.31, 32
24
The Quantitative Structure – Insecticidal Activity Relationships from plant derived compounds against chikungunya and zika Aedes aegypti (Diptera:Culicidae) vector Supplementary material
The Balanced Subsets Method (BSM) procedure
The procedure applied to the median lethal concentration ( ) data set includes the
following steps:
A. Prepare a matrix (C) that includes the experimental property and the 4,885 molecular
descriptors selected. Now the size of C is .
B. Remove the linearly dependent variables from the previous matrix and now the new size
is .
C. Standardize C for centering and scaling its matrix elements. This is done for discerning
better the matrix elements.
D. Created clusters with the 62 compounds through the k-MCA method, for that the C
matrix is used together with the Euclidean metrics and 90 runs for the numerical
optimization algorithm of k-MCA in order to achieve the best solution. This computes
clusters centroid location, each centroid of size;
where is the number of compounds in the training set and is the number of
compounds that have minimum or maximum values of the experimental property .
25
The Quantitative Structure – Insecticidal Activity Relationships from plant derived compounds against chikungunya and zika Aedes aegypti (Diptera:Culicidae) vector Supplementary material
E. The training set is designed by including one compound per cluster, which is the
compound that is close to the centroid in each cluster. It also includes the
compounds.
F. The validation set is created by including one compound per cluster, which is the
compound that is nearer to the centroid in each cluster.
G. For finally, the test set includes the remaining the compounds.
26