Embed Size (px)
Citation preview
BAY AREA HMIS
Monterey, Napa, San Benito, Santa Clara, Santa Cruz Counties Revised March 2014
ART Recommended
Reports Catalog
Community Technology Alliance 1671 The Alameda • Suite 300
San José, CA 95126 Phone 408.437.8800 • Fax 408.437.9169
A R T R E C O M M E N D E D R E P O R T S C A T A L O G
M A R C H 2 0 1 4
1
About this Guide
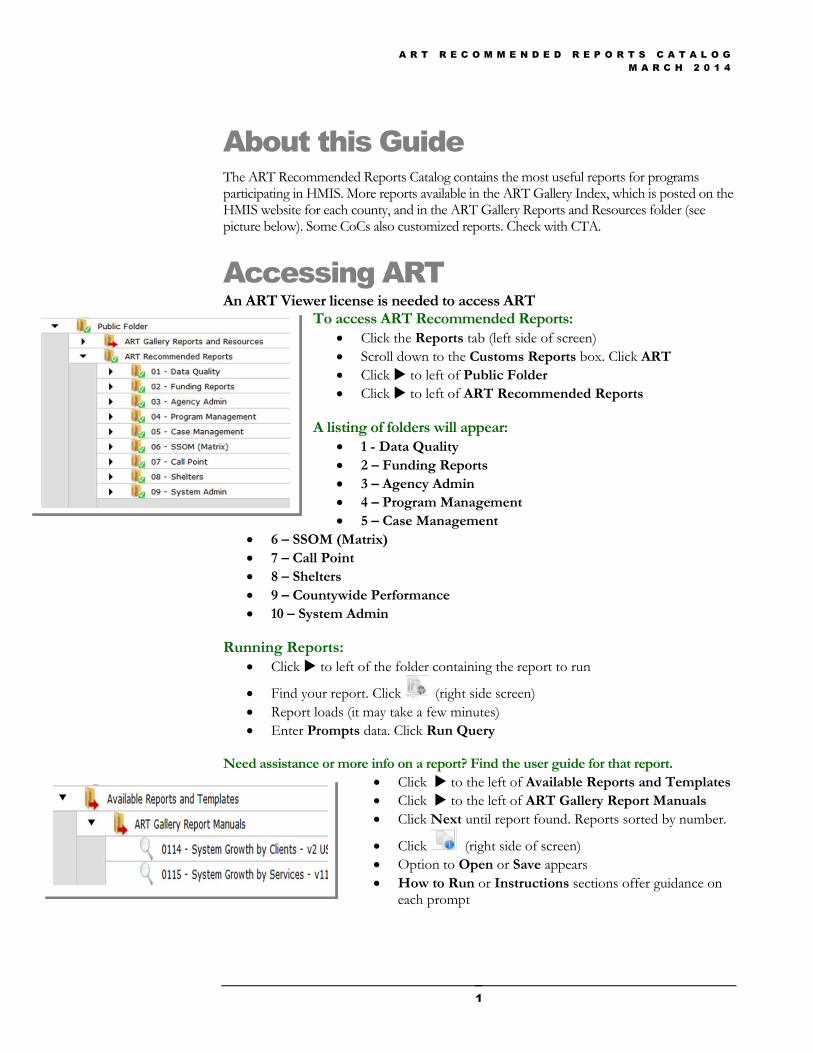
The ART Recommended Reports Catalog contains the most useful reports for programs participating in HMIS. More reports available in the ART Gallery Index, which is posted on the HMIS website for each county, and in the ART Gallery Reports and Resources folder (see picture below). Some CoCs also customized reports. Check with CTA.
Accessing ART
An ART Viewer license is needed to access ART To access ART Recommended Reports:
Click the Reports tab (left side of screen)
Scroll down to the Customs Reports box. Click ART
Click to left of Public Folder
Click to left of ART Recommended Reports
A listing of folders will appear:
1 - Data Quality
2 – Funding Reports
3 – Agency Admin
4 – Program Management
5 – Case Management
6 – SSOM (Matrix)
7 – Call Point
8 – Shelters
9 – Countywide Performance
10 – System Admin
Running Reports:
Click to left of the folder containing the report to run
Find your report. Click (right side screen)
Report loads (it may take a few minutes)
Enter Prompts data. Click Run Query
Need assistance or more info on a report? Find the user guide for that report.
Click to the left of Available Reports and Templates
Click to the left of ART Gallery Report Manuals
Click Next until report found. Reports sorted by number.
Click (right side of screen)
Option to Open or Save appears
How to Run or Instructions sections offer guidance on each prompt
A R T R E C O M M E N D E D R E P O R T S C A T A L O G
M A R C H 2 0 1 4
2
ART Gallery Reports
3 Data Quality
4 Funding Reports
7 Agency Admin
8 Program Management
10 Case Management
11 SSOM (Matrix)
12 Call Point
13 Shelters
14 System Admin
A R T R E C O M M E N D E D R E P O R T S C A T A L O G
M A R C H 2 0 1 4
3
Data Quality
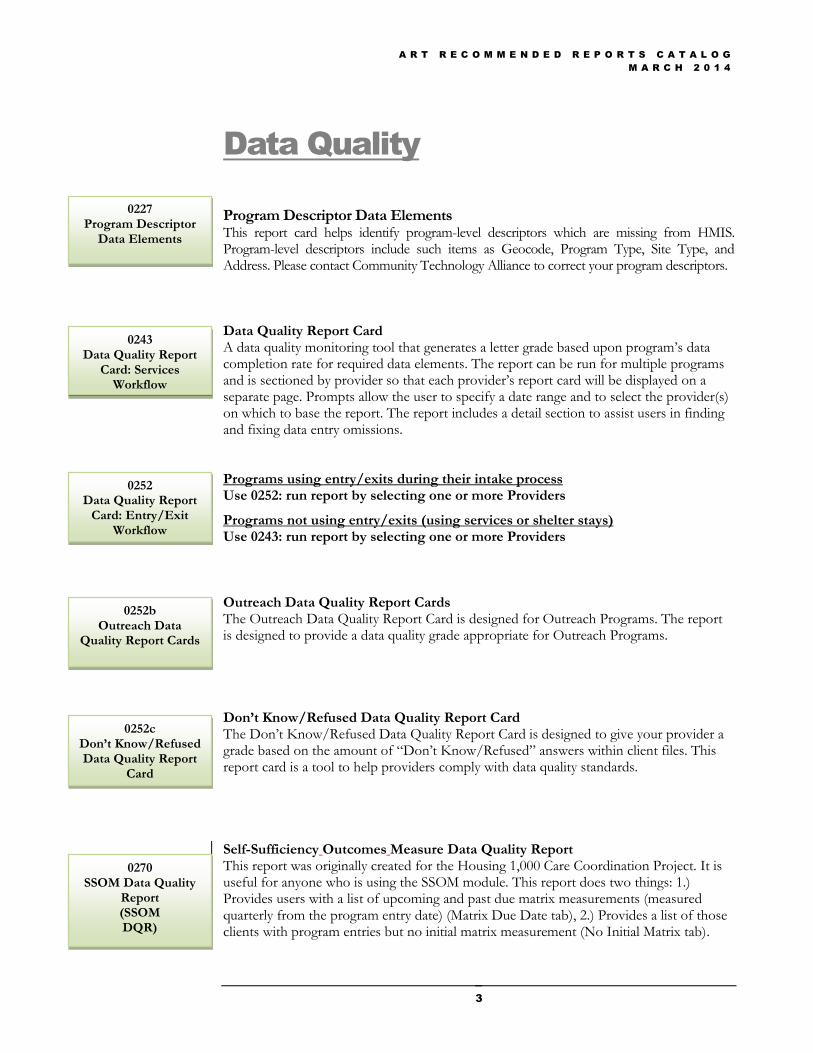
Program Descriptor Data Elements This report card helps identify program-level descriptors which are missing from HMIS. Program-level descriptors include such items as Geocode, Program Type, Site Type, and Address. Please contact Community Technology Alliance to correct your program descriptors.
Data Quality Report Card A data quality monitoring tool that generates a letter grade based upon program’s data completion rate for required data elements. The report can be run for multiple programs and is sectioned by provider so that each provider’s report card will be displayed on a separate page. Prompts allow the user to specify a date range and to select the provider(s) on which to base the report. The report includes a detail section to assist users in finding and fixing data entry omissions. Programs using entry/exits during their intake process Use 0252: run report by selecting one or more Providers Programs not using entry/exits (using services or shelter stays) Use 0243: run report by selecting one or more Providers Outreach Data Quality Report Cards The Outreach Data Quality Report Card is designed for Outreach Programs. The report is designed to provide a data quality grade appropriate for Outreach Programs. Don’t Know/Refused Data Quality Report Card The Don’t Know/Refused Data Quality Report Card is designed to give your provider a grade based on the amount of “Don’t Know/Refused” answers within client files. This report card is a tool to help providers comply with data quality standards. Self-Sufficiency Outcomes Measure Data Quality Report This report was originally created for the Housing 1,000 Care Coordination Project. It is useful for anyone who is using the SSOM module. This report does two things: 1.) Provides users with a list of upcoming and past due matrix measurements (measured quarterly from the program entry date) (Matrix Due Date tab), 2.) Provides a list of those clients with program entries but no initial matrix measurement (No Initial Matrix tab).
0252 Data Quality Report
Card: Entry/Exit Workflow
0243 Data Quality Report
Card: Services Workflow
0270 SSOM Data Quality
Report (SSOM DQR)
0252b Outreach Data
Quality Report Cards
0252c Don’t Know/Refused Data Quality Report
Card
0227 Program Descriptor
Data Elements
A R T R E C O M M E N D E D R E P O R T S C A T A L O G
M A R C H 2 0 1 4
4
Funding Reports
AHAR
Housing Inventory for NOFA Produces the HUD Housing Inventory Chart required for the annual NOFA application. The HIC is designed to accurately reflect each CoC’s capacity to house homeless and formerly homeless persons and provides an inventory of emergency shelter, transitional housing, and permanent supportive housing beds available in the CoC. The inventory should include all HUD-funded residential programs, as well as non-HUD funded programs that provide housing to homeless and formerly homeless persons. The report provides information on targeted populations that are served in the CoC, inventory types, and bed types.
CoC APR
HUD CoC APR Facilitates the extraction of data for the completion of the CoC APR. The layout of the report is patterned after the HDX data input screen to facilitate on-line reporting. A companion ART report, 0631, provides details to assist in addressing data quality issues. HUD CoC APR Detail A companion to report 0625 and displays details behind the CoC APR report. This report consists of several tabs, each tab focusing on specific portions of the CoC data. The report also includes features to assist in data quality monitoring such as null data flags, identification of non-HUD question values, and a duplicate clients. Report Covering HMIS APR Questions 10 and 11 This report has been created to facilitate the extraction of data for the completion of questions 10a-f and 11a-c of the HMIS APR. The layout of the report is patterned after the e-snaps data input screens to facilitate on-line reporting. The report is broken down by data elements that take into account year round beds and units for clients with and without children as well as the number of persons and households in residential programs. Question 11 of the report (Tab B) gives a depiction of data quality relating to client demographic information. HMIS APR Questions H2 and H3 This report has been created to facilitate the extraction of data for the completion of question H2d of the HMIS APR. The layout of the report is patterned after the e-snaps data input screens to facilitate on-line reporting. Question H2 within this report relates directly to the scope of HMIS implementation within the CoC as well as entire HMIS implementation. The report also generates detailed information relating to client detail, provider detail, and user detail.
0625 HUD CoC APR
0631 HUD CoC APR
Detail
0629 Housing Inventory
Report
0632 HMIS APR
Questions 10 and 11
0633 HMIS APR
Questions H2 and H3
A R T R E C O M M E N D E D R E P O R T S C A T A L O G
M A R C H 2 0 1 4
5
HIC/PIT
Housing Inventory for NOFA This report produces the Housing Inventory Chart required for the annual NOFA application. The HIC is designed to accurately reflect the CoC’s capacity to house homeless and formerly homeless persons. The report further provides an inventory of emergency shelter, transitional housing, and permanent supportive housing beds available in the CoC. The inventory should include all HUD-funded residential programs, as well as non-HUD funded programs that provide housing to homeless and formerly homeless persons. The report provides information on targeted populations that are served in the CoC, inventory types, and bed types. Further details are provided on individual programs throughout the CoC with a description of program type and demographics. Sheltered/Unsheltered PIT Provide the client and household data needed to complete the sheltered portion of the “Homeless Populations” tab and the “Homeless Subpopulation” tab in the 2013 Annual Point-In-Time module of the HUD HDX. This information relates to clients being served in an Emergency Shelter, Transitional Housing, or Safe Haven Program at the time or the annual homeless count. This report also provides the client and household level detail to assist in documentation and data quality processes. The report can be easily modified to consider entry exits only. This report is also targeted towards different age groups, broken down by children, adults, and other targeted populations. HIC Bed Inventory Report Extracts the bed inventory data and prepares it for entry into the eHIC chart on the HUD’s HDX website. This is a point-in-time report that takes a snapshot of the bed inventory connected with the January 2010 Homeless PIT count. It is essentially designed for one time use, and a new version of this report will be produced annually. The report is broken down by ES, TH, and PSH program types in the CoC.
HOPWA
HOPWA CAPER
Facilitates the extraction of data for the completion of the HOPWA CAPER. (Housing Opportunities for Persons with AIDS Consolidated Annual Performance and Evaluation Report). It will also assist with monitoring of data quality related to the HOPWA CAPER. HOPWA APR This ART Gallery report has been created to facilitate the extraction of data from ServicePoint for the completion of the HOPWA APR (Housing Opportunities for Persons with AIDS Consolidated Annual Performance and Evaluation Report). It will also assist with monitoring of data quality related to the HOPWA APR. Report details include the total number of HOPWA Eligible individuals served with housing assistance broken down by a variety of demographic variables. Further details are provided on Supportive Services and Housing subsidy assistance towards various housing facilities.
0630 Shelter/Unsheltered
PIT
HIC Bed Inventory Report
0603 HOPWA CAPER
0604 HOPWA APR
0629 Housing Inventory
Report

A R T R E C O M M E N D E D R E P O R T S C A T A L O G
M A R C H 2 0 1 4
6
Other Funding Reports
City Services Report This report includes: the number of clients served, ethnicity of clients served, HUD income level, family characteristics, disabilities, and housing type for all clients in a specified program during the report period. It also lists the names and HMIS user ID's for all clients in the report. This report includes a prompt for client LP zip code(s). City Services (with Zip of 1st contact prompt) Same as above except: includes optional prompt for Zip code of first contact. CSD 295 Report This report is designed to help agencies complete the CDBG 295 Report. It fulfills the 295 Report's data requirements for individuals and families. Data reported includes: client age, ethnicity, race, disability, housing status, family composition, income level, and income type. It also lists the names and HMIS user ID's for all clients in the report. United Way (with LP zip code prompt) This report includes information pertaining to: client age, gender, disability, race, ethnicity, location of residence (by region, city, and zip code), individual income level, and household income level. This report includes a prompt for client zip codes. It also lists the names and HMIS Client ID numbers for all clients in the report. United Way (with Zip code of 1st contact prompt) Same as above except: optional prompt for Zip code of first contact. Report Covering NOFA CoC Application Section 2D The 0635.00 report is designed for use to complete two of the Sections in Q2D of the CoC Consolidated Application. The first section is Length of Housing for Emergency Shelter, Safe Haven and Transitional Housing during a user specified date range. The second section reports Missing, Don’t Know and Refused percentages on a single day in the last 10 days of January. *Please note: Reports are periodically added to this folder as they become available. If you see any reports not listed in this catalog, please contact Community Technology Alliance for a full description of the report.
City Services
CSD 295
United Way
0635 NOFA CoC
Application Section 2D
A R T R E C O M M E N D E D R E P O R T S C A T A L O G
M A R C H 2 0 1 4
7
Agency Admin
ServicePoint User Last Login Report This report has been created to show ServicePoint users’ last login dates to aid Agency Administrators in license management. Program Descriptor Elements Data Quality This report is designed to monitor data quality by locating HUD required program descriptor data which is missing. Specifically, this report extracts information needed to complete section H11c of the 2010 HMIS Dedicated Project Annual Progress Report funded under the Supportive Housing Program (SHP ).
123 - ServicePoint User Last Login
Report
227 - Program Descriptor Elements
Data Quality

A R T R E C O M M E N D E D R E P O R T S C A T A L O G
M A R C H 2 0 1 4
8
Program Management
Period End Enrollment Monitors program enrollment occurring over a specified period of time by reporting the total enrollments at the end of annual, quarterly and monthly time frames. The report contains three tabs and a reference appendix. Tabs A, B and C report on enrollment by year, by calendar quarter and by month. Users can easily control the amount of data shown and the corresponding look of the charts by varying their responses to the user prompts.
Program Demographics This report provides a breakdown of client demographics and other data for clients who were actively enrolled in a specified program (or programs) during a specified period of time based upon their entry and exits dates and/or shelter-stays. Prevention Outcomes This report identifies, tracks, and analyzes prevention outcomes. The report identifies clients who have exited a prevention program/received prevention services and have subsequently entered emergency shelter. The report compares the demographics and services of those entering shelter and those remaining housed. The report also analyzes the length of time between prevention intervention and shelter entry Exit Destination Outcomes In addition to basic exit and outcome information, the report groups positive and negative exits by different variables such as household status and the number of services received during the program. As a result, you can see how those variables are associated with positive and negative destinations after program exit. Exit Reason for Leaving Outcomes In addition to basic exit and outcome information, the report groups positive and negative exits by different variables such as household status and the number of services received during the program. As a result, you can see how those variables are associated with the positive and negative reasons for leaving the programs. Goal Outcomes The purpose of the report is to look at goal outcomes by goal types. Goal outcomes are also grouped by demographic and service-related variables so you can see what other factors might be affecting goal outcomes. Income Maintenance Want to know how clients' incomes are affected during your program? This report series demonstrates income outcomes during a program. Outcome is defined as whether a client has maintained or improved their income during their stay. No change or any increase in income during a stay are counted as positive.
0323 Program
Demographics
0521 Prevention Outcomes
0550 Exit Destination
Outcomes
0551 Exit Reason for
Leaving Outcomes
0552 Goal Outcomes
0554.00 Income Maintenance
0120 - Period End Enrollment

A R T R E C O M M E N D E D R E P O R T S C A T A L O G
M A R C H 2 0 1 4
9
Income Improvement This report defines the outcome more rigorously as whether a client has improved their income during their stay. Any instances of an increase in income during a stay are counted positively. Instances in which there is no change in client income are counted negatively, since income is not improving. IDIS CAPER for Multiple Funding Streams This report extracts data needed to complete the CAPER which is required by IDIS. This report can be utilized for multiple funding streams including but not limited to ESG, CDBG, and HOPWA. The report includes a client detail tab, a household detail tab and a data quality tab which are designed to assist users with data cleaning and verification. Countywide Performance Measures This report is designed to provide county-wide performance information to HMIS administrators. The report contains performance measures related to: client housing destination by program type, income change, average nightly bed occupancy, and reason for program exit. A listing of programs in the county is also provided.
0554.01 Income
Improvement
0607 IDIS CAPER for Multiple Funding
Streams
Countywide Performance
Measures
A R T R E C O M M E N D E D R E P O R T S C A T A L O G
M A R C H 2 0 1 4
10
Case Management
Client Case Plans Prints client’s case plan including goals, action steps, case notes, referrals and services. This report is designed to allow users to view multiple clients and their respective case plans at once. The Case Plan document displays goals, action steps, and case notes with full details as well as a history of the client’s program enrollment, caseworkers, and infractions. The Case Plan document is designed to allow batch printing with each client’s plan beginning on a new page. Drill filters allow the user to limit the report to a single client or to the clients of a specific caseworker. Additional Tabs include a case note-only display, a goal analysis tab and case plan statistics. Client Living Situation History Presents a chronological history of the changes in a client's living situation. The information is based on a combination of four data sources which include residential program enrollments, residential shelter stay events, prior living situation recorded at program entry and destinations recorded at program exits.
Client Event History Presents a chronological history of a client’s program-related events. The report includes a summary of listing of events by client, and a second tab which displays the information connected with each event. This report can also be used to trouble shoot reporting problems with a client. Event types contained in the report include: program entries and exits, needs, services, referrals, goals, action steps, case notes, household membership transactions, release of information transactions, quick call records, incidents, case management assignments, disability starts and ends, income starts and ends, non-cash benefits starts and ends, and work history information.
0404 Client Case Plans
0408 Client Living
Situation History
0409 Client Event History
A R T R E C O M M E N D E D R E P O R T S C A T A L O G
M A R C H 2 0 1 4
11
SSOM (Matrix)
Client Achievement Report Compares the initial and the final Self Sufficiency Outcome rating for each of the clients in a selected program. Initial/Final comparisons with calculated gains/losses are reported for each domain where at least one value has been recorded, as well as an average score for all domains. To be included in this report the client must have an initial SSOM assessment and a final SSOM assessment by the specified provider and on or after the report's specified start date. Client Progress Report Compares the initial (first) and the most recent (last) Self Sufficiency Outcome rating for each of the clients in a selected program. First/last comparisons with calculated gains/losses are reported for each domain where values have been recorded, as well as an average score for all domains. This summary report displays the results both graphically and in table format. To be included in this report the client must have at least an initial SSOM assessment and one additional assessment of any type by the specified provider, at least one of which must be in the specified date range. SSOM Domains at Population Entry Allows programs to address the relevant matrix domains where the need is greatest. The report depicts the distribution of client entry values in each domain through numeric, graphic, and statistical representation. The report also provides data completeness information so that a program is able to remedy missing data. SSOM Domains at Population Exit Allows programs to see where clients lie on the domains upon exit from the program. The purpose of the report is to depict the distribution of client exit values in each domain through numeric, graphic, and statistical representation. The report also provides data completeness information so that a program is able to remedy missing data.
SSOM - All Points of Measurement for a Program
Allows programs to see points of measurement entered for each client in a program. The client name, client ID, type of measurement point and date of measurement point are all provided.
SSOM Client & Program Achievement Report
Compares the initial and the final Self Sufficiency Outcome rating for each of the clients in a selected program. Initial/Final comparisons with calculated gains/losses are reported for each domain where at least one value has been recorded, as well as an average score for all domains. Both the client report and the program report display the results both graphically and in table format. To be included in this report the client must have an initial SSOM assessment and a final SSOM assessment by the specified provider and on or after the reports specified start date.
0405 Client Achievement
0407 Client Progress
508 SSOM Domains at Population Entry
509 SSOM Domains at
Population Exit
SSOM Client & Program
Achievement Report
SSOM - All Points of Measurement for a
Program
A R T R E C O M M E N D E D R E P O R T S C A T A L O G
M A R C H 2 0 1 4
12
Call Point
Call Volume This report is designed to monitor call volume by reporting on the number of new calls added to the system. The report contains three tabs. The tabs reports report call volume of a yearly, quarterly and monthly basis. Each report includes two bar charts, one showing the total calls to-date and the other representing call volumes during each reporting period. The report’s default settings include all calls for all providers, however by utilizing drill filters, or by adding query filters, users can easily limit the results to the clients added by a specific provider or by a specific user, per instructions included in the documentation. Call Frequency and Distribution This report is designed to assist in evaluating call frequency and distribution. Statistics and graphical displays include call volumes by date, by day of the week, by hour of the day and by day of the month. Drill filters allow the user to focus analysis on individual providers, users, call type or type of caller.
1102 Call Volume
1301 Call Frequency and
Distribution
A R T R E C O M M E N D E D R E P O R T S C A T A L O G
M A R C H 2 0 1 4
13
Shelters
Shelter – History, Overlap and Return Displays a client’s Service and/or Entry Exit history with alerts to notify the user when the client has multiple stays in the same time period at different providers. The report can also be used to determine the number of clients that return to the shelter within a certain time period in order to calculate the percentage of repeat clients within that time. 0315 Program Daily Census Designed to provide up to a 31 day daily program census. The daily census is based on client entries and exits, and includes individual counts, household counts, percent of capacity and breakdowns by gender, age, race, ethnicity and prior living situation. The report includes the client detail related to each breakdown, and combined counts for the entire reporting period. Shelter Recidivism Details the extent of shelter recidivism after a program is designed to prevent it. Depending on how the program works, you can examine the extent of shelter recidivism after entry into a program or the extent of shelter recidivism after exiting the program. You can also examine recidivism after either entry or exit simultaneously Current Bed Inventory This report extracts the current bed inventory according the inventory start and end dates and the report date supplied by the user. Unlike 0616, this is a dynamic report that can be used to track inventory on an on-going basis providing the data is updated in ServicePoint. This report does not classify Inventory Type (C/N/U) since it is a fixed/non- dynamic classification.
0254 Shelter – History,
Overlap and Return
0315 Program Daily
Census
Current Bed Inventory
0555 Shelter Recidivism
A R T R E C O M M E N D E D R E P O R T S C A T A L O G
M A R C H 2 0 1 4
14
System Admin
Users by Provider Lists users by name/email address, and by Provider. Users are further broken down by HMIS access level and by licensing provider. A numeric Service Point User Count and ART User Count is generated through this report as well. ART License Management Report The report breaks down the implementation’s ART licenses by type, allocation status, provider, and assignment status. The report also includes a detailed listing by provider/type which includes user name, license number and date of assignment. Provider Assessment Administration This report has been created to show current Assessments Administration Settings for all assessments listed on a provider’s ServicePoint Admin Providers page. Assessment Administration Settings that can be compared across multiple providers included: “Visible,” “Default,” “Show on Profile,” “Show on Entry,” and “Show on Exit”. UDE Completeness with EE Workflows Designed to assist administrators in monitoring data quality and identifying clients with null values in one or more of the eleven assessment based Universal Data Elements (UDEs) required by HUD for programs which serve homeless individuals. The report provides the percentages of null responses and the percentages of refused/unknown responses for each of the UDEs. Program Descriptor Elements by Provider Group This report locates HUD required program descriptor data which is missing. Reportable data elements include Program Name, Site Configuration Type, Site Address, Geocode, Site Type, Housing Type, CoC Number, Program Type Code, bed and Utility Inventory Information, and Target Population which are further summarized by program. This helps w/ Supportive Housing Program (SHP). A separate Detail by Program Tab breaks the completed and null values for each data element by individual programs. Report Covering NOFA CoC Application Section 2D The 0635.00 report is designed for use to complete two of the Sections in Q2D of the CoC Consolidated Application. The first section is Length of Housing for Emergency Shelter, Safe Haven and Transitional Housing during a user specified date range. The second section reports Missing, Don’t Know and Refused percentages on a single day in the last 10 days of January.
0121 Users by Provider
Report
0122 Art License
Management Report
0126 ServicePoint Provider
Assessment Admin Report
0213 UDE Completeness-
EE Workflows- Program Type Codes
0227 Program Descriptor
Elements by Provider Group Mapped
0635 NOFA CoC
Application Section 2D
A R T R E C O M M E N D E D R E P O R T S C A T A L O G
M A R C H 2 0 1 4
15
Count of Homeless Clients Added by CoC This report is used for the CoC APR submission. The report provides a count of clients whose records were created by a provider in a particular CoC by the effective date of the report, and who are homeless as of that date.The report also provides a list and a count of clients whose records were created by a provider in a particular CoC within the report period, and who are homeless as of their first event recorded in the report period. HMIS Participation by Program Type This report is used for the Coc APR submission. Report is divided by program type code and CoC's. Service only providers do not have "outreach programs" listed in this report. Details for each CoC include HMIS Participation by Program Type and information is given about a program’s service point user status.
Count of Homeless Clients Added by
CoC
HMIS Participation by Program Type